Alzheimer’s disease (AD) is the most common form of dementia, characterized by two pathological hallmarks: β-amyloid plaques and neurofibrillary tangles1. The amyloid hypothesis of AD posits that excessive accumulation of β-amyloid peptide (Aβ) leads to neurofibrillary tangles composed of aggregated hyperphosphorylated tau2,3. However, to date, no single disease model has serially linked these two pathological events using human neuronal cells. AD mouse models with familial AD (FAD) mutations exhibit Aβ-induced synaptic and memory deficits but they do not fully recapitulate other key pathological events of AD including clear neurofibrillary tangle pathology4,5. AD patient-derived human neurons have shown elevated levels of toxic Aβ species and phospho-tau (p-tau) but they also could not replicate β-amyloid plaques or neurofibrillary tangles6–11. Here we report that FAD mutations in the amyloid-β precursor protein (APP) and presenilin (PS) 1 genes are able to induce robust extracellular deposition of Aβ, including β-amyloid plaques, in a human neural stem cell-derived three-dimensional (3D) culture system. More importantly, the 3D-differentiated neuronal cells expressing FAD mutations exhibited high levels of detergent-resistant, silver-positive aggregates of p-tau in the soma and neurites, as well as filamentous tau as detected by immunoelectron microscopy. Inhibition of Aβ generation with β- or γ-secretase inhibitors not only decreased Aβ pathology, but also attenuated tauopathy. We also found that glycogen synthase kinase 3 (GSK3) regulated Aβ-mediated tau phosphorylation. In summary, we have successfully recapitulated Aβ and tau pathology in a single 3D human neural cell culture system for the first time. Our unique strategy for recapitulating AD pathology in a 3D neural cell culture model should also serve to facilitate the development of more precise human neural cell models of other neurodegenerative disorders.
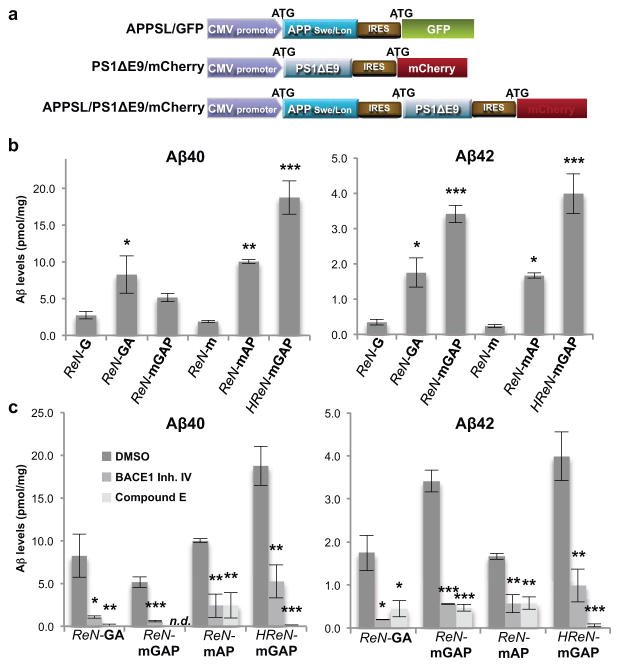
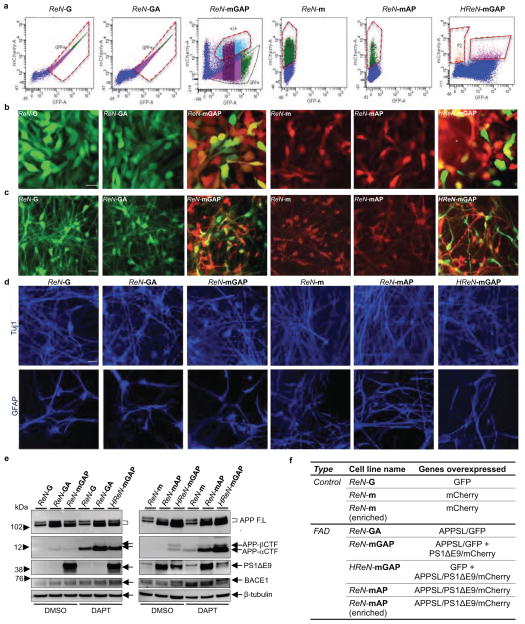
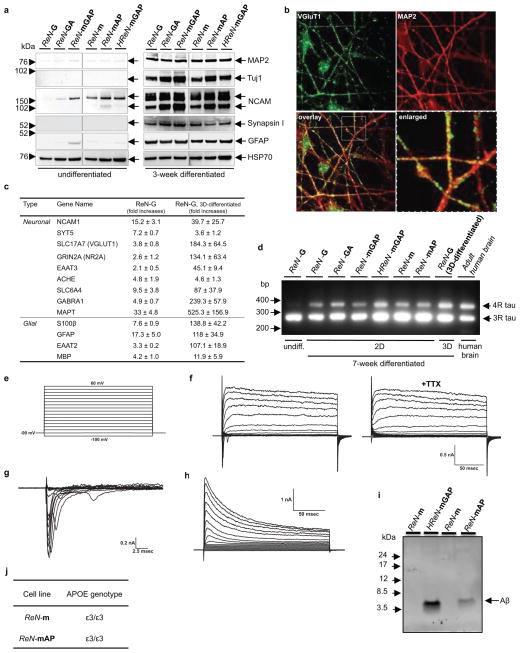
To develop human neural progenitor cells (hNPCs) that produce high levels of toxic Aβ species, we over-expressed human APP or APP and PS1, harboring FAD mutations. We first generated polycistronic lentiviral constructs designed to express human APP with both K670N/M671L (Swedish) and V717I (London) FAD mutations (APPSL) and/or PS1 with ΔE9 FAD mutation (PS1ΔE9) (Fig. 1a). These FAD lentiviral constructs were transfected into ReNcell VM human neural stem (ReN) cells (Millipore). The transfected cells with GFP (ReN-G), mCherry (ReN-m), APPSL/GFP (ReN-GA), APPSL/GFP/PS1ΔE9/mCherry (ReN-mGAP), APPSL/PS1ΔE9/mCherry (ReN-mAP), or GFP/APPSL/PS1ΔE9/mCherry (HReN-mGAP) were enriched based on GFP and/or mCherry signals using FACS (Extended Data Fig. 1a–c and 1f). Western blot analysis (WB) revealed high expression of PS1ΔE9, APP and APP C-terminal fragments in ReN cells with FAD mutations (FAD ReN cells, Extended Data Fig. 1e). As previously reported12–14, most ReN cells differentiated into neuronal and glial cells within 3 weeks (Extended Data Fig. 1d and 2a). Immunofluorescence staining (IF) confirmed punctate localization of VGluT1, a presynaptic marker along with dendritic processes (Extended Data Fig. 2b). qPCR array analysis showed robust increases of neuronal and glial marker genes (Extended Data Fig. 2c). RT-PCR analysis also showed a dramatic increase of 4-repeat (4R) adult tau isoforms following differentiation (Extended Data Fig. 2d). The differentiated ReN cells exhibit voltage-gated potassium and sodium currents, after 29 days of differentiation (Extended Data Fig. 2e–h), as previously reported12,13.
Figure 1. Generation of hNPCs with multiple FAD mutations.
a. Diagrams showing lentiviral IRES constructs. APPSL, APP with Swedish/London mutations; PS1ΔE9, PS1 with ΔE9 mutation; GFP, eGFP. b. Increased Aβ40 and 42 levels in 6-week differentiated FAD ReN cells. Aβ levels in conditioned media were normalized to total protein levels (*, p<0.05; **, p<0.01; ***, p<0.001; ANOVA followed by a post-hoc Dunnett test; n=3 per each sample). c. Aβ levels are dramatically decreased in FAD ReN cells after treatment with 1 μM BACE1 inhibitor IV or 3.7 nM Compound E (mean ± s.e.m; *, p<0.05; **, p<0.01; ***, p<0.001; ANOVA followed by a post-hoc Dunnett test; n=3 per each sample; n.d. not detected).
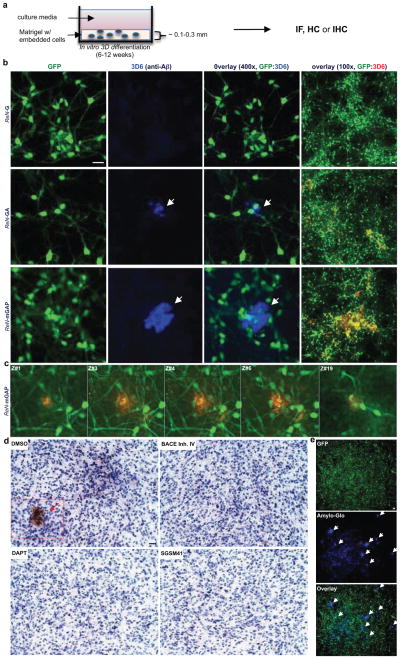
Figure 2. Robust increases of extracellular Aβ deposits in 3D-differentiated hNPCs with FAD mutations.
a. Thin layer 3D culture protocols (IF, immunofluorescence; HC, histochemical; IHC, immunohistochemical staining). b. Aβ deposits in 6-week differentiated control and FAD ReN cells in 3D Matrigel (green, GFP; blue, 3D6; scale bar, 25 μm; arrowheads, extracellular Aβ deposits; right-most panels, 3D6 staining was pseudo-colored to red). c. Select confocal z-stack images of 3D6-positive Aβ deposits. Z-sections with an interval of 2 μm were captured and the sections #1,3–4, #6 and #19 are shown (green, GFP; red, 3D6). d. IHC of Aβ deposits in ReN-mGAP cells. 3D-differentiated cells were treated with 1 μM BACE inhibitor IV, 500 nM DAPT, 500 nM SGSM41 or DMSO (brown, DAB (BA27); blue, hematoxylin; scale bar, 25 μm; arrowheads, large Aβ deposits). e. Detection of amyloid plaques with Amylo-Glo, a fluorescent amyloid-specific dye (Green, GFP; blue, Amylo-Glo; arrows, Amylo-Glo positive aggregates).
Aβ40 and 42 levels were measured in conditioned media after 6-week differentiation. FAD ReN cells revealed dramatic increases in Aβ40 (~9 fold) and Aβ42 (~17 fold) levels as compared to the control ReN cells (Fig. 1b and Extended Data Fig. 2i). The Aβ42/40 ratio (~5 fold) was also increased in ReN cells expressing PS1ΔE9 (Fig. 1b). β- or -secretase inhibitor treatments dramatically decreased Aβ levels (Fig. 1c) with no appreciable toxicity (data not shown). We confirmed that ReN cells carry the APOE ε3/ε3 genotype, not the AD-associated ε4 allele (Extended Data Fig. 2j).
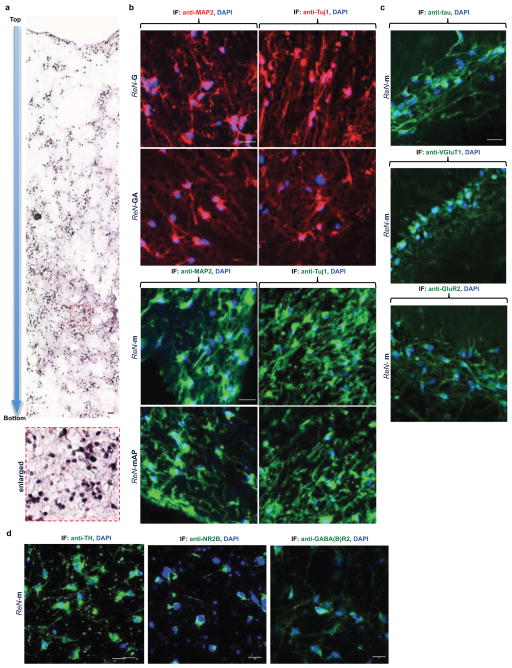
In conventional 2D cultures, secreted Aβ diffuses into a large volume of media. We hypothesized that 3D culture would accelerate Aβ deposition by limiting diffusion of Aβ, allowing for aggregation15–17. We chose BD Matrigel (BD Biosciences) as a 3D support matrix since it contains high levels of brain extracellular matrix proteins. For IF and biochemical analyses, we set up thin (~100–300 μm) and thick layer (~4 mm) 3D culture models (Fig. 2a and 3a). 3D-differentiated ReN cells displayed extensive processes after 2–6 week differentiation (Supplementary Videos 1–3). To demonstrate ReN cell differentiation in thick-layer 3D cultures, paraffin-sectioned thick layer 3D cultures were analyzed by IF with various neuronal markers (Extended Data Fig. 3). qPCR array data indicated that 3D cultures promote more neuronal and glial differentiation than 2D cultures (Extended Data Fig. 2c). We also observed a dramatic increase in the levels of 4R adult tau isoforms in 3D cultures versus 2D (Extended Data Fig. 2d). These data demonstrate that 3D culture conditions not only promote neuronal maturation, but also increase adult tau isoform levels, which are essential for reconstituting tauopathy18.
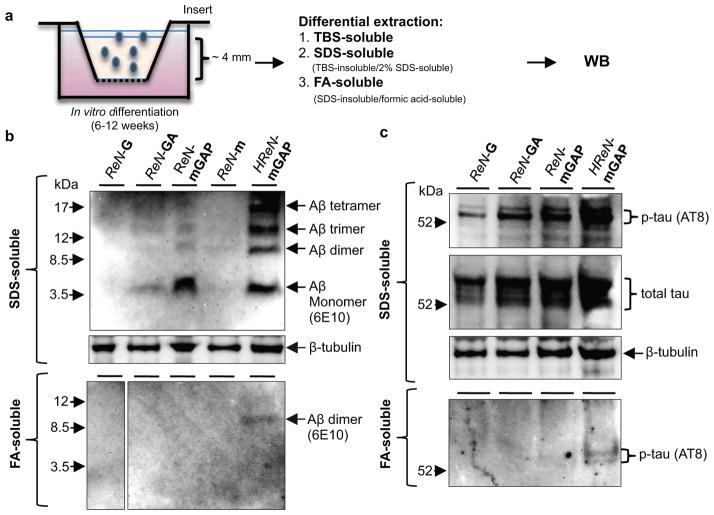
Figure 3. Elevation of Aβ and p-tau levels in TBS-insoluble fractions of 3D-differentiated FAD hNPCs.
a. A diagram showing a thick-layer 3D culture and detergent extraction protocols. b. WB of Aβ aggregates in 3D-differentiated ReN cells. 6E10 antibody detected Aβ monomers, dimers, trimers and tetramers in SDS-soluble (upper panel) and formic acid-soluble fractions (lower panel) from the control (ReN-G and -m) and the FAD ReN cells (ReN-GA, ReN-mGAP and HReN-mGAP) after 6-week differentiation. c. WB of total and p-tau levels in SDS-soluble and formic acid-soluble fractions.
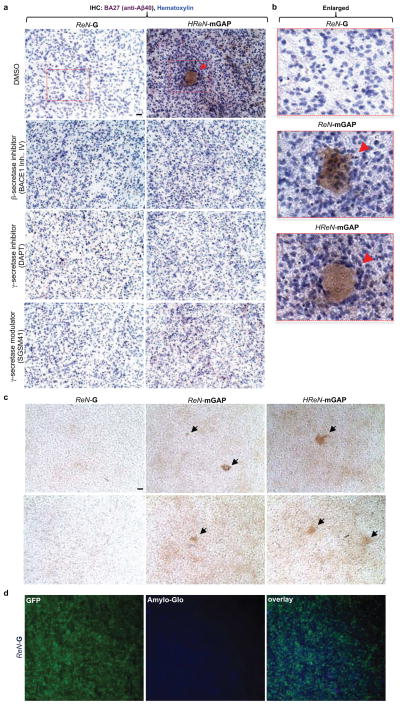
To detect Aβ deposits, 3D-differentiated ReN cells were stained with 3D6 anti-Aβ antibody (Fig. 2b). Remarkably, confocal microscopy showed robust increases in extracellular Aβ deposits in FAD ReN cells (Fig. 2b). Confocal Z-sectioning exhibited 3D extracellular Aβ aggregates with 10–50 μm diameter (Fig. 2c, Supplementary Video 4). IHC with BA27 anti-Aβ40 antibody reconfirmed robust increases in Aβ aggregates and diffuse Aβ staining in FAD ReN cells (Fig. 2d and Extended Data Fig. 4a–c). β- or -secretase inhibitor treatments dramatically decreased Aβ deposits (Fig. 2d and Extended Data Fig. 4a). Accumulation of insoluble Aβ aggregates was also confirmed by Amylo-Glo (Biosensis; Fig. 2e and Extended Data Fig. 4d) and Congo red staining (Data not shown). Treatments with the -secretase modulator, SGSM4119 (Extended Data Table 1), dramatically decreased the number of dense Aβ aggregates in 3D-differentiated FAD ReN cells, possibly by selectively decreasing the aggregation-prone Aβ42 species (Fig. 2d and Extended Data Fig. 4a). For biochemical analysis, 3D-differentiated ReN cells were homogenized in TBS and underwent a serial extraction protocol with 2% SDS and formic acid (Fig. 3a–c). WB analysis with anti-Aβ antibody, 6E10, revealed increased Aβ levels in SDS-soluble fractions of FAD ReN cells (Fig. 3b). In addition to a ~4 kDa Aβ monomer band, we observed Aβ dimer, trimer and tetramer bands in FAD ReN cells with high Aβ42 levels (Fig. 3b). Aβ dimers were detected in formic acid-soluble fractions, especially in HReN-mGAP cells, which generated the highest levels of Aβ40 and Aβ42 (Fig. 3b).
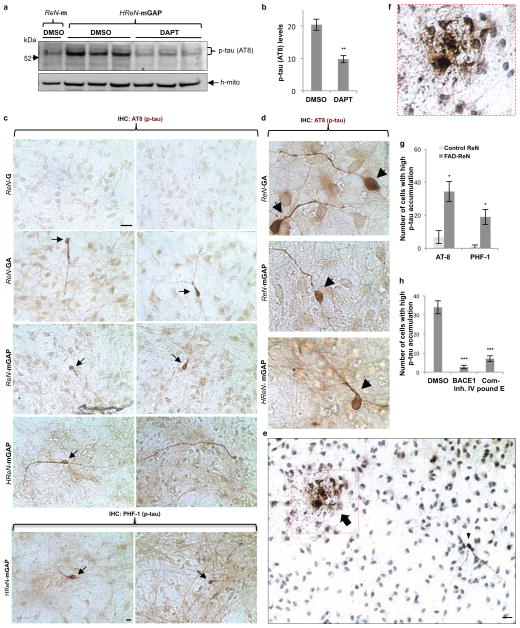
In AD, tau protein is hyperphosphorylated and abnormally accumulates in axons, dendrites and cell bodies20. To analyze p-tau levels in FAD ReN cells, we performed WB analysis with antibodies against total tau and p-tau (pSer199/Ser202/Thr205, AT8), and showed that p-tau levels were strongly increased in SDS-soluble fractions (Fig. 3c). p-Tau species were also detected in formic acid-soluble fractions in HReN-mGAP cells, which showed the highest accumulation of insoluble Aβ (Fig. 3b–c). Moderate increases of total tau levels were detected in FAD ReN cells, particularly in HReN-mGAP cells (Fig. 3c), which might be explained by robust increases in aggregated tau fractions. Interestingly, the -secretase inhibitor, DAPT, not only blocked Aβ generation but also inhibited p-tau levels in HReN-mGAP cells (Extended Data Fig. 5a–b). To further explore p-tau accumulation at the cellular level, we performed IHC staining with two different p-tau antibodies, AT8 and PHF1 (pSer396/Ser404). We found dramatic increases of p-tau levels in a small portion of FAD ReN cells (Extended Data Fig. 5c–g). These high p-tau cells displayed unusual morphologies, including beaded processes that are similar to the dystrophic neurites found in AD brains (Extended Data Fig. 5c–e). Additionally, areas with highly dense p-tau positive processes could only be detected in FAD ReN cells (Extended Data Fig. 5e–f). Treatment with either β- or γ-secretase inhibitors decreased p-tau cell numbers in FAD ReN-mAP cells (Extended Data Fig. 5h). These data strongly suggest that p-tau accumulations in FAD ReN cells are induced by Aβ accumulation.
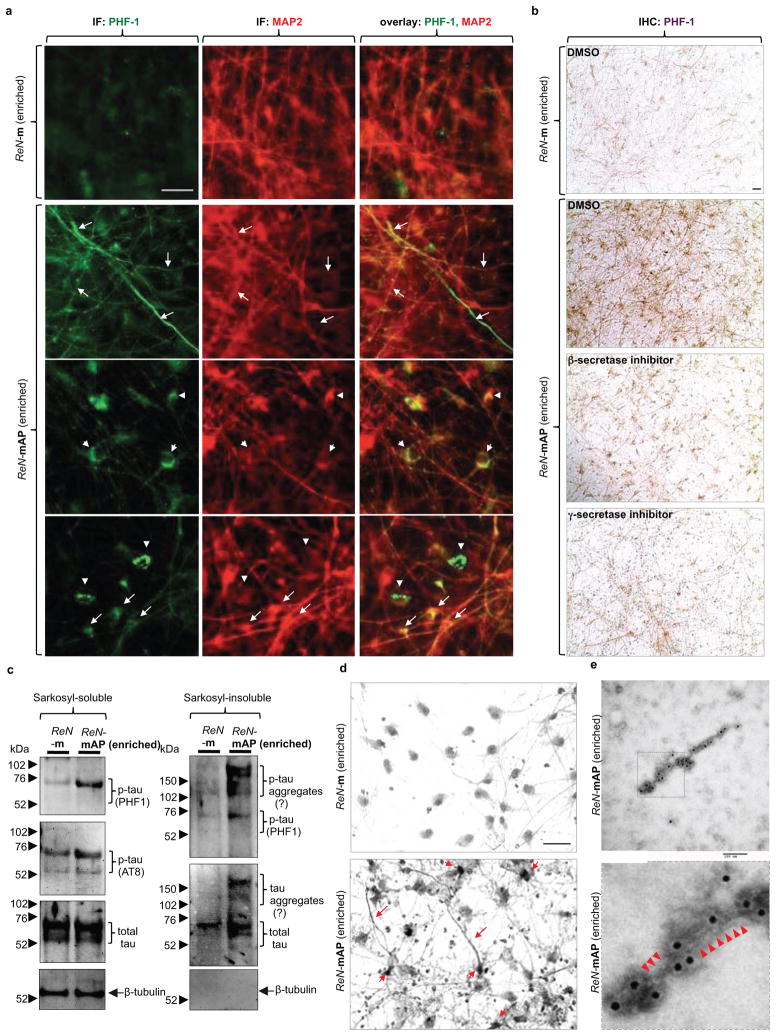
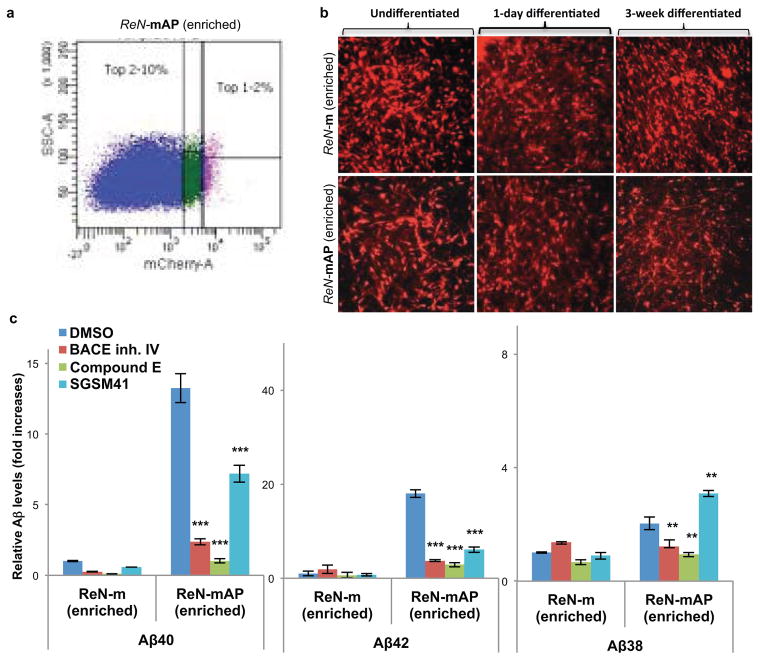
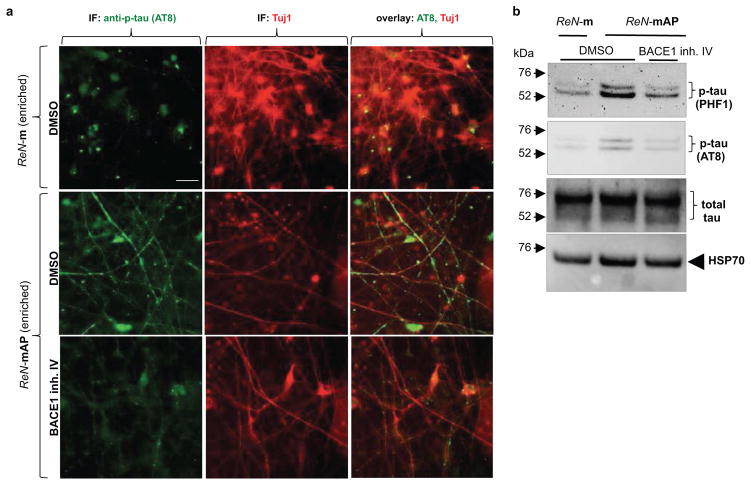
To enhance β-amyloid and p-tau pathologies, ReN-mAP cells with the top 1–2% and 2–10% mCherry signals were enriched by FACS (Extended Data Fig. 6a–b). β- or γ-secretase inhibitors decreased Aβ40 and 42 levels in these cells while the γ-secretase modulator, SGSM41, preferentially decreased toxic Aβ42 levels and increased Aβ38 levels (Extended Data Fig. 6c)19. PHF1 p-tau levels were also dramatically elevated in the enriched ReN-mAP cells (Fig. 4a–b). PHF1/MAP2 and AT8/Tuj1 co-IF analysis showed that p-tau levels were largely increased in neurites and neuronal cell bodies (Fig. 4a and Extended Data Fig. 7a). IHC analysis confirmed the dramatic increases in PHF p-tau levels in the enriched ReN-mAP cells (Fig. 4b). Interestingly, treatment with a β- or -secretase inhibitor reduced the elevated p-tau levels, especially in neurite-like structures (Fig. 4b). WB analysis also showed that p-tau levels were robustly increased in the enriched ReN-mAP cells while total tau levels were unchanged (Extended Data Fig. 7b). A β-secretase inhibitor again decreased p-tau levels without affecting total tau levels (Extended Data Fig. 7b).
Figure 4. Detection of aggregated p-tau in the enriched ReN-mAP cells.
a. IF of p-tau and MAP2 in the enriched ReN-mAP and ReN-m cells after 3D differentiation (green, p-tau (PHF1); red (pseudo-colored), MAP2; scale bar, 25 μm; arrows, p-tau positive neurites; arrowheads, p-tau positive cell bodies). b. IHC of p-tau in the enriched ReN-mAP and ReN-m cells after 10-week 3D differentiation. The cells were treated with 1 μM BACE1 Inhibitor IV, 3.7 nM compound E or DMSO for the final two weeks of the 3D differentiation. PHF1 antibody detected the elevated levels of p-tau in soma and neurites (brown, p-tau; scale bar, 25 μm). c. WB of total and p-tau levels in 1% sarkosyl-soluble and -insoluble fractions. d. The modified Gallyas silver staining showed robust increases of strong silver deposits in cell bodies and neurite-like structures in the enriched ReN-mAP cells (lower panel) but not in ReN-m cells (upper panel; scale bar, 25 μm). e. Tau filaments were detected in sarkosyl-insoluble fractions from the enriched ReN-mAP cells by transmission electron microscopy (7-week 3D differentiation; black dots, anti-tau (tau46) antibodies labeled with immunogold anti-mouse antibodies; scale bar, 100 nm). Lower panel: an enlarged image (arrowheads indicate filamentous structures).
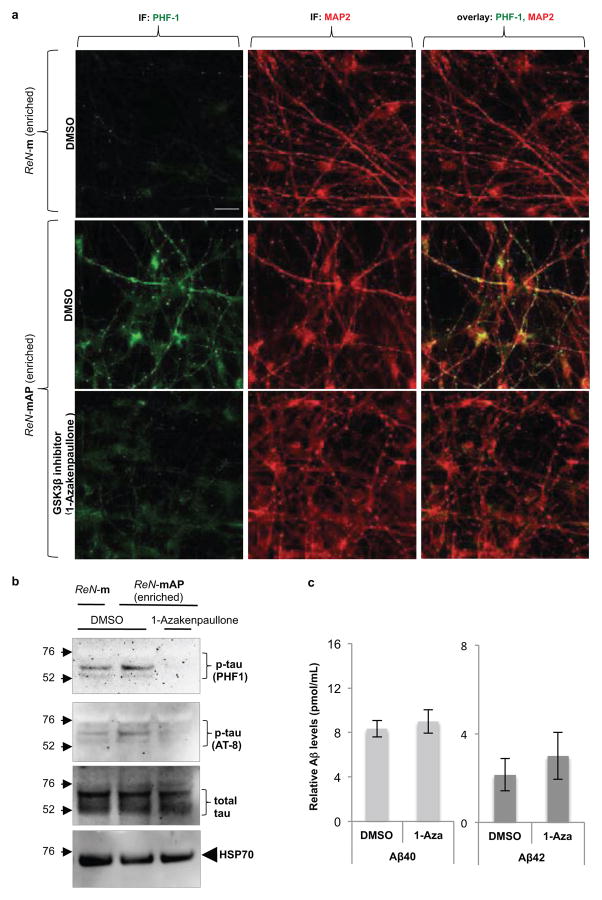
We further explored whether elevated p-tau proteins are aggregated in a manner similar to those observed in degenerating neurons of AD. p-Tau levels were dramatically increased in sarkosyl-insoluble fractions of the enriched ReN-mAP cells, but not in control ReN-m cells (Fig. 4c)21. The high-molecular weight p-tau bands were detected only in sarkosyl-insoluble fractions of the enriched ReN-mAP cells, suggesting the presence of sarkosyl/SDS-resistant tau aggregates (Fig. 4c). Next, we performed modified Gallyas silver staining22 after 10-week differentiation. Remarkably, strong silver depositions in cell bodies and neurite-like structures were detected in the enriched ReN-mAP, but not in ReN-m control cells (Fig. 4d, arrows). Finally, immunoelectron microscopy was employed to search for filamentous assemblies of tau protein in sarkosyl-insoluble fractions. Sarkosyl-insoluble fractions from 7-week differentiated ReN-mAP (enriched) and control ReN-G cells, were analyzed using a transmission electron microscopy. Filamentous structures labeled with tau46 antibody were detected in ReN-mAP cells, not in ReN-G cells (Fig. 4e and Extended Data Fig. 8a–b). The resulting p-tau aggregates shared striking similarity with those observed in the brains of AD patients20. We also found that the GSK3β inhibitors, 1-Azakenpaullone (1-AZA23, Extended Data Fig. 9a–b) and SB415286 (SB4124, data not shown) dramatically decreased p-tau levels in the enriched ReN-mAP cells without changing total tau levels or significantly affecting Aβ levels (Extended Data Fig. 9c). These data indicate GSK3β regulates Aβ-induced tauopathy downstream of β-amyloid deposition25,26.
While increased p-tau levels have been reported in several AD mouse models with FAD mutations, neither somatic accumulated, detergent-resistant/silver-positive p-tau aggregates, nor immunogold labeled detergent-resistant tau fibrils were observed4,5. The discrepancies between mouse FAD models and our 3D culture model might be a result of high levels of Aβ toxicity that can be achieved only in in vitro 3D culture conditions or the differential tau gene structures in humans. We have shown that 3D-differentiated ReN cells exhibited a dramatic increase in a mature human 4R tau isoform, which may be important for reconstituting tauopathy (Extended Data Fig. 2d). Indeed, a recent study showed that a rat FAD model, which has six tau isoforms similar to human, displayed some aspects of tauopathy27. Moreover, all aspects of tauopathy in our FAD hNPC models were dramatically attenuated by β- or γ-secretase inhibitors, most likely through the inhibition of Aβ generation. These data support that tauopathy is driven by the excessive accumulation of Aβ engendered by FAD mutations in our model.
In summary, we have successfully recapitulated Aβ and tau pathologies in a 3D human neural cell culture system, which can be used as a platform for studying AD pathogenic mechanisms and drug screening. Our 3D neural cell culture model also provides a unique platform to explore the molecular mechanisms by which p-tau pathologies are induced by toxic Aβ species in the absence of FTLD (frontotemporal lobar degeneration) tau mutations. Most importantly, we provide experimental validation of the amyloid hypothesis of AD, which proposes that accumulation of Aβ drives tauopathy. Our unique strategy for recapitulating AD pathology in the 3D human neural cell culture model may also serve to facilitate the development of more precise human cellular models of other neurodegenerative disorders.
METHODS
Cell lines, media and reagents
ReNcell VM human neural precursor (ReN) cells were purchased from EMD Millipore (Billerica, MA, USA). The cells were plated onto BD Matrigel (BD Biosciences, San Jose, CA, USA)-coated T25 cell culture flask (BD Biosciences, San Jose, CA, USA) and maintained in DMEM/F12 (Life Technologies, Grand Island, NY, USA) media supplemented with 2 μg/ml Heparin (Stemcell Technologies, Vancouver, Canada), 2% (v/v) B27 neural supplement (Life Technologies, Grand Island, NY, USA), 20 μg/ml EGF (Sigma-Aldrich, St. Louis, MO, USA), 20 μg/ml bFGF (Stemgent, Cambridge, MA, USA), and 1% (v/v) Penicillin/Streptomycin/Amphotericin b solution (Lonza, Hopkinton, MA, USA) in CO2 cell culture incubator. The cell culture media were changed every 3 days until the cells were confluent. For 2D neuronal/glial differentiation, the cells were plated onto either Matrigel-coated 24-well or 6-well plates with DMEM/F12 differentiation media supplemented with 2 μg/ml Heparin, 2% (v/v) B27 neural supplement, and 1% (v/v) Penicillin/Streptomycin/Amphotericin b solution without growth factors. A half volume of the differentiation media was changed every 3 days for 3–7 weeks. DAPT, Compound E and BACE inhibitor IV were purchased from EMD Millipore, N-Lauroylsarcosine (Sarkosyl) from Sigma-Aldrich. Hematoxylin QS from Vector Laboratories (Burlingame, CA, USA), and Amylo-Glo from Biosensis (Thebarton, Australia). SGSM41 is an aminothiazole-bridged heterocycle-containing soluble γ-secretase modulator (SGSM) similar in structure to those published recently19. SGSM 41 has the typical characteristics of this series of SGSM molecules that potently inhibit the production of Aβ42 and to a lesser degree Aβ40 while concomitantly increasing the generation of shorter Aβ peptide species such as Aβ38 and Aβ37. The structures and the detailed properties are included in Extended Data Table 1.
cDNA constructs and viral packaging
The construct encoding full-length human amyloid beta precursor protein (APP695) with V717I (London) mutation was obtained from Dr. Oksana Berezovska (Massachusetts General Hospital, Boston, MA, USA; GeneBank accession no: NM_201414). The human presenilin 1 (PS1) construct with ΔE9 mutation was a kind gift from Dr. John Hardy (NIH, Bethesda, MD, USA; GeneBank accession no: NM_000021). To introduce K670N/M671L (Swedish) mutations into APP695 (London) gene, we performed a site-directed mutagenesis using a mutagenic primer set, 5′-cggaggagatctctgaagtgaatttggatgcagaattccga-3′ and 5′-tcggaattctgcatccaaattcacttcagagatctcctcc g-3′ by using QuikChange Site-Directed Mutagenesis Kit (Agilent Technologies, Santa Clara, CA, USA). APP (Swedish/London) and/or PS1ΔE9 cDNAs were then PCR-amplified with Pfu (New England Biolabs, Ipswich, MA, USA) and cloned into lentiviral polycistronic CSCW-IRES-GFP or CSCW-IRES-mCherry vectors to generate CSCW-APP-GFP, CSCW-PS1ΔE9-mCherry and CSCW-APP-IRES-PS1ΔE9-IRES-mCherry. The parental CSCW-IGs vector was provided by Massachusetts General Hospital (MGH) viral core (http://www2.massgeneral.org/ncs/neuro_core_VectorDevelopmentandProduction.htm). The primers used for the cloning were: APP, 5′-caccgctagccagggtcgcgaatgctgc-3′ and 5′-ggcgtcgacctagttctgcatctgctc-3′; PS1, 5′-caccgctagcagttgctccaatgacagagttac-3′ and 5′-gacctcgagctagatataaaattgatggaatgc-3′. The amplified APP or PS1 genes were double-digested with NheI/SalI or NheI/XhoI and ligated to either CSCW-IRES-GFP or CSCW-IRES-mCherry vectors. To make CSCW-APP-IRES-PS1ΔE9-IRES-mCherry vector, the APP-IRES segment of CSCW-APP-IRES-GFP vector were PCR-amplified with 5′-caccgctagccagggtcgcgaatgctgc-3′ and 5′-ggcgctagcggttgtggccatattatcatc-3′ primers, digested with NheI and cloned into NheI site of CSCW-PS1ΔE9-mCherry vector. All the newly constructed vectors were confirmed by sequencing (MGH sequence core. Charlestown, MA, USA). Viral packaging and the titer determination were performed by MGH viral core (Charlestown, MA, USA).
Viral Infection of ReNcell VM
To transfect the ReN cells with the lentiviral constructs, 50–100 μl viral solution (1 × 10⁶ TU/ml) were added to 85% confluent proliferating ReN cells in 6-well dishes, incubated for 24 hours, and washed 3 times to stop the infection. The expression of the infected genes was confirmed by mCherry or GFP expression by fluorescence microscopy and WB analysis.
FACS enrichment of the transfected ReN cells
The infected ReN cells were washed with PBS and then incubated with Accutase (Millipore) for 5 minutes. The cell pellets were resuspended in PBS supplemented with 2% serum replacement solution (Life Technologies) and 2% B27, and then passed through a cell strainer filter (70 μm Nylon, BD Biosciences). The cell concentrations were adjusted to 2 × 10⁶ cells/ml and then enriched by using FACSAria cell sorter (Broad Institute of MIT and Harvard, Cambridge, MA, USA). GFP and/or mCherry channels were used to detect the expression of the transfected genes in the individual cells. The sorted/enriched cells were maintained in normal proliferation media.
Aβ ELISA
Aβ40 and 42 levels were mainly measured by Human/Rat Aβ ELISA Kit from Wako (Osaka, Japan). The conditioned media from undifferentiated or differentiated ReN cells were collected and diluted by 1:10 or 1:100 with a dilution buffer provided by the company. Synergy 2 ELISA plate reader (BioTek, Winooski, VT, USA) was used to quantify Aβ40 and 42 ELISA signal. To simultaneously measure Aβ38, Aβ40 and Aβ42 levels, a multi-array electrochemiluminescence ELISA kit was used (Meso Scale Discovery, Rockville, MD, USA).
APOE genotyping
5 ng of genomic DNA isolated from undifferentiated ReN-m and ReN-mAP cells was PCR amplified using TaqMan(r) probes for the two APOE SNP markers (rs429358, Cat. No.:C_3084793_20 and rs7412, Cat. No.:C_904973_10) using TaqMan(r) Universal Master Mix II (Life Technologies). DNA samples of known APOE-e4 genotypes (in duplicate) were used as controls to obtain the genotype clusters, and all the samples were PCR amplified on the CFX384 thermal cycler (Bio-Rad, Hercules CA, USA).
3D cell cultures and the differentiation
For thin-layer 3D culture, BD Matrigel stock solution (BD Biosciences) was diluted with ice-cold ReN cell differentiation medium (1:10 dilution ratio) and then vortexed with the cell pellets for 20 seconds. The final cell concentration for the mixture was approximately 2 × 10⁶ cells/ml. The cell/Matrigel mixtures were immediately transferred into either Optilux Black/Clear bottom 96-well plates (100 μl/each well, BD Biosciences) or 8-chamber well Lab-Tek II coverglass plates (200 μl/each well, Thermo Scientific, Rockford, IL, USA) using pre-chilled pipettes. The plates were incubated for 1 hour at 37°C to form thin layer (100–300 nm) 3D gels at the bottom of the plates and the media were changed. The 3D-plated cells were differentiated for 4–12 weeks depending on the experiments; media was changed every 3–4 days. For thick-layer 3D cultures, BD Matrigel solution was diluted with the same volume of the ice-cold ReN cell differentiation medium (1:2 dilution ratio) and vortexed with ReN cell pellets for 20 seconds. The final cell concentration for the mixture was approximately 1 × 10⁷ cells/ml. 400 μl of the cell/Matrigel mixtures were immediately transferred into tissue culture inserts (ThinCerts, 0.4 μm pore size, Greiner Bio-One, Monroe, NC, USA) and then placed in 24-well plates (BD Biosciences). After 1 hour incubation at 37°C, 1 ml of the pre-warmed differentiation media was added and the cultures were maintained for 4–12 weeks; media was changed every 3–4 days. For drug treatments, differentiation media containing either 1 μM BACE1 inhibitor IV, 1 μM DAPT, 3.7 nM Compound E or the same volumes of DMSO were added to 4–6 week differentiated 3D-cultured ReN cells and then maintained for additional 2–3 weeks. The cells were either fixed with 4% paraformaldehyde (PFA) or harvested for extraction and WB analysis
Paraffin embedding and sectioning of thick-layer 3D cultures
For paraffin embedding, 3D thick layer cultures were fixed with 4% PFA at room temperature overnight. The PFA-fixed Matrigel was then transferred to a plastic Tissue-Tek Cryomold (Sakura Finetek, Torrance, CA, USA), preloaded with 60°C liquefied HistoGel (Thermo Scientific). After positioning the fixed 3D Matrigel at the center, the whole Cryomold with Histogel/Matrigel was transferred on ice and then incubated for 15 minutes until the Histogel was solidified. The Histogel/Matrigel complex was then further fixed with 4% PFA at 4°C overnight, washed 5 times with PBS, and sent for paraffin embedding (MGH pathology core, Charlestown, MA, USA). The paraffin blocks were then cut into 10 μm sections (Leica SM2010R sliding microtome, Leica Microsystems Inc., Buffalo Grove, IL, USA), mounted on polylysine-coated glass slides (Thermo Scientific), then incubated at 45°C overnight. The sections were deparaffinized by 2 changes of xylene for 5 minutes each and then serially transferred to 100%, 90%, 70% ethanol solution for 1 minute each. The sections were then rinsed with distilled water for 5 min. For IF and IHC, the antigen retrieval was performed by heating the slides for 30 minutes in Citrate-EDTA Buffer containing 10 mM citric acid (pH 6.2), 2 mM EDTA and 0.05% Tween-20.
Immunofluorescence staining
For IF of 3D-cultured ReN cells, thin-layer 3D cultures were fixed with 4% PFA at room temperature for 24 hours. The fixed cells were then permeabilized and blocked by incubating with a blocking solution containing 50 mM Tris (pH 7.4), 0.1% Tween-20, 4% donkey serum, 1% BSA, 0.1% gelatin and 0.3 M glycine at 4°C for 12 hours. After washing with TBS buffer containing 0.1% (v/v) Tween-20 (TBST), the 3D cultures were incubated with primary antibodies in the blocking solution at 4°C for 24 hours. After washing 3 times with TBST, the cells were then incubated with TBST overnight by gentle rocking at 4°C and then further incubated with AlexaFluor secondary antibodies (Life Technologies) overnight at 4°C. To avoid fluorescence quenching, a drop of anti-fade gold (Life Technologies) was added on top of the fixed/stained thin-layer 3D cultures before imaging. The fluorescence images were captured by Olympus DSU confocal microscope (Olympus USA, Center Valley, PA, USA) and the image analysis and 3D reconstitution were performed with ImageJ (a public domain image analysis software), IPlabs (BioVision Technologies, Exton, PA, USA) and MetaMorph (Molecular Devices, Sunnyvale, CA, USA) software. The following are antibody dilution rates used in this study: 3D6 anti-Aβ antibody (1:500, a gift from Lilly), anti- β-tubulin type III (Tuj1, 1:200, Abcam, Cambridge, MA, USA), anti-GFAP antibody (1:2000, DAKO, Carpinteria, CA, USA; 1:200, Antibodies Incorporated, Davis, CA, USA), AT8 anti-phospho tau antibody (1:40, Thermo Scientific), PHF1 anti-phospho tau antibody (1:1,000, courtesy of Dr. Peter Davies), anti-tau46 antibody (1:200, Cell Signaling Technology), anti-GluR2 (1:100, Antibodies Incorporated), anti-MAP2 antibodies (1:400, Millipore; 1:200, Cell Signaling Technology), anti-tyrosine hydroxylase (1:100, Cell Signaling Technology), anti-NR2B (1:100, Antibodies Incorporated), anti-GABA(B)R2 (1:100, Cell Signaling Technology), AlexaFluor 350/488/568 anti-mouse, -rabbit and -chicken secondary antibodies (1:200, Life Technologies).
Immunohistochemical staining
For IHC, thin-layer 3D cultures were permeabilized and blocked by incubating with the blocking solution at 4°C for 12 hours. To block endogenous peroxidase activities, the cultures were incubated with 0.05% (v/v) H2O2 solution in TBS for 5 min at room temperature, washed with TBST 3 times and incubated with the blocking solution for 2 hours at room temperature. After incubating with the primary antibody solutions for 24 hours at 4°C, the cultures were washed 5 times with TBST and then incubated with ImmPRESS anti-mouse or -rabbit Ig (ImmPRESS Peroxidase Polymer Detection Kit, Vector Laboratories, Burlingame, CA, USA) for 30–60 minutes. The cultures were washed 5 times for 10 min each with TBST and developed by using ImmPACT DAB Peroxidase Substrate kit (Vector Laboratories). The following antibodies and dilution rates have been used in this study: BA27 anti-Aβ40 antibody HRP-conjugate (1:2, Wako Chemicals USA, Richmond, VA, USA), BC05 anti-Aβ42 antibody HRP-conjugate (1:2, Wako Chemicals USA), AT8 anti-p-tau antibody (1:40, Thermo Scientific), PHF1 anti-p-tau antibody (1:1,000), anti-MAP2 antibody (1:200, Cell Signaling Technology), ImmPRESS anti-mouse and -rabbit Ig HRP polymer conjugates (1:2, Vector Laboratories).
Differential detergent extraction for WB
The thick-layer 3D cultures of ReN cells were homogenized with TBS extraction buffer containing 50 mM Tris (pH 7.4), 150 mM NaCl, 1 mM NaVO3, 1 mM NaF, a protease inhibitor mixture (Roche Molecular Biochemicals), a phosphatase inhibitor cocktail (Thermo Scientific,), 2 mM PNT (EMD Millipore) and 1 mM Phenylmethylsulfonyl fluoride (PMSF, Sigma-Aldrich) by using battery-operated spinning homogenizer (MIDSCI, St. Louis, MO, USA). After incubation on ice for 10 minutes, the samples were centrifuged for 1 hour at 100,000 × g to get TBS-soluble fractions. The TBS-insoluble pellets were then resuspended in 2% SDS extraction buffer containing 50 mM Tris (pH 7.4), 150 mM NaCl, 2% SDS, 1% Triton X-100, 1 mM NaVO3, 1 mM NaF, a protease inhibitor mixture (Roche Molecular Biochemicals), a phosphatase inhibitor cocktail (Thermo Scientific), 2 mM PNT (EMD Millipore) and 1 mM PMSF (Sigma-Aldrich) and incubated on ice for additional 30 minutes. The samples were centrifuged for 1 hour at 100,000 × g and the supernatant fractions were collected as TBS-insoluble/2% SDS-soluble fractions. The 2% SDS-insoluble pellets were briefly washed with SDS extraction buffer and then further extracted with 90% formic acid (Sigma-Aldrich) on ice and centrifuged for 1 hour at 100,000 × g to get TBS-insoluble/2% SDS-insoluble/formic acid-soluble fractions. The formic acid fractions were enriched by using SpeedVac and neutralized by 2 M Tris-Cl buffer (pH 8.3). Protein levels of SDS-soluble fractions were used to normalize the total protein levels in TBS and formic acid fractions. Puri3cation of sarkosyl-insoluble tau was performed as previously described28,29 with modi3cations. TBS-insoluble pellets were resuspended in 1% sarkosyl/RIPA buffer containing 50 mM Tris (pH 7.4), 150 mM NaCl, 0.5% w/v sodium deoxycholate, 2% v/v NP-40, 1% w/v N-Lauroylsarcosine, a protease inhibitor mixture (Roche Molecular Biochemicals), a phosphatase inhibitor cocktail (Thermo Scientific), 1 mM NaF, 1 mM NaVO3, 2 mM PNT (EMD Millipore) and 1 mM PMSF (Sigma-Aldrich) and incubated on ice for 1 hour. The samples were then centrifuged for 1 hour at 100,000 × g and the supernatant fractions were collected as 1% sarkosyl/RIPA-soluble fractions. The insoluble pellets were briefly washed two times with 1% sarkosyl/RIPA buffer, further extracted with 90% formic acid (Sigma-Aldrich) on ice and centrifuged for 1 hour at 100,000 × g to get 1% sarkosyl/RIPA-insoluble/formic acid-soluble fractions.
WB analysis
15–75 μg of protein were resolved on 12% Bis-Tris or 4–12% gradient Bis/Tris gels (Life Technologies) and the proteins were transferred to nylon membranes (Bio-Rad). For Aβ WB analysis, the membranes were cross-linked with 0.5% glutaraldehyde solution before blocking. WB images were visualized by enhanced chemiluminescence (ECL). The images were captured by using BioMax film (Kodak, Rochester, NY, USA) or VersaDoc imaging system (Bio-Rad) and quantitated by using QuantityOne software (Bio-Rad). Primary antibodies were used at the following dilutions: 6E10 anti-Aβ (1:300, Convance), anti-PS1 (1:1,000, Cell Signaling Technology), anti-a-tubulin (1:1,000, Cell Signaling Technology), anti-CNPase (1:1,000, Cell Signaling Technology) and anti-BACE1 (1:1,000, Cell Signaling Technology), C66 APP C-terminal antibody (1:2000), AT8 anti-p-tau (1:100, Millipore), PHF1 anti-p-tau (1:500), anti-total tau (1:2,000, DAKO), anti-MAP2 (1:500, Millipore; 1:200, Cell Signaling), anti-NCAM (1:1000, Cell Signaling), anti-synapsin I (1:500, Cell Signaling), anti-HSP70 (1:1000, Enzo Life Sciences, Farmingdale, NY, USA) and anti-human mitochondrial antigen (h-mito, 1:500, Millipore).
Modified Gallyas silver staining
Gallyas silver staining was performed with a modified protocol described by Nadler et al.22. The PFA-fixed thin-layer 3D cultures were washed 3 times with deionized distilled water (DDW) for 5 min and then incubated two times with a pretreating solution containing 4.5% (w/v) NaOH and 0.6% (w/v) ammonium nitrate. The cultures were then incubated with an impregnation solution containing 5.4% (w/v) NaOH, 6.4% (w/v) ammonium nitrate and 0.3% (w/v) silver nitrate for 10 minutes followed by washings with a washing solution containing 1 ml of 0.0012% (w/v) ammonium nitrate, 0.5% (w/v) sodium carbonate and 28.5% (v/v) ethanol for 3 times with 5-min interval. The deposition of silver particles was detected by incubating with a developer solution with 0.012% (w/v) ammonium nitrate, 0.05% (w/v) citric acid, 0.56% (w/v) formalin and 9.5% (v/v) ethanol for 1–5 minutes. The reaction was stopped by adding 0.5% acetic acid.
Amylo-Glo staining
The fixed 3D thin-layer cultures of ReN cells were washed 3 times with saline and incubated with 0.001% (v/v) Amylo-Glo solution for 5 minutes in a dark environment. The cells were then washed with saline followed by three washings with DDW. To avoid fluorescence quenching, a drop of anti-fade gold (Life Technologies) was added on top of the stained cells. The Amylo-Glo fluorescence was measured by Olympus DSU confocal microscope with Metamorph image analysis software (Olympus).
Congo red staining
Bennhold’s congo red staining protocol was used for staining paraffin sectioned 3D cultures with slight modification. The hydrated paraffin-sectioned 3D cultures were incubated with 1% congo red solution (Sigma-Aldrich) for 60 min at room temperature. After briefly rinsing with distilled water for three times, the sections were dipped several times into alkaline alcohol solution (30% EtOH, 0.01% (w/v) NaOH) until the background was cleared. The slides were then washed twice with DDW.
RNA extraction, cDNA synthesis and quantitative RT-PCR (qPCR) analysis
Total RNAs were prepared by using RNeasy mini-columns (Qiagen, Valencia, CA, USA) according to the manufacturer’s protocols. cDNAs were synthesized by SuperScript III first-strand synthesis kit (Life Technologies). The pre-validated primer sets for neural markers were purchased from Real Time Primers, LLC (Elkins Park, PA, USA). The amplification was done in a final volume of 20 μl under the following conditions: 15 min at 95°C and then 55 cycles at 95°C for 10 seconds, 58°C for 45 seconds, and 72°C for 45 seconds. The sizes of qPCR products were confirmed by agarose gel electrophoresis. Biorad iCycler was used to determine Ct values for each sample. Gene expression levels were normalized against β-actin levels in each sample and the fold changes were calculated by setting the expression levels of each genes in undifferentiated control ReN-G cells as 1. The following are the neuronal and glial marker gene names and PCR product sizes: NCAM1 (neural cell adhesion molecule 1, 174 bp), SYT5 (synaptotagmin V, 171 bp), SLC17A7 (VGLUT1, solute carrier family 17 (sodium-dependent inorganic phosphate cotransporter) member 7, 162 bp), GRIN2A (glutamate receptor, ionotropic, N-methyl D-aspartate 2A, 170 bp), EAAT3 (solute carrier family 1, member 1 (neuronal glutamate transporter), 165 bp), ACHE (Acetylcholinesterase, 232 bp), SLC6A4 (solute carrier family 6 member 4 (neurotransmitter transporter, dopamine), 213 bp), GABRA1 (Gamma-aminobutyric acid (GABA) A receptor alpha 1, 165 bp), MAPT (microtubule-associated protein tau, 206), S100β (S100 calcium binding protein, 157 bp), GFAP (glial fibrillary acidic protein, 183 bp), EAAT2 (solute carrier family 1, member 2 (EAAT2, glial), 158 bp), MBP (myelin basic protein, 183 bp) and ACTB (β-actin, 233).
RT-PCR analysis of 3-repeat (3R) and 4-repeat (4R) tau levels
Relative levels of 3R and 4R tau mRNAs were determined by RT-PCR using the primer sets: forward 5′-AAGTCGCCGTCTTCCGCCAAG-3′; reverse 5′-GTCCAGGGACCCAATCTTCGA-3′ as previously described30. The PCR amplification was performed in a final volume of 20 μl under the following conditions: 95°C for 15 min, and then 30 cycles of at 94°C for 30 seconds, 60°C for 30 seconds, 74°C for 90 seconds with a final 10 min extension at 15 min at 95°C. RT-PCR products were analyzed on 2% agarose gel: 4R tau, 381 bp; 3R tau 288 bp.
Preparation of sarkosyl-insoluble tau fibrils for immunoelectron microscopy
Sarkosyl-insoluble tau fibrils were prepared from FAD-ReN (ReN-mAP (enriched)) cells, which were differentiated in 3D for 7 weeks28,29. 3D-cultured cell pellets were homogenized in 1 volume of TBS extraction buffer containing 50 mM Tris (pH 7.4), 150 mM NaCl, 1 mM NaVO3, 1 mM NaF, a protease inhibitor mixture (Roche Molecular Biochemicals), a phosphatase inhibitor cocktail (Thermo Scientific), 2 mM PNT (EMD Millipore) and 1 mM PMSF (Sigma-Aldrich) by using battery-operated spinning homogenizer (MIDSCI). TBS homogenates were then mixed and homogenized with 1 volume of 2x RIPA buffer containing 50 mM Tris (pH 7.4), 150 mM NaCl, 0.5% w/v sodium deoxycholate, 2% v/v NP-40, a protease inhibitor mixture (Roche Molecular Biochemicals), a phosphatase inhibitor cocktail (Thermo Scientific), 1 mM NaF, 1 mM NaVO3, 2 mM PNT (EMD Millipore) and 1 mM PMSF (Sigma-Aldrich), incubated on ice for 15 min. After centrifugation (18,000 × g for 20 min at 4°C), 20% w/v N-Lauroylsarcosine (sarkosyl) stock solution was added to the RIPA-soluble supernatant fraction to adjust the final sarkosyl concentration into 1%. After incubating at room temperature with gentle rocking for 1 hour, RIPA/sarkosyl homogenates were then centrifuged for 1 hour at 150,000 × g. The pellets were then resuspended in 10 μl of PBS (RIPA-soluble/sarkosyl-insoluble fraction). The RIPA-insoluble pellets were further homogenized in H buffer containing 10mM Tris (pH 7.4), 1mM EGTA, 0.8 M NaCl, 10% w/v sucrose, a protease inhibitor mixture (Roche Molecular Biochemicals), a phosphatase inhibitor cocktail (Thermo Scientific), 1 mM NaF, 1 mM NaVO3, 2 mM PNT (EMD Millipore) and 1 mM PMSF (Sigma-Aldrich) and then centrifuged at 18,000 × g for 20 min. 20% w/v N-Lauroylsarcosine (sarkosyl) stock solution was added to adjust the final sarkosyl solution concentration into 1%. After incubating at room temperature with gentle rocking for 1 hour, H buffer/sarkosyl homogenates were then centrifuged for 1 hour at 150,000 × g and the pellets were resuspended in 10 μl of PBS (RIPA-insoluble/sarkosyl-insoluble fraction). Both RIPA-soluble/sarkosyl-insoluble and RIPA-insoluble/sarkosyl-insoluble fractions were used for immunoelectron microscopy. The same protocol was used to enrich sarkosyl-insoluble p-tau aggregates in AD brain samples.
Immunogold staining of sarkosyl-insoluble tau
Immunoelectron microscopy was performed in the Microscopy Core of the Center for Systems Biology/Program in Membrane Biology (MGH, Boston, USA). The sarkosyl-insoluble fractions were resuspended in PBS, placed on formvar-carbon coated Ni grids and allowed to adsorb for 10 minutes. They were placed on drops of tau46 antibody solution (1:25, Cell Signaling Technology) for 1 hour at room temp, then rinsed on drops of PBS and placed on drops of goat-anti-mouse 10 nm gold (Ted Pella, Redding, CA, USA) for 1 hour. They were rinsed on drops of distilled water and stained for 1 minute on drops of 2% phosphotungstic acid (Electron Microscopy Sciences, Hatfield, PA, USA). Grids were examined in a JEOL JEM 1011 transmission electron microscope at 80 kV. Images were collected using an AMT digital imaging system (Advanced Microscopy Techniques, Danvers, MA, USA).
Electrophysiology
Whole-cell recordings were performed on differentiated ReN cells with an Axopatch 200A amplifier (Molecular Devices) and fire polished patch pipettes with resistances of 233 MO. Pipette solution was 140 mM KCl, 2 mM MgCl2, 1 mM EGTA, 10 mM HEPES, 4 mM MgATP, 0.3 mM NaGTP, and 0.1 mM Na2PhosCr, pH 7.2, adjusted with KOH. The external solution was 140 mM NaCl, 5 mM KCl, 2 mM CaCl2, 2 mM MgCl2, 10 mM HEPES, and 10 mM D-glucose, pH 7.4, adjusted with NaOH. Command protocols were generated and data were digitized with a Digidata 1440A A/D interface with pCLAMP10 software (Molecular Devices). Voltage errors were minimized by series resistance compensation (80%). During the recording, 500 nM tetrodotoxin (TTX) was applied to isolate Na+ currents by subtracting currents after and before TTX application. The data was analyzed by Clampfit (Molecular Devices) and Sigmaplot.
Statistics
All statistical analyses were performed using a two-tailed Student’s t-test or one-way ANOVA followed by a post hoc Dunnett’s test. Data in graphs are expressed as mean values ± standard error of the mean (mean ± s.e.m). Error bars represent s.e.m.
Extended Data
Extended Data Figure 1. Generation of FACS-sorted ReN cells with FAD mutations.
a. FACS sorting of ReNcell VM human neural stem (ReN) cells that were stably transfected with polycistronic GFP and/or mCherry lentiviral Vector. The cells were then enriched based on GFP and/or mCherry signals by FACS (red-dotted boxes, the selected ranges of cells for the experiments). b. ReN cells stably expressing GFP alone (ReN-G), APPSL/GFP (ReN-GA), APPSL/GFP/PS1ΔE9/mCherry (ReN-mGAP), mCherry alone (ReN-m), APPSL/PS1ΔE9/mCherry (ReN-mAP) or GFP/APPSL/PS1ΔE9/mCherry (HReN-mGAP). Green, GFP; Red, mCherry; Scale bar, 25 μm. c. The representative fluorescence microscope images of ReN cells that were differentiated by growth-factor deprivation for 3 weeks (green, GFP; red, mCherry; scale bar, 25 μm). d. IF of neuronal (Tuj-1, blue) and glial markers (GFAP, blue) in 3-week differentiated control and FAD ReN cells. e. WB of APPSL and PS1ΔE9 expression in control (ReN-G and ReN-m) and FAD ReN (ReN-GA, ReN-mGAP and HReN-mGAP) cells. APP C-terminal fragments levels were largely increased by 500 nM DAPT treatments for 24 hours. f. A table summarizing the control and FAD ReN cells generated for this study.
Extended Data Figure 2. Characterization of the control and FAD ReN cells.
a. WB of neuronal (MAP2, Tuj1, NCAM, Synapsin 1) and glial (GFAP) markers in undifferentiated and 3-week differentiated control and FAD ReN cells. b. Confocal IF of presynaptic (VGluT1, green) and dendritic (MAP2, red (pseudo-colored)) markers in 6-week differentiated control ReN-m cells. c. qPCR array analysis of neuronal and glial markers of 7-week differentiated control ReN-G cells. Gene expression levels were normalized against β-actin levels in each sample and the fold changes were calculated by setting the expression levels of each genes in undifferentiated control ReN-G cells as 1 (n=3 for ReN-G while n=5 for ReN-G in 3D-differentiatiation). FAD (HReN-mGAP and ReN-mAP) ReN cells showed a similar pattern of increases in neuronal and glial markers (data not shown). d. Analysis of 4-repeat (4R) or 3-repeat (3R) tau isoforms in 7-week differentiated control (ReN-G and ReN-m) and FAD (ReN-GA, ReN-mGAP, HReN-mGAP and ReN-mAP) ReN cells. cDNA samples prepared from undifferentiated control ReN-G (1st lane) and human adult brains (9th lane) were used as controls. e and f. Electrophysiological properties of differentiated control ReN-G cells. The currents were elicited by 10 mV voltage steps from -100 to +60 mV in external solution (e) without (left panel in f) or with 500 nM tetrodotoxin (TTX, right panel in f). TTX treatment specifically blocked voltage-gated sodium currents. ReN-G cells were differentiated for 29 days by the “preD” method as previously described12. g. Sodium currents are shown as subtracted currents. h. Premature ReN-G (<16 days) cells mostly showed voltage-gated potassium currents without TTX-sensitive sodium currents. i. WB of Aβ levels in the conditioned media collected from 6-week differentiated control (ReN-m) and FAD ReN (ReN-mAP and HReN-mGAP) cells. j. A table summarizing APOE genotypes of control (ReN-m) and FAD ReN (ReN-mAP) cells used in this study. Two APOE SNP markers rs429358 (minor allele=C) and rs7412 (minor allele=T) were used to determine APOE2/3/4 genotypes.
Extended Data Figure 3. Characterization of differentiated ReN cells in 3D cultures.
a. Hematoxylin staining of a representative paraffin section (10 μm) from 9-week differentiated ReN-m cells in thick layer 3D Matrigel. The sections were vertically cut to show the top and bottom of the 3D cultures. The digital pictures were serially taken from top to bottom and combined together (bottom panel: an enlarged picture). b. The paraffin sections from control (ReN-G and ReN-m) and FAD ReN (ReN-GA and ReN-mAP (enriched)) were IF stained with the following antibodies against neuronal markers, Tuj1 and MAP2. Blue, DAPI; scale bar, 25 μm. c. IF of thick layer 3D-differentiated ReN-m cells with the following antibodies against additional neuronal markers. Green, tau, VGluT1 (Vesicular glutamate transporter 1), or GluR2 (Glutamate Receptor, Ionotropic, AMPA 2); scale bar, 25 μm. d. IF of 3D-differentiated ReN-m cells (7 weeks) with the antibodies against mature neuronal markers. Green, TH (tyrosine hydroxylase), NR2B (NMDA receptor 2B) or GABA(B)R2 (GABB-B-receptor 2); Blue, DAPI; scale bar, 20 μm.
Extended Data Figure 4. Reconstitution of Aβ aggregates in 3D-cultured FAD ReN cells.
a. IHC of Aβ deposits in control (ReN-G) and FAD ReN (HReN-mGAP) cells differentiated in 3D Matrigel. The control and FAD ReN cells were 3D-differentiated for 6 weeks and then treated with 1 μM BACE1 inhibitor IV (β-secretase inhibitor), 500 nM DAPT (γ-secretase inhibitor), 500 nM SGSM41 (γ-secretase modulator) or DMSO for additional 3 weeks. The cultures were then fixed and immunostained with HRP-conjugated BA27 anti-Aβ40 antibodies (brown, DAB (BA27); blue, hematoxylin; scale bar, 25 μm; arrowheads, large Aβ deposits). b. The enlarged images of Aβ deposits in control (ReN-G) and FAD ReN (ReN-mGAP, HReN-mGAP) cell pictures shown in Fig. 2d and Extended Data Fig. 4a). c. IHC of Aβ deposits in control (ReN-G, left panels) and FAD ReN (ReN-mGAP: middle panels; HReN-mGAP: right panels) cells differentiated in 3D thin layer Matrigels for 9 weeks. The fixed thin-layer 3D cultures were immunostained with HRP-conjugated BA27 anti-Aβ40 antibodies (brown, DAB (BA27); scale bar, 25 mm; arrows, large Aβ deposits). d. Amylo-Glo staining of ReN-G 3D cultures. Green, GFP; Blue, Amylo-Glo.
Extended Data Figure 5. Accumulation of p-tau in FAD ReN cells.
a. Elevated p-tau levels were significantly decreased by 1 μM DAPT (γ-secretase inhibitor) treatment in 6-week differentiated HReN-mGAP cells. The antibody against human specific mitochondrial marker (h-mito) was used to show an equal loading of the samples. b. Quantitation of p-tau levels in control and DAPT-treated HReN-mGAP cells (**, p<0.01; t-test; n=3 per each sample). c. p-tau IHC showed p-tau positive cells in 3D-differentiated FAD ReN cells. Two p-tau antibodies, AT8 (pSer199/Ser202/Thr205) and PHF1 (pSer396/Ser404), against different phosphorylation sites were used. Brown, p-tau; Scale bar, 25 μm; arrows indicate the cells with high levels of p-tau. d. High magnification (1,000x) images of p-tau positive neurons (brown, AT8 p-tau). IHC of AT8 p-tau staining showed neurons with high levels of p-tau accumulation in soma and neurite-like structures (arrowheads). e. IHC of p-tau (AT8) staining showed the cells with p-tau accumulations in soma and neurite-like structures (arrow and arrowheads). f. An enlarged image of a dotted box in e (brown: p-tau (AT8); blue: hematoxylin). g. Total number of cells with high levels of p-tau in single 96-well was counted in control (ReN-G and ReN-m) and FAD ReN (ReN-GA, ReN-mGAP and HReN-mGAP) cells (*, p<0.05; t-test; n=5 for control ReN cells and 12 for FAD ReN cells). h. BACE inhibitor IV (1 μM) or Compound E (3.7 nM) treatments largely decreased cells with high p-tau accumulation in ReN-mAP cells (***, p<0.001; ANOVA followed by a post-hoc Dunnett’s test; n=3 for control ReN-m and ReN-mAP cells).
Extended Data Figure 6. FACS enrichment of ReN-mAP and ReN-m cells for higher expressions of APP and PS1.
a. FACS sorting of ReN-mAP cells with top 1–2% mCherry signal. b. The enriched control ReN-m and ReN-mAP cells were differentiated by growth-factor deprivation in 2D cultures. c. The enriched ReN-mAP cells secreted high levels of Aβ40 and 42 after 9-week 3D differentiation. The secreted Aβ38/40/42 levels were measured by a multi-array Meso Scale electrochemiluminescence (Meso Scale SQ 120 system). Relative levels of Aβ (fold increases) were calculated by setting Aβ levels of the control ReN-m as 1. Aβ levels were decreased after treating 1 μM BACE1 inhibitor IV, 3.7 nM Compound E or 500 nM SGSM41 (**, p<0.01; ***, p<0.001; ANOVA followed by a post-hoc Dunnett’s test; n=3 for the enriched ReN-m and -mAP, respectively).
Extended Data Figure 7. Increased p-tau levels in FAD ReN cells.
a. IF of AT8 p-tau and MAP2 in the enriched ReN-mAP and control ReN-m cells after 9 weeks of 3D-differentiation. A BACE1 inhibitor (BACE1 inhibitor IV) treatment for 3 weeks, dramatically reduced AT8 p-tau staining (green, AT8 p-tau; red (pseudo-colored), MAP2; scale bar, 25 μm). b. WB of total and p-tau levels in control (ReN-m) and FAD ReN (enriched ReN-mAP) cells. The cells were 3D-differentiated for 9 weeks. 3 weeks of BACE1 inhibitor treatments significantly decreased p-tau levels without changing total tau levels. HSP70 heat shock protein levels were shown for equal loadings of each sample.
Extended Data Figure 8. Immuno-EM analysis of sarkosyl-insoluble fraction from FAD and control ReN cells.
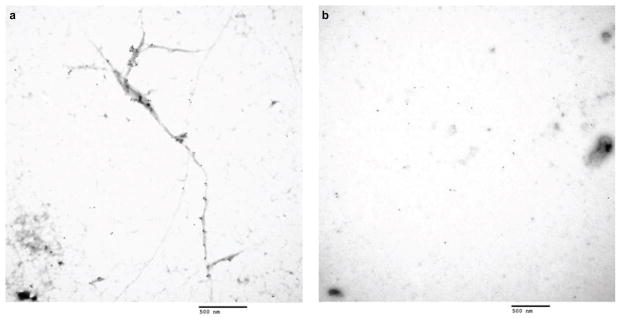
a. Sarkosyl-insoluble fractions prepared from 3D-differentiated ReN-mAP (enriched, 7-week differentiated), were placed on carbon grids, labeled with tau46 and anti-mouse 10 nm gold antibodies and imaged by using a JEOL JEM 1011 transmission electron microscope (Scale bar, 500 nm). b. Sarkosyl-insoluble fractions from 3D-differentiated control ReN-G cells (7 weeks). No immunogold-labeled filamentous structures were detected in these samples (Scale bar, 500 nm).
Extended Data Figure 9. 1-Azakenpaullone, a GSK3 inhibitor treatment decreased Aβ-induced tau phosphorylation without changing the total Aβ levels.
a. IF of p-tau and MAP2 in the enriched ReN-mAP and control ReN-m cells with or without treating 1-Azakenpaullone, a GSK3β inhibitor. The differentiated cells were treated with 2.5 μM 1-Azakenpaullone (GSK3β inhibitor) or DMSO for the last 5 days of the 3D differentiation (green, p-tau (PHF1); red (pseudo-colored), MAP2; scale bar, 25 μm). b. WB of total and p-tau levels in control (ReN-m) and FAD ReN (enriched ReN-mAP) cells. The cells were 3D-differentiated for 4 weeks followed by additional 5-day treatments of DMSO or 2.5 μM 1-Azakenpaullone. c. Analysis of Aβ40 and 42 levels in the enriched ReN-mAP cells treated with either DMSO or 2.5 μM 1-Azakenpaullone (1-Aza) under the same conditions.
Extended Data Table 1. The structure and the properties of SGSM41, a novel soluble γ-secretase modulator.
SGSM41 has the typical characteristics of this series of SGSM molecules that potently inhibit the production of toxic Aβ42 and to a lesser degree Aβ40 while concomitantly potentiating the generation of shorter Aβ peptide species such as Aβ38 and Aβ37.
| Compound | Structure | IC50 for the inhibition of Aβ42 | IC50 for the inhibition of Aβ40 | ClogP | Kinetic solubility (μM) in PBS pH 7.4 | EC50 for the potentiation of Aβ38 | Notch | APP | Microsomal Stability % Remaining (human); 30 min | Microsomal Stability % Remaining (rat); 30 min | Microsomal Stability % Remaining (mouse); 30 min |
|---|---|---|---|---|---|---|---|---|---|---|---|
| 41 |

|
115nM | 1229nM | 4.91 | 4.6 | 389nM | NO | NO | 28 | 56 | 67 |
Acknowledgments
This work is supported by the grants from the Cure Alzheimer’s fund to D. Y. K., S. H. C and R. E. T. We thank Drs. Tara L. Spires (The University of Edinburgh, Edinburgh, UK), Manuela Polydoro (Massachusetts General Hospital, Boston, USA), Susanne Wegmann (Massachusetts General Hospital, Boston, USA) for revising the manuscript, and Ms. Mary L. McKee (MGH Microscopy Core, Boston, USA) for the electron microscopy assistance. We also appreciate Drs. Bradley T. Hyman, Oksana Berezovska (Massachusetts General Hospital, Boston, USA), John Hardy (NIH, Bethesda, MD, USA) and Peter Davies (Albert Einstein College of Medicine, Bronx, USA) for providing cDNAs and antibodies. Finally, we would like to acknowledge Ragon Institute’s Imaging Core facility (part of the Harvard CFAR Immunology Core), MGH Viral Vector Core (supported by NIH/NINDS P30NS04776), MGH Microscopy Core of the Center for Systems Biology for immunoelectron microscopy (partially supported by an IBDG Grant DK43351 and a BADERC Award DK57521), MGH Confocal Microscope Core and MGH Pathology Core for technical and instrument support.
Footnotes
Author Contributions: D.Y.K. and R.E.T. were equally responsible for experimental design and data interpretation. S.H.C., Y.H.K. and D.Y.K. mainly contributed to writing and revising the manuscript. D.Y.K., Y.H.K., S.H.C., M.H., S.L., J.C., C.S., B.H., J.B.K., C.A., C.Z. conducted the experiments. S.L.W. synthesized and characterized SGSM41. J.M., B.J.W., M.P., C.J.W., D.M.K. contributed to data interpretation.
References
- 1.Tanzi RE, Bertram L. Twenty years of the Alzheimer’s disease amyloid hypothesis: a genetic perspective. Cell. 2005;120:545–555. doi: 10.1016/j.cell.2005.02.008. [DOI] [PubMed] [Google Scholar]
- 2.Hardy J, Selkoe DJ. The amyloid hypothesis of Alzheimer’s disease: progress and problems on the road to therapeutics. Science. 2002;297:353–356. doi: 10.1126/science.1072994. [DOI] [PubMed] [Google Scholar]
- 3.Selkoe D. Alzheimer’s disease is a synaptic failure. Science. 2002;298:789–791. doi: 10.1126/science.1074069. [DOI] [PubMed] [Google Scholar]
- 4.Duff K. Transgenic mouse models of Alzheimer’s disease: phenotype and mechanisms of pathogenesis. Biochem Soc Symp. 2001;67:195–202. doi: 10.1042/bss0670195. [DOI] [PubMed] [Google Scholar]
- 5.Chin J. Selecting a mouse model of Alzheimer’s disease. Methods Mol Biol. 2011;670:169–189. doi: 10.1007/978-1-60761-744-0_13. [DOI] [PubMed] [Google Scholar]
- 6.Choi SH, Tanzi RE. iPSCs to the rescue in Alzheimer’s research. Cell stem cell. 2012;10:235–236. doi: 10.1016/j.stem.2012.02.011. [DOI] [PubMed] [Google Scholar]
- 7.Yagi T, et al. Modeling familial Alzheimer’s disease with induced pluripotent stem cells. Human molecular genetics. 2011;20:4530–4539. doi: 10.1093/hmg/ddr394. [DOI] [PubMed] [Google Scholar]
- 8.Israel MA, et al. Probing sporadic and familial Alzheimer's disease using induced pluripotent stem cells. Nature. 2012;482:216–220. doi: 10.1038/nature10821. [DOI] [PMC free article] [PubMed] [Google Scholar]
- 9.Kondo T, et al. Modeling Alzheimer’s disease with iPSCs reveals stress phenotypes associated with intracellular Aβ and differential drug responsiveness. Cell stem cell. 2013;12:487–496. doi: 10.1016/j.stem.2013.01.009. [DOI] [PubMed] [Google Scholar]
- 10.Muratore CR, et al. The familial Alzheimer’s disease APPV717I mutation alters APP processing and Tau expression in iPSC-derived neurons. Hum Mol Genet. 2014;23:3523–3536. doi: 10.1093/hmg/ddu064. [DOI] [PMC free article] [PubMed] [Google Scholar]
- 11.Sproul AA, et al. Characterization and Molecular Profiling of PSEN1 Familial Alzheimer’s Disease iPSC-Derived Neural Progenitors. PLoS ONE. 2014;9:e84547. doi: 10.1371/journal.pone.0084547. [DOI] [PMC free article] [PubMed] [Google Scholar]
- 12.Donato R, et al. Differential development of neuronal physiological responsiveness in two human neural stem cell lines. BMC Neurosci. 2007;8:36. doi: 10.1186/1471-2202-8-36. [DOI] [PMC free article] [PubMed] [Google Scholar]
- 13.Morgan PJ, et al. Protection of neurons derived from human neural progenitor cells by veratridine. Neuroreport. 2009;20:1225–1229. doi: 10.1097/WNR.0b013e32832fbf49. [DOI] [PubMed] [Google Scholar]
- 14.Mazemondet O, et al. Quantitative and kinetic profile of Wnt/β-catenin signaling components during human neural progenitor cell differentiation. Cell Mol Biol Lett. 2011;16:515–538. doi: 10.2478/s11658-011-0021-0. [DOI] [PMC free article] [PubMed] [Google Scholar]
- 15.Li H, Wijekoon A, Leipzig ND. 3D differentiation of neural stem cells in macroporous photopolymerizable hydrogel scaffolds. PLoS One. 2012;7:e48824. doi: 10.1371/journal.pone.0048824. [DOI] [PMC free article] [PubMed] [Google Scholar]
- 16.Lancaster MA, et al. Cerebral organoids model human brain development and microcephaly. Nature. 2013;501:373–379. doi: 10.1038/nature12517. [DOI] [PMC free article] [PubMed] [Google Scholar]
- 17.Tang-Schomer MD, et al. Bioengineered functional brain-like cortical tissue. Proc Natl Acad Sci U S A. 2014 doi: 10.1073/pnas.1324214111. [DOI] [PMC free article] [PubMed] [Google Scholar]
- 18.Higuchi M, Trojanowski JQ, Lee VM-Y. Tau protein and tauopathy. In: Davis Kenneth L, Charney Dennis, Coyle Joseph T, Nemeroff Charles., editors. Neuropsychopharmacology: The Fifth Generation of Progress. 2002. pp. 1339–1354. [Google Scholar]
- 19.Wagner SL, et al. Soluble gamma-Secretase Modulators Selectively Inhibit the Production of the 42-Amino Acid Amyloid beta Peptide Variant and Augment the Production of Multiple Carboxy-Truncated Amyloid beta Species. Biochemistry. 2014;53:702–713. doi: 10.1021/bi401537v. [DOI] [PMC free article] [PubMed] [Google Scholar]
- 20.Trojanowski JQ, Lee VMY. The role of tau in Alzheimer’s disease. Med Clin North Am. 2002;86:615–627. doi: 10.1016/s0025-7125(02)00002-0. [DOI] [PubMed] [Google Scholar]
- 21.Cras P, et al. Neuronal and microglial involvement in β-amyloid protein deposition in Alzheimer’s disease. Am J Pathol. 1990;137:241–246. [PMC free article] [PubMed] [Google Scholar]
- 22.Nadler JV, Evenson DA. Use of excitatory amino acids to make axon-sparing lesions of hypothalamus. Autophagy in disease and clinical applications, Part C. 1983;103:393–400. doi: 10.1016/s0076-6879(83)03027-x. [DOI] [PubMed] [Google Scholar]
- 23.Kunick C, Lauenroth K, Leost M, Meijer L, Lemcke T. 1-Azakenpaullone is a selective inhibitor of glycogen synthase kinase-3 beta. Bioorg Med Chem Lett. 2004;14:413–416. doi: 10.1016/j.bmcl.2003.10.062. [DOI] [PubMed] [Google Scholar]
- 24.Kirby LA, et al. Glycogen synthase kinase 3 (GSK3) inhibitor, SB-216763, promotes pluripotency in mouse embryonic stem cells. PLoS ONE. 2012;7:e39329. doi: 10.1371/journal.pone.0039329. [DOI] [PMC free article] [PubMed] [Google Scholar]
- 25.Phiel CJ, Wilson CA, Lee VMY, Klein PS. GSK-3alpha regulates production of Alzheimer’s disease amyloid-beta peptides. Nature. 2003;423:435–439. doi: 10.1038/nature01640. [DOI] [PubMed] [Google Scholar]
- 26.Jaworski T, et al. GSK-3α/β kinases and amyloid production in vivo. Nature. 2003;423:435–439. doi: 10.1038/nature10615. [DOI] [PubMed] [Google Scholar]
- 27.Cohen RM, et al. A transgenic Alzheimer rat with plaques, tau pathology, behavioral impairment, oligomeric Aβ, and Frank neuronal loss. The Journal of neuroscience. 2013;33:6245–6256. doi: 10.1523/JNEUROSCI.3672-12.2013. [DOI] [PMC free article] [PubMed] [Google Scholar]
- 28.Planel E, et al. Acceleration and persistence of neurofibrillary pathology in a mouse model of tauopathy following anesthesia. FASEB J. 2009;23:2595–2604. doi: 10.1096/fj.08-122424. [DOI] [PMC free article] [PubMed] [Google Scholar]
- 29.Julien C, Bretteville A, Planel E. Biochemical isolation of insoluble tau in transgenic mouse models of tauopathies. Methods Mol Biol. 2012;849:473–491. doi: 10.1007/978-1-61779-551-0_32. [DOI] [PubMed] [Google Scholar]
- 30.Iovino M, Patani R, Watts C, Chandran S, Spillantini MG. Human stem cell-derived neurons: a system to study human tau function and dysfunction. PLoS ONE. 2010;5:e13947. doi: 10.1371/journal.pone.0013947. [DOI] [PMC free article] [PubMed] [Google Scholar]


