Abstract
The ~350 km2 water level fluctuation zone (WLFZ) in the Three Gorges Reservoir (TGR) of China, situated at the intersection of terrestrial and aquatic ecosystems, experiences a great hydrological change with prolonged winter inundation. Soil samples were collected in 12 sites pre- (September 2008) and post submergence (June 2009) in the WLFZ and analyzed for soil nutrients. Self-organizing map (SOM) and statistical analysis including multi-way ANOVA, paired-T test, and stepwise least squares multiple regression were employed to determine the spatio-temporal variations of soil nutrients in relation to submergence, and their correlations with soil physical characteristics. Results showed significant spatial variability in nutrients along ~600 km long shoreline of the TGR before and after submergence. There were higher contents of organic matter, total nitrogen (TN), and nitrate (NO3-) in the lower reach and total phosphorus (TP) in the upper reach that were primarily due to the spatial variations in soil particle size composition and anthropogenic activities. Submergence enhanced soil available potassium (K), while significantly decreased soil N, possibly due to the alterations of soil particle size composition and increase in soil pH. In addition, SOM analysis determined important roles of soil pH value, bulk density, soil particle size (i.e., silt and sand) and nutrients (TP, TK, and AK) on the spatial and temporal variations in soil quality. Our results suggest that urban sewage and agricultural runoffs are primary pollutants that affect soil nutrients in the WLFZ of TGR.
Introduction
Nutrient pollution in a watershed has a large variety of sources such as industrial and domestic wastewater, agricultural runoff, mining activities, and atmospheric deposition [1]. Excessive loads of certain nutrients often cause eutrophication, water quality deterioration, and biodiversity loss in aquatic ecosystems [2]. Riparian wetlands, located at the intersection of terrestrial and aquatic ecosystems, play an important role in mediating nutrient pollution for rivers [3], [4]. Therefore, it is essential to characterize nutrient dynamics in the riparian zone for an improved assessment of environmental quality.
Nutrient levels in riparian zone depend on a variety of factors, such as soil and vegetation characteristics, flooding, and anthropogenic activities [5], [6]. Soil characteristics particularly soil pH, soil particle size composition, and redox condition have large effects on the sorption-desorption processes and microbial activities, and thus regulate soil nutrient dynamics [7–9]. For instance, Brunet and Astin [10] found that coarser sandy sediment was associated with low level of organic material and a mixture of silt and clay being associated with enhanced concentrations of organic matter and soil nutrient. Riparian vegetation could regulate soil nutrient contents directly by uptake, decomposition and deposition of alluvial materials, and indirectly through stimulation of microbial processes in the rhizosphere [11–13]. The input of organic matter by plant could generate high rates of microbial activity [14], [15]. Vegetation decomposition contributes to short-term N retention in riparian zones by consuming nutrients from external sources during the first stages of the decomposition [12]. Therefore, Nitrate would be removed more effectively in densely vegetated riparian zones due to the plant uptake and high rates of nitrification and denitrification [2], [12], [13], [16].
Flooding is also an important factor regulating nutrient levels in riparian areas [9], [17–19]. Seasonal drawdown and exposure poses alternative aerobic and anaerobic conditions which have important influences on soil mineralization and nutrient cycling in riparian zones [20], [21]. Submergence creates anaerobic soil environment, which transforms nitrate to nitrogen (N2), nitrous oxide (NO2), and/or ammonium (NH3) and increases P availability due to the reduction and dissolution of iron phosphate [22], [23]. In reservoir system, nutrients sedimentation and subsequent sediment-water interactions are primary regulatory processes affecting the nutrient status in the riparian zone during the submergence [23], [24]. Moreover, anthropogenic activities, i.e., the mass use of fertilizer and pesticide in the uplands release large quantity of nitrates and phosphates, and understandably increase their concentrations in the riparian zone [25], [26].
Traditional statistical methods, i.e., principal component analysis, hierarchical cluster analysis, and correlation, have been widely applied to investigate the relationship between soil nutrients and various influence factors [27], and the results were always based on various sources of statistical bias except that all the requirements in the analysis were strictly adjusted [28]. Thus, it is inherently difficult to assess and understand soil nutrient dynamics and their associated controls. The Kohonen Self-Organizing Map (SOM) [29], an artificial neural network has been applied as an alternative to conventional multivariate statistical approaches in environmental data [30]. SOM could reveal different effects of nutrient pollutions and spatio-temporal variations in environmental conditions [31].
Dams have profound influences on the environments and ecological processes of riverine systems and beyond [32–36]. After the completion of the Three Gorges Dam in 2008, water level fluctuated from 145 m in summer (May to September) to 175 m in winter (October to April), and a total area of 350 km2 water level fluctuation zone (WLFZ) was formed in the Three Gorges Reservoir [37]. The reversal of submergence time and prolonged inundation result in loss of previous vegetation which would have influenced soil nutrient dynamics in the riparian ecosystem. Moreover, 1.2×10⁹ tons of industrial and domestic sewage were discharged into the Reservoir in 2008, of which ~80% of the sewage had received some level of treatment before discharge [38]. In addition, intensive agriculture activities in the middle and low regions of the Reservoir caused around 1.4×10⁵ tons of chemical fertilizers and 5.3×10² tons of pesticide used for agriculture (a total of 977,700 ha) in 2008, of which ~9% was lost by surface runoff [38]. Therefore, anthropogenic impacts on the soil quality in the WLFZ are of great public interest and concern. In this study, multi-statistical approaches and SOM were used to examine the spatio-temporal variability of soil nutrients and their associated dominant controls before and after submergence in the WLFZ. Our results would help understand the great impacts of submergence on soil nutrients and develop strategies for revegetation in the WLFZ.
Materials and Methods
2.1 Site description
The Three Gorges Reservoir region (29°16′- 31°25′ N, 106°- 111°50′ E) lies in a 600 km valley from Yichang to upstream Chongqing (Fig. 1). Climate in this region belongs to southeast sub-tropic monsoon. Annual mean temperature is 16.5–19°C with the highest and lowest temperatures of 28°C and 3.4°C, respectively. Annual precipitation is about 1100 mm with 80% falling from April to October. Zonal soil types include red soil, yellow soil, and mountain yellow soil [39]. With the Three Gorges Dam fully functioning in 2008, the water level of the reservoir fluctuates from 145 m a.s.l in summer (May to September) to 175 m a.s.l in winter (October to April) thereafter. The reversal of flooding time and prolonged submergence have dramatically altered the hydrological regime in the WLFZ [40].
Fig 1. Location of the sampling sites in the water level fluctuation zone of the Three Gorges Reservoir, China (upper reach includes sites 1–4, middle reach includes sites 5–8, and lower reach includes sites 9–12).
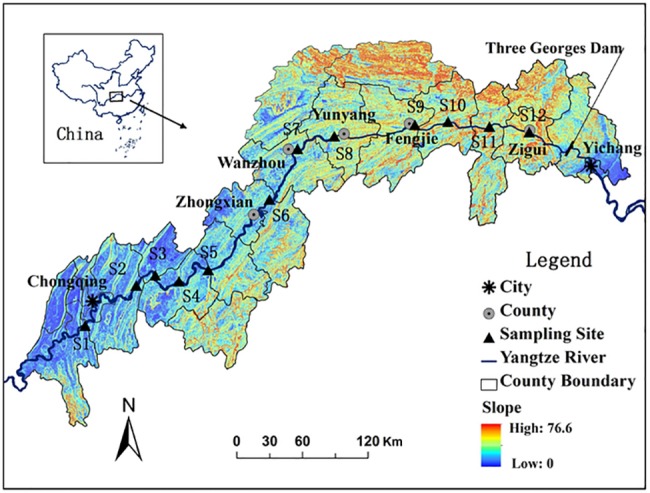
The original image was cited from Ye et al. [52] with differences in sampling sites.
2.2 Vegetation in the WLFZ
Before submergence (September 2008), vegetation in the 145–155 m were dominated by annuals, i.e., Setaria viridis, Digitaria ciliaris, and Leptochloa Chinensis, and perennials including Cynodo dactylon, Hemarthria altissima, and Capillipedium Assimile, and from 155–175 m vegetation were dominated by woody plants such as Ficus tikoua, Pterocarya stenoptera, and Vitex negundo in the WLFZ [41]. After submergence (June 2009), the vegetation in the WLFZ was uniformly composed of annual and perennial herbs such as S. viridis, D. ciliaris, and C. dactylon [42].
2.3 Soil sampling
Field surveys were conducted in September 2008 (before submergence) and June 2009 (one week after submergence) when the reservoir’s water level in 145 m and the WLFZ was exposed to the air. Twelve sampling sites were selected based on the geographical characteristics of the WLFZ from upstream to downstream in the Three Gorges Reservoir (Fig. 1) and divided into the upper reach (Sites 1–4), middle reach (Sites 5–8), and lower reach (Sites 9–12). Each sampling location was allowed by the Executive Office of the State Council Three Gorges Construction Committee. Land use history in these sites was deserted factories or croplands abandoned for more than 5 years and the major soil type was yellow soil. Each sampling site was marked by PVC pipes and measured by GPS to ensure soil sampling on the same site before and after submergence.
At each sampling site, six plots (1 m × 1 m each) were randomly selected in the three intervals of elevation from 145 to 175 m (i.e., 145–155 m, 155–165 m, and 165–175 m) in order to examine the influence of flooding depth and duration on soil nutrients. At each plot, five replicates from 0–20 cm layer soil were selected evenly throughout the plot and well mixed to form a composite sample. However, only two samples were collected in site 1 between the elevations of 165–175 m because of the high water level during the sampling period. Thus, a total of 136 samples were collected, and all the samples were sealed in plastic bags and stored at 4°C for analysis.
2.4 Soil sampling analysis
Soil organic matter (OM) was determined by potassium bichromate (K2Cr2O7) titration solution after digestion. Total nitrogen (TN) was measured using a nitrogen/carbon analyzer (NA-1500-NC Series 2) with Eager 200 software (Fisons Instruments, Beverly, MA, USA). For total phosphorus (TP) and total potassium (TK) analysis, soil digestion was performed in Kjeldahl flask following the classical open digestion procedures with a mixture of concentrated HClO4-H2SO4 (i.e., 1ml HClO4 and 10ml H2SO4). TP was determined by molybdenum blue colorimetry method; TK was measured by flame photometry method; Available phosphorus (AP) was determined by 0.5M NaHCO3 extraction (1:20) colorimetric method; and available potassium (AK) was determined by 1M NH4OAC extraction (1:20) flame photometry method [39]. The ammonium (NH4 +) and nitrate (NO3 -) contents were measured by extraction of 20 g of fresh soil with 100 ml extractant (i.e., 0.4 M KCl) for 1 h. After filtering the suspension, the extract was analyzed for NH4 + and NO3 - on a continuous flow auto analyzer (Skalar-40) using a colorrmetric method [43]. Soil pH was measured in a 2:1 (by weight) soil to water solution using Fisher Scientific AR15 (Waltham, MA) pH probe. Soil water content was measured by dried at 105°C. The particle-size was determined by wet sieving and by sedimentation using the pipette sampling technique [44]. The relative elevation above the water level was estimated by the absolute elevation subtracting the low water level (145 m) of the reservoir. The average flooding duration (sum of days per year) was derived from daily water level data (http://xxfb.hydroinfo.gov.cn/).
2.5 Self-Organizing Map and statistical analysis
SOM provides projection of multidimensional matrix patterns into a two-dimensional map preserving the topology of the input data based on an unsupervised Kohonen’s learning algorithm [27]. SOM consists of one hexagonal grid formed by units called nodes, and a weight vector with the same dimensions as the number of input variables, associated with each node [45]. The main algorithms in the SOM are topology conserving mapping and vector quantization. Four different processes including vector initialization, competition, cooperation, and adaptive processes are implemented to eventually determine the coordinates for each corresponding observation in the map. More details and guidance regarding the SOM are provided in literature [29], [46].
In this study, input data vectors consisted of 7 soil nutrient variables and 9 relevant parameters (i.e., soil particle size composition, relative elevation, flooding duration, pH, bulk density, soil moisture and organic matter). Each data vector component was normalized in a scale from 0 to 1 after range scaled transformation to avoid the potential effect of magnitude difference among data vectors on the final map determination. The number of nodes was determined based on the number of samples or 5 to guarantee a small error [27], [45]. Here, SOM was trained with 72 nodes for each sampling times, corresponding to the 68 samples, and 56 nodes (≈5) for the total samples. Samples within the same node would be the most similar in terms of the variables considered, while more different samples were expected to be distant in the map.
In order to explain the results of the SOM, component planes were derived by taking the same component of the weight vectors in each of the map node. There are as many component planes as data variables (here 15 variables for before-submergence and 16 for after-submergence). The component plane provides an idea of the spread for a particular variable, and correlations between variables can be seen by comparing component planes (so that similar distributions show positive correlations while inverse distributions indicate negative correlations) [30]. SOM analyses were performed using MATLAB 7.9 for Microsoft Windows.
Multi-way ANOVA was performed to investigate the spatial variations in soil nutrients and characteristics after the normal distribution test and homogeneity test of variance. Least significant difference (LSD) test was used for the identification of the groups which differed significantly and Dunnett’s C test was also performed to analyze the differences when the parameters did not meet the homogeneity test of variance even by transformation. Paired-T test were performed to investigate the effects of sampling time on soil nutrients and characteristics. Stepwise least squares multiple regression with soil nutrient variables as dependent variables was carried out to assess relations among soil characteristics. All the processes were performed using SPSS 13.0 for Microsoft Windows.
Results
3.1. Soil nutrients variations
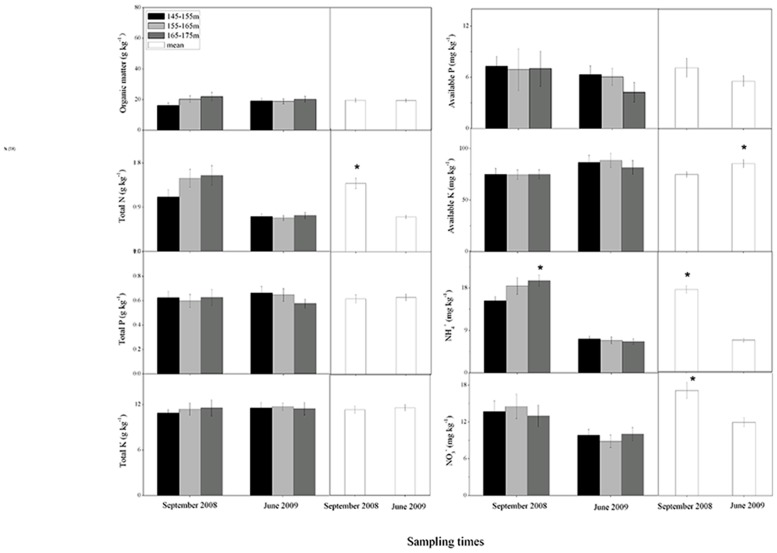
All nutrients except AK showed significant spatial variations among the upper, middle and lower reaches (p < 0.05 by ANOVA) with higher contents of OM, TN, and NO3 - in the lower reach (Site 1–4), and TP in the upper reach both before and after submergence (Table 1). There were no significant differences in soil nutrients among the three elevational intervals (i.e., 145–155, 155–165, 165–175) during the two sampling times, except for NH4 + with the highest level in the elevation of 165–175 m before submergence (Fig. 2). The concentration of AK significantly increased, while the levels of TN, NH4 +, and NO3 - decreased after the inundation (p < 0.001) (Fig. 2).
Table 1. Characteristics of soil nutrients before submergence (September 2008) and after submergence (June 2009) in the upper, middle and lower reaches of the water level fluctuation zone of the Three Gorges Reservoir (mean±SE).
| Before-submergence | After-submergence | |||||
|---|---|---|---|---|---|---|
| Upper (n = 20) | Middle(n = 24) | Lower (n = 24) | Upper (n = 20) | Middle (n = 24) | Lower (n = 24) | |
| pH | 7.45±0.07b | 7.22±0.15b | 7.74±0.05a | 8.26±0.03a | 7.88±0.16a | 8.03±0.12b |
| Bulk density (g cm-3) | 1.65±0.05ab | 1.71±0.04a | 1.58±0.04b | 1.39±0.04a | 1.47±0.04a | 1.49±0.03a |
| Soil water content (%) | 23.13±2.38a | 17.20±1.19a | 21.10±1.13a | 23.52±2.17a | 16.28±1.36b | 14.94±0.58b |
| Organic matter (g kg-1) | 13.59±1.31b | 16.18±1.79b | 27.11±2.22a | 16.65±1.15b | 16.72±1.05b | 23.93±2.27a |
| Total N (g kg-1) | 0.78±0.09c | 1.33±0.15b | 1.88±0.19a | 0.57±0.03b | 0.59±0.04b | 0.93±0.06a |
| Total P (g kg-1) | 0.71±0.02a | 0.70±0.07a | 0.47±0.03b | 0.82±0.04a | 0.64±0.04b | 0.48±0.03c |
| Total K (g kg-1) | 10.17±0.65a | 12.78±1.12a | 10.60±0.29a | 11.69±0.68ab | 12.83±0.81a | 10.23±0.42b |
| Available P (mg kg-1) | 6.10±0.87a | 10.55±2.81a | 4.28±0.43a | 6.70±1.15a | 6.69±1.32a | 3.46±0.39b |
| Available K (mg kg-1) | 81.53±6.39a | 70.68±2.73a | 74.46±5.33a | 74.94±4.46a | 87.50±6.11a | 90.95±7.75a |
| NH4 + (mg kg-1) | 18.14±0.80ab | 19.82±1.59a | 15.58±1.19b | 5.92±0.28a | 6.94±0.45a | 7.53±0.82a |
| NO3 - (mg kg-1) | 8.54±0.98b | 14.67±1.47a | 16.44±2.10a | 7.92±1.51b | 9.06±0.66ab | 11.28±0.88a |
Significant differences at α = 0.05 level (multi-way ANOVA) are indicated by different letters.
Fig 2. Soil nutrients at three elevation intervals and annual averages before submergence (September 2008) and after submergence (June 2009).
Note: asterisk (*) indicating significant differences at α = 0.05 level between elevation intervals for each sampling time and between annual averages.
3.2 Soil granulometric variations
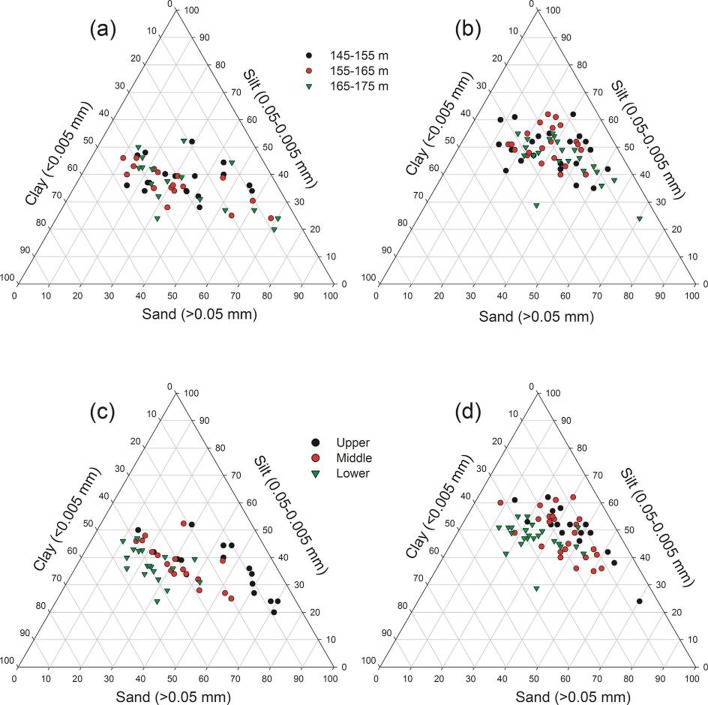
The soil particle size excepting silt showed significant spatial variation among the upper, middle and lower reaches (p < 0.05) with higher contents of sand in the upper reach and clay in the lower reach both before and after submergence (Fig. 3a, 3b). There were no significant differences in soil particle size among the three elevational intervals (p > 0.05) before submergence, while the soil particle size in the elevation of 155–165 m altered significantly with higher silt and lower sand contents after submergence (Fig. 3c, 3d). The silt content and soil pH significantly increased, and clay and bulk density decreased after submergence (p < 0.001) (Fig. 3; Table 2).
Fig 3. Spatial variations on soil particle size composition before submergence (September 2008) (a and c) and after submergence (June 2009) (b and d) in the water level fluctuation zone of the Three Gorges Reservoir.
Table 2. Environmental factors before submergence (September 2008) and after submergence (June 2009) (mean±SE) at three elevation intervals (i.e., 145–155m, 155–165, 165–175m).
| pH | Bulk density (g cm-3) | Soil water content (%) | Relative elevation (m) | Flooding duration (day) | |
|---|---|---|---|---|---|
| Before submergence | |||||
| 145–155 m (n = 22) | 7.65±0.05a | 1.69±0.04a | 21.46±1.93a | 3.29±0.91c | |
| 155–165 m (n = 22) | 7.43±0.12a | 1.64±0.05a | 19.87±1.28a | 15.29±0.78b | |
| 165–175 m (n = 24) | 7.34±0.14a | 1.60±0.05a | 19.33±1.47a | 23.57±1.57a | |
| Mean (n = 68) | 7.47±0.07B | 1.65±0.03A | 20.19±0.91A | ||
| After submergence | |||||
| 145–155 m (n = 22) | 8.15±0.04a | 1.44±0.04a | 18.14±1.44a | 3.29±0.91c | 261±7a |
| 155–165 m (n = 22) | 7.95±0.16a | 1.45±0.03a | 18.65±1.84a | 15.29±0.78b | 146±5b |
| 165–175 m (n = 24) | 8.02±0.15a | 1.49±0.04a | 16.37±1.37a | 23.57±1.57a | 79±14c |
| Mean (n = 68) | 8.04±0.07A | 1.46±0.02B | 17.68±0.89A | ||
Lowercase letters (a, b and c) demonstrate the effects of elevation on soil characteristics with significances at α = 0.05 level (tested by Multi-way ANOVA), uppercase letters (A and B) represent the effect of sampling time on soil characteristics with significant differences at α = 0.05 level (reflected by Paired-T test).
3.3 Relationship between soil nutrients and other relevant parameters
Regardless the submergence, OM was strongly positively correlated with TN, AK and NO3 -, sand negatively with TK, silt positively with TP and TK, and clay positively with OM and TN based on the SOM analysis (Figs. 4, 5). Before submergence, pH and BD were negatively related to AP and OM, respectively, and TP was positively related to TK (Fig. 4). After submergence, sand was negatively associated with TP and TK, pH was negatively associated with NH4 +, and relative elevation was negatively with TP and TK (Fig. 5).
Fig 4. Relationship among concentration of soil parameters, and relative elevation by the visualization of component planes in a SOM before submergence.
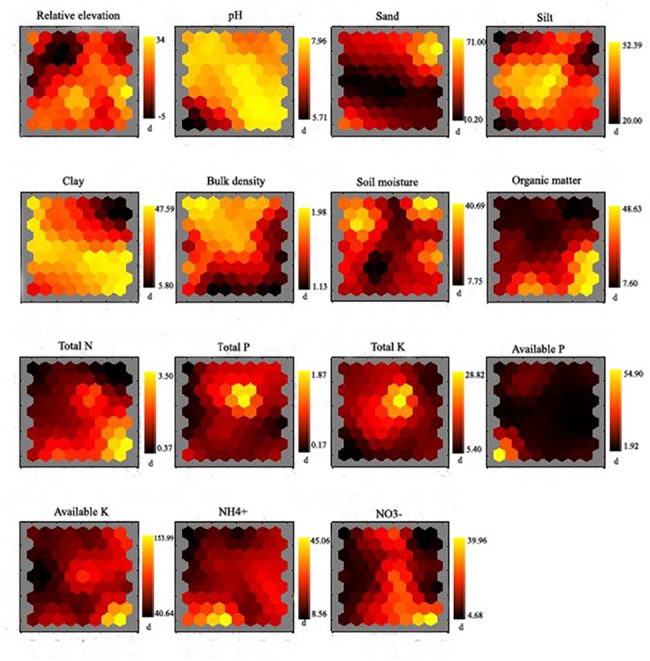
Vertical bars in the jet colormap present the measure values, i.e., relative elevation in (m), bulk density in (g cm-3), soil moisture and particle size composition in (%), total nutrients in (g kg-1), and available nutrients in (mg kg-1).
Fig 5. Relationship among concentration of soil parameters, relative elevation, and flooding duration by the visualization of component planes in a SOM after submergence.
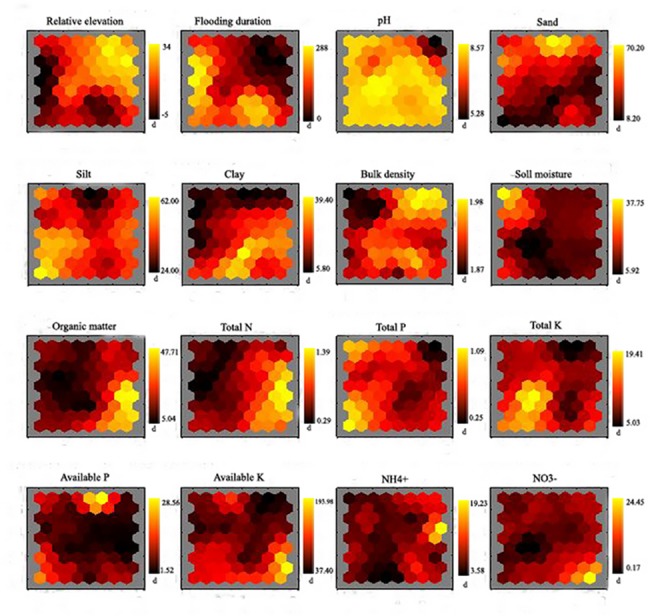
Vertical bars in the jet color map present the measure values, i.e., relative elevation in (m), flooding duration in (d), bulk density in (g cm-3), soil moisture and particle size composition in (%), total nutrients in (g kg-1), and available nutrients in (mg kg-1).
Stepwise multiple linear regression indicated that TN was predicable by OM both before and after submergence. Soil physical property was a very important predictor for soil nutrient contents, before submergence, while after submergence, only silt was one of the factors for TK. pH was also a very important predictor for soil nutrients (Table 3).
Table 3. Stepwise multiple regression models for soil nutrients before submergence (September 2008) and after submergence (June 2009) in the water level fluctuation zone of the Three Gorges Reservoir, China.
| Independent variables | Regression equations | R2 | Adjusted R2 | |
|---|---|---|---|---|
| Before submergence | ||||
| Total N (TN) | Organic matter (OM) | 0.140 + 0.064 OM | 0.654 b | 0.648 b |
| Total P (TP) | TK and Clay | 0.462 + 0.047 TK-0.014 Clay | 0.670 b | 0.659 b |
| Total K (TK) | TP and Sand | 9.712 + 10.516 TP—0.148 Sand | 0.631 b | 0.619 b |
| Avaliable P (AP) | pH | 79.051–9.639 pH | 0.331 b | 0.321 b |
| Available K (AK) | TN and Clay | 76.267 + 14.192 TN—0.706 Clay | 0.211 a | 0.186 a |
| NH4 + | OM and pH | 48.924 + 0.293 OM—4.933 pH | 0.429 b | 0.410 b |
| NO3 - | TN | 7.185 + 4.709 TN | 0.220 b | 0.207 b |
| After submergence | ||||
| TN | OM | 0.251 + 0.024 OM | 0.538 b | 0.531 b |
| TP | pH and AP | -0.933 + 0.180 pH + 0.021 AP | 0.455 b | 0.438 b |
| TK | Silt, OM and AK | 2.009 + 0.174 Silt—0.175 OM + 0.053 AK | 0.480 b | 0.455 b |
| AP | TP | -1.089 + 10.481 TP | 0.210 b | 0.197 b |
| AK | OM and TK | -8.092 + 2.023 OM + 4.702 TK | 0.419 b | 0.400 b |
| NH4 + | TN and pH | 20.305 + 3.302 TN—1.961 pH | 0.252 b | 0.228 b |
| NO3 - | OM | 5.084 + 0.232 OM | 0.175 a | 0.162 a |
Note: Sand: soil particle size greater than 0.05 mm; Silt: soil particle size between 0.05 and 0.005mm; Clay: soil particle size smaller than 0.005 mm;
a Significance at the 0.01 probability level;
b Significance at the 0.001 probability level.
3.4 Parameters dominating soil quality variation
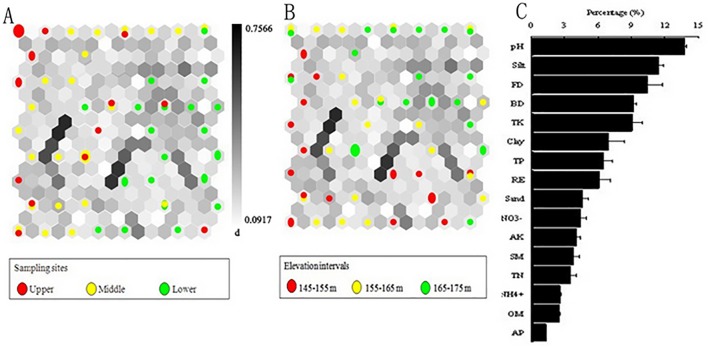
Figs. 6 and 7 illustrated the spatial variabilities of soil quality among the upper (red circles), middle (yellow circles) and lower reaches (green circles) in the WLFZ and their dominant influencing factors. Before submergence, the samples corresponding to the upper and lower reaches were concentrated in a more compact region in the map than those in the middle reach (Fig. 6A). Samples belonging to each elevation interval were evenly distributed (Fig. 6B). The pH and bulk density had significant effects on the boundaries constructed, and TP and TK had relatively more important effects on soil quality compared to other soil nutrients (Fig. 6C). After the submergence, samples belonging to each cluster were evenly distributed across the SOM map (Fig. 7A), while samples in the elevation of 145–155 m were concentrated in a more compact region than samples in other elevations (Fig. 7B). The pH and silt showed significant effects on the boundaries and were associated with TK and TP, while AP, OM, NH4 + and TN had lower impacts on the borders (Fig. 7C). Fig. 8 depicted the temporal variability of soil quality before submergence (red circles) and after submergence (green circles) in the WLFZ. The pH and sand were associated with TP and AK, and played an important role in the boundaries, whereas negligible or smaller effects were observed for TN, AP, clay and NH4 +.
Fig 6. Spatial difference of soil quality parameters before submergence: (A) hit histogram (i.e., data density indicated by the circle size) in a U-matrix illustrating the differences among sampling sites (upper-red circles, middle-yellow circles, and lower-green circles), (B) hit histogram indicating variations among three elevation intervals (145–155 m-red circles, 155–165 m-yellow circles, and 165–175 m-green circles), and (C) rank of significant parameters from the highest rank in the top to the lowest in the bottom.
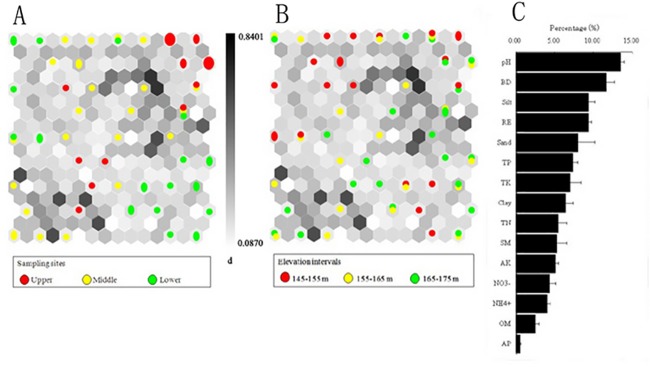
A larger circle denotes a higher density of the data in the hexagonal grid unit, and the grayscale is the U-matrix representing the Euclidean distance between the neighboring map units (i.e., grayscale located at the intermediate position between the units). Light regions imply a high degree of similarity between the units, whereas dark areas represent a large distance. Percentage statistics (means and standard error) for the rank are averaged based on the first four SOM units with larger Euclidean distance among data vectors (Ki et al., 2011).
Fig 7. Spatial difference of soil quality parameters after submergence: (A) hit histogram (i.e., data density indicated by the circle size) in a U-matrix for presenting differences among sampling sites including upper (red circles), middle (yellow circles) and lower (green circles), (B) hit histogram for indicating variations among three elevation intervals, i.e., 145–155 m (red circles), 155–165 m (yellow circles) and 165–175 m (green circles), and (C) rank of significant parameters from the highest rank in the top to the lowest in the bottom.
Symbols are similar to Fig. 6.
Fig 8. Temporal variations of soil quality parameters: (A) hit histogram (i.e., data density indicated by the circle size) in a U-matrix for presenting differences between before-submergence (red circles) and after-submergence (green circles), and (B) rank of significant parameters from the highest rank in the top to the lowest in the bottom.
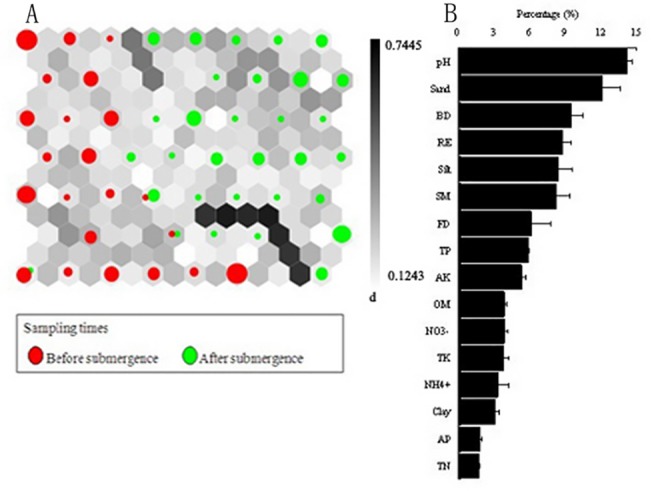
Symbols are similar to Fig. 6.
Discussion
4.1 Spatial variations in soil nutrients and dominant influencing factors
The changes of soil characteristics (i.e., soil particle size composition and pH) induced by inundation and anthropogenic activities understandably resulted in significant spatial variability in soil nutrients in the WLFZ (p < 0.05) both before submergence (September 2008) and after submergence (June 2009) (Tables 1 and 3). Similar observations were found elsewhere [2], [8], [25], [39], [47], [48]. Specific discussions are as follows. In the upper reach, turbulent flow would scour smaller soil particles away and leave much coarser sandy sediment with low organic materials (Table 3; Fig. 3,). Conversely, in the lower reach, calm water might have deposited a mixture of silt and clays being associated with enhanced concentrations of OM and TN (Figs. 3, 4, 5) [10]. The spatial variability of soil pH value also contributed to the spatial variations on soil nutrients such as AP and NH4 + by affecting the nutrient dissolution processes and thereby regulating the soil nutrient availability (Table 3) [6]. In addition, anthropogenic pollutants, i.e., domestic sewages and agricultural runoffs from upland [38], also contributed to higher nutrient contents in the lower reach (Site 9–12). For instance, Site 9 is located in Fengjie County with high population density and intensive agricultural activities which discharges a large amount of wastewater containing high loads of N (Fig. 1; Table 1) [38].
SOM toolbox was applied to assess the degree of influence of individual parameters (i.e., 7 soil nutrients, soil particle size composition, relative elevation, flooding duration, pH, bulk density, soil moisture and organic matter) [27]. Before submergence, intensive anthropogenic activities (i.e., high dense population in the upper reach and intensive agricultural activities in the lower reach) caused the relative concentrating distribution of soil quality in the upper and lower reaches (Fig. 6A), indicating that the soil quality in these regions was less variable.
To better illustrate the dissimilarity in soil quality among the upper, middle and lower reaches, we investigated which parameters played an important role in determining the spatial variation [31]. Before submergence, pH and bulk density had a significant effect on the boundaries constructed by SOM, while after submergence pH and silt played an important role in the borders (Figs. 6C, 7C), indicating that the soil particle size composition had been greatly altered during hydrologic processes. Moreover, TP and TK had relatively more important effects on the spatial variability of soil quality compared to other soil nutrients both before and after submergence (Figs. 6C, 7C), which implied that the non-point pollution by agricultural activities, i.e., the usage and discharge of fertilizer and pesticide, had greatly influenced soil quality by altering the contents of soil TP and TK. Compared to the findings obtained by the statistical analysis (i.e., multi-way ANOVA) (Table 1), the parameters were identified by SOM with little or no effect on the borders without measurable difference. However, there was disparity between the two analysis methods, especially for organic matter, TN and NO3 -, which could be attributed to the differences in the number of samples usable for the computation and calculation way (i.e., a reduced number or samples and training algorithm in SOM, and raw data and statistical calculations for the statistical analysis) [27]. Accordingly, these results revealed that the spatial variations on soil quality could be largely explained by soil pH and physical characteristics including soil particle size composition.
4.2 Changes in soil nutrients after submergence
Submergence could alter soil nutrients in the riparian zone directly by affecting their physical and chemical processes, including sorption-desorption and solution-dissolution processes and indirectly by altering the vegetation distribution [5], [7]. In the present study, submergence significantly decreased the soil TN, NH4 +, and NO3 - concentrations and increases the content of soil AK (Fig. 2). The decreases in soil NH4 + and NO3 - after the inundation were possibly due to the increase in soil pH after submergence (Table 2 and Fig. 2). The results were in consistent with the findings of Wang et al. [6], who demonstrated that the increased pH could reduce the availability of soil N, leading to the decrease in N species. Furthermore, the increase in AK and decrease in TN were related to the increased silt and decreased clay after inundation (Table 3; Figs. 2 to 5) [7]. Changes of soil granulometric nature could affect the sorption-desorption and soil microbial nitrogen processes (i.e., denitrification) and cause temporal fluctuations of nutrient concentrations [7], [10]. In addition, the periodic submergence could also regulate the soil nutrient dynamics by frequent material exchange between water and riparian zone, which was an equilibrium process of adsorption and release [6]. The WLFZ could absorb a mass of inorganic N from surface runoff in the exposed period, and release more inorganic N into the overlying water during submergence leading to the observed decreased in concentration of N after submergence (Fig. 2) [49]. Therefore, the risk of eutrophication seemed to increase in the Three Gorges Reservoir.
Decreases in plant diversity and richness by inundation also contributed to the temporal dynamics of soil nutrient [10], [11]. Six-month submergence in the WLFZ clears the most of the pre-dam vegetation and a bald zone is formed in the WLFZ before natural rehabilitation [37]. This could promote natural chemical weathering and thus partly contribute to the enhanced soil AK after submergence (Fig. 2) [6]. Moreover, denitrification is viewed as the dominant attenuation process that controls nitrogen fluxes along river systems [7], [15], [50]. Submergence-induced anaerobic soils and increase of organic matter by the decaying litter would promote microbial denitrification [15], [22], [51], leading to the decreased NO3 - during the submergence period (Fig. 2). Furthermore, vegetation decomposition after submergence may temporarily reduce the amount of inorganic N in the riparian zone (Fig. 2), because at the first stage of decomposition consumes nutrients from external sources [12]. Plant uptake of inorganic nutrients for growth is also an important process that was correlated to the decreases in soil NH4 +, and NO3 - concentrations after submergence (Fig. 2) [3], [15].
SOM analysis results revealed obviously temporal variations on soil quality after submergence (Fig. 8A). The soil quality in the upper and lower reaches were changed from relative concentrated distribution before submergence to even distribution after submergence (Figs. 6A, 7A), implying that submergence showed large effects on soil quality. Compared to other soil nutrients, pH and sand, associated with TP and AK played an important role in the boundaries constructed by SOM (Fig. 8C), implying that submergence had greatly influenced soil quality by changing soil pH and particle size composition. Our results indicated that the SOM has an additional benefit for describing dynamics of soil quality and identifying potential parameters such as pH and soil particle size characteristics that dominate temporal variation in soil quality. Albeit the inherent disparity between the two approaches exist due to the difference in computational schemes and the number of samples applied.
4.3 Impacts of depth and duration of inundation on soil parameters
Soil nutrients except for NH4 + did not show significant variations among different altitudes after submergence (June 2009) (Fig. 2), which implied little impact of flooding depth and duration on soil nutrients. However, after the submergence, there were significant differences in sand and silt among the elevation intervals (Fig. 3) and samples in the elevations of 145–155 m were concentrated in a more compact region than other samples (Fig. 7B). These results indicated that the flooding depth and duration had some impacts on soil particle size composition. However, it was relative a short time period for the formation of WLFZ and the environment is still in a state of transition. Thus, long-term field studies are necessary to extrapolate the flooding depth and duration effects on soil nutrients in the WLFZ.
4.4 Implications
Seeking appropriate approaches to restore and protect the riparian ecosystems will be essential for the sustainable development of the Three Gorges Reservoir and remain a high priority for the country. However, any efforts have to depend on the understandings of the environmental changes in the region. With the resident relocations, urbanization and economic development, pollutants from industrial and domestic wastewaters and agricultural runoffs have exceptionally affected the ecological environment in the reservoir region [40]. Our present study together with the investigation by Zhan et al. [49] highlighted that inorganic N absorbed by the WLFZ from surface runoffs in the exposed period would be largely released from soil into the overlying water during submergence period. Our previous studies also demonstrated that revegetation in the WLFZ could decrease soil inorganic N and potentially improve water quality [15]. Therefore, revegetation could be a sound practice for ecological restoration by planting native species to absorb large quantity of nutrients and reduce soil erosion.
Conclusion
Soil nutrients excepting AK showed significant spatial variability both before and after submergence in the water level fluctuation zone (WLFZ) of the Three Gorges Reservoir, China. Higher contents of OM, TN, and NO3 - in the lower reach and TP in the upper reach were closely related with soil particle size composition and anthropogenic pollutants including domestic sewages and agricultural runoffs. The increase in soil AK and decrease in AP, TN, NH4 +, and NO3 - after submergence resulted from changes of soil particle size composition and increased soil pH that greatly influenced the nutrient sorption-desorption and dissolution processes. SOM visualized the dynamic patterns of soil quality variables and identified potential parameters including pH, bulk density, soil particle size (i.e., silt and sand), and nutrients (TP, TK and AK) as the primary determinants for the spatial and temporal variations of soil quality. Our results provided a clear evidence that riparian ecosystems respond differently to the inundation [22], [26], which in turn provides strategies for revegetation and water quality protection.
Acknowledgments
We would like to thank Shuduan Tan, Zhixi Wang, Qiliang Yin, and Chuan Wu for their assistance during fieldwork, and Pingcai Yan for the assistance on the laboratory analyses. We also would like to thank Xiaoli Cheng for editing the manuscript.
Data Availability
All relevant data are within the paper.
Funding Statement
This work was supported by National Natural Science Foundation of China (No. 31130010, 31300441 and 31100347) and the Executive Office of the State Council Three Gorges Construction Committee (SX2011-037). The funders had no role in study design, data collection and analysis, decsion to publish, or preparation of the manuscript.
References
- 1. Liu WZ, Li SY, Bu HM, Zhang QF. Eutrophication in the Yunnan Plateau lakes: the influence of lake morphology, watershed land use, and socioeconomic factors. Environ Sci Pollut Res. 2012; 19: 858–870. 10.1007/s11356-011-0616-z [DOI] [PubMed] [Google Scholar]
- 2. Li S, Gu S, Tan X, Zhang Q. Water quality in the upper Han River basin, China: the impacts of land use/land cover in riparian buffer zone. J Hazard Mater. 2009; 165: 317–324. 10.1016/j.jhazmat.2008.09.123 [DOI] [PubMed] [Google Scholar]
- 3. Casey RE, Taylor MD, Klaine SJ. Mechanisms of nutrient attenuation in a subsurface flow riparian wetland. J Environ Qual. 2001; 30: 1732–1737. [DOI] [PubMed] [Google Scholar]
- 4. Weissteiner CJ, Bouraoui F, Aloe A. Reduction of nitrogen and phosphorus loads to European rivers by riparian buffer zones. Knowl Managt Aquatic Ecosyst. 2013; 408: 08. [Google Scholar]
- 5. Schramm HL Jr, Cox MS, Tietjen TE, Ezell AW. Nutrient dynamics in the lower Mississippi River floodplain: Comparing present and historic hydrologic conditions. Wetlands. 2009; 29: 476–487. [Google Scholar]
- 6. Wang XR, Cheng RM, Xiao WF, Guo QS, Feng XH. Soil nutrient characteristics in juvenile water level fluctuating zone of Three Gorges Reservoir. Chinese Journal of Ecology. 2010; 29: 281–289. [Google Scholar]
- 7. Pinay G, Black VJ, Planty-Tabacchi AM, Gumiero B, Décamps H. Geomorphic control of denitrification in large river floodplain soils. Biogeochemistry. 2000; 50: 163–182. [Google Scholar]
- 8. Meynendonckx J, Heuvelmans G, Muys B, Feyen J. Effects of watershed and riparian zone characteristics on nutrient concentrations in the River Scheldt Basin. Hydrology and Earth System Sciences Discussion. 2006; 3: 653–679. [Google Scholar]
- 9. Beumer V, Van Wirdum G, Beltman B, Griffioen J, Grootjans AP, Verhoeven JTA. Geochemistry and flooding as determining factors of plant species composition in Dutch winter-flooded riverine grasslands. Sci Total Environ. 2008; 402: 70–81. 10.1016/j.scitotenv.2008.03.044 [DOI] [PubMed] [Google Scholar]
- 10. Brunet RC, Astin KB. Spatio-temporal variations in sediment nutrient levlels: the River Adour. Landscape Ecol. 1997; 12: 171–184. [Google Scholar]
- 11. Schade JD, Fisher SG, Grimm NB, Seddon JA. The influence of a riparian shrub on nitrogen cycling in a sonoran desert stream. Ecology. 2001; 82: 3363–3376. [Google Scholar]
- 12. Hefting MM, Clementm JC, Bienkowskim P, Dowrick D, Guenat C, Butturini A, et al. The role of vegetation and litter in the nitrogen dynamics of riparian buffer zones in Europe. Ecol Eng. 2005; 24: 465–482. [Google Scholar]
- 13. Forshay KJ, Dodson SI. Macrophyte presence is an indicator of enhanced denitrification and nitrification in sediments of a temperate restored agricultural stream. Hydrobiologia. 2011; 668: 21–34. [Google Scholar]
- 14. West JB, Hobble S, Reich PB. Effect of plant species diversity, atmospheric [CO2], and N addition on gross rates of inorganic N release from soil organic matter. Global Change Biol. 2006; 12: 1400–1408. [Google Scholar]
- 15. Ye C, Cheng XL, Zhang YL, Wang ZX, Zhang QF. Soil nitrogen dynamics following short-term revegetation in the water level fluctuation zone of the Three Gorges Reservoir, China. Ecol Eng. 2012; 38: 37–44. [Google Scholar]
- 16. Knoepp JD, Vose JM. Regulation of nitrogen mineralization and nitrification Southern Appalachian ecosystems: Separating the relative importance of biotic vs. abiotic controls. Pedobiologia. 2007; 51: 89–97. [Google Scholar]
- 17. Pinay G, Clément JC, Naiman RJ. Basic Principles and Ecological Consequences of Changing Water Regimes on Nitrogen Cycling in Fluvial Systems. Environ Manage. 2002; 30: 481–491. [DOI] [PubMed] [Google Scholar]
- 18. Venterink HO, Davidsson TE, Kiehl K, Leonardson L. Impact of drying and re-wetting on N, P and K dynamics in a wetland soil. Plant Soil. 2002; 243: 119–130. [Google Scholar]
- 19. Gergel SE, Carpenter SR, Stanley EH. Do dams and levees impact nitrogen cycling? Simulating the effect of flood alternations on floodplain denitrification. Global Change Biol. 2005; 11: 1352–1367. [Google Scholar]
- 20. De Jonge VN, Van Beusekom JEE. Wind tide-induced resuspended of sediment and microphytobenthos from tidal flats of the Ems estuary. Limnol Oceanogr. 1995; 40: 766–778. [Google Scholar]
- 21. Antheunisse AM, Loeb R, Miletto M, Lamers LPM, Laanbroek HJ, Verhoeven JTA. Response of nitrogen dynamics in semi-natural and agricultural grassland soils to experimental variation in tide and salinity. Plant Soil. 2007; 292: 45–61. [Google Scholar]
- 22. Forshay KJ, Stanley EH. Rapid nitrate loss and denitrification in a temperate river floodplain. Biogeochemistry. 2005; 75: 43–64. [Google Scholar]
- 23. Brady NC, Weil RR. The nature and properties of soils, fourteenth edition, Pearson, Columbus, OH, USA; 2008. [Google Scholar]
- 24. Kennedy RH, Walker WW. Reservoir nutrient dynamics, Reservoir limnology: Ecological perspective, Wiley; 1990. [Google Scholar]
- 25. Hoffmann CC, Berg P, Dahl M, Larsen SE, Andersen HE, Andersen B. Groundwater flow and transport of nutrients through a riparian meadow—Field data and modeling. J Hydrol. 2006; 331: 315–335. [Google Scholar]
- 26. Zhang QF, Lou ZP. The environmental changes and mitigation actions in the Three Gorges Reservoir region, China. Environ Sci Policy. 2011; 14: 1132–1138. [Google Scholar]
- 27. Ki SJ, Kang JH, Lee SW, Lee YS, Cho KH, An KG, et al. Advancing assessment and design of stormwater monitoring programs using a self-organizing map: Characterization of trace metal concentration profiles in stormwater runoff. Water Res. 2011; 45: 4183–4197. 10.1016/j.watres.2011.05.021 [DOI] [PubMed] [Google Scholar]
- 28. Cho KH, Kang JH, Ki SJ, Park Y, Cha SM, Kim JH. Determination of the optimal parameters in regression models for the prediction of chlorophyll-a: a case study of the Yeongsan reservoir, Korea. Sci Total Environ. 2009; 407: 2536–2545. 10.1016/j.scitotenv.2009.01.017 [DOI] [PubMed] [Google Scholar]
- 29. Kohonen T. Self-organizing Maps. 3rd ed. Springer: Berlin; 2001. [Google Scholar]
- 30. Alvarez-Guerra M, González-Piñuela C, Andrés A, Galán B, Viguri JR. Assessment of Self-Organizing Map artificial neural networks for the classification of sediment quality. Environ Int. 2008; 34: 782–790. 10.1016/j.envint.2008.01.006 [DOI] [PubMed] [Google Scholar]
- 31. Liu Y, Weisberg RH. A review of Self-Organizing Map applications in meteorology and oceanography, In: Mwasiagi JI, editor. Self-Organizing Maps-applications and novel algorithm design In Tech. 2011; 253–72. [Google Scholar]
- 32. Baxter RM. Environmental effects of dams and impoundments. Annu Rev Ecol Syst. 1977; 8: 255–283. [Google Scholar]
- 33. McCartney M. Living with dams: managing the environmental impacts. Water Policy. 2009; 11: 121–139. [Google Scholar]
- 34. Ludwig W, Dumont E, Meybeck M, Heussner S. River discharges of water and nutrients to the Mediterranean and Black Sea: major drivers for ecosystem changes during past and future decades? Prog Oceanogr. 2009; 80: 199–217. [Google Scholar]
- 35. Zhou JJ, Zhang M, Lu PY. The effect of dams on phosphorus in the middle and lower Yangtze river. Water Resour Res. 2013; 49: 3659–3669. [Google Scholar]
- 36. Liu WZ, Liu GH, Liu H, Song Y, Zhang QF. Subtropical reservoir shorelines have reduced plant species and functional richness compared with adjacent riparian wetlands. Environ Res Lett. 2013; 8: 044007. [Google Scholar]
- 37. New T, Xie ZQ. Impact of large dams on riparian vegetation: applying global experience to the case of China’s Three Gorges Dam. Biodivers Conserv. 2008; 17: 3149–3163. [Google Scholar]
- 38. State Environmental Protection Administration of China (SEPA). Ecological and Environmental Monitoring Communique on the Three Gorges Project, Beijing: China Environmental Science Press; 2009. [Google Scholar]
- 39. Ye C, Zhang K, Deng Q, Zhang QF. Plant communities in relation to flooding and soil characteristics in the water level fluctuation zone of the Three Gorges Reservoir, China. Environ Sci Pollut R. 2013; 20: 1794–1802. 10.1007/s11356-012-1148-x [DOI] [PubMed] [Google Scholar]
- 40. Ye C, Li SY, Zhang YL, Zhang QF. Assessing soil heavy metal pollution in the water-level-fluctuation zone of the Three Gorges Reservoir, China. J Hazard Mater. 2011; 191: 366–372. 10.1016/j.jhazmat.2011.04.090 [DOI] [PubMed] [Google Scholar]
- 41. Lu ZJ, Li LF, Huang HD, Tao M, Zhang QF, Jiang MX. Preliminary effects of impounding on vegetation in drawdown zone of the Three Gorges Reservoir Region. Journal of Wuhan Botanical Research. 2010a; 28: 303–314. [Google Scholar]
- 42. Lu ZJ, Li LF, Jiang MX, Huang HD, Bao DC. Can the soil seed bank contribute to revegetation of the drawdown zone in the Three Gorges Reservoir Region? Plant Ecol. 2010b; 209: 153–165. [Google Scholar]
- 43. Keeney DR, Nelson DW. Nitrogen-inorganic forms In: Chemical and Microbiological Properties. ASA-SSSA Publisher; 1982; 643–698. [Google Scholar]
- 44. Rinklebe J, Langer U. Microbial diversity in three floodplain soils at the Elbe River (Germany). Soil Biol Biochem. 2006; 38: 2144–2151. [Google Scholar]
- 45. Subida MD, Berihuete A, Drake P, Blasco J. Multivariate methods and artificial neural networks in the assessment of the response of infanual assemblages to sediment metal contamination and organic enrichment. Sci Total Environ. 2013; 450–451: 289–300. [DOI] [PubMed] [Google Scholar]
- 46. Bieroza M, Baker A, Bridgeman J. Classification and calibration of organic matter fluorescence data with multiway analysis methods and artificial neural networks: an operational tool for improved drinking water treatment. Environmetrics. 2011; 22: 256–270. [Google Scholar]
- 47. Wang HJ, Li XW, Shi XZ, Yu DS. Distribution of soil nutrient under different land use and relationship between soil nutrient and soil granule composition. Journal of Soil and Water Conservation. 2003; 17: 44–47. [Google Scholar]
- 48. Li S, Gu S, Liu W, Han H, Zhang Q. Water quality in relation to the land use and land cover in the Upper Han River basin, China. Catena. 2008; 75: 216–222. [Google Scholar]
- 49. Zhan YH, Wang LA, Jiao YJ. Adsorption and release of nitrogen of soils in Three Gorges Reservoir. Journal of Chongqing University (Nature Science Edition). 2006; 29: 10–13. [Google Scholar]
- 50. Rivett MO, Buss SR, Morgan P, Smith JWN, Bemment CD. Nitrate attenuation in groundwater: A review of biogeochemical controlling processes. Water Res. 2008; 42: 4215–4232. 10.1016/j.watres.2008.07.020 [DOI] [PubMed] [Google Scholar]
- 51. Burt TP, Bates PD, Stewart MD, Claxton AJ, Anderson MG, Price DA. Water table fluctuations within the floodplain of the River Severn, England. J Hydrol. 2002; 262: 1–20. [Google Scholar]
- 52. Ye C, Cheng XL, Zhang QF. Recovery approach affects soil quality in the water level fluctuation zone of the Three Gorges Reservoir, China: implications for revegetation. Environ Sci Pollut Res. 2014; 21: 2018–2031. [DOI] [PubMed] [Google Scholar]
Associated Data
This section collects any data citations, data availability statements, or supplementary materials included in this article.
Data Availability Statement
All relevant data are within the paper.


