

Abstract
Endosomal-lysosomal and autophagic dysregulation occurs in the hippocampus in prodromal Alzheimer disease (AD), but its relationship with β-amyloid (Aβ) and tau pathology remain unclear. To investigate this issue, we performed immunoblot analysis of hippocampal homogenates from cases with an antemortem clinical diagnosis of no cognitive impairment, mild cognitive impairment (MCI) and AD. Western blot analysis revealed significant increases in the acid hydrolase cathepsin D (Cat D) and early endosome marker rabaptin5 in the MCI group compared to AD, whereas levels of phosphorylated mammalian target of rapamycin (mTOR) proteins, total mTOR, p62, traf6 and LilrB2 were comparable across clinical groups. Hippocampal Aβ1-40 and Aβ1-42 concentrations and AT8-immunopositive neurofibrillary tangle density were not significantly different across the clinical groups. Greater Cat D expression was associated with Global Cognitive Score and episodic memory score, but not with Mini Mental State Examination or advanced neuropathology criteria. These results indicate that alterations in hippocampal endosomal-lysosomal proteins in MCI are independent of tau or Aβ pathology.
Keywords: Alzheimer disease, Autophagy, Cathepsin D, Endosomal-lysosomal proteins, Hippocampus, Mild cognitive impairment, mTOR, Rabaptin5
INTRODUCTION
The endosomal-lysosomal and autophagic-lysosomal systems play critical roles in obtaining energy, sorting proteins, signaling, clearing damaged organelles and abnormal proteins, and cell survival (1). Alterations in these trafficking and degradative pathways are also implicated in the pathogenesis of neurodegenerative diseases, including Alzheimer disease (AD) (2–9). The hallmark pathological features in the brains of patients with AD are β-amyloid (Aβ) plaques and hyperphosphorylated tau-containing neurofibrillary tangles (NFTs). The newly described Aβ oligomer receptor, murine-paired immunoglobulin-like receptor B and its human ortholog, leukocyte immunoglobulin-like receptor B2 (LilrB2), have been implicated in synaptic dysfunction (10), which is a major pathologic correlate of cognitive impairment in AD (11–13); however, its role in the clinical pathobiology of AD remains unclear.
Endosomal-lysosomal pathways enable neurons to degrade, process and recycle extracellular molecules by the fusion of a series of vacuoles known as early and late endosomes and lysosomes (Fig. 1). Of particular interest is the observation that endosomal-lysosomal-related dysfunction in AD occurs prior to the appearance of Aβ and tau pathology (14, 15). The endosomal-lysosomal pathway plays a key role in amyloid precursor protein processing and Aβ generation (16–19), and perturbations in this pathway could stimulate neuronal Aβ production or impair its clearance. Enlarged early endosomes have been reported in pyramidal cortical neurons prior to Aβ plaque deposition in sporadic AD (15, 20). Altered endosomal and lysosomal proteins and gene expression levels in the hippocampus were detected in mild cognitive impairment (MCI) (21, 22). Cathepsin D (Cat D), the main acid hydrolase in human lysosomes, has also been implicated in the pathogenesis of AD (23–26) and preserved cortical and hippocampal pyramidal neurons have elevated levels of Cat D in AD (14, 27). These observations suggest that activation of the endosomal-lysosomal system in vulnerable neurons is a compensatory response to AD pathology (14). In contrast, alterations in Cat D, and inhibition of autophagy are associated with tau aggregation and NFT formation (28, 29).
Figure 1.

Schematic diagram illustrating the different elements of the endosomal-lysosomal and autophagy pathways and their relationship to Cathepsin D (Cat D), rabaptin5, rabs (4, 5 and 7), mTOR, p62 and traf6 proteins. E. Reticulum, endoplasmic reticulum. mTOR, mammalian target of rapamycin.
Autophagy recycles proteins and organelles and plays a critical role in cytoprotection preventing the accumulation of misfolded proteins, and autophagosome and lysosomes are essential components in the autophagy process (Fig. 1). A body of evidence has accumulated that supports the role of autophagy in the pathogenesis of AD (30, 31). Reports suggest that the mammalian target of rapamycin (mTOR), a ubiquitous protein kinase, is important in autophagy regulation and tau phosphorylation (7, 32). Increased mTOR protein expression occurs in select neurons in severe AD (33), and inhibition of mTOR signaling induces autophagy, reduces tau and Aβ pathology and ameliorates behavioral deficits in young transgenic mice overexpressing Aβ and tau (34–37). The signaling adaptor protein, p62, which binds raptor, an integral component of the mTORC1 pathway and interacts with tumor necrosis factor receptor-associated factor 6 (traf6), is required for mTORC1 translocation to the lysosome and its subsequent activation (38). In the cerebral cortex of AD patients, pyramidal neurons display p62 immunoreactivity in early stages of NFT evolution (39, 40). In vitro studies also show that p62 inhibits Aβ induced cell death via the pan-neurotrophin p75NTR receptor (41). Taken together, these data suggest that disturbances in various components of the endosomal-lysosomal and autophagic pathways may be involved in neuronal vulnerability in AD. Whether endocytic-lysosomal and autophagy dysregulation is associated with tau and Aβ aggregation or with changes in the Aβ oligomer receptor LilrB2 (the putative toxic moiety underlying synaptic loss in AD) during the onset of AD are unclear.
The hippocampus is one of the first brain structures to develop neurodegenerative changes in AD, undergoing profuse NFT but lesser amyloid pathology in the early stages of AD (42, 43). Upregulation of hippocampal gene expression transcripts (mRNA) for select early (rab4, rab5) and late (rab7) endosome markers and protein levels (rab5 and rab7) in MCI was associated with impaired cognitive function (21, 22). The present report evaluates several endosomal, lysosomal, and autophagic proteins in relation to Aβ and tau pathology within hippocampus obtained from subjects enrolled in the Rush Religious Orders Study (RROS), a well-established clinical pathological study of aging, cognition, and AD in retired clergy (44, 45).
MATERIALS AND METHODS
Subjects
Hippocampal tissue obtained from 39 RROS cases with an antemortem clinical diagnosis of no cognitive impairment (NCI) (n = 10), MCI (n = 15), and AD (n = 14, Mini Mental State Examination [MMSE] ≤9), was examined. The Human Research Committees of Rush University Medical Center approved this study and written informed consent for research and autopsy was obtained from the participants or their family/guardians.
Clinical and Neuropathological Evaluation
Details of the clinical evaluation and criteria for diagnosis of AD and MCI in the RROS cohort have been published elsewhere (43–45). Briefly, the present study was performed using preclinical classification to determine case groups. The RROS is a clinical pathological longitudinal study consisting of elderly retired Catholic clergy. To enter the study, each participant had to have had no cognitive impairment and be at least 65 years of age at the time of enrollment. Subjects received a cognitive assessment each year while enrolled in the RROS. During the course of the study, people died with differing clinical diagnoses including NCI, MCI and AD. At death, a board-certified neuropathologist performed a detailed neuropathological evaluation. All studies using RROS samples followed the same experimental design, that is, tissue is distributed based on a final clinical diagnosis. All experiments were performed blinded to the clinical diagnosis and all samples were coded. Average time from the last clinical evaluation to death was ~8 months. Neuropsychological testing included the MMSE and Global Cognitive Score, a composite z-score compiled from a battery of 19 cognitive tests (44). An episodic memory z-score, which is more specific for hippocampal function, was computed based on 7 of the cognitive tests. Among the RROS MCI cases, 4 were amnestic MCI. A final clinical diagnosis was assigned after consensus conferences of neurologists and neuropsychologists who reviewed all relevant clinical data and information collected. Neuropathological diagnoses were based on Braak staging of NFTs (42), NIA-Reagan criteria (46), and recommendations of the Consortium to Establish a Registry for Alzheimer’s Disease (CERAD) (47). Cases with pathology other than AD (e.g. stroke, Parkinson disease, Lewy body dementia, hippocampal sclerosis) were excluded from the study. None of the cases examined was treated with acetylcholinesterase inhibitors. Table 1 details the clinical, demographic and neuropathological characteristics of the RROS cases used in the current study. The new guidelines for the neuropathological evaluation of AD require data related to inclusions displaying the transactive response DNA-binding protein of 43 kDa (TDP-43) (48). The Rush neuropathology core is in the processes of evaluating all RROS cases for TDP-43 inclusions. Therefore, at this time we are only able to present TDP-43 data on a subgroup of the RROS cases used in the present investigation (Table 2).
Table 1.
Clinical, demographic, and neuropathological characteristics by diagnosis category
| Clinical Diagnosis | |||||||
|---|---|---|---|---|---|---|---|
| NCI (n=10) | MCI* (n=15) | AD (n=14) | Total (n=39) | P value | Pair-wise comparison | ||
| Age (years) at death: | Mean ± SD (Range) | 83.7 ± 4.8 (76.3–92.5) | 85.9 ± 4.0 (79.4–91.5) | 87.7 ± 5.7 (76.4–97.8) | 85.5 ± 5.0 (76.3–97.8) | 0.2a | -- |
| Number (%) of males: | 4 (40%) | 6 (40%) | 6 (43%) | 16 (40%) | 1.0b | -- | |
| Years of education: | Mean ± SD (Range) | 17.1 ± 4.7 (10–25) | 17.6 ± 3.5 (10–25) | 19.1 ± 3.3 (14–26) | 18.0 ± 3.8 (10–26) | 0.4a | -- |
| Number (%) with ApoE ε4 allele: | 0 | 5 (33%) | 4 (29%) | 9 (23%) | 0.1b | -- | |
| MMSE: | Mean ± SD (Range) | 27.6 ± 1.5 (26–30) | 27.4 ± 2.7 (22–30) | 19.6 ± 6.3 (9–28) | 24.6 ± 5.6 (9–30) | 0.0001a | (NCI, MCI) > AD |
| GCS** | Mean ± SD (Range) | 0.47 ± 0.17 (0.23–0.78) | 0.24 ± 0.37 (−0.53, 0.91) | −0.51 ± 0.32 (−1.17, −0.12) | 0.05 ± 0.51 (−1.17, 0.91) | <0.0001a | (NCI, MCI) > AD |
| Episodic memory z-score: | Mean ± SD (Range) | 0.85 ± 0.31 (0.32–1.37) | 0.45 ± 0.45 (−0.25, 1.68) | −0.71 ± 0.66 (−1.99, 0.65) | 0.14 ± 0.83 (−1.99, 1.68) | <0.0001a | NCI > MCI > AD |
| Post-mortem interval (hours): | Mean ± SD (Range) | 5.0 ± 2.6 (1.0–9.1) | 5.6 ± 2.3 (2.0–10.6) | 4.2 ± 1.6 (1.5–7.3) | 4.9 ± 2.2 (1.0–10.6) | 0.3a | -- |
| Brain weight (g): | Mean ± SD (Range) | 1194 ± 104 (1000–1320) | 1168 ± 164 (890–1480) | 1188 ± 129 (962–1460) | 1182 ± 135 (890–1480) | 0.8a | -- |
| Distribution of Braak scores: | 0 | 0 | 0 | 0 | 0 | ||
| I/II | 3 | 3 | 1 | 7 | 0.2 | -- | |
| III/IV | 6 | 9 | 8 | 23 | |||
| V/VI | 1 | 3 | 5 | 9 | |||
| NIA Reagan diagnosis (likelihood of AD): | No AD | 0 | 0 | 0 | 0 | ||
| Low | 5 | 7 | 1 | 13 | 0.03a | NCI < AD | |
| Intermediate | 5 | 5 | 9 | 19 | |||
| High | 0 | 3 | 4 | 7 | |||
| CERAD diagnosis: | No AD | 2 | 5 | 0 | 7 | ||
| Possible | 2 | 1 | 0 | 3 | 0.005a | (NCI, MCI) < AD | |
| Probable | 6 | 6 | 7 | 19 | |||
| Definite | 0 | 3 | 7 | 10 | |||
4 of the 15 MCI cases were amnestic MCI.
GCS not available for 1 AD case.
Kruskal-Wallis test, with Bonferroni correction for multiple comparisons.
Fisher exact test, with Bonferroni correction for multiple comparisons; GCS global cognitive score; SD, Standard deviation; MMSE, Mini-Mental State Examination; NCI, no cognitive impairment, MCI; mild cognitive impairment; AD, Alzheimer disease; CERAD, Consortium to Establish a Registry for Alzheimer’s Disease.
Table 2.
Summary of TDP-43 positive Rush Religious Orders Study cases by clinical diagnosis
| NCI n = 3 |
MCI n = 11 |
AD n = 7 |
|
|---|---|---|---|
| CA1 | 0 (0%)* | 0 (0%) | 3 (42%) |
| Dentate gyrus | 0 (0%) | 0 (0%) | 2 (28%) |
| Entorhinal | 0 (0%) | 1 (1.1%) | 4 (57%) |
| Amygdala | 2 (66%) | 3 (27%) | 4 (57%) |
| Middle temporal cortex a | 0 (0%) | 0 (0%) | 0 (0%) |
| Middle frontal cortex b | 0 (0%) | 0 (0%) | 0 (0%) |
Percentage of total cases
21 Brodmann area
9/46 Brodmann areas
NCI, no cognitive impairment, MCI; mild cognitive impairment; AD, Alzheimer disease
Tissue Samples
Fresh hippocampal tissue, at the level of the lateral geniculate nucleus were dissected free of white matter on dry ice and frozen at −80°C until the time of biochemical assay. Frozen hippocampus was homogenized (150 mg/ml) on ice in phosphate-buffered saline and immediately divided into 2 aliquots. One aliquot was added to a homogenization buffer (250 mM sucrose, 20 mM Tris base) containing protease inhibitors (P8340; Sigma, St. Louis, MO) and divided into2 aliquots; one was used for the Aβ enzyme-linked immunosorbent assay (ELISA) and the second aliquot was diluted to 10 mg tissue/ml with potassium phosphate-buffered saline ([PBS], pH 7.4) for Western blotting. In addition, 20-μm-thick hippocampal paraffin embedded sections belonging to the same cases used for biochemistry were immunostained to determine relative numbers of NFTs in the hippocampus.
Antibodies
The antibodies used are commercially available and their specificity has been characterized from each company technical department. The antibodies, dilutions, sources and references are listed in Table 3.
Table 3.
Primary antibodies
| Antigen | Antibodies | Epitope or Immunogen | Dilution | Company; Catalog # (References) |
|---|---|---|---|---|
| rab5 | rabbit to human rab5A | C-terminus of human rab5A | 1:500 | Santa Cruz Biotechnology, Dallas, TX, # sc-309 (21, 22, 49, 50) |
| Cat D | mouse to human Cathepsin D [4G2] | 21-421 aa of E. coli Cathepsin D | 1:500 | LifeSpan BioSciences, Seattle, WA, #LS-B2931 |
| rabaptin5 | mouse to human rabaptin5 | 247-417 aa of human rabaptin5 | 1:500 | BD Biosciences, San Jose, CA, # 610676 (51, 52) |
| p62 | monoclonal to SQSTM1/p62 [EPR4844] | Human SQSTM1 sequence | 1:500 | Abcam, Cambridge, MA, # ab109012 (53) |
| traf6 | rabbit to traf6 | MATH domain of human traf6 | 1:200 | Millipore, Billerica, MA, # 06-1110 |
| pmTOR(s2481) | monoclonal to mTOR (phospho s2481) [EPR247(N)] | phospho-Ser 2481 of human mTOR | 1:500 | Abcam, # ab137133 |
| pmTOR(s2448) | monoclonal to mTOR (phospho s2448) [EPR246(2)] | phospho-Ser 2448 of human mTOR | 1:1000 | Abcam, # ab109268 (54, 55) |
| mTOR | rabbit to mTOR [7C10] | Ser2481 of human mTOR | 1:1000 | Cell Signaling Technology, Danvers, MA, # 2983S (56-58) |
| LilrB2 | mouse to LilrB2 | 22-599 aa of human LilrB2 | 1:500 | Abcam; # ab56696 (59) |
| β-tubulin | mouse to β-tubulin [KMX-1 clone] | tubulin from P. myxamoebae | 1:500 | Millipore, # MAB3408 (43, 60, 61) |
| β-tubulin | rabbit to β-tubulin | human β-tulubin | 1:500 | Cell Signaling Technology, #2146S (62) |
| Tau (AT8) | mouse monoclonal to phosphorylated tau | phospho-Ser202, phospho-Thr 205 | 1:500 | Fisher Scientific, Philadelphia, PA, # MN1020 (61, 63, 64) |
mTOR, mammalian target of rapamycin; pmTOR, phosphorylated mTOR; LilrB2, leukocyte immunoglobulin-like receptor B2.
Quantitative Immunoblotting
Sample proteins for all 39 cases examined were denatured in sodium dodecyl sulfate (SDS) loading buffer to a final concentration of 5 mg/ml. Proteins (50 μg/sample) were separated by 8%–16% or 7.5% SDS-PAGE (Lonza, Rockland, ME and Invitrogen, Grand Island, NY) and transferred to polyvinylidene fluoride membranes (Immobilon P, Millipore, Billerica, MA) electrophoretically at the same time (43, 65). Membranes were first blocked in Tris-buffered saline (TBS)/0.05%Tween-20/5% milk for 60 minutes at room temperature and primary antibodies were added to blocking buffer. After 30-minute primary antibody incubation, membranes were incubated overnight at 4°C. After washes (TBS/0.05% Tween-20), membranes were incubated for 1 hour at room temperature with horseradish peroxidase-conjugate goat anti-mouse IgG secondary antibody (1:8000, Pierce, Rockford, IL) or horseradish peroxidase-conjugated goat-anti rabbit IgG secondary antibody (1:5000, Bio-Rad, Hercules, CA). Immunoreactivity was visualized by enhanced chemiluminescence (Pierce) on a Kodak Image Station 440CF (20.5 x 18.5 screen; Perkin-Elmer, Wellesley, MA). Hippocampal protein immunoreactive signals were normalized to β-tubulin signals. Samples from the 3 groups were loaded in each run in random fashion and analyzed in three independent experiments (22, 43). For each antibody only 1 band at the appropriate kDa was seen on Western blot.
Aβ ELISA
Concentrations of soluble and insoluble Aβ1-42 and Aβ1-40 peptides were quantified as described previously (61, 66). Diethylamine soluble fraction was prepared by centrifuging the hippocampus homogenates at 135,000 x g at 4°C for 1 hour and neutralizing the supernatant with 0.5M Tris-Cl. Insoluble Aβ fraction was prepared by sonicating the resuspended pellet remaining from soluble preparation for 1 minute on ice in 70% formic acid, and centrifuging at 135,000 x g at 4°C for 1 hour. The supernatant was neutralized with 1M Tris-Cl, 0.5 M disodium phosphate. Aβ concentration was assayed using a fluorescent-based Aβ ELISA (Biosource, Camarillo, CA) with a capture antibody specific for the NH2–terminus of human Aβ (amino acids 1–16) and detection antibodies specific for the neoepitopes at the 42 or 40 amino acid end of Aβ. Values were determined from standard curves using synthetic Aβ1-42 and Aβ1-40 peptides (Biosource) and expressed as pmoles Aβ per gram of wet brain tissue.
Immunohistochemistry
Twenty-μm-thick sections were cut from paraffin embedded hippocampus (NCI = 9, MCI = 10 and AD = 6) and immunostained (Table 3). After antigen-retrieval in 0.01 M citric acid (pH 8.5) for 15 minutes, sections were washed in phosphate buffer and TBS before a 20-minute incubation in 0.1 M sodium metaperiodate (Sigma) in TBS to inactivate endogenous peroxidase activity. Tissue was permeabilized in TBS containing 0.25% Triton-X (ThermoFisher, Waltham, MA) and blocked in the same solution containing 3% goat serum for 1 hour. Sections were incubated with appropriate antibody dilutions (Table 3) overnight at room temperature in 0.25% Triton X-100, 1% goat serum solution in a wet-chamber, then washed in TBS containing 1% goat serum prior to incubation with the secondary antibody biotinylated goat anti-mouse at a 1:200 dilution for 1 hour (Vector Laboratories, Burlingame, CA). Following TBS washes, sections were incubated using the Vectastain ABC kit (Vector Laboratories) for 1 hour, rinsed in 0.2 M sodium acetate, 1.0 M imidazole buffer, pH 7.4, and developed in acetate-imidazole buffer containing 0.05% 3,3′-diaminobenzidine tetrahydrochochloride (Sigma). Reaction was terminated in acetate-imidazole buffer and slides were dehydrated through graded alcohols (70%-95%-100%), cleared in xylene and cover slipped using DPX (Biochemica Fluka, Buchs, Switzerland).
NFT Density
Density of AT8-positive NFTs in the hippocampal CA1, CA2/3 fields and hilus were determined in 1 section per case using a 10x objective in 1.0 mm2 areas containing extensive NFTs, as previously described (61).
Statistical Analysis
Clinical, demographic, and neuropathologic characteristics were compared across the clinically defined groups of NCI, MCI, and AD by Kruskal-Wallis test or Fisher exact test, as were the western-blot protein values, AT8 NFT density, and ELISA values for Aβ. Ad hoc pair-wise comparisons were performed as needed with Bonferroni or Dunn’s correction for multiple comparisons. Associations between biochemical measures, demographic and clinical characteristics, and neuropathology scores were assessed by Spearman rank correlation or Wilcoxon rank sum test. Non-parametric methods were used since they are more robust to outliers and non-normality in the data. Additional regression analyses controlling for potential confounders (e.g. age), as well as factor analyses exploring the interrelationship between protein levels, were performed as needed to explore the potential confounding effect of clinical variables. In summary statistics and regression analysis the Aβ data were log-transformed (i.e. by taking the natural logarithm of the values) in order to reduce data skewness. Given the large number of proteins examined in this study, factor analyses as well as biological rationale were employed to guide us in our interpretation of the results. Our focus was on the identification of consistent patterns in the data rather than individual p values. The level of statistical significance was set at 0.05 (two-sided). Results with 0.01 ≤ p value < 0.05 were interpreted with caution.
RESULTS
Case Demographics
Table 1 shows the characteristics of the RROS cases by clinical diagnostic group. The clinical groups did not differ by age, gender, years of education, postmortem interval or brain weight. There were more subjects cases with an ApoE 4 allele in MCI (33%) and AD (29%) compared to NCI (0%) groups (Table 1). AD cases had lower MMSE scores compared to both MCI and NCI subjects (p = 0.0001), whereas the latter 2 groups did not differ statistically (Table 1). Global Cognitive Score and episodic memory z-scores were significantly lower in AD compared to MCI and NCI (p < 0.0001), while episodic memory z-score was significantly lower in MCI compared to NCI (p < 0.0001). Subjects in the different clinical diagnostic groups displayed considerable heterogeneity with respect to neuropathological diagnostic criteria. Neuropathological examination revealed that 70% of NCI cases, 80% of MCI cases, and 92% of AD cases were classified as Braak stages III–VI. Thus, the NCI group was a “high pathology” control group (67). Of the 21 cases examined for TDP-43 (53% of the total), none of the NCI (n = 3, 30% of the total NCI cases) and MCI (n = 11, 73% of the total) displayed TDP-43 inclusions in the CA1 field of the hippocampus, dentate gyrus or middle temporal cortex, whereas 3 of the 7 AD examined cases (50% of the total AD) showed TDP-43 inclusions in the hippocampus and 2 in the dentate gyrus (Table 2). Using NIA-Reagan criteria, 50% of NCI, 53% of MCI, and 92% of AD cases were classified as intermediate to high likelihood of AD (Table 1). As for CERAD diagnosis, 60% of NCI, 60% of MCI, and 100% of AD cases received a diagnosis of probable/definite AD. Statistical analysis revealed a significant difference in AD compared to both NCI and MCI groups for CERAD diagnosis (p = 0.005), but no differences for Braak staging among clinical groups. Statistical analysis revealed a significant difference between the NCI and AD groups for NIA-Reagan diagnosis (p = 0.03).
Hippocampal Rabaptin5, Cat D, and Rab5 Levels
Western blot analysis revealed significantly higher early endosomal rabaptin5 and lysosomal Cat D levels in MCI compared to AD, whereas non-significant differences were detected between MCI and NCI or NCI and AD groups (Table 4; Fig. 2A–C). Hippocampal rab5 levels were comparable across the three clinical groups (Table 4; Fig. 2A, D). An additional subanalysis revealed no difference in rabaptin5, Cat D and rab5 levels between NCI cases neuropathologically characterized as mild Braak (I–III) compared with moderate Braak (IV–V) scores (data not shown).
Table 4.
Summary of hippocampal protein and amyloid levels by diagnosis category
| Clinical Diagnosis | ||||||
|---|---|---|---|---|---|---|
| NCI (n=10) | MCI (n=15)* | AD (n=14)* | Total (n=39) | P value a | ||
| rabaptin5: | Mean ± SD (Range) | 0.072 ± 0.029 (0.034–0.11) | 0.097 ± 0.019 (0.072–0.14) | 0.069 ± 0.026 (0.035–0.12) | 0.081 ± 0.027 (0.034–0.14) | 0.033 b |
| Cat D: | Mean ± SD (Range) | 0.071 ± 0.031 (0.034–0.13) | 0.093 ± 0.030 (0.053–0.14) | 0.058 ± 0.022 (0.032–0.097) | 0.076 ± 0.031 (0.032–0.14) | 0.021 b |
| rab5: | Mean ± SD (Range) | 0.049 ± 0.012 (0.036–0.077) | 0.052 ± 0.018 (0.024–0.081) | 0.050 ± 0.012 (0.033–0.073) | 0.050 ± 0.014 (0.024–0.081) | 0.9 |
| pmTORs2448: | Mean ± SD (Range) | 0.45 ± 0.09 (0.34–0.63) | 0.40 ± 0.16 (0.23–0.76) | 0.51 ± 0.32 (0.13–1.19) | 0.45 ± 0.22 (0.13–1.19) | 0.3 |
| pmTORs2481: | Mean ± SD (Range) | 0.50 ± 0.16 (0.33–0.80) | 0.50 ± 0.16 (0.30–0.73) | 0.61 ± 0.19 (0.29–0.97) | 0.54 ± 0.17 (0.29–0.97) | 0.2 |
| mTOR: | Mean ± SD (Range) | 0.35 ± 0.07 (0.23–0.46) | 0.32 ± 0.09 (0.22–0.53) | 0.40 ± 0.14 (0.18–0.66) | 0.36 ± 0.11 (0.18–0.66) | 0.2 |
| p62: | Mean ± SD (Range) | 0.16 ± 0.05 (0.11–0.25) | 0.19 ± 0.11 (0.08–0.38) | 0.14 ± 0.10 (0.07–0.44) | 0.17 ± 0.09 (0.07–0.44) | 0.3 |
| traf6: | Mean ± SD (Range) | 0.21 ± 0.08 (0.13–0.42) | 0.21 ± 0.06 (0.14–0.35) | 0.22 ± 0.06 (0.12–0.31) | 0.22 ± 0.06 (0.12–0.42) | 0.8 |
| LilrB2: | Mean ± SD (Range) | 0.19 ± 0.10 (0.08–0.36) | 0.19 ± 0.09 (0.08–0.34) | 0.27 ± 0.18 (0.10–0.65) | 0.22 ± 0.14 (0.08–0.65) | 0.4 |
| Total Aβ40*: | Mean ± SD (Range) | 0.99 ± 0.81 (0.08–2.31) | 1.57 ± 2.03 (0.08–5.97) | 1.46 ± 1.40 (0.14–5.30) | 1.38 ± 1.53 (0.08–5.97) | 0.6 |
| Total Aβ42*: | Mean ± SD (Range) | 3.33 ± 2.45 (0.92–7.14) | 4.32 ± 2.39 (1.03–7.68) | 4.72 ± 1.62 (1.95–7.15) | 4.21 ± 2.17 (0.92–7.68) | 0.2 |
Kruskal-Wallis test, with Bonferroni-type correction for pairwise comparisons.
MCI > AD.
- 1 MCI patient did not have rabaptin5, Cat D, Rab5, Aβ40, or Aβ42 available.
- 2 MCI patients did not have traf6, LilrB2, pmTORs2448, pmTORs2481, mTOR or p62 available.
- 3 AD patients did not have rabaptin5, Cat D or Rab5 available.
- 1 AD did not have traf6, LilrB2, pmTORs2448, pmTORs2481, mTOR or p62 available.
The amyloid levels in the table are log-transformed.
SD, Standard deviation; Aβ40, β-amyloid1-40; Aβ42, β-amyloid1-42; CatD, cathepsin D; NCI, no cognitive impairment, MCI; mild cognitive impairment; AD, Alzheimer disease; mTOR, mammalian target of rapamycin; pMTOR, phosphorylated mTOR; LilrB2, leukocyte immunoglobulin-like receptor B2.
Figure 2.

Representative immunoblots and box plots of hippocampal rabaptin5, rab5 and cathepsin D (Cat D) levels in cases clinically diagnosed as NCI, MCI and AD. (A) β-tubulin was used to normalize the immunoreactive signal obtained by densitometry in the blots. (B–D) Levels of rabaptin5 (B) and Cat D (C) in MCI were significantly higher compared to AD (rabaptin5 *p = 0.033, Cat D; *p = 0.021), whereas the levels of rab5 remains stable across the three clinical groups (D). NCI, non-cognitive impairment, MCI, mild cognitive impairment, AD, Alzheimer disease. Circles in the box plots indicate outliers.
Hippocampal Phospho mTORs2448 and mTORs2481, total mTOR, p62 and traf6 Levels
Hippocampal levels of phospho mTORs2448 and mTORs2481, and total mTOR were stable across clinical groups (Table 4; Fig. 3A–C). In addition, levels of p62 (Table 4; Fig. 4A) and traf6 (Table 4; Fig. 4B) were not significantly different among the clinical groups. A subanalysis revealed no differences in phospho mTORs2448 and mTORs248, mTOR, p62 and traf6 levels between NCI cases neuropathologically characterized as mild (Braak I–III) compared with moderate Braak (IV–V) scores.
Figure 3.

Representative immunoblots and box plots of total levels of hippocampal phosphorylated mTORs (pmTORs2448 and pmTORs2481) and total mTOR in cases clinically diagnosed as NCI, MCI and AD. β-tubulin was used to normalize the immunoreactive signals obtained by densitometry in the blots. (A–C) Levels of pmTORs2448 (A), pmTORs2481 (B) and total mTOR (C) revealed no statistical differences across the clinical groups. NCI, non-cognitive impairment, MCI, mild cognitive impairment, AD, Alzheimer disease. mTOR, mammalian target of rapamycin. Circles in the box plots indicate outliers.
Figure 4.
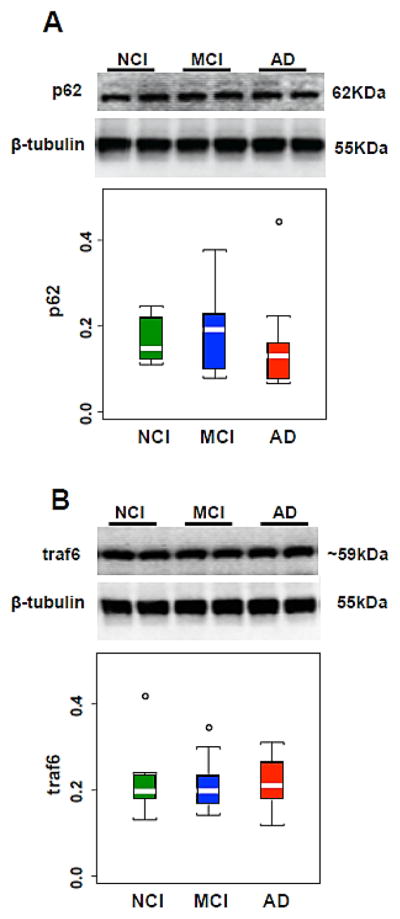
(A, B) Representative immunoblots and box plots of hippocampal levels of p62 (A) and traf6 (B) in cases clinically diagnosed as NCI, MCI and AD. β-tubulin was used to normalize the immunoreactive signals obtained in the blots by densitometry. Levels of p62 and traf6 were stable across clinical groups. NCI, non-cognitive impairment, MCI, mild cognitive impairment, AD, Alzheimer disease. Circles in the box plots indicate outliers.
Hippocampal Aβ1-40 and Aβ1-42 and LilrB2 levels
Soluble and insoluble Aβ1-40, and Aβ1-42 concentrations were comparable across clinical groups (Table 4; Fig. 5A, B). There were no significant differences in oligomeric Aβ receptor LilrB2 levels across the 3 groups (Table 4; Fig. 5C). No differences in Aβ1-40, and Aβ1-42 concentrations and LilrB2 levels were found between NCI cases neuropathologically characterized as mild (Braak I–III) compared with moderate Braak (IV–V) scores.
Figure 5.

(A–C) Box plots of natural logarithm of total hippocampal Aβ1-40 (A) and Aβ1-42 (B) levels showing no changes among NCI, MCI and AD. Representative immunoblot and box plot illustrating the stability of hippocampal levels of LilrB2 across the cases clinically diagnosed as NCI, MCI and AD (C). β-tubulin was used to normalize the immunoreactive signals obtained in the blots by densitometry. NCI, non-cognitive impairment, MCI, mild cognitive impairment, AD, Alzheimer disease. Circles in the box plots indicate outliers.
Hippocampal Tau Pathology
Hippocampal AT8-immunoreactive NFTs were found in each of the 6 AD cases examined, while 90% of MCI and 78% of NCI cases showed AT8-positive NFTs in the hippocampus. For all hippocampal fields evaluated, the median density value for AT8-immunoreactive NFTs was higher in AD vs. MCI or NCI groups (Table 5). However, statistical analysis did not reveal significant differences in the density of AT8-positive NFTs in hippocampal CA1, CA2/3 subfields or hilus between NCI, MCI and AD (Table 5).
Table 5.
Summary of AT8-immunoreactive hippocampal neurofibrillary tangle density by clinical diagnosis
| NCI | MCI | AD | P-valuea | Pair-wise comparison | ||
|---|---|---|---|---|---|---|
| CA1 | Median (Range) | 7.0* (0–39.0) | 18.0 (0–44.0) | 32.5 (2–59.0) | 0.13 | -- |
| CA2/3 | Median (Range) | 7.0 (0–36.0) | 8.5 (0–21.0) | 18.0 (8.0–30.0) | 0.12 | -- |
| Hilus | Median (Range) | 3.0 (0–14.0) | 1.0 (0–11.0) | 11.0 (0–35.0) | 0.17 | -- |
Median NFT density (number/mm2).
Kruskal-Wallis test, with Dunn’s correction for multiple comparisons.
NCI, no cognitive impairment, MCI; mild cognitive impairment; AD, Alzheimer disease.
Association Between Biochemical, Clinical and Neuropathological Measures
Factor analysis was performed to assess correlations between biochemical measurements. Correlational analysis revealed associations between Cat D, rab5, rabaptin5 and traf6, total mTOR and phosphorylated mTORs, and p62, LilrB2 and total Aβ40 and Aβ42. Cat D showed a strong positive relationship with rabaptin5 (r = 0.71, p < 0.001) and a weak association with rab5 (r = 0.38, p < 0.024). Total mTOR correlated positively with both, pmTORs2448 (r = 0.45, p < 0.0058) and mTORs2481 (r = 0.55, p < 0.001) across clinical groups. Interestingly, only pmTORs2448 showed a negative association with increased levels of Cat D (r = −0.349, p = 0.04), but not with rabaptin5 or rab5. CA1 AT8-immunoreactive NFT density showed a positive correlation with traf6 across the 3 groups examined (r = 0.580, p 0.009), but did not correlate with other biochemical measurements. The oligomeric Aβ receptor LilrB2 levels were weakly correlated with total Aβ1-42 levels (r = 0.42, p = 0.012), but not with total Aβ1-40 (r = 0.32, p = 0.062), suggesting its higher affinity for Aβ1-42 (10).
Hippocampal Cat D levels displayed a quadratic relationship (non-linear) with global cognitive z-score (Fig. 6A; p = 0.03) and episodic memory z-score (p = 0.04), and no correlation with MMSE or other clinical/neuropathological variables. Increased levels of rabaptin5 did not correlate with global cognitive z-score or other clinical or neuropathological variables (Fig. 6B; p > 0.05). Total mTOR and pmTORs2481 levels were weakly correlated with decreased global cognitive z-score (Fig. 6C, total mTOR r = −0.42, p = 0.013; Fig. 6D, pmTORs2481 r = −0.39, p = 0.020), but not with MMSE, episodic memory z-score, or with Braak NFT scores. Total hippocampal Aβ1-42 and Aβ1-40 values correlated with increased neuropathology criteria (Braak scores (Aβ1-42 r = 0.48, p = 0.0022; Aβ1-40 r = 0.41, p = 0.010); NIA-Reagan (Aβ1-42 and Aβ1-40 r = 0.60 p < 0.0001); CERAD (Aβ1-42 and Aβ1-40 r = 0.064, p = 0.0001) and only total Aβ1-42 values were correlated with episodic memory z-score (r = −0.35, p = 0.032), but not with the other clinical cognitive variables examined.
Figure 6.

(A, B) Hippocampal cathepsin D (Cat D) levels (A), but not rabaptin5 (B), revealed a non-linear association with global cognitive z-scores (GCS). (C–E) Total hippocampal mTOR (r = −0.42 p = 0.012) (C) and pmTORs2481 (r = −0.39 p = 0.020) (D) levels, but not pmTORs2448 levels (E), correlated negatively with GCS. NCI, non-cognitive impairment, MCI, mild cognitive impairment, AD, Alzheimer disease. NCI, squares; MCI, triangles; AD, circles. mTOR, mammalian target of rapamycin; pmTOR, phosphorylated mTOR.
DISCUSSION
Endosomal enlargement in pyramidal neurons of the frontal cortex has been reported using several early endosomal markers (rab5, rabaptin5, and rab4) in sporadic and familial forms of AD (15, 20). Interestingly, in sporadic AD these endocytic abnormalities in the neocortex were detected before Aβ deposition (15). Less is known about endocytic alterations in MCI, although others have reported upregulation of rab5 and rab7 expression in single CA1 neurons and hippocampal protein levels in MCI and AD compared to NCI (21, 22). We found that the levels of the endosomal internalization marker rabaptin5 were significantly increased in the hippocampus in MCI, but not in early AD. By contrast, no changes were detected in hippocampal rab5, a small GTP-ase protein that promotes early endosomal fusion. Discrepancies between studies may be due in part to differences in the makeup of the cohorts or in the area of the hippocampus examined. The consistent finding of increases in levels of specific endosomal markers indicates an early endosomal upregulation in neurons perhaps to resist their pathological environment. The biological significance of these changes in MCI hippocampus remains to be clarified. Several studies have associated endosomal-lysosomal pathway alterations with increased APP/Aβ production (16–19, 68), suggesting that early endosome upregulation in the hippocampus is associated with enhanced APP/Aβ synthesis. Previous research reported stable concentration of total Aβ in the hippocampus between NCI, MCI and AD cases acquired from the RROS (43), and stable LilrB2 in the frontal lobe of AD patients (10). Thus, while rab5 and rabaptin5 correlated during AD progression, they were not associated with total Aβ1-40 and Aβ1-42 concentration or the oligomeric Aβ receptor LilrB2 protein levels in the hippocampus across the clinical groups examined. Interestingly, LilrB2, but not other endosomal-lysosomal and autophagy markers examined showed a positive association with levels of the postsynaptic protein drebrin within the hippocampus derived from a previous investigation by our group using the same cases (69) during AD progression (data not shown). Hippocampal drebrin levels decreased in MCI and AD compared to NCI (69), suggesting that postsynaptic dendritic spine dysfunction might be related to oligomeric Aβ early in the disease. Taken together, these findings suggest that early hippocampal endocytic disturbances in MCI are independent of Aβ accumulation or synaptic dysfunction, and support the concept that endosomal alterations are some of the earliest intraneuronal changes in AD and may contribute to the pathogenesis of this disease prior to the prominent deposition and accumulation of hallmark neuropathological lesions (5, 15, 17, 70, 71). However, it should be noted that our Aβ ELISA reports both extracellular and intracellular Aβ. Therefore, to evaluate the role of Aβ more fully, we would need to selectively analyze intracellular Aβ including that bound to intracellular membranes and that which is trapped in the endosomal-lysosomal system inside the cell.
In addition to rabaptin5, the present study found that hippocampal Cat D, the major hydrolase constituent of human lysosomes, was significantly greater in MCI compared to AD. While MCI Cat D levels were also greater than NCI, this difference did not reach statistical significance. Nevertheless, higher protein levels of Cat D in MCI hippocampus are in agreement with the previously reported upregulation of Cat D gene expression in CA1 pyramidal cells in MCI (21). Increased levels of Cat D mRNA and its protein were also reported in healthy cortical pyramidal neurons (14) and CA2 and CA3 hippocampal layers in AD (27). Interestingly, levels of Cat D in the cerebrospinal fluid from AD patients were four fold-higher than in other neurodegenerative disorders (26), suggesting that this acid hydrolase could be a biomarker for AD. Epidemiological studies have demonstrated an association between Cat D gene polymorphisms and increased risk of AD, suggesting that Cat D alterations promote AD pathology (72, 73). These observations and our findings in MCI hippocampus are in agreement with the concept that elevated lysosomal Cat D is triggered in selectively vulnerable neurons as an early sign of distress or a compensatory mechanism in response to protein accumulation or neuronal injury. In fact, the hippocampus is an early site of neurodegenerative changes in individuals at risk for AD or in MCI (74, 75) and it is capable of compensatory responses to neuronal damage (76, 77). While Cat D was found in Aβ plaques (25), its involvement in Aβ production is unclear (78). We reported that intraneuronal levels of Cat D were associated with amyloid precursor protein levels in the AD hippocampus (79). On the other hand, in vitro studies reported that Cat D degrades tau (80) and that autophagic-lysosomal systems play a role in tau clearance (28), suggesting that higher levels of hippocampal Cat D might represent lysosomal activation in response to tau accumulation. The present findings did not find any associations between Cat D and total Aβ or LilrB2 levels and AT8 positive NFT density in the hippocampus. By contrast, enhanced Cat D levels displayed a strong association with rabaptin5 during AD clinical progression, indicative of a functional link in the endosomal-lysosomal pathway. Hippocampal lysosomal Cat D was associated with worse global cognitive scores across clinical groups, suggesting a possible link between this lysosomal enzyme and cognitive decline.
Autophagy recycles proteins and organelles and plays a critical role in preventing the accumulation of misfolded or toxic proteins including Aβ and hyperphosphorylated tau (29, 81, 82). The function of mTOR, a major regulator of autophagy induction (7, 83, 84) depends on p62-traf6 interaction (38). Unlike endosomal rabaptin5 and lysosomal Cat D, hippocampal levels of total mTOR and its active phosphorylated forms (pmTOR S2448 and pmTOR S2481) were not detectably altered in MCI or early AD. These results confirm and extend the observation that expression of mTOR and its active form pmTORs2448 in the hippocampus are stable early in the disease (present findings), whereas they are enhanced in advanced AD (33). Although the precise role of mTOR in AD pathology is still unknown, it has been reported that an increase in phosphorylated mTOR (s2481 and s2448) is associated with early tau phosphorylation in AD cortex (85, 86). However, we did not find an association between total or active mTOR protein levels with hippocampal AT8 positive NFT density or Braak NFT staging across clinical groups. Future studies using additional antibodies directed against other phosphorylated or conformationally altered tau epitopes will need to be examined in the MCI and AD hippocampus. Reports indicate that inhibition of hyperactive mTOR reduces AD-like lesions, induces autophagy and ameliorates cognitive deficits in animal models of AD (34, 35, 37, 87–90). However, rapamycin induction of autophagy failed to reduce AD plaque and NFT-like pathology or improve cognition in old 3xTg-AD mice, suggesting that autophagy induction via mTOR plays a limited role, if any, in AD pathobiology (36). The present findings showing stable hippocampal mTOR levels in MCI and early AD do not support the concept that inhibition of hyperactive mTOR may be a valid therapy for AD. On the other hand, we observed that increased hippocampal mTOR and its active form pmTORs2481 were associated with poorer global cognitive scores. Further studies are necessary to determine whether alternative pathways involving the activation of downstream molecules such as p70 S6 kinase and eukaryotic initiation factor 4E binding protein, which are enhanced in AD (85, 91), contribute to tau pathology during the prodromal stage of the disease.
Mounting evidence indicates that abnormal levels of p62 or sequestosome-1 (SQSTM1), a mTOR upstream signaling protein involved in cargo recognition and autophagosome formation, play a critical role in autophagy failure (38, 92–94). Unlike previous reports of lower p62 expression in AD frontal cortex (95, 96), and enhanced tau phosphorylation in p62-deficient mice (97), we observed stable p62 protein levels in the hippocampus of MCI and early AD. Accumulation of p62 was described in NFTs in various neocortical areas from cases with a probable to definite diagnosis of AD (39, 40, 98). Conversely, we found no correlations between p62 and AT8-positive NFT density and Braak NFT staging. Furthermore, we did not find changes in hippocampal traf6 levels across the examined groups. Traf6 functions as an ubiquitin ligase (99) and colocalizes with p62 in aggregates isolated from the AD hippocampus (100). The p62/Traf6 complex inhibits neuronal death or promotes cell survival by interaction with the p75NTR and TrkA NGF receptors, respectively (41, 101), and initiates tau degradation by the proteosome (100). We have previously demonstrated that alterations in hippocampal NGF signaling favor pro-apoptotic pathways during AD progression, independent of Aβ accumulation (43). However, there was a lack of an association between hippocampal traf6 and p62 levels during disease progression (present study) and these proteins did not correlate with proNGF, TrkA or p75NTR values (data not shown). Taken together the present data suggest that autophagy-mTOR related proteins are not associated with proNGF-apoptotic signaling in the hippocampus in the early stages of AD.
TDP-43 mislocalization has been suggested to play a key role in NFT formation, neuronal death and cognitive impairment in AD (102–104). TDP-43 inclusions are common pathological hallmarks of amyotrophic lateral sclerosis and frontotemporal dementia (105) and have been associated with autophagy dysfunction in both disorders (106, 107). The relationship between autophagy and TDP-43 in the hippocampus during the progression of AD is unclear, however. In the present study, no changes in hippocampal autophagy markers were detected in the early stages of AD and TDP-43 inclusions within hippocampal subfields were described in 3 AD cases, but not in the MCI or NCI examined cases. These data suggest that TDP-43 pathology is a late stage event and might not interact with autophagy function early in the pathogenesis of AD.
This study has limitations that should be taken into consideration when interpreting the data. In the present study, RROS case selection was based upon final premortem clinical classification and not postmortem neuropathological evaluation, as previously reported (45–47). As is the case for all studies using RROS tissue, following case selection, tissue was distributed and the biochemical assays were carried out. Biochemical data are then evaluated across clinical groups, cognitive test scores and subject demographics. A secondary statistical analysis is performed to correlate biological, clinical and demographic data with the neuropathologic data derived for each case including Braak scores, NIA-Reagan and CERAD evaluations. It is important to also consider that some of the endocytic and autophagic proteins examined, such as mTOR, also play a role in glial-inflammatory responses (98, 108, 109). In addition, the hippocampus displays signs of atrophy/neuronal loss in early AD (110). Therefore, we do not preclude that alterations in these proteins may be masked by the discriminatory ability of the techniques used. Therefore, the interpretation of the clinical-pathological correlations should be conservative in light of the context of cell-type specific degeneration. Likewise, the inclusion of NCI cases with high Braak scores indicative of extensive hippocampal NFT pathology might play a role in the lack of differences found across clinical groups for some, but not all of the endosomal-lysosomal markers evaluated. Cat D and rabaptin5 were upregulated in MCI but not in AD and there were no significant differences between NCI and MCI, suggesting that NFT pathology plays a limited role in triggering this potential neuronal reorganizational response. Subanalysis also revealed no difference in makers between high and low Braak pathology cases. Although the specificity of the commercially available antibodies used herein have been described by the manufacturers and successfully used in endosomal-lysosomal-autophagic research publications (21, 22, 49–58), we do not rule out the possibility that other subtype-specific antibodies may reveal additional differences across the clinical groups examined here. In addition, the absence of cellular TDP-43 inclusions in the hippocampus of NCI and MCI cases indicates that our endosomal-lysosomal and autophagy differences in these groups are not mitigated by the potential neurotoxicity of TDP-43 aggregations (Table 2). Despite these caveats, the RROS experimental cohort has been well characterized clinically and pathologically, and the clinical groups used here were matched for age, gender, years of education, postmortem interval and brain weight (Table 1), thereby providing less variability between groups yielding reliable and dependable findings to correlate with their clinical and neuropathological variables.
In summary, our data support that select endocytic and lysosomal proteins in the hippocampus are altered in relation to autophagic markers in MCI, and early endosomal-lysosomal neuronal changes are not directly associated with Aβ or NFT accumulation and/or formation.
Acknowledgments
Supported by NIA Grants PO1AG14449, RO1AG043375, P30AG010161, RO1AG042210, PO1AG025204, Alzheimer’s Association and Brinson Foundation.
The authors thank the nuns, priests, and brothers that participated in the Religious Orders Study, the staff of the Rush Alzheimer’s Disease Center and Dr. Julie Schneider for providing the TPD-43 data.
Footnotes
Disclosures: Dr. Milos D. Ikonomovic has consulted for GE Healthcare, which holds the commercial licensing and distribution rights for PiB PET imaging.
References
- 1.Alberts B, Bray D, Lewis J, et al. Intracellular sorting and the maintenance of cellular compartments. In: Alberts B, Bray D, Lewis J, Raff M, Roberts K, Watson JD, editors. Molecular Biology of the Cell. New York, NY: Garland Publishing; 1989. pp. 405–79. [Google Scholar]
- 2.Deinhardt K, Salinas S, Verastegui C, et al. Rab5 and rab7 control endocytic sorting along the axonal retrograde transport pathway. Neuron. 2006;52:293–305. doi: 10.1016/j.neuron.2006.08.018. [DOI] [PubMed] [Google Scholar]
- 3.Bronfman FC, Escudero CA, Weis J, et al. Endosomal transport of neurotrophins: Roles in signaling and neurodegenerative diseases. Dev Neurobiol. 2007;67:1183–1203. doi: 10.1002/dneu.20513. [DOI] [PubMed] [Google Scholar]
- 4.Liu J, Lamb D, Chou MM, et al. Nerve growth factor-mediated neurite outgrowth via regulation of Rab5. Mol Biol Cell. 2007;18:1375–84. doi: 10.1091/mbc.E06-08-0725. [DOI] [PMC free article] [PubMed] [Google Scholar]
- 5.Nixon RA, Yang DS, Lee JH. Neurodegenerative lysosomal disorders: A continuum from development to late age. Autophagy. 2008;4:590–99. doi: 10.4161/auto.6259. [DOI] [PubMed] [Google Scholar]
- 6.Ng EL, Tang BL. Rab GTPases and their roles in brain neurons and glia. Brain Res Rev. 2008;58:236–46. doi: 10.1016/j.brainresrev.2008.04.006. [DOI] [PubMed] [Google Scholar]
- 7.Nixon RA. The role of autophagy in neurodegenerative disease. Nat Med. 2013;19:983–97. doi: 10.1038/nm.3232. [DOI] [PubMed] [Google Scholar]
- 8.Bucci C, Alifano P, Cogli L. The role of rab proteins in neuronal cells and in the trafficking of neurotrophin receptors. Membranes. 2014;4:642–77. doi: 10.3390/membranes4040642. [DOI] [PMC free article] [PubMed] [Google Scholar]
- 9.Ghavami S, Shojaei S, Yeganeh B, et al. Autophagy and apoptosis dysfunction in neurodegenerative disorders. Prog Neurobiol. 2014;112:24–49. doi: 10.1016/j.pneurobio.2013.10.004. [DOI] [PubMed] [Google Scholar]
- 10.Kim T, Vidal GS, Djurisic M, et al. Human LilrB2 is a β-amyloid receptor and its murine homolog PirB regulates synaptic plasticity in an Alzheimer’s model. Science. 2013;341:1399–1404. doi: 10.1126/science.1242077. [DOI] [PMC free article] [PubMed] [Google Scholar]
- 11.Terry RD, Masliah E, Salmon DP, et al. Physical basis of cognitive alterations in Alzheimer’s disease: synapse loss is the major correlate of cognitive impairment. Ann Neurol. 1991;30:572–80. doi: 10.1002/ana.410300410. [DOI] [PubMed] [Google Scholar]
- 12.Scheff SW, Price DA. Synaptic pathology in Alzheimer’s disease: a review of ultrastructural studies. Neurobiol Aging. 2003;24:1029–46. doi: 10.1016/j.neurobiolaging.2003.08.002. [DOI] [PubMed] [Google Scholar]
- 13.Scheff SW, Price DA, Schmitt FA, et al. Synapse stability in the precuneus early in the progression of Alzheimer’s disease. J Alzheimers Dis. 2013;35:599–609. doi: 10.3233/JAD-122353. [DOI] [PMC free article] [PubMed] [Google Scholar]
- 14.Cataldo AM, Barnett JL, Berman SA, et al. Gene expression and cellular content of cathepsin D in Alzheimer’s disease brain: evidence for early up-regulation of the endosomal-lysosomal system. Neuron. 1995;14:671–80. doi: 10.1016/0896-6273(95)90324-0. [DOI] [PubMed] [Google Scholar]
- 15.Cataldo AM, Peterhoff CM, Troncoso JC, et al. Endocytic pathway abnormalities precede amyloid beta deposition in sporadic Alzheimer’s disease and Down syndrome: differential effects of APOE genotype and presenilin mutations. Am J Pathol. 2000;157:277–86. doi: 10.1016/s0002-9440(10)64538-5. [DOI] [PMC free article] [PubMed] [Google Scholar]
- 16.Haass C, Koo EH, Mellon A, et al. Targeting of cell-surface beta-amyloid precursor protein to lysosomes: alternative processing into amyloid-bearing fragments. Nature. 1992;357:500–3. doi: 10.1038/357500a0. [DOI] [PubMed] [Google Scholar]
- 17.Koo EH, Squazzo SL. Evidence that production and release of amyloid beta-protein involves the endocytic pathway. J Biol Chem. 1994;269:17386–9. [PubMed] [Google Scholar]
- 18.Thinakaran G, Koo EH. Amyloid precursor protein trafficking, processing, and function. J Biol Chem. 2008;283:29615–9. doi: 10.1074/jbc.R800019200. [DOI] [PMC free article] [PubMed] [Google Scholar]
- 19.Tam JH, Seah C, Pasternak SH. The Amyloid Precursor Protein is rapidly transported from the Golgi apparatus to the lysosome and where it is processed into beta-amyloid. Mol Brain. 2014;7:54. doi: 10.1186/s13041-014-0054-1. [DOI] [PMC free article] [PubMed] [Google Scholar]
- 20.Cataldo A, Rebeck GW, Ghetri B, et al. Endocytic disturbances distinguish among subtypes of Alzheimer’s disease and related disorders. Ann Neurol. 2001;50:661–5. [PubMed] [Google Scholar]
- 21.Ginsberg SD, Alldred MJ, Counts SE, et al. Microarray analysis of hippocampal CA1 neurons implicates early endosomal dysfunction during Alzheimer’s disease progression. Biol Psychiatry. 2010;68:885–93. doi: 10.1016/j.biopsych.2010.05.030. [DOI] [PMC free article] [PubMed] [Google Scholar]
- 22.Ginsberg SD, Mufson EJ, Counts SE, et al. Regional selectivity of rab5 and rab7 protein upregulation in mild cognitive impairment and Alzheimer’s disease. J Alzheimers Dis. 2010;22:631–9. doi: 10.3233/JAD-2010-101080. [DOI] [PMC free article] [PubMed] [Google Scholar]
- 23.Cataldo AM, Nixon RA. Enzymatically active lysosomal proteases are associated with amyloid deposits in Alzheimer brain. Proc Natl Acad Sci U S A. 1990;87:3861–5. doi: 10.1073/pnas.87.10.3861. [DOI] [PMC free article] [PubMed] [Google Scholar]
- 24.Cataldo AM, Thayer CY, Bird ED, et al. Lysosomal proteinase antigens are prominently localized within senile plaques of Alzheimer’s disease: evidence for a neuronal origin. Brain Res. 1990;513:181–92. doi: 10.1016/0006-8993(90)90456-l. [DOI] [PubMed] [Google Scholar]
- 25.Cataldo AM, Barnett JL, Mann DM, et al. Colocalization of lysosomal hydrolase and beta-amyloid in diffuse plaques of the cerebellum and striatum in Alzheimer’s disease and Down’s syndrome. J Neuropathol Exp Neurol. 1996;55:704–15. doi: 10.1097/00005072-199606000-00004. [DOI] [PubMed] [Google Scholar]
- 26.Schwagerl AL, Mohan PS, Cataldo AM, et al. Elevated levels of the endosomal-lysosomal proteinase cathepsin D in cerebrospinal fluid in Alzheimer disease. J Neurochem. 1995;64:443–6. doi: 10.1046/j.1471-4159.1995.64010443.x. [DOI] [PubMed] [Google Scholar]
- 27.Cataldo AM, Hamilton DJ, Barnett JL, et al. Properties of the endosomal lysosomal system in the human central nervous system: disturbances mark most neurons in populations at risk to degenerate in Alzheimer’s disease. J Neurosci. 1996;16:186–99. doi: 10.1523/JNEUROSCI.16-01-00186.1996. [DOI] [PMC free article] [PubMed] [Google Scholar]
- 28.Hamano T, Gendron TF, Causevic E, et al. Autophagic-lysosomal perturbation enhances tau aggregation in transfectants with induced wild-type tau expression. Eur J Neurosci. 2008;27:1119–30. doi: 10.1111/j.1460-9568.2008.06084.x. [DOI] [PubMed] [Google Scholar]
- 29.Wang Y, Martinez-Vicente M, Krüger U, et al. Tau fragmentation, aggregation and clearance: the dual role of lysosomal processing. Hum Mol Genet. 2009;18:4153–70. doi: 10.1093/hmg/ddp367. [DOI] [PMC free article] [PubMed] [Google Scholar]
- 30.Ling D, Salvaterra PM. A central role for autophagy in Alzheimer-type neurodegeneration. Autophagy. 2009;5:738–40. doi: 10.4161/auto.5.5.8626. [DOI] [PubMed] [Google Scholar]
- 31.Wong E, Cuervo AM. Autophagy gone awry in neurodegenerative diseases. Nat Neurosci. 2010;13:805–11. doi: 10.1038/nn.2575. [DOI] [PMC free article] [PubMed] [Google Scholar]
- 32.Lee MJ, Lee JH, Rubinsztein DC. Tau degradation: the ubiquitin-proteasome system versus the autophagy-lysosome system. Prog Neurobiol. 2013;105:49–59. doi: 10.1016/j.pneurobio.2013.03.001. [DOI] [PubMed] [Google Scholar]
- 33.Sun YX, Ji X, Mao X, et al. Differential activation of mTOR complex 1 signaling in human brain with mild to severe Alzheimer’s disease. J Alzheimers Dis. 2014;38:437–44. doi: 10.3233/JAD-131124. [DOI] [PubMed] [Google Scholar]
- 34.Spilman P, Podlutskaya N, Hart MJ, et al. Inhibition of mTOR by rapamycin abolishes cognitive deficits and reduces amyloid-beta levels in a mouse model of Alzheimer’s disease. PLoS One. 2010;5:e9979. doi: 10.1371/journal.pone.0009979. [DOI] [PMC free article] [PubMed] [Google Scholar]
- 35.Caccamo A, Majumder S, Richardson A, et al. Molecular interplay between mammalian target of rapamycin (mTOR), amyloid-beta, and Tau: effects on cognitive impairments. J Biol Chem. 2010;285:13107–20. doi: 10.1074/jbc.M110.100420. [DOI] [PMC free article] [PubMed] [Google Scholar]
- 36.Majumder S, Richardson A, Strong R, et al. Inducing autophagy by rapamycin before, but not after, the formation of plaques and tangles ameliorates cognitive deficits. PLoS One. 2011;6:e25416. doi: 10.1371/journal.pone.0025416. [DOI] [PMC free article] [PubMed] [Google Scholar]
- 37.Caccamo A, De Pinto V, Messina A, et al. Genetic reduction of mammalian target of rapamycin ameliorates Alzheimer’s disease-like cognitive and pathological deficits by restoring hippocampal gene expression signature. J Neurosci. 2014;34:7988–98. doi: 10.1523/JNEUROSCI.0777-14.2014. [DOI] [PMC free article] [PubMed] [Google Scholar]
- 38.Linares JF, Duran A, Yajima T, et al. K63 polyubiquitination and activation of mTOR by the p62-TRAF6 complex in nutrient-activated cells. Mol Cell. 2013;51:283–96. doi: 10.1016/j.molcel.2013.06.020. [DOI] [PMC free article] [PubMed] [Google Scholar]
- 39.Kuusisto E, Salminen A, Alafuzoff I. Early accumulation of p62 in neurofibrillary tangles in Alzheimer’s disease: possible role in tangle formation. Neuropathol Appl Neurobiol. 2002;28:228–37. doi: 10.1046/j.1365-2990.2002.00394.x. [DOI] [PubMed] [Google Scholar]
- 40.Hoozemans JJ, van Haastert ES, Nijholt DA, et al. The unfolded protein response is activated in pretangle neurons in Alzheimer’s disease hippocampus. Am J Pathol. 2009;174:1241–51. doi: 10.2353/ajpath.2009.080814. [DOI] [PMC free article] [PubMed] [Google Scholar]
- 41.Geetha T, Zheng C, McGregor WC, et al. TRAF6 and p62 inhibit amyloid β-induced neuronal death through p75 neurotrophin receptor. Neurochem Int. 2012;61:1289–93. doi: 10.1016/j.neuint.2012.09.005. [DOI] [PMC free article] [PubMed] [Google Scholar]
- 42.Braak H, Braak E. Neuropathological stageing of Alzheimer-related changes. Acta Neuropathol. 1991;82:239–59. doi: 10.1007/BF00308809. [DOI] [PubMed] [Google Scholar]
- 43.Mufson EJ, He B, Nadeem M, et al. Hippocampal proNGF signaling pathways and β-amyloid levels in mild cognitive impairment and Alzheimer disease. J Neuropathol Exp Neurol. 2012;71:1018–29. doi: 10.1097/NEN.0b013e318272caab. [DOI] [PMC free article] [PubMed] [Google Scholar]
- 44.Mufson EJ, Chen EY, Cochran EJ, et al. Entorhinal cortex beta-amyloid load in individuals with mild cognitive impairment. Exp Neurol. 1999;158:469–90. doi: 10.1006/exnr.1999.7086. [DOI] [PubMed] [Google Scholar]
- 45.Bennett DA, Schneider JA, Bienias JL, et al. Mild cognitive impairment is related to Alzheimer disease pathology and cerebral infarctions. Neurology. 2005;64:834–41. doi: 10.1212/01.WNL.0000152982.47274.9E. [DOI] [PubMed] [Google Scholar]
- 46.Newell KL, Hyman BT, Growdon, et al. Application of the National Institute on Aging (NIA)-Reagan Institute criteria for the neuropathological diagnosis of Alzheimer disease. J Neuropathol Exp Neurol. 1999;58:1147–55. doi: 10.1097/00005072-199911000-00004. [DOI] [PubMed] [Google Scholar]
- 47.Mirra SS. The CERAD neuropathology protocol and consensus recommendations for the postmortem diagnosis of Alzheimer’s disease: a commentary. Neurobiol Aging. 1997;18:S91–94. doi: 10.1016/s0197-4580(97)00058-4. [DOI] [PubMed] [Google Scholar]
- 48.Montine TJ, Phelps CH, Beach TG, et al. National Institute on Aging-Alzheimer’s Association guidelines for the neuropathologic assessment of Alzheimer’s disease: a practical approach. Acta Neuropathol. 2012;123:1–11. doi: 10.1007/s00401-011-0910-3. [DOI] [PMC free article] [PubMed] [Google Scholar]
- 49.Laifenfeld D, Patzek LJ, McPhie DL, et al. Rab5 mediates an amyloid precursor protein signaling pathway that leads to apoptosis. J Neurosci. 2007;27:7141–53. doi: 10.1523/JNEUROSCI.4599-06.2007. [DOI] [PMC free article] [PubMed] [Google Scholar]
- 50.Steuble M, Gerrits B, Ludwig A, et al. Molecular characterization of a trafficking organelle: dissecting the axonal paths of calsyntenin-1 transport vesicles. Proteomics. 2010;10:3775–88. doi: 10.1002/pmic.201000384. [DOI] [PubMed] [Google Scholar]
- 51.Stenmark H, Vitale G, Ullrich O, et al. Rabaptin-5 is a direct effector of the small GTPase Rab5 in endocytic membrane fusion. Cell. 1995;83:423–32. doi: 10.1016/0092-8674(95)90120-5. [DOI] [PubMed] [Google Scholar]
- 52.Shiba Y, Takatsu H, Shin HW, et al. Gamma-adaptin interacts directly with Rabaptin-5 through its ear domain. J Biochem. 2002;131:327–36. doi: 10.1093/oxfordjournals.jbchem.a003107. [DOI] [PubMed] [Google Scholar]
- 53.Xia M, Gonzalez P, Li C, et al. Mitophagy enhances oncolytic measles virus replication by mitigating DDX58/RIG-I-like receptor signaling. J Virol. 2014;88:5152–64. doi: 10.1128/JVI.03851-13. [DOI] [PMC free article] [PubMed] [Google Scholar]
- 54.Duan Y, Fu W, Wang S, et al. Effects of tonic immobility (TI) and corticosterone (CORT) on energy status and protein metabolism in pectoralis major muscle of broiler chickens. Comp Biochem Physiol A Mol Integr Physiol. 2014;169:90–5. doi: 10.1016/j.cbpa.2013.12.019. [DOI] [PubMed] [Google Scholar]
- 55.Vallejo D, Crespo I, San-Miguel B, et al. Autophagic response in the Rabbit Hemorrhagic Disease, an animal model of virally-induced fulminant hepatic failure. Vet Res. 2014;45:15. doi: 10.1186/1297-9716-45-15. [DOI] [PMC free article] [PubMed] [Google Scholar]
- 56.Cao R, Lee B, Cho HY, et al. Photic regulation of the mTOR signaling pathway in the suprachiasmatic circadian clock. Mol Cell Neurosci. 2008;38:312–24. doi: 10.1016/j.mcn.2008.03.005. [DOI] [PMC free article] [PubMed] [Google Scholar]
- 57.Roczniak-Ferguson A, Petit CS, Froehlich F, et al. The transcription factor TFEB links mTORC1 signaling to transcriptional control of lysosome homeostasis. Sci Signal. 2012;5:ra42. doi: 10.1126/scisignal.2002790. [DOI] [PMC free article] [PubMed] [Google Scholar]
- 58.Menon S, Dibble CC, Talbott G, et al. Spatial control of the TSC complex integrates insulin and nutrient regulation of mTORC1 at the lysosome. Cell. 2014;156:771–85. doi: 10.1016/j.cell.2013.11.049. [DOI] [PMC free article] [PubMed] [Google Scholar]
- 59.Isnardi I, Ng YS, Menard L, et al. Complement receptor 2/CD21- human naive B cells contain mostly autoreactive unresponsive clones. Blood. 2010;115:5026–36. doi: 10.1182/blood-2009-09-243071. [DOI] [PMC free article] [PubMed] [Google Scholar]
- 60.Asensio-Juan E, Gallego C, Martínez-Balbás MA. The histone demethylase PHF8 is essential for cytoskeleton dynamics. Nucleic Acids Res. 2012;40:9429–40. doi: 10.1093/nar/gks716. [DOI] [PMC free article] [PubMed] [Google Scholar]
- 61.Perez SE, He B, Nadeem M, et al. Resilience of precuneus neurotrophic signaling pathways despite amyloid pathology in prodromal Alzheimer’s disease. Biol Psychiatry. 2014 Jan 11; doi: 10.1016/j.biopsych.2013.12.016. pii: S0006-3223(14)00012-2. [Epub ahead of print] [DOI] [PMC free article] [PubMed] [Google Scholar]
- 62.Eliopoulos N, Zhao J, Bouchentouf M, et al. Human marrow-derived mesenchymal stromal cells decrease cisplatin renotoxicity in vitro and in vivo and enhance survival of mice post-intraperitoneal injection. Am J Physiol Renal Physiol. 2010;299:1288–98. doi: 10.1152/ajprenal.00671.2009. [DOI] [PubMed] [Google Scholar]
- 63.Oh KJ, Perez SE, Lagalwar S, et al. Staging of Alzheimer’s pathology in triple transgenic mice: a light and electron microscopic analysis. Int J Alzheimers Dis. 2010 doi: 10.4061/2010/780102. pii:780102. [DOI] [PMC free article] [PubMed] [Google Scholar]
- 64.Waxman EA, Giasson BI. Induction of intracellular tau aggregation is promoted by α-synuclein seeds and provides novel insights into the hyperphosphorylation of tau. J Neurosci. 2011;31:7604–18. doi: 10.1523/JNEUROSCI.0297-11.2011. [DOI] [PMC free article] [PubMed] [Google Scholar]
- 65.Peng S, Wuu J, Mufson EJ, et al. Increased proNGF levels in subjects with mild cognitive impairment and mild Alzheimer disease. J Neuropathol Exp Neurol. 2004;63:641–9. doi: 10.1093/jnen/63.6.641. [DOI] [PubMed] [Google Scholar]
- 66.Ikonomovic MD, Klunk WE, Abrahamson EE, et al. Post-mortem correlates of in vivo PiB-PET amyloid imaging in a typical case of Alzheimer’s disease. Brain. 2008;131:1630–45. doi: 10.1093/brain/awn016. [DOI] [PMC free article] [PubMed] [Google Scholar]
- 67.Erten-Lyons D, Woltjer RL, Dodge H, et al. Factors associated with resistance to dementia despite high Alzheimer disease pathology. Neurology. 2009;72:354–60. doi: 10.1212/01.wnl.0000341273.18141.64. [DOI] [PMC free article] [PubMed] [Google Scholar]
- 68.Grbovic OM, Mathews PM, Jiang Y, et al. Rab5-stimulated up-regulation of the endocytic pathway increases intracellular beta cleaved amyloid precursor protein carboxyl-terminal fragment levels and Abeta production. J Biol Chem. 2003;278:31261–68. doi: 10.1074/jbc.M304122200. [DOI] [PubMed] [Google Scholar]
- 69.Counts SE, He B, Nadeem M, et al. Hippocampal drebrin loss in mild cognitive impairment. Neurodegener Dis. 2012;10:216–19. doi: 10.1159/000333122. [DOI] [PMC free article] [PubMed] [Google Scholar]
- 70.Yang AJ, Chandswangbhuvana D, Margol L, et al. Loss of endosomal/lysosomal membrane impermeability is an early event in amyloid Abeta1-42 pathogenesis. J Neurosci Res. 1998;52:691–8. doi: 10.1002/(SICI)1097-4547(19980615)52:6<691::AID-JNR8>3.0.CO;2-3. [DOI] [PubMed] [Google Scholar]
- 71.Cataldo AM, Barnett JL, Picroni C, et al. Increased neuronal endocytosis and protease delivery to early endosomes in sporadic Alzheimer’s disease: neuropathologic evidence for a mechanism of increased amyloidogenesis. J Neurosci. 1997;17:6142–51. doi: 10.1523/JNEUROSCI.17-16-06142.1997. [DOI] [PMC free article] [PubMed] [Google Scholar]
- 72.Albayrak O, Tirniceriu A, Riemenschneider M, et al. The cathepsin D (224C/T) polymorphism confers an increased risk to develop Alzheimer’s disease in men. J Gerontol A Biol Sci Med Sci. 2010;65:219–24. doi: 10.1093/gerona/glp209. [DOI] [PubMed] [Google Scholar]
- 73.Sayad A, Noruzinia M, Zamani M, et al. Association study of cathepsin D gene polymorphism in Iranian patients with sporadic late-onset Alzheimer’s disease. Dement Geriatr Cogn Disord. 2014;37:257–64. doi: 10.1159/000347128. [DOI] [PubMed] [Google Scholar]
- 74.Apostolova LG, Hwang KS, Andrawis JP, et al. 3D PIB and CSF biomarker associations with hippocampal atrophy in ADNI subjects. Neurobiol Aging. 2010;31:1284–303. doi: 10.1016/j.neurobiolaging.2010.05.003. [DOI] [PMC free article] [PubMed] [Google Scholar]
- 75.Devanand DP, Pradhaban G, Liu X, et al. Hippocampal and entorhinal atrophy in mild cognitive impairment: prediction of Alzheimer disease. Neurology. 2007;68:828–36. doi: 10.1212/01.wnl.0000256697.20968.d7. [DOI] [PubMed] [Google Scholar]
- 76.Geddes JW, Monaghan DT, Cotman CW, et al. Plasticity of hippocampal circuitry in Alzheimer’s disease. Science. 1985;230:1179–81. doi: 10.1126/science.4071042. [DOI] [PubMed] [Google Scholar]
- 77.Ikonomovic MD, Mufson EJ, Wuu J, et al. Cholinergic plasticity in hippocampus of individuals with mild cognitive impairment: correlation with Alzheimer’s neuropathology. J Alzheimers Dis. 2003;5:39–48. doi: 10.3233/jad-2003-5106. [DOI] [PubMed] [Google Scholar]
- 78.Thompson A, Grueninger-Leitch F, Huber G, et al. Expression and characterization of human beta-secretase candidates metalloendopeptidase MP78 and cathepsin D in beta APP-overexpressing cells. Brain Res Mol Brain Res. 1997;48:206–14. doi: 10.1016/s0169-328x(97)00091-0. [DOI] [PubMed] [Google Scholar]
- 79.Perez SE, Kovacs B, Scheff SW, et al. Hippocampal Cathepsin D and APP/Aβ processing in AD (Abstract) Society for Neuroscience; 2014. [Google Scholar]
- 80.Kenessey A, Nacharaju P, Ko LW, et al. Degradation of tau by lysosomal enzyme cathepsin D: implication for Alzheimer neurofibrillary degeneration. Neurochem. 1997;69:2026–38. doi: 10.1046/j.1471-4159.1997.69052026.x. [DOI] [PubMed] [Google Scholar]
- 81.Hung SY, Huang WP, Liou HC, et al. Autophagy protects neuron from Abeta-induced cytotoxicity. Autophagy. 2009;5:502–10. doi: 10.4161/auto.5.4.8096. [DOI] [PubMed] [Google Scholar]
- 82.Ihara Y, Morishima-Kawashima M, Nixon R. The ubiquitin-proteasome system and the autophagic-lysosomal system in Alzheimer disease. Cold Spring Harb Perspect Med. 2012 Aug 1;2 doi: 10.1101/cshperspect.a006361. pii: a006361. [DOI] [PMC free article] [PubMed] [Google Scholar]
- 83.Seglen PO, Bohley P. Autophagy and other vacuolar protein degradation mechanisms. Experientia. 1992;48:158–72. doi: 10.1007/BF01923509. [DOI] [PubMed] [Google Scholar]
- 84.Wullschleger S, Loewith R, Hall MN. TOR signaling in growth and metabolism. Cell. 2006;124:471–84. doi: 10.1016/j.cell.2006.01.016. [DOI] [PubMed] [Google Scholar]
- 85.Li X, Alafuzoff I, Soininen H, et al. Levels of mTOR and its downstream targets 4E-BP1, eEF2, and eEF2 kinase in relationships with tau in Alzheimer’s disease brain. FEBS J. 2005;272:4211–20. doi: 10.1111/j.1742-4658.2005.04833.x. [DOI] [PubMed] [Google Scholar]
- 86.Tang Z, Bereczki E, Zhang H, et al. Mammalian target of rapamycin (mTor) mediates tau protein dyshomeostasis: implication for Alzheimer disease. J Biol Chem. 2013;288:15556–70. doi: 10.1074/jbc.M112.435123. [DOI] [PMC free article] [PubMed] [Google Scholar]
- 87.Pierce A, Podlutskaya N, Halloran JJ, et al. Over-expression of heat shock factor 1 phenocopies the effect of chronic inhibition of TOR by rapamycin and is sufficient to ameliorate Alzheimer’s-like deficits in mice modeling the disease. J Neurochem. 2013;124:880–93. doi: 10.1111/jnc.12080. [DOI] [PMC free article] [PubMed] [Google Scholar]
- 88.Caccamo A, Maldonado MA, Majumder S, et al. Naturally secreted amyloid-beta increases mammalian target of rapamycin (mTOR) activity via a PRAS40-mediated mechanism. J Biol Chem. 2011;286:8924–32. doi: 10.1074/jbc.M110.180638. [DOI] [PMC free article] [PubMed] [Google Scholar]
- 89.Wang C, Zhang X, Teng Z, et al. Downregulation of PI3K/Akt/mTOR signaling pathway in curcumin-induced autophagy in APP/PS1 double transgenic mice. Eur J Pharmacol. 2014;740:312–20. doi: 10.1016/j.ejphar.2014.06.051. [DOI] [PubMed] [Google Scholar]
- 90.Caccamo A, Magrì A, Medina DX, et al. mTOR regulates tau phosphorylation and degradation: implications for Alzheimer’s disease and other tauopathies. Aging Cell. 2013;12:370–80. doi: 10.1111/acel.12057. [DOI] [PMC free article] [PubMed] [Google Scholar]
- 91.An WL, Cowburn RF, Li L, et al. Up-regulation of phosphorylated/activated p70 S6 kinase and its relationship to neurofibrillary pathology in Alzheimer’s disease. Am J Pathol. 2003;163:591–607. doi: 10.1016/S0002-9440(10)63687-5. [DOI] [PMC free article] [PubMed] [Google Scholar]
- 92.Salminen A, Kaarniranta K, Haapasalo A, et al. Emerging role of p62/sequestosome-1 in the pathogenesis of Alzheimer’s disease. Prog Neurobiol. 2012;96:87–95. doi: 10.1016/j.pneurobio.2011.11.005. [DOI] [PubMed] [Google Scholar]
- 93.Rusten TE, Stenmark H. p62, an autophagy hero or culprit? Nat Cell Biol. 2010;12:207–9. doi: 10.1038/ncb0310-207. [DOI] [PubMed] [Google Scholar]
- 94.Yue Z. Autophagy in lurcher mice: indicted but yet to be acquitted for the death of Purkinje cells. Autophagy. 2010;6:571–2. doi: 10.4161/auto.6.4.11957. [DOI] [PubMed] [Google Scholar]
- 95.Du Y, Wooten MC, Gearing M, et al. Age-associated oxidative damage to the p62 promoter: implications for Alzheimer disease. Free Radic Biol Med. 2009;46:492–501. doi: 10.1016/j.freeradbiomed.2008.11.003. [DOI] [PMC free article] [PubMed] [Google Scholar]
- 96.Du Y, Wooten MC, Wooten MW. Oxidative damage to the promoter region of SQSTM1/p62 is common to neurodegenerative disease. Neurobiol Dis. 2009;35:302–10. doi: 10.1016/j.nbd.2009.05.015. [DOI] [PMC free article] [PubMed] [Google Scholar]
- 97.Babu JR, Seibenhener ML, Geetha T, et al. Genetic Inactivation of p62 leads to accumulation of hyperhosphorylated tau and neurodegeneration. J Neurochem. 2008;106:107–20. doi: 10.1111/j.1471-4159.2008.05340.x. [DOI] [PubMed] [Google Scholar]
- 98.Kuusisto E, Salminen A, Alafuzoff I. Ubiquitin-binding protein p62 is present in neuronal and glial inclusions in human tauopathies and synucleinopathies. Neuroreport. 2001;12:2085–90. doi: 10.1097/00001756-200107200-00009. [DOI] [PubMed] [Google Scholar]
- 99.Joazeiro CA1, Weissman AM. RING finger proteins: mediators of ubiquitin ligase activity. Cell. 2000;102:549–52. doi: 10.1016/s0092-8674(00)00077-5. [DOI] [PubMed] [Google Scholar]
- 100.Babu JR1, Geetha T, Wooten MW. Sequestosome 1/p62 shuttles polyubiquitinated tau for proteasomal degradation. J Neurochem. 2005;94:192–203. doi: 10.1111/j.1471-4159.2005.03181.x. [DOI] [PubMed] [Google Scholar]
- 101.Geetha T, Zheng C, Unroe B, et al. Polyubiquitination of the neurotrophin receptor p75 directs neuronal cell survival. Biochem Biophys Res Commun. 2012;421:286–90. doi: 10.1016/j.bbrc.2012.04.001. [DOI] [PubMed] [Google Scholar]
- 102.Wilson AC, Dugger BN, Dickson DW, et al. TDP-43 in aging and Alzheimer’s disease - a review. Int J Clin Exp Pathol. 2011;4:147–55. [PMC free article] [PubMed] [Google Scholar]
- 103.Keage HA, Hunter S, Matthews FE, et al. DP-43 pathology in the population: prevalence and associations with dementia and age. J Alzheimers Dis. 2014;42:641–50. doi: 10.3233/JAD-132351. [DOI] [PubMed] [Google Scholar]
- 104.Josephs KA, Whitwell JL, Weigand SD, et al. TDP-43 is a key player in the clinical features associated with Alzheimer’s disease. Acta Neuropathol. 2014;127:811–24. doi: 10.1007/s00401-014-1269-z. [DOI] [PMC free article] [PubMed] [Google Scholar]
- 105.Neumann M, Sampathu DM, Kwong LK, et al. Ubiquitinated TDP-43 in frontotemporal lobar degeneration and amyotrophic lateral sclerosis. Science. 2006;314:130–3. doi: 10.1126/science.1134108. [DOI] [PubMed] [Google Scholar]
- 106.Pikkarainen M, Hartikainen P, Alafuzoff I. Neuropathologic features of frontotemporal lobar degeneration with ubiquitin-positive inclusions visualized with ubiquitin-binding protein p62 immunohistochemistry. J Neuropathol Exp Neurol. 2008;67:280–98. doi: 10.1097/NEN.0b013e31816a1da2. [DOI] [PubMed] [Google Scholar]
- 107.Barmada SJ, Serio A, Arjun A, et al. Autophagy induction enhances TDP43 turnover and survival in neuronal ALS models. Nat Chem Biol. 2014;10:677–85. doi: 10.1038/nchembio.1563. [DOI] [PMC free article] [PubMed] [Google Scholar]
- 108.Dello Russo C, Lisi L, Tringali G, et al. Involvement of mTOR kinase in cytokine-dependent microglial activation and cell proliferation. Biochem Pharmacol. 2009;78:1242–51. doi: 10.1016/j.bcp.2009.06.097. [DOI] [PubMed] [Google Scholar]
- 109.Xiao Q, Yan P, Ma X, et al. Enhancing astrocytic lysosome biogenesis facilitates Aβ clearance and attenuates amyloid plaque pathogenesis. J Neurosci. 2014;34:9607–20. doi: 10.1523/JNEUROSCI.3788-13.2014. [DOI] [PMC free article] [PubMed] [Google Scholar]
- 110.Mueller SG, Schuff N, Yaffe K, et al. Hippocampal atrophy patterns in mild cognitive impairment and Alzheimer’s disease. Hum Brain Mapp. 2010;31:1339–47. doi: 10.1002/hbm.20934. [DOI] [PMC free article] [PubMed] [Google Scholar]