Abstract
Different material models for an idealized three-layered abdominal aorta are compared using computational techniques to study aneurysm initiation and fully developed aneurysms. The computational model includes fluid–structure interaction (FSI) between the blood vessel and the blood. In order to model aneurysm initiation, the medial region was degenerated to mimic the medial loss occurring in the inception of an aneurysm. Various cases are considered in order to understand their effects on the initiation of an abdominal aortic aneurysm. The layers of the blood vessel were modeled using either linear elastic materials or Mooney–Rivlin (otherwise known as hyperelastic) type materials. The degenerated medial region was also modeled in either linear elastic or hyperelastic-type materials and assumed to be in the shape of an arc with a thin width or a circular ring with different widths. The blood viscosity effect was also considered in the initiation mechanism. In addition, dynamic analysis of the blood vessel was performed without interaction with the blood flow by applying time-dependent pressure inside the lumen in a three-layered abdominal aorta. The stresses, strains, and displacements were compared for a healthy aorta, an initiated aneurysm and a fully developed aneurysm. The study shows that the material modeling of the vessel has a sizable effect on aneurysm initiation and fully developed aneurysms. Different material modeling of degeneration regions also affects the stress–strain response of aneurysm initiation. Additionally, the structural analysis without considering FSI (called noFSI) overestimates the peak von Mises stress by 52% at the interfaces of the layers.
Keywords: Three-layered wall, Fluid–structure interaction, Abdominal aorta, Wall stresses and strains
Introduction
An aneurysm is a focal dilatation of a blood vessel, which may rupture and cause death. Cerebral artery aneurysms (CAA) and abdominal aortic aneurysms (AAA) are the most common aneurysm types. The AAA arises in the infrarenal aorta with a diameter greater than 3 cm and can be up to 9 cm in length [1, 2].
Most of the studies on aneurysms have focused on already existing realistic [3–32] or idealized aneurysms [33–43] with the aim of defining a relevant rupture criterion [4, 7, 10, 19, 20, 24]. The ratio of the vessel stress to vessel strength is regarded as an alternative tool to conventional diameter criteria, which may be insufficient in small aneurysms. In computational simulations, vessel stress is calculated as a function of the vessel diameter [7, 34], wall thickness [36, 37], asymmetry [14, 18, 34, 36], tortuosity [21], material property [17, 24, 29, 38], calcification [15, 22], intraluminal thrombus (ILT) [5, 15, 16, 33], and blood flow [4, 9, 13, 14, 17, 20, 25, 26, 28–30, 32, 35–41]. Blood vessel strength is measured by ex vivo studies [11, 12, 23, 31, 44] or estimated by effective features such as ILT existence, sex, and genetic vulnerability [10]. Medical treatment techniques of aneurysms, mainly stent applications, are also investigated [35, 40]. Table 1 shows a summary of previous studies about aneurysm initiation, the fully developed aneurysm and aortic dissection to the authors’ best knowledge.
Table 1.
Summary of past studies on modeling aneurysms
| No. of layers | Material property | CA | AA | Aortic arch | |
|---|---|---|---|---|---|
| Study of initiation of aneurysms | Single layer | LE | [49–52] | – | – |
| HE | – | – | – | ||
| Three layer | LE | – | Present study | – | |
| HE | – | Present study | – | ||
| Study of fully developed aneurysms | Single layer | LE | [27, 29, 30] | [4, 14, 21, 33–36, 41] | [42] |
| HE | [27–29, 31, 32] | [3, 5–10, 13, 15–20, 22, 24–26, 37–39] | – | ||
| Three layer | LE | – | [40], Present study | [43] | |
| HE | – | Present study | – | ||
| Study of aortic dissection | Single layer | LE | – | – | [57, 58] |
| HE | – | – | – | ||
| Three layer | LE | – | [59] | [55–58] | |
| HE | – | – | – |
CA cerebral artery, AA abdominal aorta, – Indicates we could not find examples for that study, LE linear elastic material, HE hyperelastic material
Although the reasons of AAA formation are not yet well clarified, suggestions are either local weakening of the artery due to loss of medial elastin and then the degeneration of smooth muscle cells (SMC) or the existence of atherosclerotic plaque with ILT as an initial mechanism [1]. Researchers have considered different constitutive models for investigating inception and growth of aneurysms [45–48]. Vena et al. presented an anisotropic model for early stages of an aneurysm to study growth and remodeling [45]. Schmid investigated the effects of differences in elastic properties, fiber orientations, and metabolic activities on aneurysm formation and rupture in his layer-specific structural artery model [48].
Very few examples of computational studies regarding early stages of aneurysm considered cerebral aneurysms. Chatziprodromou et al. modeled inception and growth of aneurysms in an idealized carotid artery [49]. They modeled the initiation of an aneurysm by decreasing Young’s modulus of elasticity at a local region where hypothetical SMC relaxation was considered. Feng et al. [50, 51] made a similar assumption considering that high wall shear stress (WSS) causes wall weakening. They decreased the modulus of elasticity at the regions of high WSS in curved and straight idealized intracranial arterial geometries. Nabaei [52] et al. also based their hypothesis on the assumption that SMC relaxation causes aneurysm formation. However, they modeled it by using a hyperelastic material model with a large strain formulation at the bifurcation, where most saccular cerebral aneurysms exist, and the other regions of the vessel were modeled as linearly elastic material. Foutrakis modeled different stages of a rigid aneurysm wall in terms of geometries to investigate the progression of each stage [53].
Although the aorta was assumed as a single-layered structure for simplification in most studies, it has three layers: intima, media, and adventitia [54]. Since imaging techniques are not sufficiently reliable to obtain the accurate vessel thickness, vessel thickness was assumed to be uniform, having the same material properties through the vessel. However, in vivo studies have shown that each layer differs in its contribution to the material properties of the vessel [43, 55–60]. Gao et al. conducted stress analysis in a layered aortic arch aneurysm [43] and in a recent study they compared stenting and wrapping techniques in a 2D-layered idealized abdominal aortic aneurysm [40]. Khanafer et al. also studied aortic dissection in a layered aortic arch by utilizing physiological waveforms at the inlet and outlet of an aorta [59].
The objective of the present research is to understand the effects of the material properties of a 3D, idealized three-layered abdominal aorta on its aneurysm initiation and fully developed aneurysm by modeling three individual layers in the blood vessel. Both linear elastic and hyperelastic material properties were used for a healthy and locally degenerated section of the blood vessel. The healthy (intact) vessel was the abdominal aorta without any degenerated area or aneurysm. The FSI between the blood and vessel was also considered in the study.
Methods
Model geometry
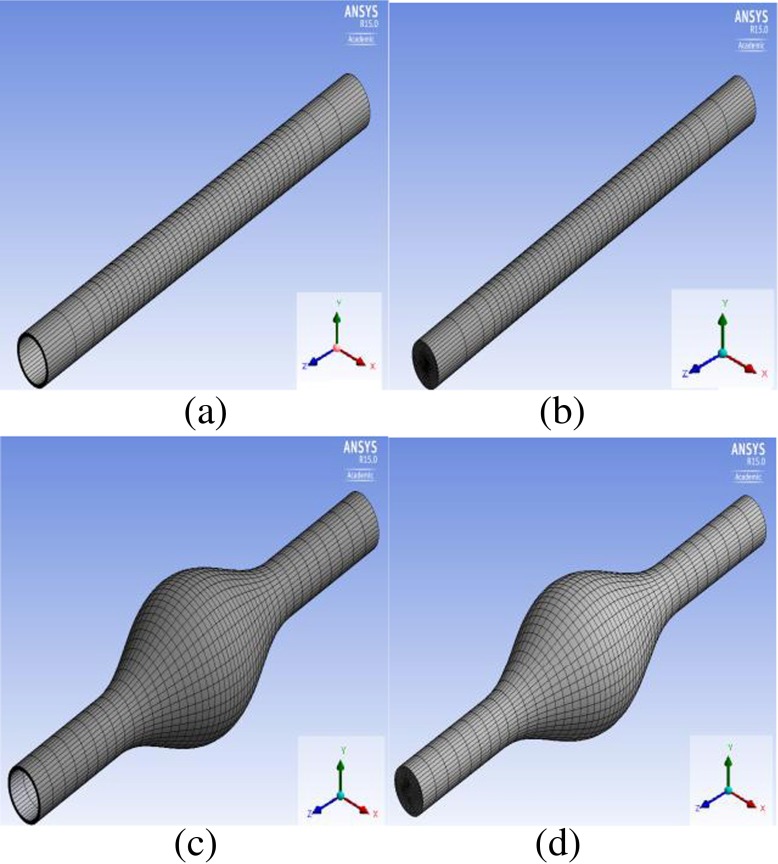
Idealized 3D models were developed for a three-layered abdominal aorta for aneurysm initiation as well as for a fully developed three-layered abdominal aortic aneurysm using Design Modeler (ANSYS 15), as shown in Fig. 1a, b, c, d. Although the actual length of the vessel is 12 cm, the aorta models were elongated and assumed to be 24 cm to eliminate the effects of boundary conditions on the flow characteristics. In the fully developed aneurysm models, the aneurysmal region was assumed to be 12 cm, which is half of the total aorta. The in vivo wall thickness of the infrarenal aorta is between 0.14 and 0.15 cm with a ratio of 20:47:33 for intima: media: adventitia [60]. In this study, the thickness of the vessel was assumed to be constant throughout the vessel with a total radius of 0.15 cm for the vessel and 0.03 cm: 0.075 cm: 0.045 cm for intima, media, and adventitia, respectively. Rather than the constant vessel thickness assumption, which is common in the literature in either patient-specific models or idealized models, Takizawa et al. summarized different methods for more realistic vessel thickness reconstruction [61]. They determined the wall thickness information when constructing an ‘estimated zero-pressure (EZP) arterial geometry’ for image-based arterial geometries by trying different ratios of wall thickness to the diameter of the arterial lumen. Other methods proposed include solving the Laplace equation over the arterial volume mesh [62] and over the surface mesh covering the lumen [63]. Since our models are idealized geometries without non-uniformities or complex variations, we used a constant wall thickness for all three layers throughout the vessel. The lumen diameter was assumed to be 2 cm. In the fully developed aneurysmal model, the maximum diameter was assumed to be 6 cm.
Fig. 1.
(a-d) Computational domains. (a) Structural domain for the intact vessel (b) fluid domain for the intact vessel (c) structural domain for the aneurysmal vessel (d) fluid domain for the aneurysmal vessel
Material models
The vessel wall was modeled based on two different assumptions. First of all, it was assumed to be incompressible, isotropic, homogeneous, and linearly elastic. The material properties used in the aneurysm-initiation model have an average Young’s modulus of 1.2 MPa and a Poisson ratio of 0.49 [35]. The other assumption was a hyperelastic wall material using the coefficients in the study by Raghavan and Vorp [64]. Although the hyperelastic model of Fung type has also been suggested and used in the literature [65], in this study we used the Mooney–Rivlin type, since the experimental data of the aneurysmal abdominal aorta by Raghavan et al. were provided for the Mooney–Rivlin type model. The strain energy density function is:
| 1 |
where W is the strain energy density of the material, C10 and C20 are the material constants, I1 is the first deviatoric strain invariant and J is the ratio of the deformed elastic volume over the undeformed volume materials. The parameter d is the material incompressibility parameter. The initial shear modulus μ, Poisson’s ratio ν, and the bulk modulus K, are related to d as follows:
| 2 |
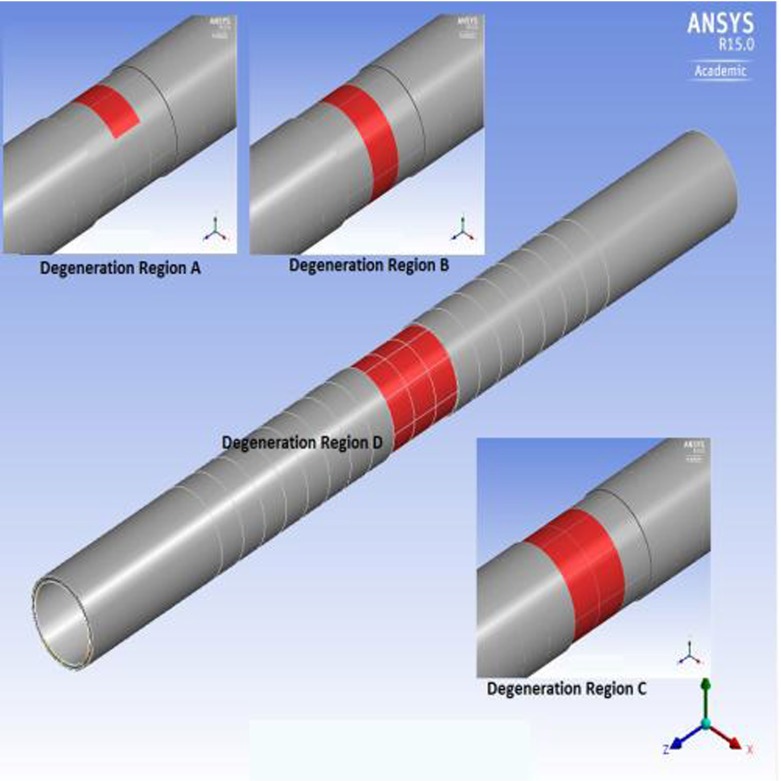
All the material properties for each layer used in the study are shown in Table 2. The reduction ratio of the aneurismal vessel to the healthy vessel was assumed to be the same for both linearly elastic and hyperelastic materials. The wall density is 1,120 kg/m3. The blood was assumed to have the characteristics of a Newtonian, laminar, and incompressible fluid. The density of blood is 1,050 kg/m3 and its dynamic viscosity is 0.0035 Pa s [25]. The Young’s modulus ratio for intima/media/adventitia was assumed to be 1/3/2 [40, 59]. Degeneration was applied on the media layer by decreasing its modulus of elasticity or the coefficients of the strain energy function by 1/20 [51]. The degenerated regions of four different sizes are shown in Fig. 2. The red color indicates the degeneration zone in the media. In the figure, the adventitia layer was removed on top of the degenerated zone in order to clearly show the image of the degenerated zone. The model called ‘Degeneration in Region A’ has a local degeneration consisting of two medial arcs (100 elements) located near the center of the longitudinal axis (at z = 11.6 cm); the model called ‘Degeneration in Region B’ has one circular medial ring (400 elements); the model called ‘Degeneration in Region C’ has two circular medial rings (800 elements, zcenter = 12 cm); and the last model called ‘Degeneration in Region D’ has three consecutive medial rings (1,200 elements). Henceforth, the four cases are called DR case A, DR case B, DR case C, and DR case D, respectively, in the text as well as in the figures.
Table 2.
Material properties for each layer and the damaged zone
| Linearly elastic | Hyperelastic | |||||
|---|---|---|---|---|---|---|
| E (MPa) | ν | C10 (MPa) | C20 (MPa) | d | ||
| Initiation of aneurysm | Average | 1.200 | 0.490 | 0.077 | 0.836 | 0.517 |
| Intima | 0.522 | 0.490 | 0.034 | 0.363 | 1.190 | |
| Media | 1.565 | 0.490 | 0.101 | 1.090 | 0.397 | |
| Adventitia | 1.043 | 0.490 | 0.067 | 0.727 | 0.595 | |
| Degenerated zone | 0.078 | 0.490 | 0.005 | 0.055 | 7.931 | |
| Aneurysm | Average | 2.700 | 0.450 | 0.174 | 1.881 | 1.149 |
| Intima | 1.174 | 0.450 | 0.076 | 0.818 | 2.644 | |
| Media | 3.522 | 0.450 | 0.227 | 2.453 | 0.881 | |
| Adventitia | 2.348 | 0.450 | 0.151 | 1.636 | 1.322 | |
E Young’s modulus of elasticity, ν Poisson’s ratio, d incompressibility parameter
Fig. 2.
Degeneration regions (red) simulated in the study
Boundary conditions
The time-dependent fully developed laminar flow velocity and the time-dependent pressure wave-forms, as suggested by Mills et al., were applied at the inlet and outlet of the fluid domain, respectively [66]. Peak systolic pressure occurs at t = 0.53 s (15,594.5 kg/m s2) and peak systolic flow is obtained at t = 0.45 s (0.437886 m/s). In patient-specific geometries, a special mapping technique is suggested in order to determine the non-circular inlet velocity profile as a starting condition [67]. Pre-FSI analysis consisting in either structural-only or fluid-only computation as starting conditions has also been suggested [65]. In that study, they also took into account the pre-stress geometry estimation. Those starting conditions are more realistic and would be more informative, especially for patient-specific geometries. In our case, idealized models are performed with zero inlet velocity and zero outlet pressure as starting conditions. For the solid domain, both the inlet and outlet of the domain were fixed for all degrees of freedom. At the interface between fluid and solid, a no-slip boundary condition was applied.
Structural-only model analysis
A transient structural analysis without considering FSI (called noFSI) was performed on the intact vessel model with both linearly elastic and hyperelastic wall materials to compare the models with and without FSI, respectively. A uniform pressure similar to the pressure waveform which is utilized at the outlet of the fluid model in FSI analysis, was applied on the inner surface of the aorta lumen for the noFSI analysis. The vessel was fixed at both ends for all degrees of freedom. The mesh density of the structural domain of the noFSI analysis was assumed to be the same as that of the structural domain of the FSI analysis.
Numerical modeling
The finite element program called ANSYS 15 was used to solve the fluid–structure interaction problem as well as structural-only analysis. ANSYS CFX is the fluid solver. The governing Navier–Stokes equations are:
| 3 |
| 4 |
where ρ is density, U is the vector velocity, p is pressure, τ is the shear stress and Sm is the momentum source. FSI analysis was conducted using two-way iteratively implicit coupling and ALE formulation. Convergence is not easy to achieve with this type of coupling, which requires that the solid and fluid equations are solved separately and then coupled at the interface by a load transfer, especially for soft structures filled with incompressible heavy fluids, as is the case in arterial modeling. Tezduyar et al. developed techniques to solve fully discretized fluid–structure interaction problems for the special deforming-spatial-domain/stabilized space-time (S-DSD/SST) formulation. The monolithic (i.e., strongly coupled) techniques, which are the block-iterative, quasi-direct, and direct coupling techniques, are suggested to be more robust, and quasi-direct and direct coupling techniques are especially relevant for FSI analysis with light structures [62, 68]. In this study, the approach that the commercial package Ansys offers was used.
The time step used for the analysis was 0.1 s and the termination time was 1.1 s. In the comparison of the noFSI and FSI analyses, the FSI model was performed for two cycles and the results of the second cycle were used in order to eliminate the effect of initialization in the FSI analysis. On the other hand, since maximum von Mises stress in the second cycle was larger only by 0.9% from the first cycle, the results of the first cycle were used for the other analysis in the study. The non-linear analysis was performed using the full Newton–Raphson method for a sparse matrix solver and a preconditioned conjugate gradient (PCG) solver. For the linearly elastic material, the PCG solver was used, whereas the sparse matrix solver was selected for the hyperelastic model.
Mesh independence
Aneurysm initiation model
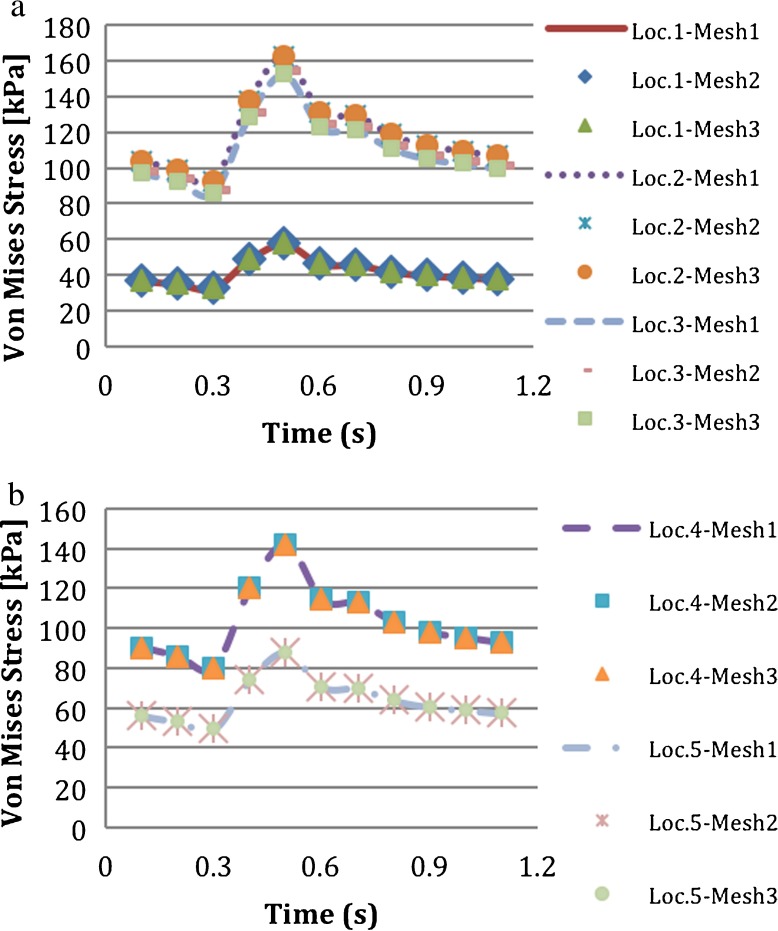
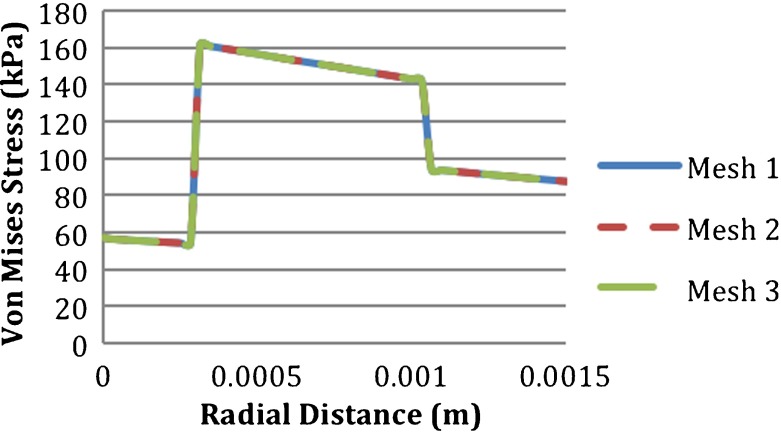
A mesh independence study was conducted for the structural model of the intact vessel using three different mesh densities as shown in Table 3. Von Mises stresses had a maximum difference of 11% and the equivalent elastic strains had a maximum difference of 14.2% between the coarsest and finest meshes. These differences occurred at the locations near the fixed ends, which was not critical for the analysis since the length of the vessel was elongated and the section under study was the mid-section of the vessel. There was no significant difference in von Mises stresses around the mid-section. Multiple locations through the thickness of the blood vessel were considered. The locations were location 1, at the interface of the intima and blood; location 2, at the interface of the media and intima; location 3, at the center of the media; location 4, at the interface of the adventitia and media; and location 5, at upper side of the adventitia as shown in Fig. 3. The von Mises stresses at the five locations through the thickness of the intact vessel are shown in Fig. 4a and b. Figure 5 shows the von Mises stresses along the thickness of the intact vessel from the intima to adventitia at the mid-line of the degenerated regions, which was also used for presentation of the results. The stress values were the same for the three meshes through the vessel. Since the computational time in mesh 1 was less than the other meshes and no significant difference in solution was detected for the locations of interest, mesh 1 was chosen for the analysis. There were no contact elements between the vessel layers; the nodes at the interfaces were shared.
Table 3.
Peak von Mises stress (PVMS) and maximum (Max) equivalent elastic strain on the abdominal aorta at t = 0.5 s (maximum)
| Mesh 1 | Mesh 3 | Mesh 3 | |
|---|---|---|---|
| Elements | 17,600 | 28,000 | 52,800 |
| Nodes | 76,960 | 121,680 | 228,320 |
| PVM stress (Pa) t = 0.5 s | 181,010 | 165,020 | 162,950 |
| Max equivalent elastic strain t = 0.5 s | 0.12811 | 0.11277 | 0.11216 |
| CPU time (s) | 8757 | 17,090 | 40,708 |
Fig. 3.
Locations of monitoring points through the vessel thickness
Fig. 4.
Effect of mesh density on temporal variation of von Mises stress calculated at a location 1, location 2, and location 3, and b location 4 and location 5
Fig. 5.
Effect of mesh density on von Mises stress of the intact vessel calculated along a line from intima to adventitia at the mid-line of the degenerated regions, which is used for representation of the results
Fluid mesh refinement was not performed independently. Since the nodes at the interface between the solid and fluid meshes exactly matched each other, the refinement of the solid mesh is associated with the refinement of the fluid mesh. The fluid mesh consisted of 26,955 nodes and 25,432 hexahedral elements. In a previous study, wall shear stresses were compared for a fluid mesh refinement, which was also coupled with the refinement of the solid mesh [69]. The refinement was made in both the normal direction near the wall and on the wall. It is stated that when the ratio of the element thickness of the first layer, to the lumen diameter at the inflow is 120 for the medium mesh, the wall shear stress results are reasonable. In our case, the intima layer, where the interface with the blood belongs, consisted of two layers, each 0.015 cm in thickness and a vessel diameter of 2 cm, resulting in a ratio of 133 that is comparable to 120. So it is considered that our fluid mesh density is sufficient for the wall shear stress calculation. The element length along the longitudinal axis in the mid-region of the vessel is 4 cm.
Aneurysm model
For a mesh independency test in the aneurysmal model, three different meshes were used for FSI analysis. Fluid mesh refinement was also performed. The number of elements and nodes for each mesh are indicated in Table 4. In Fig. 6, von Mises stresses through the line from the intima to adventitia at the maximum diameter location for each mesh are shown. Since the mesh quality did not affect the von Mises stress value, mesh 1 was chosen for the analysis.
Table 4.
Mesh densities and the time duration of the three different meshes used for mesh independency study of the aneurysm model
| Mesh 1 | Mesh 2 | Mesh 3 | ||||
|---|---|---|---|---|---|---|
| Domain | Solid | Fluid | Solid | Fluid | Solid | Fluid |
| Elements | 19,200 | 22,176 | 32,000 | 36,960 | 48,000 | 55,440 |
| Nodes | 83,840 | 23,618 | 138,880 | 39,042 | 207,680 | 58,322 |
| CPU time (s) | 21,625 | 39,470 | 100,070 | |||
Fig. 6.
Effect of mesh density on von Mises stress calculated along a line from intima to adventitia at the maximum diameter of the aneurysmal vessel
Results and discussion
Structural-only model (noFSI) and FSI model
Von Mises stresses in the intact vessel modeled using linearly elastic material were obtained at the nodal points from location 1 to location 5 as explained above, with noFSI and FSI analyses. Figure 7 compares the applied pressure on the lumen sac for the noFSI analysis and the calculated pressure at the blood–intima interface for the FSI analysis. The location of the calculated pressure waveform for the FSI analysis (dashed line) was chosen as the midline of the vessel (i.e., at z = 12 cm). The pressure waveforms were similar to each other except the time delay between them. There are several studies in the literature comparing FSI and noFSI analyses for single-layered aneurysm models [9, 37, 38]. Those studies suggested that applying transient pressure uniformly on the lumen sac for the noFSI analysis could be an adequate alternative to FSI analysis for the rupture risk criteria [2]. Khanafer et al. [38], in his single-layered axisymmetric AAA model, stated that structural-only analysis, with uniformly applied time-dependent pressure inside the aneurysm lumen, underestimated peak wall stress (PWS) by 8% compared to the FSI analysis at the time of the peak wall stress. At the time of peak luminal pressure, the noFSI analysis overestimated PWS by 5%. Different from those idealized geometries, Takizawa et al. compared the FSI model and structural model with a time-dependent pressure, in patient-specific models. They found very similar stress and stretch results for the FSI and structural model, with less than 1% difference in the maximum arterial-wall stress [63]. We also found similar stress values between noFSI and FSI analyses in terms of magnitude at the blood–intima interface (location 1), at the center of the media (location 3) and outside of the adventitia (location 5). The noFSI analysis overestimated peak von Mises stress (PVMS) only by 1.6%.
Fig. 7.
Time-dependent pressure waveforms. Solid line indicates applied pressure waveform inside of the aorta lumen and dashed line indicates pressure waveform on blood–intima interface
Although the magnitudes of the stress in the two analyses were close to each other on the vessel wall and in the media (locations 1, 3, 5), PVMS occurred later in the FSI analysis than the noFSI analysis. The reason for this delay was the time delay between the pressure waveform applied on the aneurysm sac in the noFSI model and the one calculated on the blood–intima interface in the FSI model as discussed above and shown in Fig. 7. Khanafer et al. showed that PWS and peak nodal displacement in the FSI analysis occurred earlier than in the noFSI analysis [38]. In our case, PVMS occurred earlier in the noFSI analysis. In the present model, the waveform of pressure was applied to the inlet and the length of the vessel was rather long, which resulted in a delay in arrival of the peak pressure to the longitudinal center of the vessel.
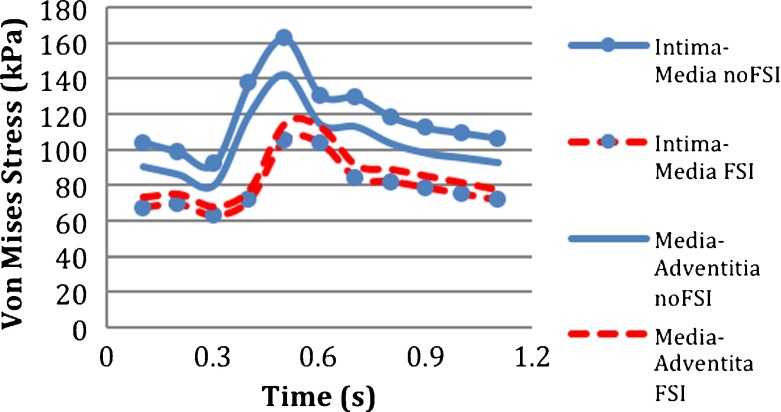
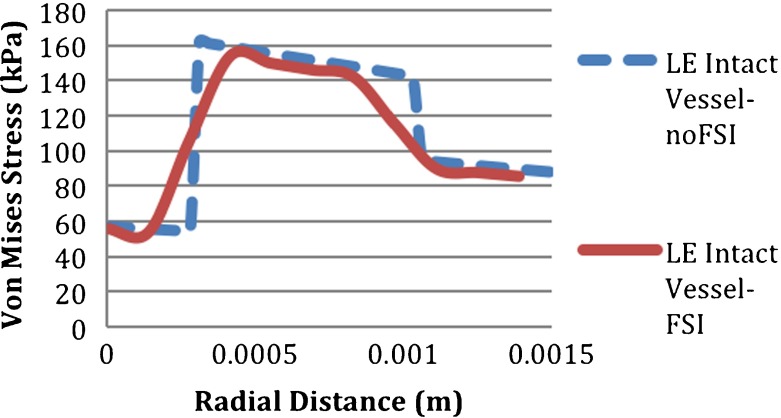
On the other hand, at the interfaces of the layers, which were the intima–media and media–adventitia interfaces, the results of the FSI and noFSI analyses were significantly different from each other, as shown in Fig. 8. The noFSI model overestimated the PVMS stress by 52% at the intima–media interface and by 22% at the media–adventitia interface. Additionally, as seen in Fig. 9, the stress distribution through the vessel thickness changed sharply at the interfaces of the layers in the noFSI analysis, whereas it was continuous and smooth in the FSI analysis.
Fig. 8.
Temporal variation of von Mises stress in noFSI and FSI models at location 2: intima–media, and at location 4: media–adventitia at the middle of the vessel
Fig. 9.
Variation of von Mises stress across the vessel thickness of the intact abdominal aorta in noFSI (dashed line) and FSI model (solid line)
In single-layered models, the differences between FSI and noFSI models are small, but in our three-layered model, there are differences in von Mises stresses of the two analyses at the interface of the layers. As blood flow does exist in human arteries, FSI analysis is more realistic than noFSI analysis; the blood flow should be taken into consideration in studying the mechanical properties of arteries. To the authors’ best knowledge, this study is the first example of a comparison between noFSI and FSI analyses of a three-layered aorta.
Initiation of aneurysm
In the three-layered abdominal aorta, four different models of aneurysm initiation and a healthy abdominal vessel without degeneration were compared in terms of stresses and strains at the initiation site. These models are called (a) intact vessel: healthy blood vessel without degeneration, (b) LE-vessel/LE-degeneration model: linearly elastic material used for the vessel and linearly elastic material used for the degenerated area, (c) LE-vessel/HE-degeneration model: linearly elastic material used for the vessel except for the degenerated area and hyperelastic (i.e., Mooney–Rivlin) material used for the degenerated area, (d) HE-vessel/LE-degeneration model: hyperelastic material used for the vessel except for the degenerated area and linearly elastic material used for the degenerated area, (e) HE-vessel/HE-degeneration model: hyperelastic material used for the vessel and hyperelastic (i.e., Mooney–Rivlin) material used for the degenerated area. The von Mises stress distribution on the LE-vessel/LE-degeneration model with DR case A is shown in Fig. 10.
Fig. 10.
Von Mises stress distribution on the abdominal aorta for the LE-vessel/LE-degeneration model in DR case A. Nodal displacement is magnified
Vessel wall modeling
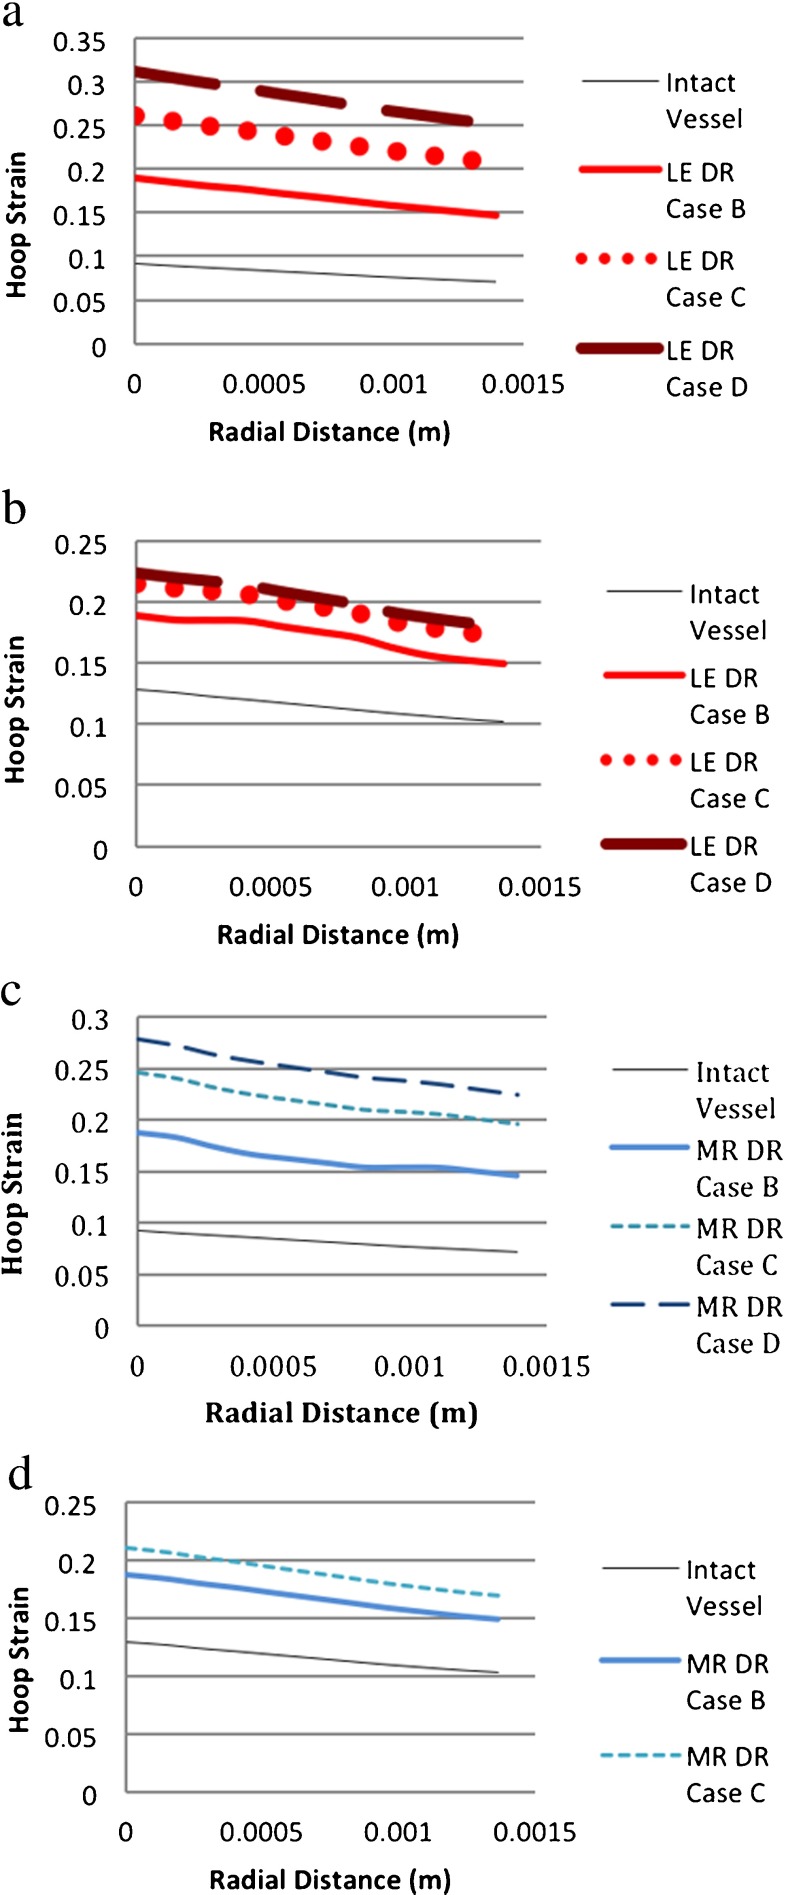
In the vessel modeled as linearly elastic and hyperelastic materials, hoop strains decreased from the intima to adventitia in both the degenerated and intact vessel models (Fig. 11a–d). As expected, as the area of degeneration increased, the magnitude of hoop strain increased.
Fig. 11.
Comparison of hoop strains for different material models. (DR case B: 1 medial ring. DR case C: two medial rings. DR case D: 3 medial rings. LE linearly elastic, MR Mooney–Rivlin (i.e., hyperelastic), HE hyperelastic). a LE-vessel/LE-degeneration model. b HE-vessel/LE degeneration model. c LE-vessel/HE-degeneration model. d HE-vessel/HE-degeneration model
Since the hoop strains through the vessel thickness of the undegenerated and degenerated models varied in a similar fashion, the different material models for aneurysm initiation did not provide a qualitative distinction in terms of hoop strains. However, there was a noticeable difference in the hoop strain distributions of the LE-vessel and HE-vessel models in their responses to aneurysm initiation, which was modeled as a degenerated material in the study. For the LE-vessel/LE-degeneration model, the hoop strain increased more than the HE-vessel/LE-degeneration model. The increase in the strain in the LE-vessel from one circular degenerated ring (DR case B) to two rings (DR case C) was 38% and from two circular degenerated rings (DR case C) to three degenerated rings (DR case D) the increase was 19% (Fig. 11a). For the HE-vessel/ LE-degeneration model, the increase in the hoop strain from DR case B to DR case C was 13% and there was a slight change (3%) in strains between DR case C and DR case D (Fig. 11b). Similarly, as seen in Fig. 11c and d, for the LE-vessel/HE-degeneration, the increase in strain from DR case B to DR case C was 34%, which was larger than that of the HE-vessel/HE-degeneration (14%).
These findings showed that the hoop strains in either the LE-vessel or HE-vessel models with the same material type of degeneration were different from each other. The difference was detectable in the increasing ratio of the strain/degeneration area. The total nodal displacement had a similar pattern to the hoop strains so it was not shown here. As expected, the displacement at the degeneration region on the vessel wall increased when the aneurysm initiated. Since local (DR case A) and one circular ring degenerations (DR case B) had similar strain values, the local degeneration line was not shown in the plots.
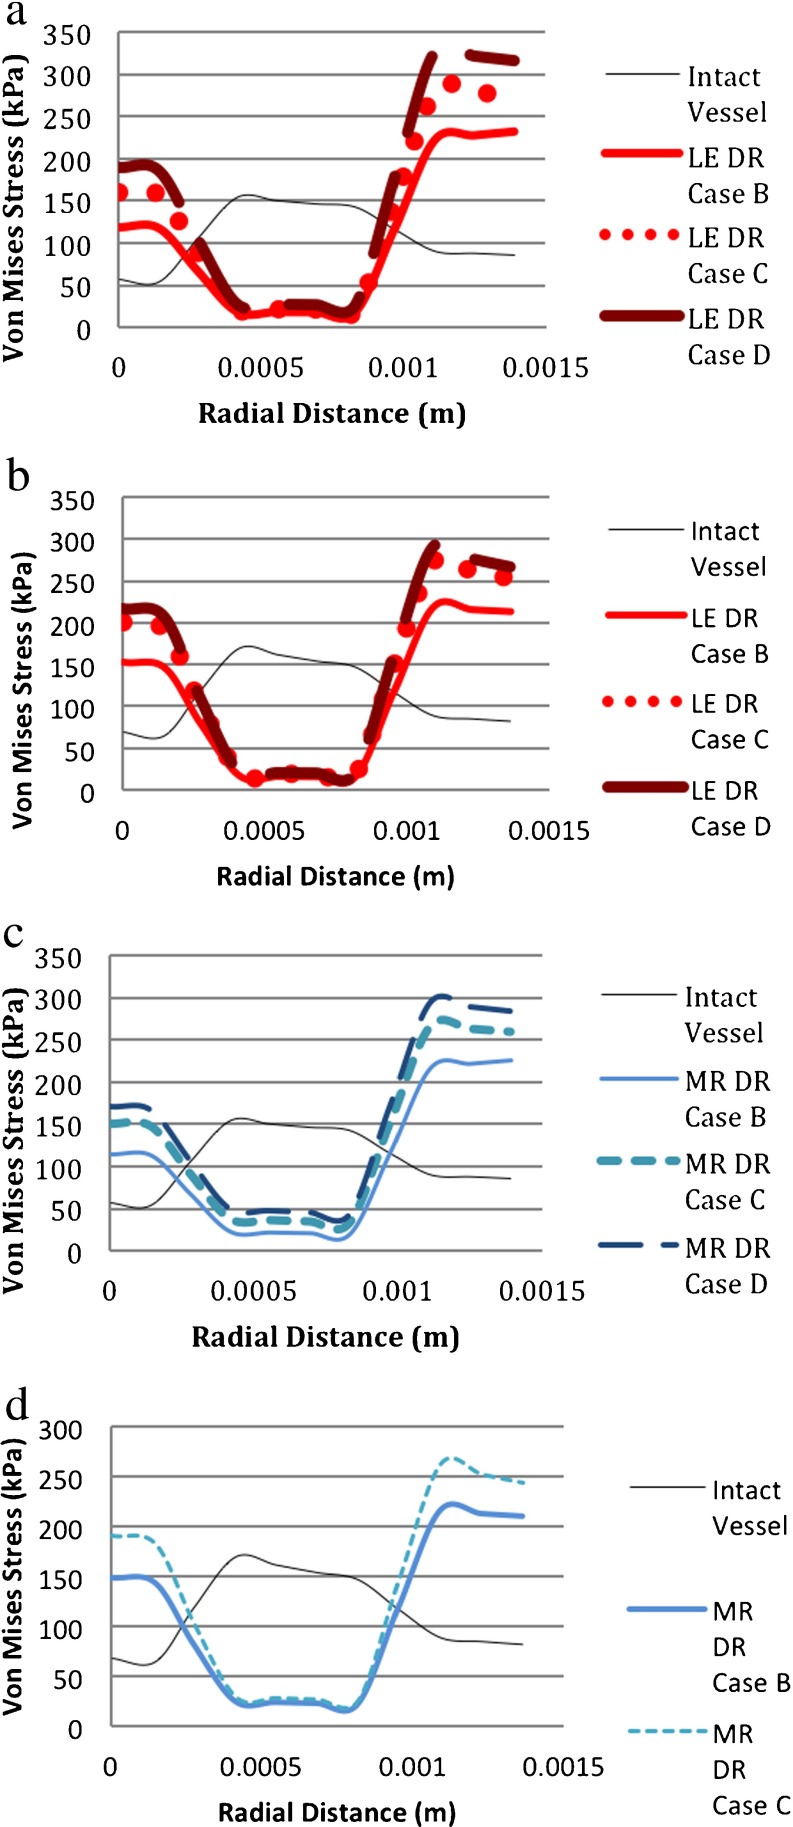
Figure 12a–d shows that in aneurysm inception, the von Mises stress decreases in the media and increases in the intima and adventitia. So the media bore a higher stress in the healthy aorta but, at the initiation of an aneurysm, which might be due to medial loss, the medial stress decreased and the intima and adventitia carried more load. The collagen-rich adventitia had the highest stress values. This was consistent with the previous statements that due to mechanical loading, fibroblasts and SMCs increased the synthesis of collagen, which plays a role in the growth and remodeling of AAAs [70].
Fig. 12.
Comparison of von Mises stresses for different material models. (DR case B: 1 medial ring. DR case C: two medial rings. DR case D: 3 medial rings. LE linear elastic, MR Mooney–Rivlin (i.e., hyperelastic), HE hyperelastic). a LE-vessel/LE-degeneration model. b HE-vessel/LE-degeneration model. c LE-vessel/HE-degeneration model. d HE-vessel/HE-degeneration model
Although von Mises stress distributions varied significantly resulting from aneurysm initiation, the overall stress distributions had the same qualitative shape regardless of the different material models for both vessel models, LE-vessel and HE-vessel. There was a slight deviation from the general behavior of the models for the LE-vessel/HE-degeneration model (Fig. 12c). With this model, the von Mises stress at the medial region increased as the area of the degeneration region increased. Hoop and longitudinal stresses were similar to von Mises stresses with a slight change in magnitude.
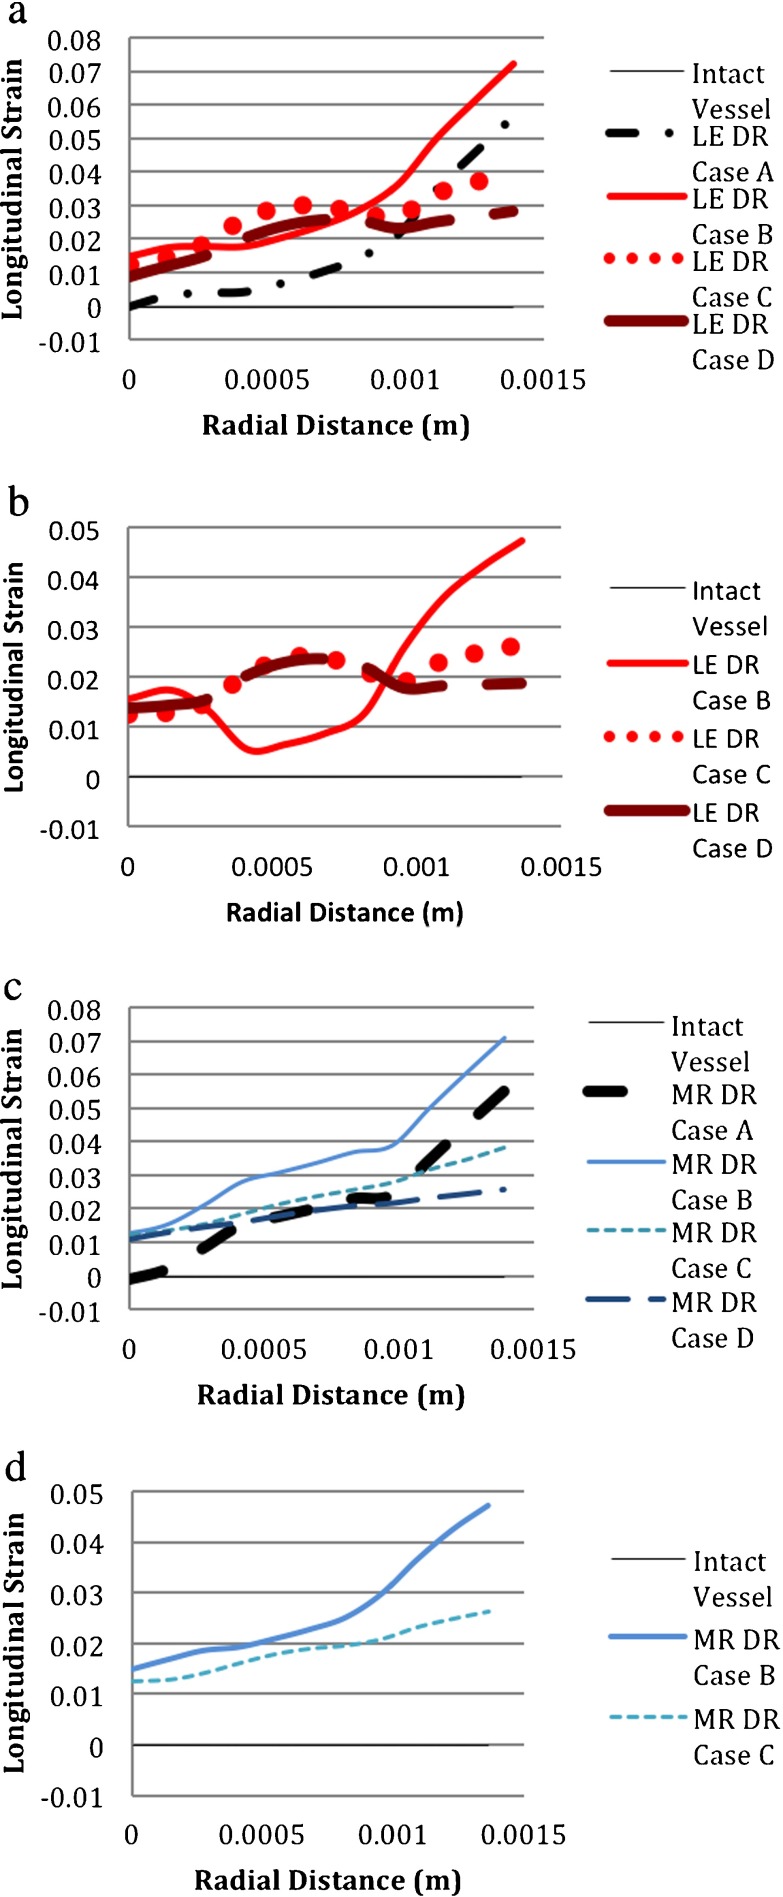
The longitudinal strain increased along the blood vessel thickness when an aneurysm initiated in both the LE-vessel and HE-vessel models; however, the responses of the two material properties were different from each other as shown in Fig. 13a, b, c and d. Regardless of the vessel and degeneration region’s material properties, DR case C and DR case D had similar longitudinal strain distributions but they were different from DR case A and DR case B, which were similar to one another. In the HE-vessel/LE-degeneration model, the medial strain in DR case B was much smaller than those of DR case C and DR case D; whereas in the LE-vessel/LE-degeneration model, the magnitude of the medial strain in DR case B was close to the magnitudes in DR case C and DR case D as compared between Fig. 13a and b. As shown in Fig. 13c and d, for HE-degeneration models, the material properties of the blood vessel also affected the longitudinal strain distribution through the vessel thickness, but not as much as in the case of LE-degeneration models. Additionally, as seen in Fig. 13a and c, distributions of longitudinal strains of DR case A and DR case B were not the same, unlike those of the hoop strain and von Mises stress.
Fig. 13.
Comparison of longitudinal strains for different material models. (DR case B: 1 medial ring. DR case C: two medial rings. DR case D: 3 medial rings. LE linear elastic, MR Mooney–Rivlin (i.e., hyperelastic); HE hyperelastic). a LE-vessel/LE-degeneration model. b HE-vessel/LE-degeneration model. c LE vessel/HE-degeneration model. d HE vessel/HE-degeneration model
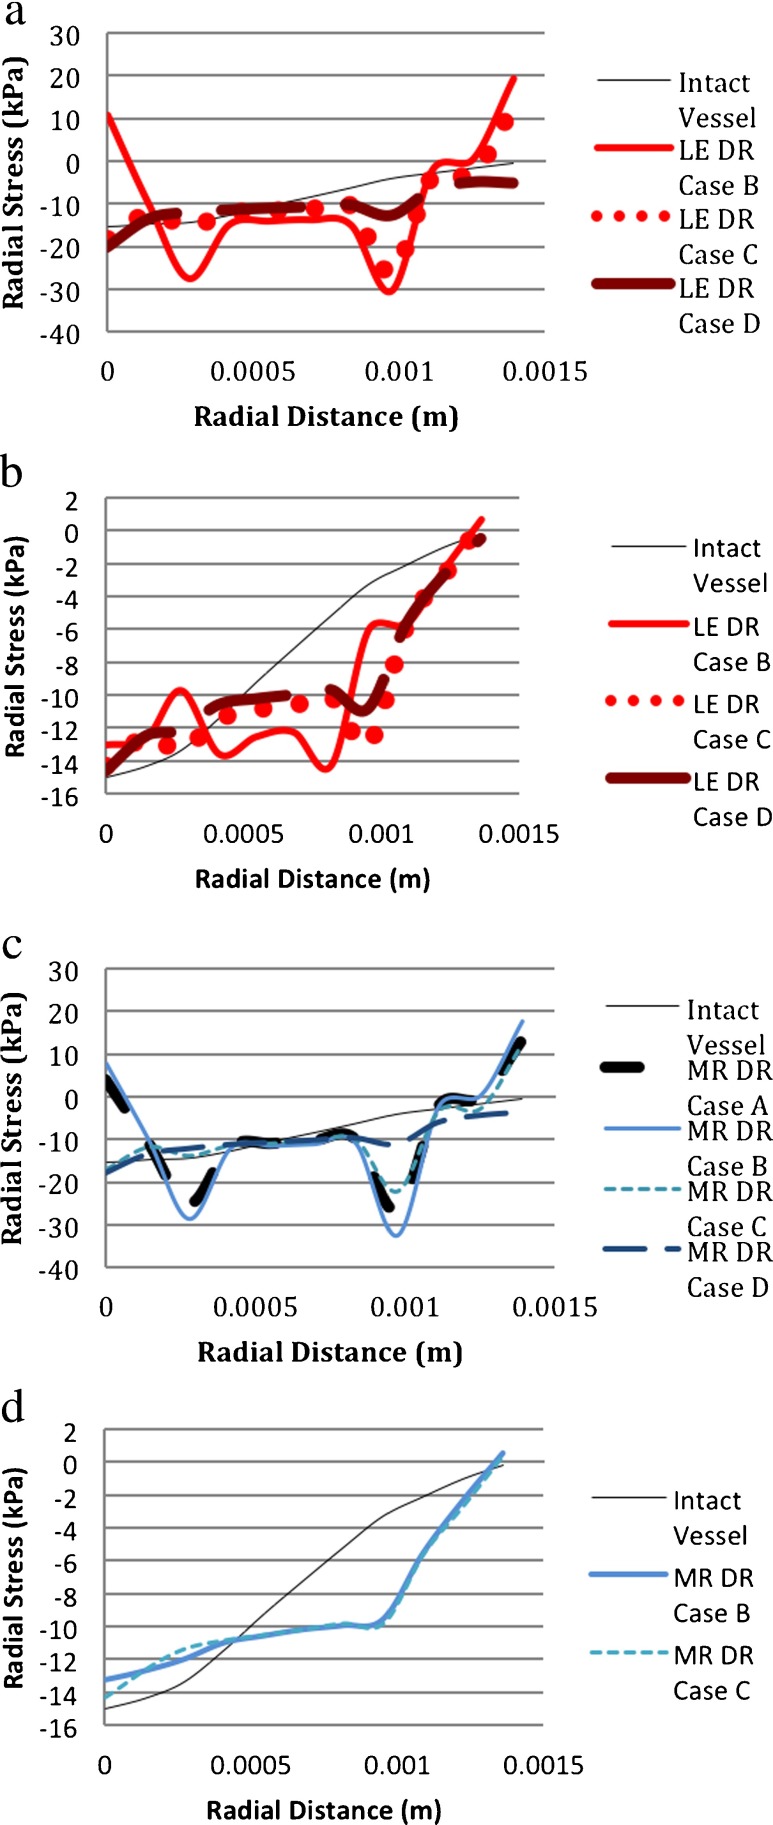
Radial stresses in the two models of blood vessels, like the LE-vessel and HE-vessel, were also different from each other. Figure 14a shows that in the LE-vessel/LE-degeneration model, there are sharp changes in the stress at the interfaces of the layers for DR case B. In DR case C, there was also a change in stress at the interfaces but it was larger at the interface between the media and adventitia than at the interface between the intima and media. For the largest area of degeneration, e.g., the DR case D model, the change in stress through the vessel was smaller than those of less degenerated areas. In the HE-vessel/LE-degeneration model, there were oscillations of the stress value through the vessel thickness for DR case B as shown in Fig. 14b. At the HE-vessel/HE-degeneration model with DR case B and DR case C, the radial stress did not change at the interfaces of the layers unlike the LE-vessel/HE-degeneration model. Another observation to be noted is that although for all of the four models the stress was largest in the adventitia, the adventitial stresses in the HE-vessel/LE-degeneration and HE-vessel/HE-degeneration models were significantly larger than the stresses in the intima and media.
Fig. 14.
Comparison of radial stresses for different material models. (DR case B: 1 medial ring. DR case C: two medial rings. DR case D: 3 medial rings. LE linear elastic, MR Mooney–Rivlin (i.e., hyperelastic), HE hyperelastic). a LE-vessel/LE-degeneration model. b HE-vessel/LE-degeneration model. c LE-vessel/HE-degeneration model. d HE-vessel/HE-degeneration model
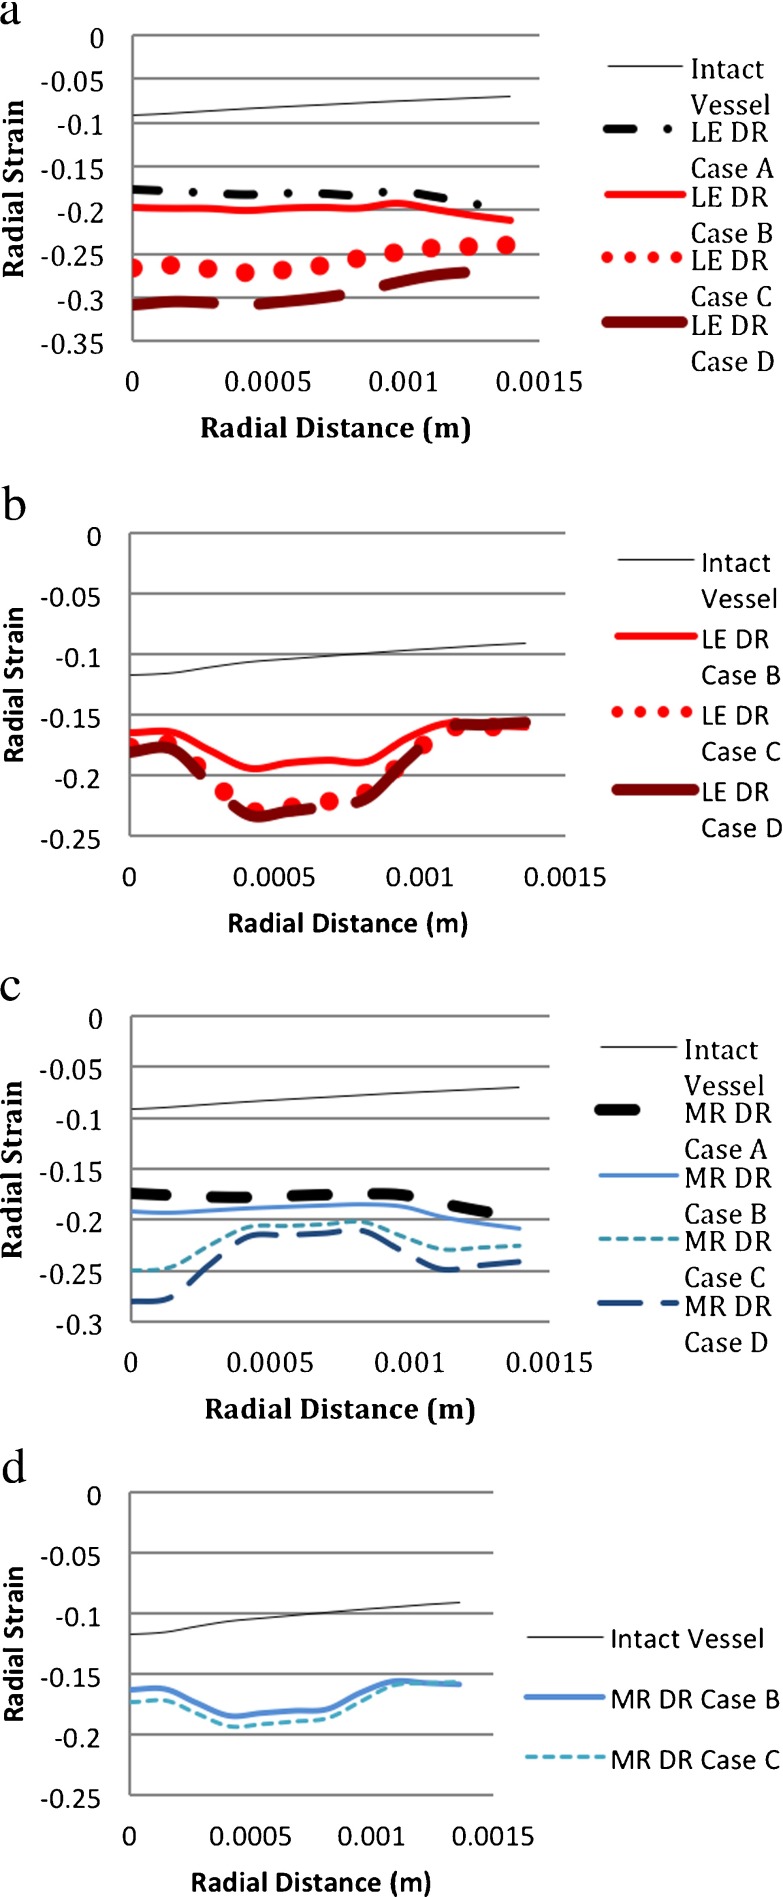
The radial strain distribution resulting from aneurysm initiation in the HE-vessel models was different from the LE-vessel models as seen in Fig. 15 (a,b,c,d). In the LE-vessel/LE-degeneration model, the radial strain was almost constant throughout the vessel, whereas in the HE-vessel/LE-degeneration model, the radial strain decreased in the medial region. The LE-vessel/HE-degeneration and HE-vessel/HE-degeneration models also had different distributions of radial strain. In the LE-vessel/HE-degeneration model, the radial strain in the media increased for DR case C and DR case D, whereas it decreased in DR case B and DR case C of the HE-vessel/HE-degeneration model.
Fig. 15.
Comparison of radial strains for different material models. (DR case B: 1 medial ring. DR case C: two medial rings. DR case D: 3 medial rings. LE linear elastic, MR Mooney–Rivlin (i.e., hyperelastic), HE hyperelastic). a LE-vessel/LE-degeneration model. b HE-vessel-LE-degeneration model. c LE-vessel/HE-degeneration model. d HE-vessel/HE-degeneration model
It is known that the human abdominal aorta has non-linear characteristics and thus a Mooney–Rivlin material is more realistic than a linearly elastic material. When an aneurysm is initiated, the distributions of stresses and strains resulting from the different material models of the blood vessel are significantly different from each other. As a result, hyperelastic material modeling of the blood vessel should be taken into consideration in modeling an aneurysm initiation in the blood vessel.
Degeneration region modeling
Material modeling of the degeneration region in association with aneurysm initiation was also investigated for its effect on the mechanical behavior of the initiation mechanism.
In either the LE-vessel or HE-vessel, the material properties of the degenerated zone did not affect the distribution characteristics of hoop strains and von Mises stresses through the vessel thickness as shown in Figs. 11a–d and 12a–d. The only detectable difference was in the LE-vessel/HE-degeneration model as discussed in the previous section.
For the same material model of the vessel, material properties of the degeneration region changed the longitudinal strain through the vessel, as seen in Fig. 13a–d. For DR case C and DR case D of the LE-degeneration models, there was an initial increase of the longitudinal strain in the medial region followed by a decrease near to the adventitia; but in the HE-degeneration models, the longitudinal strain increased almost linearly from the intima to adventitia as compared in Fig. 13a vs. 14c and 14b vs. 14d. For DR case A and DR case B, the LE-degeneration and HE-degeneration models also resulted in distinct distributions of the longitudinal strain through the vessel. Based on these findings, it could be said that the material properties of the degeneration region influenced the longitudinal strain distribution through the vessel.
For the LE-vessel/LE-degeneration and LE-vessel/HE-degeneration models, radial stress distributions through the vessel thickness were similar to each other, as shown in Fig. 14a and c. On the other hand, Fig. 14b and d show that, in the HE-vessel, the material properties of the degeneration region cause different distributions of radial stress, especially for DR case B, Fig. 15.
For the LE-vessel, the choice of material modeling for DR case C and DR case D changed the distributions of the radial strain through the thickness of the vessel. In the LE-vessel/LE-degeneration model, the radial stress through the vessel was almost constant whereas in the LE-vessel/HE degeneration model, the radial strain increased in the media as seen in Fig. 15a vs. 15c. In the HE-vessel, the material property of the degeneration region did not cause a difference in the radial strain distribution. The only difference was from DR case B to DR case C; the radial strain decreased more in the media of the HE-vessel/LE-degeneration model compared to the HE-vessel/HE-degeneration model as seen in Fig. 15b vs. 15d.
The material parameters for the degeneration region had effects on the stress/strain response of the vessel with the aneurysm initiation. More experimental work is needed to determine what material behavior better represents the degenerated region.
Blood viscosity effect
It has been proposed that blood viscosity increases with age and diabetes. In a study by Carallo et al. it was stated that the viscosity of blood increased with age in approximately 7% of the population [71]. LE-vessel/LE-degeneration in DR case C was chosen to investigate the effect of blood viscosity on the initiation of an aneurysm. The dynamic viscosity of blood was assumed to be 0.0038 Pa s. The results showed that a viscosity increase from 0.0035 Pa s did not cause any change in the stress, strain or deformation distribution through the vessel. Wang et al. investigated the blood viscosity effect in a fully developed three-layered abdominal aortic aneurysm model with kinematic viscosities 0.0027 Pa s and 0.0097 Pa s [41]. Their results showed that an increase in blood viscosity caused an increase in diameter expansion (from 52.407 to 52.408 mm in the symmetry plane) and an increase in the peak wall shear stress on the aneurismal wall. In the present computational model, the increase in blood viscosity was smaller and the geometry of the model and the parameters for comparison were different. The increase in blood viscosity by 8% did not affect aneurysm formation at the initial stages in terms of stresses and strains through the vessel thickness.
Fully developed AAA
In this section, the material modeling of the healthy abdominal aorta without any degeneration or aneurysm (intact vessel) and the fully developed aneurysm model are investigated in terms of stress–strain characteristics. Figure 16 shows that, in both the intact and aneurismal vessel, the von Mises stress is highest in the media and lowest in the intima. These results are validated by previous investigations by Khanafer et al., who studied aortic dissection in a layered idealized descending aorta model, and by Gao et al., who studied an aneurysm in an idealized layered aortic arch model [43, 59]. Although the magnitudes of the stress are not the same due to differences in types of vessels, the von Mises stress distribution through layers was consistent with the present study. In Khanafer’s study, the range of stress values was 40 kPa (intima) to 100 kPa (adventitia) in the descending aorta (without an aneurysm) while in the present study the stress range in the abdominal intact vessel was from 50 kPa (intima) to 160 kPa (adventitia). The von Mises stress values were also in accordance with another study by Raghavan et al., who used hyperelastic material properties for patient-based single-layered abdominal aneurismal models. According to their findings, the non-aneurysmal aorta had a stress value of 120 kPa and the aneurysmal vessel wall had a stress range from 290 to 450 kPa [3]. Their results and also Gao’s study showed that the aneurismal vessel had larger stress values than the vessel without an aneurysm. Our study also supported these findings. With HE material properties, in the intact vessel, the von Mises stresses were approximately 65 kPa, 170 kPa, 85 kPa in the intima, media, and adventitia, respectively, and the aneurismal vessel had larger stress values: 110 kPa, 300 kPa, and 170 kPa in the intima, media, and adventitia, respectively. For the linearly elastic intact vessel, the intimal, medial and adventitial stresses were 55 kPa, 150 kPa, 88 kPa, respectively, while in the aneurysmal vessel, von Mises stresses in the intima, medial and adventitia were approximately 100 kPa, 280 kPa and 160 kPa, respectively. Another finding shown in Fig. 17 was that maximum stress in the aneurismal aorta occurred at the inflection regions as shown in Gao’s study [43].
Fig. 16.
Von Mises stress through the thickness of the intact and aneurysmal vessel
Fig. 17.
Von Mises stress through the thickness of the aneurysmal vessel at the maximum diameter and inflation points
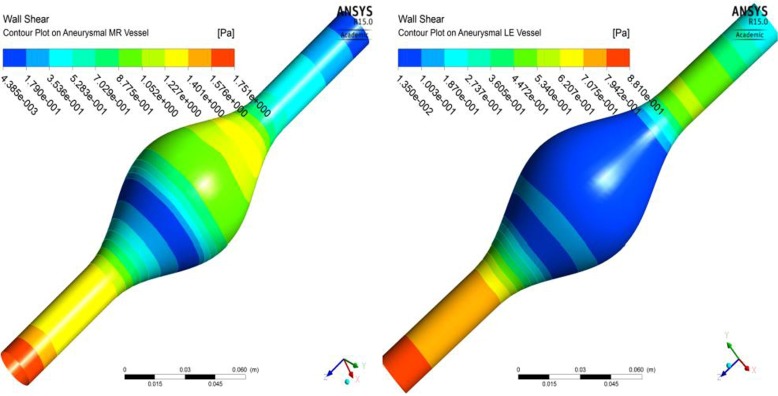
The material properties of the vessel did not affect the qualitative distribution of the von Mises stress in the intact or aneurismal vessels or the amount of increase in von Mises stresses from intact to aneurismal vessels. However, the change in nodal displacements from healthy to aneurismal tissues was larger for hyperelastically modeled vessels than for the linear elastically modeled vessels, as shown in Fig. 18. Likewise, an increase in hoop strain from intact to aneurismal vessels was larger for the hyperelastic model than for the linear elastic model as shown in Fig. 19. The strain value was smaller for the aneurismal vessel than the healthy vessel because the aneurismal vessel was stiffer than the healthy aorta. Fluid mechanics shear stress distributions on the inner surface of the arterial wall of the aneurysmal vessels modeled in linearly elastic and hyperelastic material properties were also different from each other, as shown in Fig. 20a and b.
Fig. 18.
Nodal displacement through the thickness of the intact and aneurysmal vessel
Fig. 19.
Hoop strain through the thickness of the intact and aneurysmal vessel
Fig. 20.
Fluid mechanics shear stress contour plot on the inner surface of the wall modeled in (a) hyperelastic material and (b) linearly elastic material
Conclusions
We investigated the effects of material models for an idealized three-layered abdominal aorta using computational techniques in order to study aneurysm initiation and a fully developed aneurysm. FSI was included in the study. The results showed that linearly elastic and hyperelastic material models for the vessel gave different stress–strain distributions through vessel thickness in aneurysm initiation and a fully developed aneurysm. Since the hyperelastic material is more realistic for the intact blood vessel, hyperelastic material properties should be taken into consideration in studying aneurysm stages. There was not enough experimental data for selecting the proper material modeling conditions for the degeneration region on the abdominal aorta leading to an aneurysm. This study showed that the material properties of the degenerated zone influenced the stress distribution through the three layers of the vessel, especially the longitudinal stress distribution. More experimental data are needed to understand the initiation mechanism of an aneurysm.
There were some limitations in the study that should be mentioned. The present model was an idealized model of an abdominal aorta lacking the non-uniformities in geometry in real patient data. A uniform wall thickness was chosen in aneurismal and non-aneurismal vessels, which were not realistic, especially in fully developed aneurysms [12, 23, 72]. Vessel wall remodeling during the development of an aneurysm was also disregarded in the study. Although in the present study the ratios of thickness and the elastic modulus of the layers were chosen to be the same in non-aneurismal and aneurismal vessels, it was suggested that the properties of the layers changed during vessel wall remodeling processes such as an increase in collagen fiber production [70, 73]. Presence of ILT, calcification, material anisotropy, and regional variations of the material properties are the other parameters ignored in the study. In patient-specific geometries, pre-stress or zero stress geometries are estimated to obtain more realistic geometries, because there is pressure inside the vessel when the image is captured. In a previous study, a zero-stress state was achieved in single-layered and three-layered configurations of an image-based vessel [74]. Three-layered patient-specific geometries considering the initial pressurized state of the vessel would provide more realistic results. It is also known that patient-specific material modeling has an influence on the mechanical properties of the aneurismal vessel [24]. Although these parameters would cause different results in the models such as stress distributions through the vessel and the peak wall stress, because the effects of material properties were compared on the same models, those assumptions do not affect the qualitative findings in this study.
Acknowledgments
Conflict of interest
None.
Glossary
Abbreviations
- AAA
Abdominal aortic aneurysm
- CA
Cerebral artery
- CAA
CA aneurysm
- d
Material incompressibility parameter
- DR case A
degeneration in region A
- FSI
Fluid–structure interaction
- HE
Hyperelastic
- ILT
Intraluminal thrombus
- I1
First deviatoric strain invariant
- J
The ratio of the deformed elastic volume over the undeformed volume materials
- K
Initial bulk modulus
- LE
Linearly elastic
- noFSI
Transient structural analysis without considering FSI
- PVMS
Peak von Mises stress
- PWS
Peak wall stress
- SMC
Smooth muscle cell
- WSS
Wall shear stress
- W
Strain energy density function
- ν
Poisson’s ratio
- μ
Initial shear modulus of materials
Contributor Information
Fatma Gulden Simsek, Email: fatma.temiz@boun.edu.tr.
Young W. Kwon, Email: ywkwon@nps.edu
References
- 1.Humphrey JD, Taylor CA. Intracranial and abdominal aortic aneurysms: similarities, differences, and need for a new class of computational models. Annu. Rev. Biomed. Eng. 2008;10:221–246. doi: 10.1146/annurev.bioeng.10.061807.160439. [DOI] [PMC free article] [PubMed] [Google Scholar]
- 2.Raut SS, Chandra S, Shum J, Finol EA. The role of geometric and biomechanical factors in abdominal aortic aneurysm rupture risk assessment. Ann. Biomed. Eng. 2013;41:1459–1477. doi: 10.1007/s10439-013-0786-6. [DOI] [PMC free article] [PubMed] [Google Scholar]
- 3.Raghavan ML, Vorp DA, Federle MP, Makaraun MS, Webster M. Wall stress distribution on three-dimensionally reconstructed models of human abdominal aortic aneurysm. J. Vasc. Surg. 2000;31:760–769. doi: 10.1067/mva.2000.103971. [DOI] [PubMed] [Google Scholar]
- 4.Di Martino ES, Guadagni G, Fumero A, Ballerini G, Spirito R, Biglioli P, Redaelli A. Fluid–structure interaction within realistic three-dimensional models of the aneurysmatic aorta as a guidance to assess the risk of rupture of the aneurysm. Med. Eng. Phys. 2001;23:647–655. doi: 10.1016/S1350-4533(01)00093-5. [DOI] [PubMed] [Google Scholar]
- 5.Wang DHJ, Makaroun MS, Webster MW, Vorp DA. Effect of intraluminal thrombus on wall stress in patient-specific models of abdominal aortic aneurysm. J. Vasc. Surg. 2002;36:598–604. doi: 10.1067/mva.2002.126087. [DOI] [PubMed] [Google Scholar]
- 6.Fillinger MF, Raghavan ML, Marra SP, Cronenwett JL, Kennedy FE. In vivo analysis of mechanical wall stress and abdominal aortic aneurysm rupture risk. J. Vasc. Surg. 2002;36:589–597. doi: 10.1067/mva.2002.125478. [DOI] [PubMed] [Google Scholar]
- 7.Fillinger MF, Marra SP, Raghavan ML, Kennedy FE. Prediction of rupture risk in abdominal aortic aneurysm during observation: wall stress versus diameter. J. Vasc. Surg. 2003;37:724–732. doi: 10.1067/mva.2003.213. [DOI] [PubMed] [Google Scholar]
- 8.Venkatasubramaniam AK, Fagan MJ, Mehta T, Mylankal KJ, Ray B, Kuhan G, Chetter IC, McCollum PT. A comparative study of aortic wall stress using finite element analysis for ruptured and non-ruptured abdominal aortic aneurysms. Eur. J. Vasc. Endovasc. Surg. 2004;28:168–176. doi: 10.1016/j.ejvs.2004.03.029. [DOI] [PubMed] [Google Scholar]
- 9.Leung, J.H., Wright, A.R., Cheshire, N., Crane, J., Thom, S.A., Hughes, A.D., Xu, Y.: Fluid structure interaction of patient-specific abdominal aortic aneurysms: a comparison with solid stress models. Biomed. Eng. Online 5, 33 (2006) [DOI] [PMC free article] [PubMed]
- 10.Vande Geest JP, Di Martino ES, Bohra A, Makaroun MS, Vorp DA. A biomechanics-based rupture potential index for abdominal aortic aneurysm risk assessment: demonstrative application. Ann. N. Y. Acad. Sci. 2006;1085:11–21. doi: 10.1196/annals.1383.046. [DOI] [PubMed] [Google Scholar]
- 11.Di Martino, E.S., Bohra, A., Vande Geest, J.P., Gupta, N., Makaroun, M.S., Vorp, D.A.: Biomechanical properties of ruptured versus electively repaired abdominal aortic aneurysm wall tissue. J. Vasc. Surg. 43, 570–576 (2006). [DOI] [PubMed]
- 12.Raghavan ML, Kratzberg J, Castro de Tolosa EM, Hanaoka MM, Walker P, da Silva ES. Regional distribution of wall thickness and failure properties of human abdominal aortic aneurysm. J. Biomech. 2006;39:3010–3016. doi: 10.1016/j.jbiomech.2005.10.021. [DOI] [PubMed] [Google Scholar]
- 13.Scotti CM, Finol EA. Compliant biomechanics of abdominal aortic aneurysms: a fluid–structure interaction study. Comput. Struct. 2007;85:1097–1113. doi: 10.1016/j.compstruc.2006.08.041. [DOI] [Google Scholar]
- 14.Li, Z., Kleinstreuer, C.: A comparison between different asymmetric abdominal aortic aneurysm morphologies employing computational fluid–structure interaction analysis. Eur. J. Mech. B/Fluids 26, 615–631 (2007)
- 15.Li Z-Y, U-King-Im J, Tang TY, Soh E, See TC, Gillard JH. Impact of calcification and intraluminal thrombus on the computed wall stresses of abdominal aortic aneurysm. J. Vasc. Surg. 2008;47:928–935. doi: 10.1016/j.jvs.2008.01.006. [DOI] [PubMed] [Google Scholar]
- 16.Bluestein D, Dumont K, De Beule M, Ricotta J, Impellizzeri P, Verhegghe B, Verdonck P. Intraluminal thrombus and risk of rupture in patient-specific abdominal aortic aneurysm – FSI modelling. Comput. Methods Biomech. Biomed. Eng. 2009;12:73–81. doi: 10.1080/10255840802176396. [DOI] [PubMed] [Google Scholar]
- 17.Rissland P, Alemu Y, Einav S, Ricotta J, Bluestein D. Abdominal aortic aneurysm risk of rupture: patient-specific FSI simulations using anisotropic model. J. Biomech. Eng. 2009;131:031001. doi: 10.1115/1.3005200. [DOI] [PubMed] [Google Scholar]
- 18.Doyle BJ, Callanan A, Burke PE, Grace PA, Walsh MT, Vorp DA, McGloughlin TM. Vessel asymmetry as an additional diagnostic tool in the assessment of abdominal aortic aneurysms. J. Vasc. Surg. 2009;49:443–454. doi: 10.1016/j.jvs.2008.08.064. [DOI] [PMC free article] [PubMed] [Google Scholar]
- 19.Doyle BJ, Callanan A, Walsh MT, Grace PA, McGloughlin TM. A Finite Element Analysis Rupture Index (FEARI) as an additional tool for abdominal aortic aneurysm rupture prediction. Vasc. Dis. Prev. 2009;6:114–121. doi: 10.2174/1567270001006010114. [DOI] [Google Scholar]
- 20.Xenos M, Rambhia SH, Alemu Y, Einav S, Labropoulos N, Tassiopoulos A, Ricotta JJ, Bluestein D. Patient-based abdominal aortic aneurysm rupture risk prediction with fluid structure interaction modeling. Ann. Biomed. Eng. 2010;38:3323–3337. doi: 10.1007/s10439-010-0094-3. [DOI] [PubMed] [Google Scholar]
- 21.Georgakarakos E, Ioannou CV, Kamarianakis Y, Papaharilaou Y, Kostas T, Manousaki E, Katsamouris AN. The role of geometric parameters in the prediction of abdominal aortic aneurysm wall stress. Eur. J. Vasc. Endovasc. Surg. 2010;39:42–48. doi: 10.1016/j.ejvs.2009.09.026. [DOI] [PubMed] [Google Scholar]
- 22.Maier A, Gee MW, Reeps C, Eckstein H-H, Wall WA. Impact of calcifications on patient-specific wall stress analysis of abdominal aortic aneurysms. Biomech. Model. Mechanobiol. 2010;9:511–521. doi: 10.1007/s10237-010-0191-0. [DOI] [PubMed] [Google Scholar]
- 23.Raghavan ML, Hanaoka MM, Kratzberg JA, de Lourdes Higuchi M, da Silva ES. Biomechanical failure properties and microstructural content of ruptured and unruptured abdominal aortic aneurysms. J. Biomech. 2011;44:2501–2507. doi: 10.1016/j.jbiomech.2011.06.004. [DOI] [PubMed] [Google Scholar]
- 24.Doyle, B.J., Callanan, A., Grace, P.A., Kavanagh, E.G.: On the influence of patient-specific material properties in computational simulations: a case study of a large ruptured abdominal aortic aneurysm. Int. J. Numer. Method. Biomed. Eng. 29(2), 150–164 (2013) [DOI] [PubMed]
- 25.Wang X, Li X. A fluid–structure interaction-based numerical investigation on the evolution of stress, strength and rupture potential of an abdominal aortic aneurysm. Comput. Methods Biomech. Biomed. Engin. 2013;16:1032–1039. doi: 10.1080/10255842.2011.652097. [DOI] [PubMed] [Google Scholar]
- 26.Chandra S, Raut SS, Jana A, Biederman RW, Doyle M, Muluk SC, Finol EA. Fluid–structure interaction modeling of abdominal aortic aneurysms: the impact of patient-specific inflow conditions and fluid/solid coupling. J. Biomech. Eng. 2013;135:81001. doi: 10.1115/1.4024275. [DOI] [PMC free article] [PubMed] [Google Scholar]
- 27.Valencia A, Morales H, Rivera R, Bravo E, Galvez M. Blood flow dynamics in patient-specific cerebral aneurysm models: the relationship between wall shear stress and aneurysm area index. Med. Eng. Phys. 2008;30:329–340. doi: 10.1016/j.medengphy.2007.04.011. [DOI] [PubMed] [Google Scholar]
- 28.Valencia A, Muñoz F, Araya S, Rivera R, Bravo E. Comparison between computational fluid dynamics, fluid–structure interaction and computational structural dynamics predictions of flow-induced wall mechanics in an anatomically realistic cerebral aneurysm model. Int. J. Comput. Fluid Dyn. 2009;23:649–666. doi: 10.1080/10618560903476386. [DOI] [Google Scholar]
- 29.Torii R, Oshima M, Kobayashi T, Takagi K, Tezduyar TE. Fluid–structure interaction modeling of a patient-specific cerebral aneurysm: influence of structural modeling. Comput. Mech. 2008;43:151–159. doi: 10.1007/s00466-008-0325-8. [DOI] [Google Scholar]
- 30.Torii R, Oshima M, Kobayashi T, Takagi K, Tezduyar TE. Fluid–structure interaction modeling of blood flow and cerebral aneurysm: Significance of artery and aneurysm shapes. Comput. Methods Appl. Mech. Eng. 2009;198:3613–3621. doi: 10.1016/j.cma.2008.08.020. [DOI] [Google Scholar]
- 31.Costalat V, Sanchez M, Ambard D, Thines L, Lonjon N, Nicoud F, Brunel H, Lejeune JP, Dufour H, Bouillot P, Lhaldky JP, Kouri K, Segnarbieux F, Maurage CA, Lobotesis K, Villa-Uriol MC, Zhang C, Frangi AF, Mercier G, Bonafé A, Sarry L, Jourdan F. Biomechanical wall properties of human intracranial aneurysms resected following surgical clipping (IRRAs Project) J. Biomech. 2011;44:2685–2691. doi: 10.1016/j.jbiomech.2011.07.026. [DOI] [PubMed] [Google Scholar]
- 32.Sanchez M, Ambard D, Costalat V, Mendez S, Jourdan F, Nicoud F. Biomechanical assessment of the individual risk of rupture of cerebral aneurysms: a proof of concept. Ann. Biomed. Eng. 2013;41:28–40. doi: 10.1007/s10439-012-0632-2. [DOI] [PubMed] [Google Scholar]
- 33.Mower WR, Quiñones WJ, Gambhir SS. Effect of intraluminal thrombus on abdominal aortic aneurysm wall stress. J. Vasc. Surg. 1997;26:602–608. doi: 10.1016/S0741-5214(97)70058-2. [DOI] [PubMed] [Google Scholar]
- 34.Vorp DA, Raghavan ML, Webster MW. Mechanical wall stress in abdominal aortic aneurysm: influence of diameter and asymmetry. J. Vasc. Surg. 1998;27:632–639. doi: 10.1016/S0741-5214(98)70227-7. [DOI] [PubMed] [Google Scholar]
- 35.Li Z, Kleinstreuer C. Blood flow and structure interactions in a stented abdominal aortic aneurysm model. Med. Eng. Phys. 2005;27:369–382. doi: 10.1016/j.medengphy.2004.12.003. [DOI] [PubMed] [Google Scholar]
- 36.Scotti, C.M., Shkolnik, A.D., Muluk, S.C., Finol, E.A.: Fluid–structure interaction in abdominal aortic aneurysms: effects of asymmetry and wall thickness. Biomed. Eng. Online 4, 64 (2005) [DOI] [PMC free article] [PubMed]
- 37.Scotti CM, Jimenez J, Muluk SC, Finol EA. Wall stress and flow dynamics in abdominal aortic aneurysms: finite element analysis vs. fluid–structure interaction. Comput. Methods Biomech. Biomed. Eng. 2008;11:301–322. doi: 10.1080/10255840701827412. [DOI] [PubMed] [Google Scholar]
- 38.Khanafer, K.M., Bull, J.L., Berguer, R.: Fluid–structure interaction of turbulent pulsatile flow within a flexible wall axisymmetric aortic aneurysm model. Eur. J. Mech. B/Fluids 28, 88–102 (2009)
- 39.Xenos M, Alemu Y, Zamfir D, Einav S, Ricotta JJ, Labropoulos N, Tassiopoulos A, Bluestein D. The effect of angulation in abdominal aortic aneurysms: fluid–structure interaction simulations of idealized geometries. Med. Biol. Eng. Comput. 2010;48:1175–1190. doi: 10.1007/s11517-010-0714-y. [DOI] [PubMed] [Google Scholar]
- 40.Gao F, Ueda H, Gang L, Okada H. Fluid structure interaction simulation in three-layered aortic aneurysm model under pulsatile flow: comparison of wrapping and stenting. J. Biomech. 2013;46:1335–1342. doi: 10.1016/j.jbiomech.2013.02.002. [DOI] [PubMed] [Google Scholar]
- 41.Wang X, Li X. Computational simulation of aortic aneurysm using FSI method: influence of blood viscosity on aneurismal dynamic behaviors. Comput. Biol. Med. 2011;41:812–821. doi: 10.1016/j.compbiomed.2011.06.017. [DOI] [PubMed] [Google Scholar]
- 42.Wang X, Li X. Fluid–structure interaction based study on the physiological factors affecting the behaviors of stented and non-stented thoracic aortic aneurysms. J. Biomech. 2011;44:2177–2184. doi: 10.1016/j.jbiomech.2011.06.020. [DOI] [PubMed] [Google Scholar]
- 43.Gao F, Tang D, Guo Z, Sakamoto M, Matsuzawa T. Stress analysis in layered aortic arch model: influence of arch aneurysm and wall stiffness. ICCES. 2007;1:21–27. [Google Scholar]
- 44.Vorp DA, Raghavan ML, Muluk SC, Makaraun MS, Steed DL, Shapiro R, Webster MW. Wall strength and stiffness of aneurysmal and nonaneurysmal abdominal aorta. Ann. N. Y. Acad. Sci. 1996;800:274–276. doi: 10.1111/j.1749-6632.1996.tb33330.x. [DOI] [PubMed] [Google Scholar]
- 45.Vena P, Gastaldi D, Socci L, Pennati G. An anisotropic model for tissue growth and remodeling during early development of cerebral aneurysms. Comput. Mater. Sci. 2008;43:565–577. doi: 10.1016/j.commatsci.2007.12.023. [DOI] [Google Scholar]
- 46.Eriksson T, Kroon M, Holzapfel GA. Influence of medial collagen organization and axial in situ stretch on saccular cerebral aneurysm growth. J. Biomech. Eng. 2009;131:101010. doi: 10.1115/1.3200911. [DOI] [PubMed] [Google Scholar]
- 47.Watton PN, Selimovic A, Raberger NB, Huang P, Holzapfel GA, Ventikos Y. Modelling evolution and the evolving mechanical environment of saccular cerebral aneurysms. Biomech. Model. Mechanobiol. 2011;10:109–132. doi: 10.1007/s10237-010-0221-y. [DOI] [PubMed] [Google Scholar]
- 48.Schmid, H., Grytsan, A., Poshtan, E., Watton, P.N., Itskov, M.: Influence of differing material properties in media and adventitia on arterial adaptation – application to aneurysm formation and rupture. Comput. Methods Biomech. Biomed. Eng. 16, 33–53 (2013) [DOI] [PubMed]
- 49.Chatziprodromou I, Tricoli A, Poulikakos D, Ventikos Y. Haemodynamics and wall remodelling of a growing cerebral aneurysm: a computational model. J. Biomech. 2007;40:412–426. doi: 10.1016/j.jbiomech.2005.12.009. [DOI] [PubMed] [Google Scholar]
- 50.Feng Y, Wada S, Tsubota K-I, Yamaguchi T. The application of computer simulation in the genesis and development of intracranial aneurysms. Technol. Health Care. 2005;13:281–291. [PubMed] [Google Scholar]
- 51.Feng Y, Wada S, Ishikawa T, Tsubota K, Yamaguchi T. A rule-based computational study on the early progression of intracranial aneurysms using fluid–structure interaction: comparison between straight model and curved model. J. Biomech. Sci. Eng. 2008;3:124–137. doi: 10.1299/jbse.3.124. [DOI] [Google Scholar]
- 52.Nabaei M, Fatouraee N. Computational modeling of formation of a cerebral aneurysm under the influence of smooth muscle cell relaxation. J. Mech. Med. Biol. 2012;12:1250006. doi: 10.1142/S0219519411004599. [DOI] [Google Scholar]
- 53.Foutrakis GN, Yonas H, Sclabassi RJ. Saccular aneurysm formation in curved and bifurcating arteries. AJNR Am. J. Neuroradiol. 1999;20:1309–1317. [PMC free article] [PubMed] [Google Scholar]
- 54.Lasheras JC. The biomechanics of arterial aneurysms. Annu. Rev. Fluid Mech. 2007;39:293–319. doi: 10.1146/annurev.fluid.39.050905.110128. [DOI] [Google Scholar]
- 55.Gao, F., Watanabe, M., Matsuzawa, T.: Fluid–structure interaction within 3-layered aortic arch model under pulsatile blood flow. PDCAT’05. 989–992 (2005).
- 56.Gao, F., Matsuzawa, T.: FSI within aortic arch model over cardiac cycle and influence of wall stiffness on wall stress in layered wall. Eng. Lett. 15, (2006).
- 57.Gao F, Guo Z, Sakamoto M, Matsuzawa T. Fluid–structure interaction within a layered aortic arch model. J. Biol. Phys. 2006;32:435–454. doi: 10.1007/s10867-006-9027-7. [DOI] [PMC free article] [PubMed] [Google Scholar]
- 58.Gao F, Guo Z, Watanabe M, Matsuzawa T. Loosely coupled simulation for aortic arch model under steady and pulsatile flow. J. Biomech. Sci. Eng. 2006;1:327–341. doi: 10.1299/jbse.1.327. [DOI] [Google Scholar]
- 59.Khanafer K, Berguer R. Fluid–structure interaction analysis of turbulent pulsatile flow within a layered aortic wall as related to aortic dissection. J. Biomech. 2009;42:2642–2648. doi: 10.1016/j.jbiomech.2009.08.010. [DOI] [PubMed] [Google Scholar]
- 60.Humphrey JD, Holzapfel GA. Mechanics, mechanobiology, and modeling of human abdominal aorta and aneurysms. J. Biomech. 2012;45:805–814. doi: 10.1016/j.jbiomech.2011.11.021. [DOI] [PMC free article] [PubMed] [Google Scholar]
- 61.Takizawa K, Bazilevs Y, Tezduyar TE. Space–time and ALE-VMS techniques for patient-specific cardiovascular fluid–structure interaction modeling. Arch. Comput. Methods Eng. 2012;19:171–225. doi: 10.1007/s11831-012-9071-3. [DOI] [Google Scholar]
- 62.Bazilevs Y, Hsu M-C, Benson DJ, Sankaran S, Marsden AL. Computational fluid–structure interaction: methods and application to a total cavopulmonary connection. Comput. Mech. 2009;45:77–89. doi: 10.1007/s00466-009-0419-y. [DOI] [Google Scholar]
- 63.Takizawa K, Brummer T, Tezduyar TE, Chen PR. A comparative study based on patient-specific fluid–structure interaction modeling of cerebral aneurysms. J. Appl. Mech. 2012;79:010908. doi: 10.1115/1.4005071. [DOI] [Google Scholar]
- 64.Raghavan ML, Vorp DA. Toward a biomechanical tool to evaluate rupture potential of abdominal aortic aneurysm: identification of a finite strain constitutive model and evaluation of its applicability. J. Biomech. 2000;33:475–482. doi: 10.1016/S0021-9290(99)00201-8. [DOI] [PubMed] [Google Scholar]
- 65.Tezduyar TE, Sathe S, Schwaab M, Conklin BS. Arterial fluid mechanics modeling with the stabilized space–time fluid–structure interaction technique. Int. J. Numer. Methods Fluids. 2008;57:601–629. doi: 10.1002/fld.1633. [DOI] [Google Scholar]
- 66.Mills CJ, Gabe IT, Gault JH, Mason DT, Ross J, Braunwald E, Shillingford JP. Pressure-flow relationships and vascular impedance in man. Cardiovasc. Res. 1970;4:405–417. doi: 10.1093/cvr/4.4.405. [DOI] [PubMed] [Google Scholar]
- 67.Takizawa K, Christopher J, Tezduyar TE, Sathe S. Space–time finite element computation of arterial fluid–structure interactions with patient‐specific data. Int. J. Numer. Method. Biomed. Eng. 2010;26:101–116. doi: 10.1002/cnm.1241. [DOI] [Google Scholar]
- 68.Tezduyar TE, Sathe S, Keedy R, Stein K. Space–time finite element techniques for computation of fluid–structure interactions. Comput. Methods Appl. Mech. Eng. 2006;195:2002–2027. doi: 10.1016/j.cma.2004.09.014. [DOI] [Google Scholar]
- 69.Takizawa K, Moorman C, Wright S, Christopher J, Tezduyar TE. Wall shear stress calculations in space–time finite element computation of arterial fluid–structure interactions. Comput. Mech. 2010;46:31–41. doi: 10.1007/s00466-009-0425-0. [DOI] [Google Scholar]
- 70.Wilson, J.S., Baek, S., Humphrey, J.D.: Parametric study of effects of collagen turnover on the natural history of abdominal aortic aneurysms Parametric study of effects of collagen turnover on the natural history of abdominal aortic aneurysms. Proc. R. Soc. A 469, 1–19 (2013) [DOI] [PMC free article] [PubMed]
- 71.Carallo C, Irace C, De Franceschi MS, Coppoletta F, Tiriolo R, Scicchitano C, Scavelli F, Gnasso A. The effect of aging on blood and plasma viscosity. An 11.6 years follow-up study. Clin. Hemorheol. Microcirc. 2011;47:67–74. doi: 10.3233/CH-2010-1367. [DOI] [PubMed] [Google Scholar]
- 72.Reeps C, Maier A, Pelisek J, Härtl F, Grabher-Meier V, Wall WA, Essler M, Eckstein H-H, Gee MW. Measuring and modeling patient-specific distributions of material properties in abdominal aortic aneurysm wall. Biomech. Model. Mechanobiol. 2013;12:717–733. doi: 10.1007/s10237-012-0436-1. [DOI] [PubMed] [Google Scholar]
- 73.Kroon M, Holzapfel GA. A model for saccular cerebral aneurysm growth by collagen fibre remodelling. J. Theor. Biol. 2007;247:775–787. doi: 10.1016/j.jtbi.2007.03.009. [DOI] [PubMed] [Google Scholar]
- 74.Takizawa K, Takagi H, Tezduyar TE, Torii R. Estimation of element-based zero-stress state for arterial FSI computations. Comput. Mech. 2014;54:895–910. doi: 10.1007/s00466-013-0919-7. [DOI] [Google Scholar]


