Abstract
Purpose
To compare signal penetration depth and deep structure-visualization of swept source (SS) and spectral domain (SD)-optical coherence tomography (OCT) with and without enhanced depth imaging (EDI) and B-scan averaging modes.
Methods
Volume scans were obtained from 20 eyes of healthy volunteers by DRI OCT-1, Spectralis using EDI and B-scan averaging, and Cirrus HD-OCT. The signal penetration depth was measured as the distance between the retinal pigment epithelium and the deepest visible anatomical structure at the foveal center. Visibility and contrast of the choroidoscleral junction and of vascular details within the choroid were assessed across the entire volume using an ordinal scoring scale. Outcome measures were compared using paired t-test and rank-sum test.
Results
The mean signal penetration depth was 498±114 μm for Spectralis, 491±85 μm for DRI OCT-1, and 123±65 μm for Cirrus; P=0.9708 Spectralis vs DRI OCT-1, P<0.0001 Spectralis vs Cirrus, and P<0.0001 DRI OCT-1 vs Cirrus. Mean ranks for visibility and contrast of the choroidoscleral junction were 3.83 for Spectralis, 3.98 for DRI OCT-1, and 2.00 for Cirrus; and 3.45 for Spectralis, 2.93 for DRI OCT-1, and 1.58 for Cirrus. Mean ranks for visibility and contrast of vascular details were 3.73 (Spectralis), 3.70 (DRI OCT-1), and 2.23 (Cirrus); and 3.53 (Spectralis), 2.05 (DRI OCT-1), and 1.98 (Cirrus).
Conclusion
Signal penetration depths are similar for SS-OCT and SD-OCT using EDI and frame averaging, and statistically significantly lower without EDI/averaging. Both SD-OCT using EDI/frame averaging and SS-OCT offer excellent visualization capabilities for volumetric imaging of the choroidoscleral interface.
Introduction
Optical coherence tomography (OCT) is one of the leading diagnostic tools in modern ophthalmology.1, 2 Among many other clinical applications, OCT can be used to image deep structures at the posterior pole such as the choroid, lamina cribrosa and sclera.3, 4, 5, 6 The introduction of specific techniques allowing such deep-range imaging has led to a surge of clinical and research studies investigating these anatomical compartments in vivo. In particular, the choroidal layer and its role in vascular and inflammatory disease have gained tremendous scientific interest.
In terms of OCT technology, two major approaches enabling imaging of deep ocular structures have been established: (1) Spectral domain (SD)-OCT with conventional light sources using ‘enhanced depth imaging' (EDI); (2) swept source (SS)-OCT using a long-wavelength light source. Specifically, state-of-the-art SD-OCT systems use superluminescent diodes with a central wavelength of 800–870 nm for illumination, which is optimal for imaging of the retina, but does not offer large penetration depths. Moreover, in SD-OCT technology, the signal strength decays rapidly (‘sensitivity roll-off') with increasing spatial distance to the zero-delay line, which is the axial position of maximum sensitivity for signal detection (conventionally placed near the vitreoretinal interface). Counteracting this phenomenon, EDI achieves adequate signal strength from the choroid by placing this region of interest closest to the zero-delay line.7 On the other hand, SS-OCT systems show much less sensitivity roll-off versus depth and therefore offer larger imaging ranges. Together with the use of a longer wavelength light source (eg, at 1050 nm) with increased penetration properties, SS technology results in natively better signals from deep regions, without sacrificing signal strength in other regions of the image.3, 6 Comparisons of these two key technologies with regard to measurement of choroidal thickness have been reported previously.8, 9, 10, 11, 12 However, a quantitative comparison of signal penetration depth has not been performed so far to the best of our knowledge.
The human choroid exhibits strong topographic thickness variations at the posterior pole, being, for example, thickest subfoveally and thinnest near the optic nerve head.13 When investigating the choroid, it is, therefore, of key importance to use volume scanning to account for this immanent topographic variability. Previous evaluations of SD- and SS-OCT instruments' imaging capabilities of the choroid used singular sections and/or only subfoveal locations. A comprehensive evaluation of the capability of these devices to resolve the choroidoscleral junction over the entire macular area has not been published to date.
In this paper, we present a quantitative comparison of signal penetration depth of a standard SD-OCT instrument using the EDI technique and real-time frame averaging (Heidelberg Spectralis), a commercially available SS-OCT instrument using a long-wavelength light source (Topcon DRI-1), and an SD-OCT instrument without EDI/averaging as a reference (Cirrus HD-OCT). Volume scanning was used throughout and evaluated for complete visualization of the choroidoscleral junction and resolved level of detail within the choroidal vasculature.
Methods
This prospective, noninterventional case series was conducted in compliance with the tenets set forth in the Declaration of Helsinki. Ethics approval was obtained prospectively from the Ethics Committee at the Medical University of Vienna. All participants provided written informed consent before participation in the study.
Participants and imaging protocol
Healthy volunteers with a minimum age of 18 years without any ocular pathology and refractive error below ±2 diopters were prospectively recruited at the Department of Ophthalmology, Medical University of Vienna, Austria. Without pupil dilatation, they were imaged with the following OCT instruments in random order by a single, experienced operator (HF): (1) Spectralis OCT (Heidelberg Engineering, Dossenheim, Germany, software version 1.5.2.0, 840 nm central wavelength, scanning pattern 512 × 97 A-scans covering 20 × 20° using EDI mode and automated real-time averaging activated at 50 frames), (2) DRI OCT-1 Atlantis (Topcon Medical Systems Inc., Oakland, NJ, USA, software version 9.10, 1050 nm central wavelength, scanning pattern 256 × 256 A-scans covering 6 × 6 mm using single frames), and (3) Cirrus HD-OCT (Carl Zeiss Meditec, Dublin, CA, USA, software version 5.0.0.326, 820 nm central wavelength, scanning pattern 512 × 128 A-scans covering 6 × 6 mm using single frames). All OCT examinations of each volunteer were completed within 1 h on the same day.
Image evaluation
All examination findings were exported as raw data and evaluated in validated custom software at the Vienna Reading Center by two independent, masked readers (MS and DP) holding a grader certification. The readers were masked to the volunteer and the other grader, but could not be masked to the machine because each instrument has unique image characteristics. To evaluate the penetration depth of the OCT signal, the center of the foveal pit was first identified. At this location, the vertical distance between the outer border of the retinal pigment epithelium (RPE) and the outer border of the deepest visible structure in the image was measured using a caliper tool (Figure 1). This tool is calibrated according to the OCT manufacturer's specification of the pixel-to-micrometer conversion factor used in each OCT device.
Figure 1.

Determination of signal penetration depth. At the center of the fovea, the vertical distance between the outer border of the retinal pigment epithelium and the outermost visible structure in the same vertical column was measured using a caliper tool in custom software.
To evaluate the visibility of the choroidoscleral junction, each OCT volume was individually assessed and the percentage of visible choroidoscleral junction graded using an ordinal scoring system as follows: 1, below 10% of the choroidoscleral junction visible; 2, between 11 and 50% of the choroidoscleral junction visible; 3, between 51 and 90% of the choroidoscleral junction visible; and 4, over 90% of the choroidoscleral junction visible. In addition, the overall contrast of the choroidoscleral junction was graded as follows: 1, not visible; 2, poor contrast; 3, medium contrast; and 4, high contrast. To evaluate the capability of the OCT instrument to resolve fine details at the choroidal level such as small and large vessels, the identical scoring systems were applied to grade the percentage of visible details within the scanned choroidal subvolume and the level of contrast.
Statistical evaluation
GraphPad Prism version 6.03 for Windows (GraphPad Software, La Jolla, CA, USA) was used for statistical analysis. Continuous variables (averaged between the two observers) were visualized as box plots, where the whiskers represent the minimum and maximum values, and compared using one-way analysis of variance and Tukey's correction for multiple comparisons. The interobserver reproducibility for continuous variables was assessed using linear regression analysis and Bland–Altman plots. Ordinal variables were visualized using scatter plots, and compared using Friedman's rank-sum test and Dunn's correction for multiple comparisons. All ordinal gradings of the two readers were grouped for statistical analysis. Cohen's κ was used to evaluate the overall agreement between the observers for ordinal variables. The formal significance level was set at P<0.05.
Statement of ethics
We certify that all applicable institutional and governmental regulations concerning the ethical use of human volunteers were followed during this research.
Results
Twenty-three eyes of twelve volunteers were included. Mean (± SD) age was 23.8±1.8 years. Of the 23 eyes, three were excluded because of incomplete data due to OCT machine malfunction at one of the recording sessions. Accordingly, 20 eyes of 10 volunteers had complete data enabling pair-wise comparisons. Mean subfoveal choroidal thickness was 340± 62 μm for Spectralis and 325 μm±63 for DRI OCT-1.
Signal penetration depth
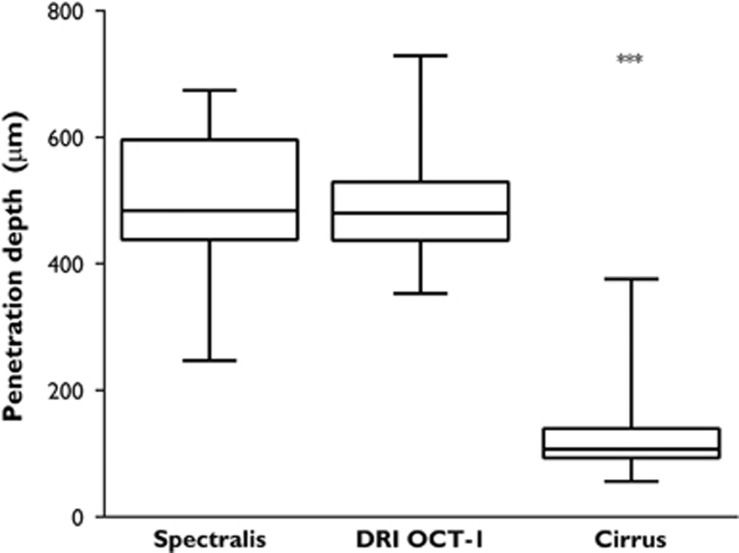
The mean distance between the lower border of the RPE and the outermost visible structure below the center of the foveal pit was 498±114 μm for Spectralis, 491±85 μm for DRI OCT-1, and 123±65 μm for Cirrus; P=0.9708 Spectralis vs DRI OCT-1, P<0.0001 Spectralis vs Cirrus, and P<0.0001 DRI OCT-1 vs Cirrus. Corresponding box plots are shown in Figure 2. There was an excellent reproducibility between the two graders (r2=0.987, P<0.0001). Blant–Altman plots showing reproducibility and 95% limits of agreement for each of the individual OCT machines are provided in Figure 3.
Figure 2.
Comparison of signal penetration depths. Although the mean penetration depths are similar for Spectralis and DRI OCT-1, Cirrus shows significantly lower mean values.
Figure 3.
Bland–Altman plots for interobserver agreement. For all three devices, the 95% limits of agreement (dotted lines) were below 50μm.
Visualization of the choroidoscleral junction
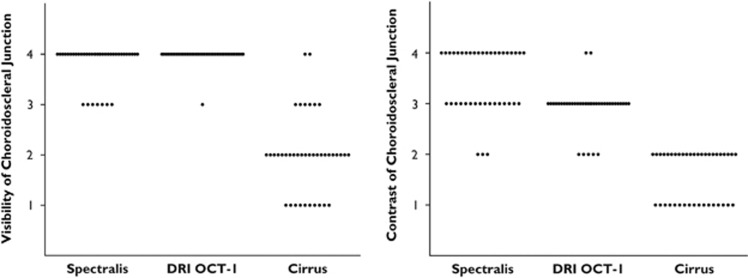
The median scores for choroidoscleral junction visibility were 4 for Spectralis, 4 for DRI OCT-1, and 2 for Cirrus. The mean ranks were 3.83 for Spectralis, 3.98 for DRI OCT-1, and 2.00 for Cirrus, P>0.9999 Spectralis vs DRI OCT-1, P<0.0001 Spectralis vs Cirrus, and P<0.0001 DRI OCT-1 vs Cirrus. The median scores for choroidoscleral junction contrast were 4 for Spectralis, 3 for DRI OCT-1, and 2 for Cirrus. The mean ranks were 3.45 for Spectralis, 2.93 for DRI OCT-1, and 1.58 for Cirrus; P=0.049 Spectralis vs DRI OCT-1, P<0.0001 Spectralis vs Cirrus, and P<0.0001 DRI OCT-1 vs Cirrus. Corresponding scatter plots are shown in Figure 4.
Figure 4.
Scores for visualization of the choroidoscleral junction. Visibility is highest for DRI OCT-1, whereas Spectralis shows the highest contrast scores.
Visualization of vascular details in the choroidal layer
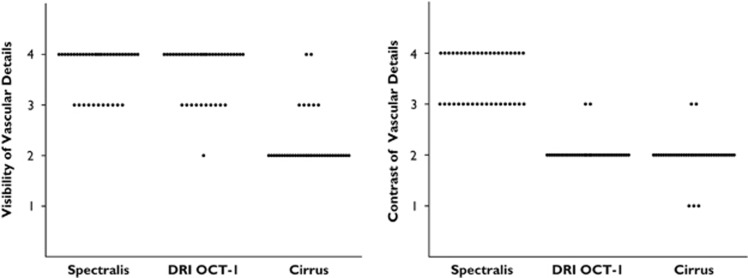
The median scores for vascular detail visibility were 4 for Spectralis, 4 for DRI OCT-1, and 2 for Cirrus. The mean ranks were 3.73 for Spectralis, 3.70 for DRI OCT-1, and 2.23 for Cirrus; P>0.9999 Spectralis vs DRI OCT-1, P<0.0001 Spectralis vs Cirrus, and P<0.0001 DRI OCT-1 vs Cirrus. The median scores for contrast within the choroidal layer were 4 for Spectralis, 2 for DRI OCT-1, and 2 for Cirrus. The mean ranks were 3.53 for Spectralis, 2.05 for DRI OCT-1, and 1.98 for Cirrus; P<0.0001 Spectralis vs DRI OCT-1, P<0.0001 Spectralis vs Cirrus, and P>0.9999 DRI OCT-1 vs Cirrus. Corresponding scatter plots are shown in Figure 5.
Figure 5.
Scores for the visualization of details within the choroidal layer. Visibility is also highest in this measure for DRI OCT-1, whereas Spectralis shows significantly superior contrast scores.
The interrater reliability for all ordinal variables was κ=0.69 (P<0.0001), showing substantial agreement between the observers.14
Discussion
The present study demonstrated that the signal penetration depths of an SD-OCT instrument using the EDI technique and B-scan averaging (Heidelberg Spectralis), and a new SS-OCT device using a longer wavelength light source (Topcon DRI OCT-1) were very similar. Both instruments showed statistically significantly increased penetration depths compared with the reference standard without EDI, Cirrus HD-OCT, when using volume scanning. In our study, the signal penetration depth per se was measured as opposed to the choroidal thickness alone. Thus, it went beyond previously published reports by evaluating the deepest location where anatomical detail could be resolved.
There has been great interest in visualizing and studying the choroid as EDI was popularized by Spaide et al7and introduced into many commercially available SD-OCT systems. Following a long prototype stage, the first commercially available SS-OCT instrument has now been introduced and studies are required to compare these two technologies. Previous reports, however, only compared the choroidal thickness measurements and did not consider the penetration of the OCT signal beyond the choroidoscleral junction, which cannot be inferred from thickness comparisons alone.8, 11, 12 Choroidal thickness is an important factor in determining if the choroidoscleral junction can be identified by OCT, owing to the increasing distance from the external limit of the choroid to the zero-delay line of the OCT instrument in a relatively thicker choroid, or the increased light scattering induced by a thicker choroid.11 Our study counteracts this limitation by introducing signal penetration depth as a new measure that has not been evaluated previously. We believe that the penetration depth of an OCT system is of higher clinical relevance because it allows conclusions to be drawn about situations of, for example, choroidal thickening beyond the normal range.
In relation to the mean choroidal thickness of 340 μm as measured in our study (a value similar to those in previously published reports), our results indicate that adequate penetration depths reaching well into the sclera could routinely be achieved with both Spectralis and DRI OCT-1.13 Unless the choroid is extremely thickened such as in acute central serous chorioretinopathy with average values of about 500 μm reported, both instruments would allow examination of the choroidal layer in its entire extent.15 On the other hand, Cirrus HD-OCT, a regular SD-OCT instrument without an EDI mode in volume scanning, showed a mean penetration depth of 120 μm, which means that it can only measure the thickness of a rather thin choroid. However, in patients with choroidal thinning such as in typical age-related macular degeneration,13, 16 or in pathologic myopia,12 SD-OCT with regular scanning protocols may suffice to image the choroid adequately, particularly if automated algorithms including the choroidal vasculature as landmarks are used.17
As the macular choroid exhibits a significant topographic thickness asymmetry (being thickest under the fovea; thinner nasally than temporally and thinner inferiorly than superiorly), this study also assessed the visibility of the choroidoscleral junction and the anatomic details within the choroidal vasculature taking account of the entire recorded 6 × 6 mm OCT volume.18 When evaluating the visibility and contrast of the choroidoscleral junction, >90% of the choroidoscleral junction was visible in almost all cases using DRI OCT-1 and in three-quarters of the cases using Spectralis. At least 50% of the choroidoscleral junction was visible in all cases for both Spectralis and DRI OCT-1. Less than 50% of the choroidoscleral junction was visible in most cases using the Cirrus instrument. Spectralis achieved superior contrast scores, with excellent contrast in about 50% of cases, whereas DRI OCT-1 showed medium contrast in all instances and Cirrus showed very low contrast scores overall.
The results were similar for visibility and contrast of vascular details within the choroid. Almost identical excellent visibility results were shown for Spectralis and DRI OCT-1. However, with regard to the contrast levels of vascular details, Spectralis gave superior results, whereas Cirrus and DRI OCT-1 showed similar, medium to low contrast levels. SD-OCT is susceptible to an effect known as ‘fringe washout', which is signal loss due to motion, as SD-OCT uses a camera detector that integrates in time. During the integration time, if motion occurs, the OCT signal is degraded or lost. SS-OCT is less susceptible to fringe washout because of its higher speed and instantaneous sampling nature. For choroidal vascular contrast, this effect works in the advantage of SD-OCT, because when there is motion, that is, blood flow in the vasculature, the OCT signal is weaker and shows as dark, thereby enhancing the image contrast.
In contradiction of a previous study by Adhi et al, our results do not indicate a much improved visualization of the choroidoscleral junction by SS-OCT over SD-OCT using the EDI mode. Although the SS-OCT device showed a trend toward superior complete, volumetric visualization of the choroidoscleral junction, SD-OCT using EDI delivered better contrast within the regions of interest. This is likely due to the use of B-scan averaging (n=50) in the Spectralis device, which removes speckle noise and therefore improves visualization of low contrast features.19 However, lengthy acquisition times (in the range of 100-fold compared with SS-OCT in this study) are a major issue and may become a severely limiting factor in any patient population that lacks stable fixation. Even without B-scan averaging, the level of contrast provided by the SS-OCT machine was high enough for the graders to comfortably delineate the choroidoscleral junction. Combining SS-OCT technology with B-scan averaging may provide even higher depth penetration and contrast levels.
This study is limited in its sample size, participant selection and scanning protocol selection. Our small sample and the inclusion of both eyes of single volunteers may have introduced a sampling bias. As only healthy participants were included, extrapolation of our conclusions to patients with chorioretinal disease and/or optical media opacities may be limited. Better penetration through media opacities is a further advantage of the long-wavelength SS-OCT device which could not be evaluated here.18 Furthermore, the comparison of a single-frame scanning pattern with SS-OCT and a frame averaging scanning pattern with the Spectralis instrument may be an unfair comparison. However, frame averaging is not available for volume scans in DRI OCT-1, and the use of B-scan averaging is considered the clinical standard for the Spectralis. Therefore, it seems prudent to compare the instruments in their standard clinical application setting.
In conclusion, this study demonstrated similar signal penetration depths for SS-OCT without EDI or frame averaging(DRI OCT-1) and SD-OCT using EDI and frame averaging (Spectralis), and statistically significantly lower penetration depths in SD-OCT without EDI/frame averaging (Cirrus) in healthy volunteers. Both Spectralis and DRI OCT-1 offered excellent visualization capabilities with regard to volumetric representation of the choroidoscleral interface and vascular details within the choroid, with a slight visualization advantage for DRI OCT-1 and a better contrast for Spectralis. Given these similar outcomes, the improved scanning speed, larger signal range, and better penetration through media opacities of SS-OCT may result in superior overall clinical applicability of these devices in the future.

Acknowledgments
The financial support by the Austrian Federal Ministry of Economy, Family, and Youth and the National Foundation for Research, Technology, and Development is gratefully acknowledged. The funding organizations had no role in the design or conduct of the current research.
The authors declare no conflict of interest.
References
- Huang D, Swanson EA, Lin CP, Schuman JS, Stinson WG, Chang W, et al. Optical coherence tomography. Science. 1991;254:1178–1181. doi: 10.1126/science.1957169. [DOI] [PMC free article] [PubMed] [Google Scholar]
- Swanson EA, Izatt JA, Hee MR, Huang D, Lin CP, Schuman JS, et al. In vivo retinal imaging by optical coherence tomography. Opt Lett. 1993;18:1864–1866. doi: 10.1364/ol.18.001864. [DOI] [PubMed] [Google Scholar]
- Yasuno Y, Hong Y, Makita S, Yamanari M, Akiba M, Miura M, et al. In vivo high-contrast imaging of deep posterior eye by 1-um swept source optical coherence tomography andscattering optical coherence angiography. Opt Express. 2007;15:6121–6139. doi: 10.1364/oe.15.006121. [DOI] [PubMed] [Google Scholar]
- Ohno-Matsui K, Akiba M, Moriyama M, Ishibashi T, Tokoro T, Spaide RF. Imaging retrobulbar subarachnoid space around optic nerve by swept-source optical coherence tomography in eyes with pathologic myopia. Invest Ophthalmol Vis Sci. 2011;52:9644–9650. doi: 10.1167/iovs.11-8597. [DOI] [PubMed] [Google Scholar]
- Ohno-Matsui K, Akiba M, Ishibashi T, Moriyama M. Observations of vascular structures within and posterior to sclera in eyes with pathologic myopia by swept-source optical coherence tomography. Invest Ophthalmol Vis Sci. 2012;53:7290–7298. doi: 10.1167/iovs.12-10371. [DOI] [PubMed] [Google Scholar]
- Mrejen S, Spaide RF. Optical coherence tomography: imaging of the choroid and beyond. Surv Ophthalmol. 2013;58:387–429. doi: 10.1016/j.survophthal.2012.12.001. [DOI] [PubMed] [Google Scholar]
- Spaide RF, Koizumi H, Pozonni MC. Enhanced depth imaging spectral-domain optical coherence tomography. Am J Ophthalmol. 2008;146:496–500. doi: 10.1016/j.ajo.2008.05.032. [DOI] [PubMed] [Google Scholar]
- Matsuo Y, Sakamoto T, Yamashita T, Tomita M, Shirasawa M, Terasaki H. Comparisons of choroidal thickness of normal eyes obtained by two different spectral-domain OCT instruments and one swept-source OCT instrument. Invest Ophthalmol Vis Sci. 2013;54:7630–7636. doi: 10.1167/iovs.13-13135. [DOI] [PubMed] [Google Scholar]
- Lopilly Park H-Y, Shin H-Y, Park CK. Imaging the posterior segment of the eye using swept-source optical coherence tomography in myopic glaucoma eyes: comparison with enhanced-depth imaging. Am J Ophthalmol. 2013;157 (3:550–557. doi: 10.1016/j.ajo.2013.11.008. [DOI] [PubMed] [Google Scholar]
- Adhi M, Liu JJ, Qavi AH, Grulkowski I, Lu CD, Mohler KJ, et al. Choroidal analysis in healthy eyes using swept-source optical coherence tomography compared to spectral domain optical coherence tomography Am J Ophthalmol 20141571272–1281.e1. [DOI] [PubMed] [Google Scholar]
- Copete S, Flores-Moreno I, Montero JA, Duker JS, Ruiz-Moreno JM. Direct comparison of spectral-domain and swept-source OCT in the measurement of choroidal thickness in normal eyes. Br J Ophthalmol. 2014;98:334–338. doi: 10.1136/bjophthalmol-2013-303904. [DOI] [PubMed] [Google Scholar]
- Lim LS, Cheung G, Lee SY. Comparison of spectral domain and swept-source optical coherence tomography in pathological myopia. Eye (Lond) 2014;28:488–491. doi: 10.1038/eye.2013.308. [DOI] [PMC free article] [PubMed] [Google Scholar]
- Margolis R, Spaide RF. A pilot study of enhanced depth imaging optical coherence tomography of the choroid in normal eyes. Am J Ophthalmol. 2009;147:811–815. doi: 10.1016/j.ajo.2008.12.008. [DOI] [PubMed] [Google Scholar]
- Landis JR, Koch GG. The measurement of observer agreement for categorical data. Biometrics. 1977;33:159–174. [PubMed] [Google Scholar]
- Imamura Y, Fujiwara T, Margolis R, Spaide RF. Enhanced depth imaging optical coherence tomography of the choroid in central serous chorioretinopathy. Retina. 2009;29:1469–1473. doi: 10.1097/IAE.0b013e3181be0a83. [DOI] [PubMed] [Google Scholar]
- Wei WB, Xu L, Jonas JB, Shao L, Du KF, Wang S, et al. Subfoveal choroidal thickness: the Beijing Eye Study. Ophthalmology. 2013;120:175–180. doi: 10.1016/j.ophtha.2012.07.048. [DOI] [PubMed] [Google Scholar]
- Zhang L, Lee K, Niemeijer M, Mullins RF, Sonka M, Abràmoff MD. Automated segmentation of the choroid from clinical SD-OCT. Invest Ophthalmol Vis Sci. 2012;53:7510–7519. doi: 10.1167/iovs.12-10311. [DOI] [PMC free article] [PubMed] [Google Scholar]
- Esmaeelpour M, Považay B, Hermann B, Hofer B, Kajic V, Kapoor K, et al. Three-dimensional 1060-nm OCT: choroidal thickness maps in normal subjects and improved posterior segment visualization in cataract patients. Invest Ophthalmol Vis Sci. 2010;51:5260–5266. doi: 10.1167/iovs.10-5196. [DOI] [PubMed] [Google Scholar]
- Sakamoto A, Hangai M, Yoshimura N.Spectral-domain optical coherence tomography with multiple B-scan averaging for enhanced imaging of retinal diseases Ophthalmology 20081151071–1078.e7. [DOI] [PubMed] [Google Scholar]


