

Abstract
We used surface-based morphometry to test for differences in cortical shape between children with simplex autism (n = 34, mean age 11.4 years) and typical children (n = 32, mean age 11.3 years). This entailed testing for group differences in sulcal depth and in 3D coordinates after registering cortical midthickness surfaces to an atlas target using 2 independent registration methods. We identified bilateral differences in sulcal depth in restricted portions of the anterior-insula and frontal-operculum (aI/fO) and in the temporoparietal junction (TPJ). The aI/fO depth differences are associated with and likely to be caused by a shape difference in the inferior frontal gyrus in children with simplex autism. Comparisons of average midthickness surfaces of children with simplex autism and those of typical children suggest that the significant sulcal depth differences represent local peaks in a larger pattern of regional differences that are below statistical significance when using coordinate-based analysis methods. Cortical regions that are statistically significant before correction for multiple measures are peaks of more extended, albeit subtle regional differences that may guide hypothesis generation for studies using other imaging modalities.
Keywords: ASD, morphometry, movies, simplex autism, sulcal depth, surface-based
Introduction
Autism spectrum disorders (ASDs) are a set of prevalent disorders characterized by abnormalities in social development, communication, and restricted interests and repetitive behaviors (McPartland and Volkmar 2012; American Psychiatric Association 2013). Studies of structural brain abnormalities in individuals with ASD may reveal important information about the etiologies of autism, which are currently poorly understood. Many studies have tested for such abnormalities using structural magnetic resonance imaging (MRI) coupled with various volume-based or surface-based analysis methods (Williams and Minshew 2007; Amaral et al. 2008; Verhoeven et al. 2010; Chen et al. 2011; Stigler et al. 2011). Structural abnormalities have been reported in many brain regions, including the temporal, parietal, and frontal lobes, and in the cerebellum.
Studies using voxel-based morphometry (VBM) or cortical thickness measurements have reported several common abnormalities associated with ASD, but also some discordant findings (reviewed in Chen et al. 2011). Commonly reported findings include increased gray matter volume (GMV) in the frontal and temporal lobes, whereas white matter volume (WMV) is decreased in the temporal lobe; total brain volume is higher in young children; corpus callosum volume is lower in adolescents and adults; parietal gray matter is thicker. Studies using surface-based morphometry to characterize cortical shape abnormalities in ASD have identified a different set of commonalities and discordant results. Levitt et al. (2003) reported shifts (positional displacements) in many cortical sulci. Nordahl et al. (2007) reported depth differences in children with low functioning autism (left inferior frontal gyrus, IFG), high-functioning autism (bilateral supramarginal gyrus), and Asperger's (intraparietal sulcus). Shokouhi et al. (2012) found the left insula and right IPS were longer and had greater surface area in children with autism.
The diversity in reported structural abnormalities in ASD may reflect multiple factors, including phenotypic diversity, sample sizes, age dependence, and methodological differences. Phenotypic diversity arises because the level of cognitive, emotional, and social functioning is highly variable across the ASD population (Hughes 2008, 2009), which presumably reflects a diversity of brain circuit abnormalities and associated structural abnormalities. A failure to replicate structural findings in ASD may reflect different studies recruiting patients representing different parts of the autism spectrum (Amaral et al. 2008). This possibility is enhanced because many sample sizes have often been modest (e.g., 12 or fewer) in many morphometric studies of ASD. Age is a key variable, and some abnormalities are more pronounced in younger children than in adolescents or adults (Nordahl et al. 2007; Shokouhi et al. 2012). Methodological considerations are important because each measure (VBM, cortical thickness, and cortical shape) reflects different aspects of brain structure, and each has different regional sensitivities and is susceptible to different biases. Moreover, results may depend on technical considerations such as the exact method used for intersubject registration (Pantazis et al. 2010).
Another distinction that has recently received attention is between multiplex autism (2 or more affected individuals per family) and simplex autism (only a single affected individual per family) (Virkud et al. 2009; Gerdts and Bernier 2011). The dissociation is imperfect, insofar as it can be biased by family size and other sampling considerations. Nonetheless, simplex autism is associated with relatively rare gene mutations each of large effect (Sebat et al. 2007; Weiss et al. 2008), whereas multiplex autism is associated with interactions among multiple common susceptibility alleles, each of minor influence individually (Pickles et al. 1995; Risch et al. 1999). Prior morphometric studies of autism have generally not distinguished between these subtypes and probably involve a mixture of both.
Here, we compared cortical shape and thickness in children with high-functioning simplex autism to neurotypical children. Each group was larger, more homogeneous, and better matched for age, IQ, and gender across groups than in most studies reviewed by (Chen et al. 2011). Sulcal depth was our primary shape measure, given its sensitivity in previous studies (Van Essen et al. 2006; Nordahl et al. 2007; Csernansky et al. 2008). We also carried out a coordinate-based analysis in order to test for positional displacements of gyral and sulcal features, and we also tested for group differences in cortical thickness. We report statistical significance based on each individual type of analysis, but note that a correction for multiple comparisons involving these different measures would impact the interpretation of our findings (see Discussion).
Given that surface-based registration is a key step in identifying corresponding geographic locations in different individuals, we compared 2 surface-based registration methods. Our primary analysis used FreeSurfer registration to the fsaverage atlas (Fischl 2012) followed by registration to the fs_LR atlas to bring the left and right hemispheres into geographic correspondence (Van Essen et al. 2012). We found similar results using landmark-constrained registration to the PALS atlas (Van Essen 2005).
Materials and Methods
Participants
Our study population included children with simplex autism, that is, well-characterized individuals with ASD who have no affected first-degree relatives. Thirty-two typical and 34 children with simplex autism (aged 9–14 years) were recruited from the local community using flyers, advertisements, and through other research collaborations (see Acknowledgments). Demographics are provided in Table 1. Initial screening procedures were similar to a previous study (Feczko et al. 2012). Exclusion criteria included any history of focal neurological deficit, strabismus, or vision not corrected to normal. All children with typical development had no Child Behavior Checklist (CBCL) (Achenbach 2001) subscale T score >60, and no first-degree relative with a diagnosis of ASD or attention-deficit/hyperactivity disorder, in order to limit any potential link to the set of ASDs. Individuals with simplex autism had 1) clinical diagnoses of autistic disorder, Asperger's disorder, or pervasive developmental disorder not otherwise specified made by a community MD or PhD; and 2) a positive diagnosis from the Autism Diagnostic Observation Schedule (ADOS) (Lord et al. 2000) and/or a positive diagnosis from the Autism Diagnostic Interview-Revised (ADI-R) (Lord et al. 1994). Research-certified and reliably trained personnel administered the ADOS and ADI-R assessments, the results of which are summarized in Tables 2 and 3. Some participants received different IQ assessments, because they were obtained through other studies. Five typical and 4 simplex children were IQ assessed using the Wechsler Intelligence Scale for Children (WISC-IV); (Wechsler 2003). The other children were assessed using the Wechsler Abbreviated Scale of Intelligence (Wechsler 1999); 30 children with simplex autism and 11 typical children completed all 4 subsections of the WASI and their performance and verbal IQ are provided in Table 1. The other 16 typical children completed the vocabulary and matrix reasoning subsections of the WASI. Except for Social Responsiveness Scale (SRS) (Constantino 2002) scores (t(65) = 14.5, P < 0.0001), all other demographic measures depicted in Table 1 were similar between the 2 groups: independent sample t-tests show no significant differences (smallest P = 0.15). Informed consent and assent were obtained using procedures approved by the Washington University Human Research Protection Office.
Table 1.
Demographics for the children with simplex autism and typical children
| Group | Children with simplex autism | Typical children |
|---|---|---|
| Male/female | 28/6 | 23/9 |
| Age (years) | 11.4 ± 1.9 | 11.3 ± 1.8 |
| IQ | 111.5 ± 12.5 | 114.9 ± 11.3 |
| Verbal IQ | 114.5 ± 11.0 (30) | 118.7 ± 13.0 (11) |
| Performance IQ | 108.0 ± 15.7 (30) | 113.6 ± 9.2 (11) |
| SRS | 102 ± 25.2 | 16.2 ± 9.2 |
The average and standard deviation statistics calculated from all children are provided. For verbal and performance IQ, parentheses denote the number of children used to calculate the average and standard deviation. Tables 2 and 3 summarize the results of the ADOS and ADI-R assessments for subjects with simplex autism:
Table 2.
ADOS/ADI-R Summary
| N | Mean | SD | ||
|---|---|---|---|---|
| ADOS | Communication cutoff = 3 (aut), 2 (ASD) | 30 | 2.7 | 1.2 |
| Social interaction cutoff = 6 (aut), 4 (ASD) | 30 | 6.4 | 2.3 | |
| Comm + social cutoff = 10 (aut), 7 (ASD) | 30 | 9.2 | 2.7 | |
| Stereotopy/restricted interests (no cutoff in this version) | 30 | 2.1 | 1.6 | |
| ADI-R | Social interaction cutoff = 10 | 29 | 20.6 | 5 |
| Communication cutoff = 8 | 29 | 16.5 | 5.5 | |
| Restricted interests/repetitive behaviors cutoff = 3 | 29 | 6.8 | 2.7 | |
| Abnormal dev before 36 m cutoff = 1 | 29 | 3.3 | 1.5 |
Table 3.
ADOS/ADI-R Cross-Tabulation (dx = diagnosis)
| ADI-R classification | ADOS No dx | ADOS autism dx | ADOS autism spectrum dx | ADOS missing | Total |
|---|---|---|---|---|---|
| No dx | 0 | 3 | 0 | 0 | 3 |
| Autism dx | 0 | 17 | 5 | 4 | 26 |
| Missing | 0 | 3 | 2 | 0 | 5 |
| Total | 0 | 23 | 7 | 4 | 34 |
MRI Protocols
MRI data were acquired using a Siemens 3T Trio scanner (Erlangen, Germany) with a standard 12-channel head coil. High-resolution structural images were acquired using a sagittal MP-RAGE T1-weighted (T1w) sequence (TE = 3.08 ms, TR = 2.4 s, TI = 1000 ms, flip angle = 8°, 176 slices at 1 mm isotropic resolution/voxel).
Segmentation and Surface Generation
T1w scans were input to Washington University's Central Neuroimaging Data Archive, which processed them through FreeSurfer version 5.1 (Fischl 2012; http://cnda-help.wustl.edu/FreeSurfer+Pipeline; http://surfer.nmr.mgh.harvard.edu/fswiki.
Sulcal Depth Generation and Registration
The FreeSurfer-generated surfaces were processed through the fs_LR pipeline (Van Essen et al. 2012), which computes a midthickness surface by averaging the white and pial surfaces and brings the left and right hemispheres into geographical correspondence. A cerebral hull volume was generated by filling the midthickness surface, then dilating and eroding 6 times to fill the sulci. Sulcal depth was computed as the distance between each vertex on the midthickness surface and the closest vertex on the hull surface, without deviating 90° or more from the surface normal. The pipeline outputs coordinates in both original and MNI stereotaxic spaces, using FreeSurfer's talairch.xfm to transform the former to the latter. Because we were interested in shape differences independent of scale, we used the MNI surfaces to generate depth and as the inputs for the coordinate analysis of variance (ANOVA) tests. The same FreeSurfer-generated surfaces were processed through the PALS (Anticevic et al. 2012) pipeline, which uses Caret's landmark-based registration (Van Essen 2005), instead of FreeSurfer's surf.reg output. This pipeline requires inspection of the registration landmarks and manual adjustment in some cases.
Sulcal Depth Differences
Sulcal depth differences were computed using methods similar to those described by (Nordahl et al. 2007), but instead of using a cluster-forming threshold, a threshold-free cluster enhancement (TFCE) (Smith and Nichols 2009; Hill et al. 2010) was used for multiple comparisons correction. This avoids the problem that small changes in the cluster-forming threshold can produce very different outcomes (Hill et al. 2010). Briefly, a t-statistic was computed at each vertex (difference in group means normalized by the unpooled standard error). Groups were permuted 5000 times; smoothed slightly; and enhanced per the TFCE algorithm, which integrates signal height and spatial extent over the whole range of input t-statistics. To determine which vertices were significant, the smoothed TFCE-map was thresholded at the 97.5 percentile of the maximum TFCE value (i.e., at 2.5% instead of 5% to correct for multiple comparisons of the left and right hemispheres). The PALS t-maps (actual and randomized) were smoothed 4 iterations at 0.5 strength using Caret 5.65’s average neighbors algorithm before TFCE thresholding. The fs_LR t-maps were smoothed 9 iterations, as this mesh has 2.2 times as many vertices, and the algorithm's spatial smoothing depends on the ratio of iterations to number of vertices. The intent is to take the spikes out of the t-maps without losing spatial specificity.
Because bilateral hot spots near the TPJ failed to reach significance under the hemisphere-specific tests, an interhemispheric correspondence test was performed as in Van Essen et al. (2006) and Nordahl et al. (2007), but with TFCE used instead of a cluster-forming threshold. Briefly, the interhemispheric test takes the product of the left and right hemisphere-specific t-maps and uses TFCE to determine the significance cutoff, after slight smoothing. This test detects smaller clusters than the hemisphere-specific tests can, provided that they occur bilaterally.
Signed Distance Map
Maps of the signed distance between the group mean midthickness surfaces were computed using Connectome Workbench's wb_command -signed-distance-to-surface (http://www.humanconnectome.org/connectome/get-connectome-workbench.html). These maps show where one group's mean midthickness lies inside or outside the other group's mean midthickness.
Gyral Region Associated with Sulcal Depth Differences
Group differences in sulcal depth can be statistically significant in a deeply buried region (e.g., near the fundus of a sulcus) but arise from shape differences centered on nearby gyral region. We used the methods developed by (Nordahl et al. 2007) to identify the associated gyral region in regions where the significant sulcal depth difference could not be explained by differences in the average midthickness contours in the region of significant sulcal depth differences. Briefly, this method computes a frequency map showing locations on the cerebral hull that are closest to the vertices with significant sulcal depth differences.
Coordinate ANOVA
The 3D coordinate ANOVA is sensitive to a different set of shape differences than those detected using sulcal depth measures. Mean coordinates were computed for geographically corresponding vertices in each group, as well as for the entire sample. For each vertex, the F-statistic was computed as follows:
groupMeanXYZ[i] = mean x,y,z coordinate for group i
grandMeanXYZ = mean x,y,z coordinate across all subjects, regardless of group
distanceTreatment[i] = for group i
distanceError[i,j] = for group i, subject j
- n[i] = number of subjects in group i; K = number of groups; N = total number of subjects
Groups were permuted, and the resulting f-maps were smoothed before input to TFCE, using methods similar to those used for the sulcal depth t-maps (Yu et al. 2007).
Each subject's midthickness surface was linearly regressed to the mean of the group mean midthickness surfaces for each hemisphere (mean of the means) using the method of Yu et al. (2007). We applied the resulting affine transform to each subject's midthickness surface before input to the coordinate ANOVA, to minimize the variability from source to target, without bias toward either group.
Animations
To aid visualization of depth differences, we used Caret 5.65 (http://brainvis.wustl.edu/wiki/index.php/Caret:About) to create animations morphing between mean midthickness surfaces of simplex autism and typical children.
Cortical Thickness
We also used the hemisphere-specific thickness maps from FreeSurfer's standard output to perform a t-test using the fs_LR registered surfaces. We used the same multiple comparisons correction (TFCE, etc.) used for sulcal depth.
Results
Figure 1 shows lateral views of the mean midthickness surfaces for the children with simplex autism (top row) and typical children (lower panel). These surfaces are qualitatively similar in the two groups, but a number of subtle shape differences are discernible on close inspection. The sulcal depth analysis described below revealed significant differences in two regions outlined by dark contours: the temporo-parietal junction (TPJ, green arrows) and the anterior-insula/frontal-operculum (aI/fO). Yellow arrows indicate nearby gyral regions associated with the significant depth differences in the aI/fO (see below).
Figure 1.

Mean midthickness surfaces for simplex autism and controls. Borders enclose clusters significant based on single-measure analyses (blue right aI/fO; black interhem—more visible on inflated views that follow. For other views (e.g., dorsal, ventral, medial), see Figure 1 in the Supplementary Material. Green arrows correspond to TPJ differences depicted in Figure 4. Yellow arrows indicate locations along the IFG associated with the aI/fO difference (see also Fig. 4).
Hemisphere-Specific Analysis
Figure 2 shows t-statistic maps of the group differences in sulcal depth displayed on inflated atlas surfaces for the left hemisphere (top row) and right hemisphere (bottom row), based on the FreeSurfer/fs_LR registration method. The hemisphere-specific tests revealed a significant difference in the right aI/fO (Fig. 2, red patch enclosed by blue border in right insular cortex, lateral view). They are scaled −2.3 to +2.3, corresponding to a P of 0.025/hemisphere. While the statistical significance is associated with the deeply buried aI/fO region the actual morphological abnormality is more likely a reflection of shape differences in the IFG (see below). Similar results were obtained using the PALS registration method (see Supplementary Material).
Figure 2.

t-Statistic maps for sulcal depth differences (hemisphere-specific) with blue border encircling significant cluster. Black arrows point to clusters that are significant in the interhemispheric correlation analysis (see Fig. 3), but not the hemisphere-specific test.
Interhemispheric Correlation Analysis
Some “hotspots” of sulcal depth group differences that are below statistical significance based on the within-hemisphere t-statistic map are located in corresponding locations in the left and right hemispheres. This includes a region in the aI/fO in the left hemisphere, and regions in the left and right TPJ in which cortex is deeper in typical children (arrows in Fig. 2). We used an interhemispheric correspondence analysis (Van Essen et al. 2006; Nordahl et al. 2007) to test for statistical significance of symmetrical group differences in sulcal depth. Figure 3 shows a t-product map (t-map_left × t-map_right), with significant clusters encircled by black borders. The significant patch in the TPJ is small, but is associated with larger patches in each of the single-hemisphere t-maps (arrows in Fig. 2).
Figure 3.

Interhemispheric t-product maps with black borders encircling significant clusters. The scale ranges from −5.3 to +5.3, which corresponds to the square of the t-map scale (since these are t-products).
Associated Gyral Cortex
Nordahl et al. (2007) demonstrated that a significant difference in sulcal depth does not necessarily reflect structural differences directly at the site of statistical significance. In some situations, it can instead be attributable to a cortical folding abnormality in a nearby gyral region. Figure 4 illustrates that this alternate interpretation applies to the present results for the aI/fO ROI (but not the TPJ ROI). The left panel shows the mean midthickness surface contours for children with simplex autism (red) and typical children (blue) at a coronal slice level corresponding to the aI/fO ROI (with the MNI152 average brain volume as an anatomical background). Along the insula and operculum, the red and blue contours are virtually superimposed, showing little or no difference (gray arrows). In contrast, the contours are separated along the crown of the IFG (Fig. 4, left panel, yellow arrow; see also Supplementary Data, Gyral Region Associated with Depth Differences). The signed distance between the group mean midthickness surfaces (map shown in middle panel) also shows greater distance in the IFG than the aI/fO). The yellow arrows in the left and middle panels show corresponding locations in the slice contour and inflated distance map views.
Figure 4.
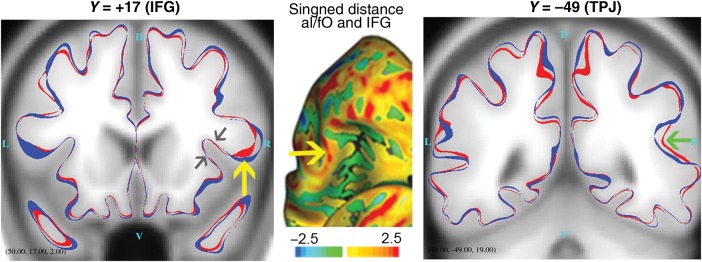
Mean midthickness contours overlaid on avg152T1 (red: children with simplex autism; blue: typical children). Yellow arrow points to region of maximum coordinate distance between the red (simplex autism) and blue (typical) surfaces, including not only the significant aI/fO region, but also its gyral counterpart). Gray arrows point to aI/fO regions where contours are virtually superimposed (differences not evident). Middle panel shows a signed distance map overlaid on the right inflated fs_LR surface (anterior view, rotated chin-up). The signed distance map shows where the mean midthickness surfaces differ most. Within the joint aI/fO and IFG region, the IFG shows greater distance. It is scaled −2.5 mm (blue: typical inside) to +2.5 mm (red: typical outside). Green arrow points to region of significant TPJ difference, which is evident in the distance between contours.
The rightmost panel of Figure 4 shows surface contours centered on the significant ROI in the TPJ. The green arrow indicates where the mean simplex autism contour (red) is significantly shallower than the mean contour for typical children (blue). In many other regions, the distance between mean surface contours is comparable in magnitude but does not pass statistical significance by the TFCE method, owing to the limited spatial extent and degree of intersubject variability in that region.
Correlations Between Depth and Behavioral Measures
We correlated depth in the four regions that survived TFCE thresholding (left and right IFG and TPJ) with 16 behavioral measures (SRS; 8 CBCL subscales; 4 ADOS subscales; and 3 ADIR subscales). None of the correlations survived correction for the 64 comparisons, but those with an uncorrected P-value ≤0.1 are listed in Table 4.
Table 4.
Correlations between most significant depth regions and behavioral measures
| Region | Scale | Measure | r2 | Uncorrected P-value |
|---|---|---|---|---|
| Left TPJ | ADI-R | Restricted interests/repetitive behaviors | 0.1757 | 0.02 |
| Right TPJ | CBCL | Aggression t-score | 0.1031 | 0.06 |
| Right IFG | ADOS | Communication and social interaction total | 0.1134 | 0.07 |
| Left IFG | CBCL | Thought t-score | 0.0991 | 0.07 |
Coordinate ANOVA
No significant clusters were identified using the coordinate ANOVA method, which is sensitive to regions where the distance between the group mean midthickness surfaces is high compared with the within-group variability. The f-map (Fig. 5, top row) shows clusters in the right TPJ and posterior STS (red patches, black arrows) near the significant TPJ cluster identified in the sulcal depth analysis, but neither survived TFCE thresholding. The signed distance map (Fig. 5, row 2), shows multiple clusters where the distance between the mean midthickness surface is at least 2.5 mm, but none is statistically significant. The red, blue, and green (RGB) map (Fig. 5, bottom row) shows the direction of the shifts whose amplitude is represented in the signed distance map (row 2).
Figure 5.

f-maps, signed distance, and RGB maps. The f-map (row 1) is scaled to 5.3, which corresponds to a P of 0.025 per hemisphere. It shows the between-group to within-group variability ratio. Black arrows denote TPJ and posterior STS clusters near the right TPJ cluster found to be deeper using the interhemispheric depth test, but neither survives TFCE thresholding by the coordinate ANOVA. The signed distance maps (row 2) are scaled to 2.5 mm, where blue–green colors show where the typical midthickness surface is inside the simplex autism surface, and red-yellow colors show where the typical midthickness surface is outside the simplex autism surface. The RGB map (row 3) shows the direction of the shifts whose amplitude is represented in the full group-signed distance map (row 2). Shifts along the x-axis (dx) are red; the y-axis (dy) are green; and the z-axis (dz) are blue—all scaled to 2.5 mm. While the color indicates the axis of a shift, it does not show which group is more lateral/anterior/superior than the other. To determine which group is shifted relative to the other, see the Animations (http://brainvis.wustl.edu/donna/SAIS/PARED/MOVIES). The animations morph from the shape of children with autism to the typical shape, and then back again.
Animations
Statistical methods, such as those used here, provide an objective way to identify restricted spatial locations linked to significant group differences in cortical anatomy. However, there is inherent danger in focusing too narrowly on the “tip of the iceberg,” that is, only the regions that pass statistical significance. The preceding analysis on gyral regions associated with significant differences in sulcal depth provide one useful illustration of the importance of placing spatially localized regions of significance into a broader anatomical context. Here, we extend this notion using 3D animations to place the significant ROIs into the context of overall shape differences between mean midthickness surfaces for the 2 groups. These animations are accessible at Movies of Mean Midthickness Surfaces Morphing Across Groups; click on the view of interest (http://brainvis.wustl.edu/donna/SAIS/PARED/MOVIES). The right lateral view is particularly notable. These animations also include results from splitting both children with simplex autism and typical children into 2 subgroups, in order to assess the consistency of results using this approach. For a discussion of the split-group concordance/discordance, see Supplementary Material, Split-Group-Signed Distance and Product Maps.
Stereotaxic Coordinates of ROIs
Table 5 shows the stereotaxic centers of regions with greatest significance identified by the preceding analysis (FreeSurfer/fs_LR method) and by the PALS registration method (see Supplementary Material). The 3D coordinates for the PALS and FreeSurfer/fs_LR methods differ modestly, as expected since they involve registration to a different stereotaxic space.
Table 5.
Clusters of greatest significance
| Region | Hem | Method | x,y,z | Space | Area (mm2) |
|---|---|---|---|---|---|
| IFG (aI/fO) | R | PALS hemisphere-specific | 37,7,10 | 711–2B | 833 |
| IFG (aI/fO) | LR | fs_LR interhemispheric | ±35,15,9 | MNI305 | 540 |
| IFG (aI/fO) | R | fs_LR hemisphere-specific | 36,10,9 | MNI305 | 387 |
| TPJ | LR | fs_LR interhemispheric | ±49,−49,19 | MNI305 | 39 |
| TPJ | LR | PALS interhemispheric | ±49,−54,17 | 711–2B | 19 |
Cortical Thickness
TFCE detected no significant regional difference in cortical thickness between the 2 groups (Fig. 6), even though thickness differences have been reported previously (see Discussion).
Figure 6.
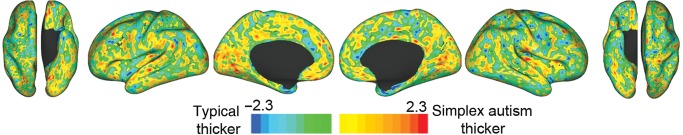
t-Statistic maps for cortical thickness differences (hemisphere-specific). No significant differences were detected. The t-map is scaled −2.3 to 2.3, which corresponds to a P of 0.025 per hemisphere.
Discussion
Comparisons with Previous Findings
This study provides evidence for altered cortical shape in the TPJ and IFG in children with simplex autism compared with typical children matched for age, full-scale IQ, and gender. To our knowledge, this is the first surface-based analysis of cortical shape in simplex autism and is the largest analysis of cortical shape differences in 9- to 14-year-old children with autism.
The TPJ shape alteration that passed statistical significance is spatially very restricted, but, as in many morphometric studies, this is likely to represent the tip of an iceberg. The animations that illustrate group differences in mean midthickness surfaces (see Movies of Mean Midthickness Surfaces Morphing Across Groups and the split-group section in the Supplemental Material) (http://brainvis.wustl.edu/donna/SAIS/PARED/MOVIES) suggest that there are widespread shape differences in this region, with only a central peak that passes significance by the sulcal depth measure (and none at all by the coordinate difference test). Likewise, the IFG abnormality associated with the aI/fO significant sulcal depth difference may reflect the tip of a different iceberg whose breadth is suggested by the animations of group differences in mean midthickness surfaces in lateral prefrontal cortex, especially in the right hemisphere.
Levitt et al. (2003) used a shape analysis that entailed manual tracing of the lips of 11 sulci in each individual. They reported significant differences in 40 different measures of sulcal position and extent (compared with 13 expected by chance). The significant differences included the inferior frontal sulcus and the ascending limb of the STS, which overlap with our significant TPJ and IFG regions. However, they reported significant differences over a much larger cortical expanse, including a number of regions where our sulcal depth and coordinate difference results were below significance.
Neither Nordahl et al. (2007) nor Shokouhi et al. (2012) identified the TPJ shape abnormality reported here. Unlike the deeper left aI/fO (more inferior extension of the left IFG) found by Nordahl et al. (2007) in children with low functioning autism, we found bilateral aI/fO less deep in children with high-functioning simplex autism (IFG bilaterally more extended laterally/inferiorly in typical children). This is consistent with the asymmetry reversal reported by De Fosse et al. (2004) in Broca's area in children with language-impaired autism, relative to typical children and children with autism but no language impairments. The supramarginal cluster that Nordahl et al. (2007) found significant in children with high-functioning autism shows little difference in our depth t-maps, but our signed distance maps show differences that fail to reach significance, possibly due to high 3D variability. The RGB map shows multiple shifts near this restricted region, depicted more clearly in the lateral animations.
Using the TFCE maximum distribution ensured that our false-positive rate was below 0.05 (0.025 per hemisphere) for the individual tests; however, after correcting for the 4 tests run (hemisphere-specific depth, interhemispheric, coordinate ANOVA, and thickness), no results passed this more rigorous criterion for significance. Overall, the cortex of children with simplex autism is shaped much like the cortex of typical children, even in an analysis that includes 30+ children in each group. But the animations are consistent with an extended constellation of modest differences between children with simplex autism and typical children.
Among several brain areas, Frith and Frith (2007) cited as key for human social cognition are not only the IFG and TPJ, but also posterior STS and IPS, 2 of the regions that failed to reach significance in this study, but ranked high in split-group concordance (see Supplementary Material, Split Group-Signed Distance and Product Maps). Bilateral IFG and left TPJ also were among the regions Gotts et al. (2012) reported to be underconnected in adolescents with high-functioning autism, but the largest region of connectivity difference reported in that study was the right posterior middle temporal gyrus. Though it did not survive TFCE thresholding in this study, it is among the most prominent subthreshold clusters on our split-group concordance maps and among the most striking in the animations.
Functional Considerations
We discuss the role of the TPJ and IFG only briefly, given that they are unlikely to be the sole loci of circuit abnormalities in simplex autism, and the literature on functional specializations of these regions is complex and not definitive.
The IFG and the TPJ both lie near the confluence of multiple functional networks delineated by functional and structural connectivity analyses (Power et al. 2011; Yeo et al. 2011; Mars et al. 2012), each of which is implicated in complex and incompletely understood higher cognitive functions.
The right IFG has been implicated in communication (Wang et al. 2006; Catarino et al. 2011), imitative and overlearned responses (Nishitani et al. 2005). The right TPJ has been linked to a range of tasks, from lower level agency and reorienting to higher order social processes such as empathy and theory of mind (Decety and Lamm 2007). The left TPJ has been implicated in perception of body parts (Lombardo et al. 2011). Lesion studies implicate TPJ in perception and spatial attention (Bultitude et al. 2009; Chechlacz et al. 2013) but also in visual processing (Bultitude et al. 2009). TPJ and IFG together have been implicated in face perception (Hadjikhani et al. 2006; Pitskel et al. 2011).
In relation to ASD, there is evidence for reduced TPJ and IFG activity involving passive viewing of faces (Hadjikhani et al. 2007; Pitskel et al. 2011) and reduced deactivations in TPJ when representing physical states (Lombardo et al. 2011). Deficits in visual attention in ASD have been suggested in earlier studies (O'Riordan et al. 2001; O'Riordan 2004; Senju et al. 2008; Akechi et al. 2009; Ashwin et al. 2009) but not in more recent carefully performed studies that instead implicate disrupted visual processing (Baldassi et al. 2009; Joseph et al. 2009; Pruett et al. 2011, 2013). A recent study of infants at risk for autism suggests that atypical visual orienting may predict future ASD diagnosis (Elison et al. 2013).
Limitations
There was insufficient power in this study to identify significant differences using the coordinate ANOVA method. This method can detect differences for which sulcal depth is not sensitive (e.g., the precentral shift seen in the right hemisphere, or more/less pronounced occipital petalia). Also, interpreting coordinate ANOVA results is more straightforward (insofar as the aI/fO depth difference reported here is likely a reflection of an IFG shape difference). Both the depth t-maps and coordinate ANOVA f-maps were normalized by a variance estimate, in order to achieve uniform sensitivity (Nichols and Holmes 2002). The lower sensitivity of the 3D coordinate analysis may reflect the high degree of individual variability in 3D positions of major sulci and gyri.
In our analysis of sulcal depth, we found the fs_LR registration method to be more sensitive than the landmark-based PALS-B12 registration method, insofar as fs_LR mesh's significant clusters were more numerous and extended, except for the hemisphere-specific right aI/fO difference. Another advantage is that the fs_LR method is fully automated, whereas manual correction of the landmarks is sometimes necessary using the PALS-B12 method.
We were unable to reproduce cortical thickness differences reported in other studies, possibly due in part to age differences. Hyde et al. (2010) found thicker frontal cortex in subjects with ASD, but their subjects were roughly 10 years older than our children. They also used a 20-mm blurring kernel, while we did not smooth, apart from the small amount to remove spikes in the t-maps going into TFCE. Hadjikhani et al. (2006) found thinner cortex in areas involved in emotion recognition and social cognition (e.g., bilateral IFG and IPL; right STS, supramarginal, and SPL), but most of their subjects were in their 30s. Hardan et al. (2006) used subjects ranging 8–12 years with a 20-point IQ difference between groups, but their analysis accounted for IQ and other variables, reporting thicker temporal cortex in ASD subjects. Jiao et al. (2010) used slightly younger subjects and reported thinner cortex in ASD subjects in bilateral IFG, left medial orbitofrontal gyrus, left parahippocampal gyrus, and left frontal pole, while cortex in subjects with ASD was thicker in left caudal anterior cingulate and left precuneus. Their analysis used mean thickness for each of 66 regions, rather than the vertexwise/TFCE method used in this study. It is unclear to what degree our discordance stems from age, smoothing/blurring, and analyzing by vertex versus parcel.
Longitudinal studies of autism suggest that changes in brain structure over time may be important as well as the mature structure of the brain (Amaral et al. 2008; Wolff et al. 2012). Thus, following changes in brain structure and circuitry may be important for understanding the etiology of autism. However, cross-sectional studies generally provide only a snapshot of a limited age range. Cross-sectional studies may appear to contradict one another because the direction of the effects may change depending on the ages studied. Nonetheless, most structural studies of autism have been cross-sectional because of the logistical challenges of conducting a large-scale longitudinal study.
The cortical surfaces used in this study exclude several subcortical and other structures implicated in autism (e.g., amygdala, corpus callosum, cerebellum, caudate nucleus, thalamus).
Future Directions
To reduce confounds arising from heterogeneity in age, diagnosis, and so forth, future studies may benefit from strategies that address potentially overlapping contrasts, such as those used by the Infant Brain Imaging Study (IBIS, http://www.ibisnetwork.org) and (Hazlett et al. 2012).
Applying multivariate analysis of covariance (MANCOVA) to this sample would be of interest to examine the relationship between local shape and dimensional variables such as the Social Responsiveness Scale (Constantino et al. 2003; Paniagua et al. 2009).
Future studies aiming to decipher the role of different brain regions and networks in autism may benefit from a multimodal approach that uses a combination of resting state, task-evoked, and structural MRI measures and capitalizes on the advances in data acquisition and analysis provided by efforts such as the Human Connectome Project (Van Essen et al. 2013).
Supplementary Material
Supplementary material can be found at: http://www.cercor.oxfordjournals.org/.
Funding
This work was supported by a grant from the Simons Foundation Autism Research Initiative (Brain Circuitry in Simplex Autism, S.E.P. PI), NIH grant 1U54MH091657, funded by the 16 NIH Institutes and Centers that support the NIH Blueprint for Neuroscience Research; by the McDonnell Center for Systems Neuroscience at Washington University (D.L.D. and D.C.V.E.), K12 EY016336 (J.R.P.), and the Intellectual and Developmental Disabilities Research Center at Washington University, National Institute of Health (NIH)/National Institute of Child Health and Development (NICHD) (P30 HD062171).
Supplementary Material
Notes
The authors thank Erin Reid for landmark editing and surface evaluation; Sarah Hoertel for coordinating recruitment, scheduling, and assessments of the children; Kelly McVey, Katie Ihnen, Rebecca Coalson, and Jessica Church for help with recruitment, scheduling, assessing, and scanning; Jen Simmons, Anna Abbacchi, Teddi Gray, and others from the Constantino lab for assessing and/or recruiting children; Dan Marcus and his lab for database support; Joseph Price, Harold Burton, Avi Snyder, and Alan Anticevic for scientific discussions; and Susan Danker for help in manuscript preparation. Conflict of Interest: None declared.
References
- Achenbach T. CBCL/6–18 profile for boys—syndrome scales. ASEBA Burlington, VT: University of Vermont, Research Center for Children, Youth, and Families; 2001. [Google Scholar]
- Akechi H, Senju A, Kikuchi Y, Tojo Y, Osanai H, Hasegawa T. Does gaze direction modulate facial expression processing in children with autism spectrum disorder? Child Dev. 2009;80:1134–1146. doi: 10.1111/j.1467-8624.2009.01321.x. [DOI] [PubMed] [Google Scholar]
- Amaral DG, Schumann CM, Nordahl CW. Neuroanatomy of autism. Trends Neurosci. 2008;31:137–145. doi: 10.1016/j.tins.2007.12.005. [DOI] [PubMed] [Google Scholar]
- American Psychiatric Association. Diagnostic and statistical manual of mental disorders. 4th ed. Washington, DC: American Psychiatric Association; 2013. (DSM-IV) doi:101176/appibooks97808990423349. [Google Scholar]
- Anticevic A, Repovs G, Dierker D, Harwell J, Coalson T, Barch DM, Van Essen DC. Automated landmark identification for human cortical surface-based registration. NeuroImage. 2012;59:2539–2547. doi: 10.1016/j.neuroimage.2011.08.093. doi:2510.1016/j.neuroimage.2011.2508.2093. [DOI] [PMC free article] [PubMed] [Google Scholar]
- Ashwin C, Ricciardelli P, Baron-Cohen S. Positive and negative gaze perception in autism spectrum conditions. Soc Neurosci. 2009;4:153–164. doi: 10.1080/17470910802337902. [DOI] [PubMed] [Google Scholar]
- Baldassi S, Pei F, Megna N, Recupero G, Viespoli M, Igliozzi R, Tancredi R, Muratori F, Cioni G. Search superiority in autism within, but not outside the crowding regime. Vision Res. 2009;49:2151–2156. doi: 10.1016/j.visres.2009.06.007. [DOI] [PubMed] [Google Scholar]
- Bultitude JH, Rafal RD, List A. Prism adaptation reverses the local processing bias in patients with right temporo-parietal junction lesions. Brain. 2009;132:1669–1677. doi: 10.1093/brain/awp096. [DOI] [PMC free article] [PubMed] [Google Scholar]
- Catarino A, Luke L, Waldman S, Andrade A, Fletcher PC, Ring H. An fMRI investigation of detection of semantic incongruities in autistic spectrum conditions. Eur J Neurosci. 2011;33:558–567. doi: 10.1111/j.1460-9568.2010.07503.x. [DOI] [PubMed] [Google Scholar]
- Chechlacz M, Rotshtein P, Hansen PC, Deb S, Riddoch MJ, Humphreys GW. The central role of the temporo-parietal junction and the superior longitudinal fasciculus in supporting multi-item competition: evidence from lesion-symptom mapping of extinction. Cortex. 2013;49:487–506. doi: 10.1016/j.cortex.2011.11.008. [DOI] [PubMed] [Google Scholar]
- Chen R, Jiao Y, Herskovits EH. Structural MRI in autism spectrum disorder. Pediatr Res. 2011;69:63R–68R. doi: 10.1203/PDR.0b013e318212c2b3. [DOI] [PMC free article] [PubMed] [Google Scholar]
- Constantino JN. The social responsiveness scale. Los Angeles: Western Psychological Services; 2002. [Google Scholar]
- Constantino JN, Davis SA, Todd RD, Schindler MK, Gross MM, Brophy SL, Metzger LM, Shoushtari CS, Splinter R, Reich W. Validation of a brief quantitative measure of autistic traits: comparison of the social responsiveness scale with the autism diagnostic interview-revised. J Autism Dev Disord. 2003;33:427–433. doi: 10.1023/a:1025014929212. [DOI] [PubMed] [Google Scholar]
- Csernansky JG, Gillespie SK, Dierker DL, Anticevic A, Wang L, Barch DM, Van Essen DC. Symmetric abnormalities in sulcal patterning in schizophrenia. NeuroImage. 2008;43:440–446. doi: 10.1016/j.neuroimage.2008.07.034. [DOI] [PMC free article] [PubMed] [Google Scholar]
- De Fosse L, Hodge SM, Makris N, Kennedy DN, Caviness VS, Jr, McGrath L, Steele S, Ziegler DA, Herbert MR, Frazier JA, et al. Language-association cortex asymmetry in autism and specific language impairment. Ann Neurol. 2004;56:757–766. doi: 10.1002/ana.20275. [DOI] [PubMed] [Google Scholar]
- Decety J, Lamm C. The role of the right temporoparietal junction in social interaction: how low-level computational processes contribute to meta-cognition. Neuroscientist. 2007;13:580–593. doi: 10.1177/1073858407304654. [DOI] [PubMed] [Google Scholar]
- Elison JT, Paterson SJ, Wolff JJ, Reznick JS, Sasson NJ, Gu H, Botteron KN, Dager SR, Estes AM, Evans AC, et al. for the IBIS Network. White matter microstructure and atypical visual orienting in 7-month-olds at risk for autism. Am J Psychiatry. 2013;170:899–908. doi: 10.1176/appi.ajp.2012.12091150. [DOI] [PMC free article] [PubMed] [Google Scholar]
- Feczko E, Miezin FM, Constantino JN, Schlaggar BL, Petersen SE, Pruett JR., Jr The hemodynamic response in children with Simplex Autism. Dev Cogn Neurosci. 2012;2:396–408. doi: 10.1016/j.dcn.2012.06.001. [DOI] [PMC free article] [PubMed] [Google Scholar]
- Fischl B. Freesurfer. NeuroImage. 2012;62:774–781. doi: 10.1016/j.neuroimage.2012.01.021. [DOI] [PMC free article] [PubMed] [Google Scholar]
- Frith CD, Frith U. Social cognition in humans. Curr Biol. 2007;17:R724–R732. doi: 10.1016/j.cub.2007.05.068. [DOI] [PubMed] [Google Scholar]
- Gerdts J, Bernier R. The broader autism phenotype and its implications on the etiology and treatment of autism spectrum disorders. Autism Res Treat. 2011;2011:545901. doi: 10.1155/2011/545901. [DOI] [PMC free article] [PubMed] [Google Scholar]
- Gotts SJ, Simmons WK, Milbury LA, Wallace GL, Cox RW, Martin A. Fractionation of social brain circuits in autism spectrum disorders. Brain. 2012;135:2711–2725. doi: 10.1093/brain/aws160. doi:10.1093/brain/aws160. [DOI] [PMC free article] [PubMed] [Google Scholar]
- Hadjikhani N, Joseph RM, Snyder J, Tager-Flusberg H. Anatomical differences in the mirror neuron system and social cognition network in autism. Cereb Cortex. 2006;16:1276–1282. doi: 10.1093/cercor/bhj069. [DOI] [PubMed] [Google Scholar]
- Hadjikhani N, Joseph RM, Snyder J, Tager-Flusberg H. Abnormal activation of the social brain during face perception in autism. Hum Brain Mapp. 2007;28(5):441–449. doi: 10.1002/hbm.20283. doi:10.1002/hbm.20283. [DOI] [PMC free article] [PubMed] [Google Scholar]
- Hardan AY, Muddasani S, Vemulapalli M, Keshavan MS, Minshew NJ. An MRI study of increased cortical thickness in autism. Am J Psychiatry. 2006;163:1290–1292. doi: 10.1176/appi.ajp.163.7.1290. [DOI] [PMC free article] [PubMed] [Google Scholar]
- Hazlett HC, Poe MD, Lightbody AA, Styner M, MacFall JR, Reiss AL, Piven J. Trajectories of early brain volume development in fragile X syndrome and autism. J Am Acad Child Adolesc Psychiatry. 2012;51:921–933. doi: 10.1016/j.jaac.2012.07.003. [DOI] [PMC free article] [PubMed] [Google Scholar]
- Hill J, Dierker D, Neil J, Inder T, Knutsen A, Harwell J, Coalson T, Van Essen D. A surface-based analysis of hemispheric asymmetries and folding of cerebral cortex in term-born human infants. J Neurosci. 2010;30:2268–2276. doi: 10.1523/JNEUROSCI.4682-09.2010. [DOI] [PMC free article] [PubMed] [Google Scholar]
- Hughes JR. A review of recent reports on autism: 1000 studies published in 2007. Epilepsy Behav. 2008;13:425–437. doi: 10.1016/j.yebeh.2008.06.015. [DOI] [PubMed] [Google Scholar]
- Hughes JR. Update on autism: a review of 1300 reports published in 2008. Epilepsy Behav. 2009;16:569–589. doi: 10.1016/j.yebeh.2009.09.023. [DOI] [PubMed] [Google Scholar]
- Hyde KL, Samson F, Evans AC, Mottron L. Neuroanatomical differences in brain areas implicated in perceptual and other core features of autism revealed by cortical thickness analysis and voxel-based morphometry. Hum Brain Mapp. 2010;31(4):556–566. doi: 10.1002/hbm.20887. doi:10.1002/hbm.20887. [DOI] [PMC free article] [PubMed] [Google Scholar]
- Jiao Y, Chen R, Ke X, Chu K, Lu Z, Herskovits EH. Predictive models of autism spectrum disorder based on brain regional cortical thickness. Neuroimage. 2010;50:589–599. doi: 10.1016/j.neuroimage.2009.12.047. doi:10.1016/j.neuroimage.2009.12.047. [DOI] [PMC free article] [PubMed] [Google Scholar]
- Joseph RM, Keehn B, Connolly C, Wolfe JM, Horowitz TS. Why is visual search superior in autism spectrum disorder? Dev Sci. 2009;12:1083–1096. doi: 10.1111/j.1467-7687.2009.00855.x. [DOI] [PubMed] [Google Scholar]
- Levitt JG, Blanton RE, Smalley S, Thompson PM, Guthrie D, McCracken JT, Sadoun T, Heinichen L, Toga AW. Cortical sulcal maps in autism. Cereb Cortex. 2003;13:728–735. doi: 10.1093/cercor/13.7.728. [DOI] [PubMed] [Google Scholar]
- Lombardo MV, Chakrabarti B, Bullmore ET, Baron-Cohen S. Specialization of right temporo-parietal junction for mentalizing and its relation to social impairments in autism. NeuroImage. 2011;56:1832–1838. doi: 10.1016/j.neuroimage.2011.02.067. [DOI] [PubMed] [Google Scholar]
- Lord C, Risi S, Lambrecht L, Cook EH, Jr, Leventhal BL, DiLavore PC, Pickles A, Rutter M. The autism diagnostic observation schedule-generic: a standard measure of social and communication deficits associated with the spectrum of autism. J Autism Dev Disord. 2000;30:205–223. [PubMed] [Google Scholar]
- Lord C, Rutter M, Le Couteur A. Autism diagnostic interview-revised: a revised version of a diagnostic interview for caregivers of individuals with possible pervasive developmental disorders. J Autism Dev Disord. 1994;24:659–685. doi: 10.1007/BF02172145. [DOI] [PubMed] [Google Scholar]
- Mars RB, Sallet J, Schuffelgen U, Jbabdi S, Toni I, Rushworth MF. Connectivity-based subdivisions of the human right “temporoparietal junction area”: evidence for different areas participating in different cortical networks. Cereb Cortex. 2012;22:1894–1903. doi: 10.1093/cercor/bhr268. [DOI] [PubMed] [Google Scholar]
- McPartland J, Volkmar FR. Autism and related disorders. In: Vinken PJ, Bruyn GW, editors. Handbook of clinical neurology. Vol. 106. 2012. pp. 407–418. New Haven, CT, USA: Yale Child Study Center. [DOI] [PMC free article] [PubMed] [Google Scholar]
- Nichols TE, Holmes AP. Nonparametric permutation tests for functional neuroimaging: a primer with examples. Hum Brain Mapp. 2002;15:1–25. doi: 10.1002/hbm.1058. [DOI] [PMC free article] [PubMed] [Google Scholar]
- Nishitani N, Schurmann M, Amunts K, Hari R. Broca's region: from action to language. Physiol Bethesda. 2005;20:60–69. doi: 10.1152/physiol.00043.2004. [DOI] [PubMed] [Google Scholar]
- Nordahl CW, Dierker D, Mostafavi I, Schumann CM, Rivera SM, Amaral DG, Van Essen DC. Cortical folding abnormalities in autism revealed by surface-based morphometry. J Neurosci. 2007;27:11725–11735. doi: 10.1523/JNEUROSCI.0777-07.2007. [DOI] [PMC free article] [PubMed] [Google Scholar]
- O'Riordan MA. Superior visual search in adults with autism. Autism. 2004;8:229–248. doi: 10.1177/1362361304045219. [DOI] [PubMed] [Google Scholar]
- O'Riordan MA, Plaisted KC, Driver J, Baron-Cohen S. Superior visual search in autism. J Exp Psychol Hum Percept Perform. 2001;27:719–730. doi: 10.1037//0096-1523.27.3.719. [DOI] [PubMed] [Google Scholar]
- Paniagua B, Styner M, Macenko M, Pantazis D, Niethammer M. Local shape analysis using MANCOVA. Insight J. 2009 http://hdl.handle.net/10380/3124 . [Google Scholar]
- Pantazis D, Joshi A, Jiang J, Shattuck DW, Bernstein LE, Damasio H, Leahy RM. Comparison of landmark-based and automatic methods for cortical surface registration. NeuroImage. 2010;49:2479–2493. doi: 10.1016/j.neuroimage.2009.09.027. [DOI] [PMC free article] [PubMed] [Google Scholar]
- Pickles A, Bolton P, Macdonald H, Bailey A, Le Couteur A, Sim CH, Rutter M. Latent-class analysis of recurrence risks for complex phenotypes with selection and measurement error: a twin and family history study of autism. Am J Hum Genet. 1995;57:717–726. [PMC free article] [PubMed] [Google Scholar]
- Pitskel NB, Bolling DZ, Hudac CM, Lantz SD, Minshew NJ, Vander Wyk BC, Pelphrey KA. Brain mechanisms for processing direct and averted gaze in individuals with autism. J Autism Dev Disord. 2011;41:1686–1693. doi: 10.1007/s10803-011-1197-x. [DOI] [PMC free article] [PubMed] [Google Scholar]
- Power JD, Cohen AL, Nelson SM, Wig GS, Barnes KA, Church JA, Vogel AC, Laumann TO, Miezin FM, Schlaggar BL, et al. Functional network organization of the human brain. Neuron. 2011;72:665–678. doi: 10.1016/j.neuron.2011.09.006. [DOI] [PMC free article] [PubMed] [Google Scholar]
- Pruett JR, Jr, Hoertel S, Constantino JN, Moll AL, McVey K, Squire E, Feczko E, Povinelli DJ, Petersen SE. Impaired eye region search accuracy in children with autistic spectrum disorders. PloS One. 2013;8:e58167. doi: 10.1371/journal.pone.0058167. [DOI] [PMC free article] [PubMed] [Google Scholar]
- Pruett JR, Jr, LaMacchia A, Hoertel S, Squire E, McVey K, Todd RD, Constantino JN, Petersen SE. Social and non-social cueing of visuospatial attention in autism and typical development. J Autism Dev Disord. 2011;41:715–731. doi: 10.1007/s10803-010-1090-z. [DOI] [PMC free article] [PubMed] [Google Scholar]
- Risch N, Spiker D, Lotspeich L, Nouri N, Hinds D, Hallmayer J, Kalaydjieva L, McCague P, Dimiceli S, Pitts T, et al. A genomic screen of autism: evidence for a multilocus etiology. Am J Hum Genet. 1999;65:493–507. doi: 10.1086/302497. [DOI] [PMC free article] [PubMed] [Google Scholar]
- Sebat J, Lakshmi B, Malhotra D, Troge J, Lese-Martin C, Walsh T, Yamrom B, Yoon S, Krasnitz A, Kendall J, et al. Strong association of de novo copy number mutations with autism. Science. 2007;316:445–449. doi: 10.1126/science.1138659. [DOI] [PMC free article] [PubMed] [Google Scholar]
- Senju A, Kikuchi Y, Hasegawa T, Tojo Y, Osanai H. Is anyone looking at me? Direct gaze detection in children with and without autism. Brain Cogn. 2008;67:127–139. doi: 10.1016/j.bandc.2007.12.001. [DOI] [PubMed] [Google Scholar]
- Shokouhi M, Williams JH, Waiter GD, Condon B. Changes in the sulcal size associated with autism spectrum disorder revealed by sulcal morphometry. Autism Res. 2012;5:245–252. doi: 10.1002/aur.1232. [DOI] [PubMed] [Google Scholar]
- Smith SM, Nichols TE. Threshold-free cluster enhancement: addressing problems of smoothing, threshold dependence and localisation in cluster inference. NeuroImage. 2009;44:83–98. doi: 10.1016/j.neuroimage.2008.03.061. [DOI] [PubMed] [Google Scholar]
- Stigler KA, McDonald BC, Anand A, Saykin AJ, McDougle CJ. Structural and functional magnetic resonance imaging of autism spectrum disorders. Brain Res. 2011;1380:146–161. doi: 10.1016/j.brainres.2010.11.076. [DOI] [PMC free article] [PubMed] [Google Scholar]
- Van Essen DC. A population-average, landmark- and surface-based (PALS) atlas of human cerebral cortex. NeuroImage. 2005;28:635–662. doi: 10.1016/j.neuroimage.2005.06.058. [DOI] [PubMed] [Google Scholar]
- Van Essen DC, Dierker D, Snyder A, Raichle ME, Reiss A, Korenberg J. Symmetry of cortical folding abnormalities in Williams syndrome revealed by surface-based analyses. J Neurosci. 2006;26:5470–5483. doi: 10.1523/JNEUROSCI.4154-05.2006. [DOI] [PMC free article] [PubMed] [Google Scholar]
- Van Essen DC, Glasser MF, Dierker DL, Harwell J, Coalson T. Parcellations and hemispheric asymmetries of human cerebral cortex analyzed on surface-based atlases. Cereb Cortex. 2012;22:2241–2262. doi: 10.1093/cercor/bhr291. [DOI] [PMC free article] [PubMed] [Google Scholar]
- Van Essen DC, Smith S, Barch D, Behrens TEJ, Yacoub E, Ugurbil K. The WU-Minn human connectome project: an overview. Neuroimage. 2013;62:1299–1310. doi: 10.1016/j.neuroimage.2013.05.041. [Epub ahead of print] [DOI] [PMC free article] [PubMed] [Google Scholar]
- Verhoeven JS, De Cock P, Lagae L, Sunaert S. Neuroimaging of autism. Neuroradiology. 2010;52:3–14. doi: 10.1007/s00234-009-0583-y. [DOI] [PubMed] [Google Scholar]
- Virkud YV, Todd RD, Abbacchi AM, Zhang Y, Constantino JN. Familial aggregation of quantitative autistic traits in multiplex versus simplex autism. Am J Med Genet B Neuropsychiatr Genet. 2009;150B:328–334. doi: 10.1002/ajmg.b.30810. [DOI] [PMC free article] [PubMed] [Google Scholar]
- Wang AT, Lee SS, Sigman M, Dapretto M. Neural basis of irony comprehension in children with autism: the role of prosody and context. Brain. 2006;129:932–943. doi: 10.1093/brain/awl032. [DOI] [PMC free article] [PubMed] [Google Scholar]
- Wechsler D. Wechsler Abbreviated Scale of Intelligence. WASI. San Antonio, TX: Harcourt Assessment; 1999. [Google Scholar]
- Wechsler D. Wechsler Intelligence Scale for Children. San Antonio, TX: The Psychological Corporation; 2003. [Google Scholar]
- Weiss LA, Shen Y, Korn JM, Arking DE, Miller DT, Fossdal R, Saemundsen E, Stefansson H, Ferreira M, Green T, et al. the Autism Consortium. Association between microdeletion and microduplication at 16p11.2 and autism. N Engl J Med. 2008;358:667–675. doi: 10.1056/NEJMoa075974. [DOI] [PubMed] [Google Scholar]
- Williams DL, Minshew NJ. Understanding autism and related disorders: what has imaging taught us? Neuroimaging Clin N Am. 2007;17:495–509. doi: 10.1016/j.nic.2007.07.007. ix. [DOI] [PMC free article] [PubMed] [Google Scholar]
- Wolff JJ, Gu H, Gerig G, Elison JT, Styner M, Gouttard S, Botteron KN, Dager SR, Dawson G, Estes AM, et al. Differences in white matter fiber tract development present from 6 to 24 months in infants with autism. Am J Psychiatry. 2012;169:589–600. doi: 10.1176/appi.ajp.2011.11091447. [DOI] [PMC free article] [PubMed] [Google Scholar]
- Yeo BT, Krienen FM, Sepulcre J, Sabuncu MR, Lashkari D, Hollinshead M, Roffman JL, Smoller JW, Zollei L, Polimeni JR, et al. The organization of the human cerebral cortex estimated by intrinsic functional connectivity. J Neurophysiol. 2011;106:1125–1165. doi: 10.1152/jn.00338.2011. [DOI] [PMC free article] [PubMed] [Google Scholar]
- Yu P, Grant PE, Qi Y, Han X, Segonne F, Pienaar R, Busa E, Pacheco J, Makris N, Buckner RL, et al. Cortical surface shape analysis based on spherical wavelets. IEEE Trans Med Imaging. 2007;26:582–597. doi: 10.1109/TMI.2007.892499. [DOI] [PMC free article] [PubMed] [Google Scholar]
Associated Data
This section collects any data citations, data availability statements, or supplementary materials included in this article.