Abstract
Rationale and Objectives
Magnetic resonance imaging (MRI) studies reveal that the atrophy of the corpus callosum (CC) is involved in early Alzheimer’s disease (AD). This study investigates when and how the callosal change occur in the early course of AD.
Materials and Methods
High-resolution structural MRI were obtained from 196 old people, subjects were characterized using the Clinical Dementia Rating (CDR), 98 healthy controls were nondemented (CDR 0), 70 patients had a clinical diagnosis of AD in very mild (CDR 0.5) and 28 patients in mild (CDR 1) dementia stage. A semi-automatic segmentation method was used to extract the CC on the midsagittal plane (MSP). We measured the total and regional areas of CC.
Results
Results indicate that the callosal atrophy occurs in the subjects when their CDR is 0.5. The area of genu and rostral body of CC of the healthy controls (CDR 0) is significantly different from that of the subjects with very mild dementia (CDR 0.5) (p< .05). The significant difference can also be found in the area of rostral and midbody of CC between the subjects with very mild dementia (CDR 0.5) and those with mild dementia (CDR 1) (p< .05).
Conclusion
The callosal atrophy can be detected in the subjects when their CDR is 0.5. The change of CC in the early stage of AD indicates an anterior-to-posterior atrophic process when the degree of dementia increases (CDR 0→0.5→1).
Keywords: corpus callusum, magnetic resonance imaging, atrophy
Introduction
Alzheimer’s disease (AD) has been described as an irreversible, neurodegenerative brain disease and generally affects gray matter. Nevertheless, several researchers have revealed that AD is also associated with white matter pathology (1, 2). The corpus callosum (CC) as the largest interconnecting white matter tract in the brain may be affected by AD inevitably. Since CC is responsible for most of communication between two cerebral hemispheres, it is important to understand how AD affects the CC.
Up to now, many studies (3–12) have reported a significant atrophy of CC in the process of AD. Most of these studies include AD patients in different dementia stages from mild to severe dementia. In general, the investigators classify these heterogeneous patients as an AD group in advance. In comparison with the normal controls, they analyze the change of the CC with different methods, such as the region of interest (ROI) (4, 6–14), voxel-based morphometry (VBM) and diffuse tensor imaging (DTI) (3, 10, 12, 13, 15, 16). With respect to callosal change based on MRI, most researchers have focused on subjects with mild congnitive impairment (MCI), which is a transitional stage between normal cognitive function and AD. Controversial results have been reported in ROI studies of the CC in subjects with MCI. Wang and Su (16) found no callosal change between MCI patients and healthy controls. Yet, Wang et al. (12) detected atrophy in the posterior subregions. While Thomann et al. (10) reported a reduction in anterior subregions of the CC in a group of MCI patients. A survey of these works can be found in (17), which revealed that changes in the anterior and the posterior portions of the CC might already be present in the early stage of AD. Though much attention has been paid to the heterogeneous AD groups, there are few works on the homogeneous AD groups (e.g., patients suffering from mild or moderate AD).
The homogeneous AD groups can be subdivided in terms of Clinical Dementia Rating (CDR) (18), which is a numeric scale used to quantify the severity of the symptoms of dementia. CDR 0 indicates no dementia, and CDR 0.5, 1, 2, and 3 represent very mild, mild, moderate, and severe dementia, respectively. To our knowledge, there is no report that investigate callosal change based on CDR scale, especially for CDR=0.5 (very mild dementia) and CDR=1 (mild dementia). People in these two stages are more likely to develop to severe dementia. In this paper, we will investigate the callosal change in these two stages to find 1) when the callosal atrophy can be detected; 2) how the CC changes
Materials and methods
Subjects and imaging data
Data used in this study was obtained from the Open Access Series of Imaging Studies (OASIS) database (www.oasis-brains.org). The OASIS provides MRI data sets of the brain to the scientific community freely. CDR scale incorporating multiple cognitive and functional domains was used to quantify the dementia severity for participants. CDR 0 indicated no dementia, while CDR 0.5 and 1 represented very mild and mild dementia, respectively. For each subject, T1-weighted magnetization prepared rapid gradient-echo (MP-RAGE) images were acquired using 1.5-T vision scanner (Simens, Erlangen, Germeny) with repetition time (TR)= 9.7 msec, echo time (TE)= 4 msec, flip angle (FA)= 10, inversion time (TI)= 20 msec, delay time (TD)= 200 msec, 256×256 (1×1 mm) resolution. Detailed selection and characteristics of the participants have been described in (19).
Due to the patients suffering from the dementia over 60 years old, we selected healthy controls older than 60 years to match the case group. All subjects were divided into three groups: very mild dementia (CDR 0.5, n=70), mild dementia (CDR 1, n=28), and healthy controls (CDR 0, n=98), respectively.
Measurement of corpus callosum atrophy
1. Semi-automatic segmentation of the CC
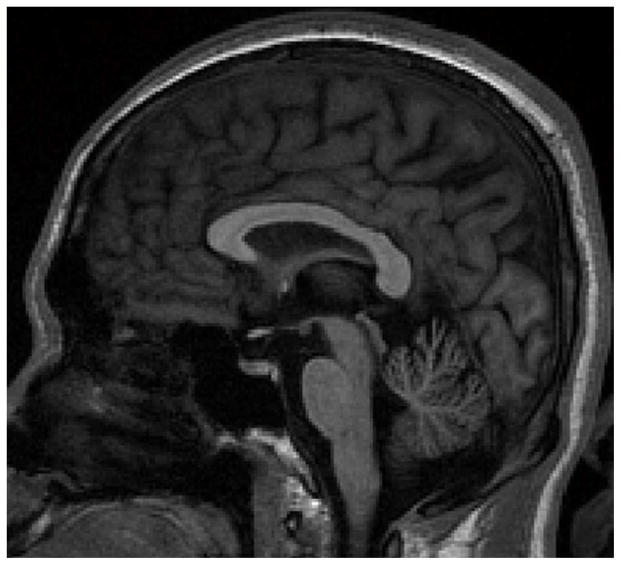
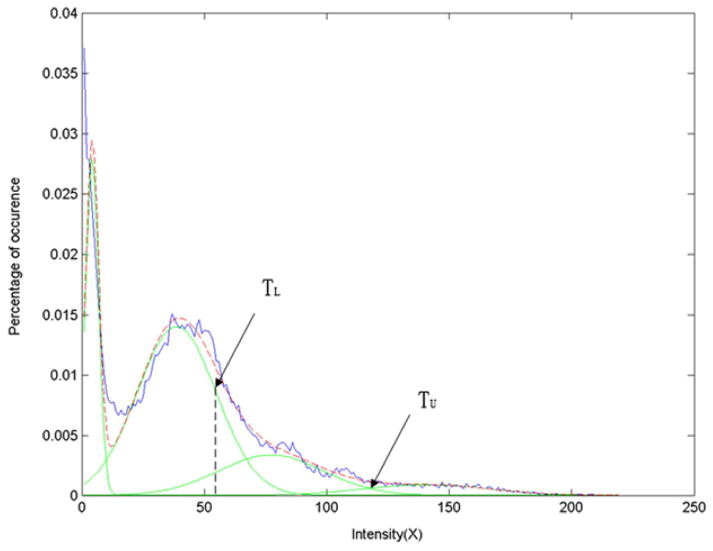
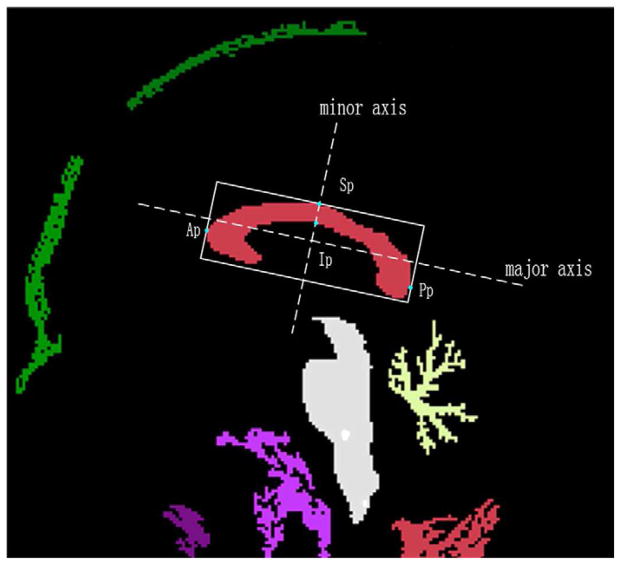
The CC on the midsagittal plane was segmented using a semi-automatic method with the software NASP (20). Firstly, the midsagittal plane was extracted from the MR volume using the method proposed by Hu et al (21) (Fig. 1). Assume that the intensity distribution in the CC is approximately Gaussian, we determined the upper and lower thresholds (denoted by TU and TL) of the CC using Gaussian Mixture Model (GMM) (22) (Fig. 2). Then, a binary image containing several regions (include the CC) was obtained with dual threshold segmentation (Fig. 3). Then, the boundary rectangle and its major and minor axes of each region were calculated using the method proposed by Chaudhuri and Samal (23). We also calculated other geometric measurements, i.e., the length along the major axis, the width along the minor axis, the angle between major axis and the horizontal axis, and the area. The region of the CC was selected according to its anatomic characteristic: (1) Length (from the anterior point (Ap) to posterior point (Pp)) of 7 to 9 cm; (2) Width (from the superior point (Sp) to the inferior point (Ip), Fig. 3) of 2 to 4 cm; (3) Orientation (an angle of the major axis with respect to the horizontal axis) from 5° to 40°; (4) Area greater than 2 cm2.
Fig. 1.
MR image on the midsagittal plane extracted from the MR volume.
Fig. 2.
Estimation of the thresholds of the CC using Gaussian Mixture Model.
Fig. 3.
ROI of the CC obtained with dual thresholds segmentation.
Due to the existence of the noise in MR images and variability of the anatomy, mis- or over-segmentation may take place in some MR volumes. These flaws were amended by two raters mutually and manually using the NASP, which also provides the function of manual delineation.
2. Division of the subregions of the CC
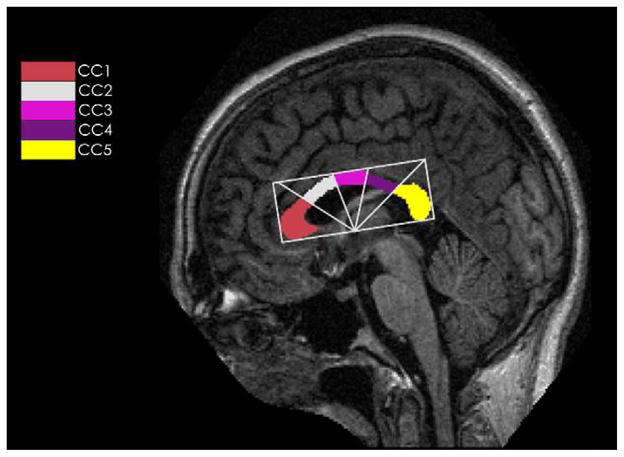
The CC was automatically divided into five subregions according to a modification of the Witelson Partitioning (WP) scheme (24, 25). Radial dividers emanated from the midpoint on the lower side of the bounding rectangle with equal angular interval, and the CC was subdivided into the rostrum and gene (CC1), rostral body (CC2), midbody (CC3), isthmus (CC4) and spnium CC5, respectively (see Fig. 4). The total CC area (TCA) and each subregion area were calculated by multiplying the number of pixels and the pixel size automatically.
Fig. 4.
A diagram of modified Witelson radial partitioning scheme. CC1: rostrum and genu, CC2: rostral body, CC3: midbody, CC4: isthmus, CC5: splenium.
Statistical analysis
Data distributions were assessed and descriptive statistics were computed. Differences in the total corpus callosum within groups were assessed with the analyses of covariance (ANCOVA), while three-way repeated measures ANCOVA were performed to assess the subregions differences within three groups. Head size, as estimated by total intracranial volume (eTIV), was used as a covariate in the analyses. Univariate orthogonal contrasts were further examined using post hoc pairwise comparisons to test for differences in subregions between groups. All the statistical computations were performed using SPSS (Release 13.0, The LEAD Technologies Inc., Chicago, Illinois, USA).
Results
Inter- and intraobserver variability
To evaluate the intra- and interobserver agreements of measurements, two experts were asked to segment the CC in MR scans of 40 subjects with NASP. Each expert segmented the CC only two times within 2 weeks to avoid previous bias. Pearson correlation coefficient for the total and subregions area of CC were very high, correlation ranged from 0.931 (p< .001) to 0.954 (p< .001). For repeated segmenting of CC by one observer, the measurements were highly reproducible, with correlations between 0.956 (p< .001) and 0.989 (p< .001). Obviously, the inter- and intraobserver variation of our method is low.
Comparison of groups descriptives
The basic descriptives were analyzed in Table 1. No difference was found among three groups in age or with respect to education (p> .05), the sex ratio presented significant difference between controls (CDR 0) and participants (CDR 0.5) (p< .05). Pairwise comparisons were performed and the results indicated that mini mental state examination (MMSE) score was significantly different among three groups (p< .05), as expected. There was no group difference in eTIV (p> .05).
Table 1.
Means and standard deviation of descriptive variables for each group
| Characteristics | Healthy control | Very mild dementia | Mild dementia |
|---|---|---|---|
| Number | 98 | 70 | 28 |
| Age (years) | 75.9 (9.0) | 76.2 (7.0) | 77.8 (7.0) |
| Sex (Male/Female) | 26/72 | 31/39 * | 9/19 |
| Education (years) | 14.5 (2.9) | 13.8 (3.2) | 12.9 (3.2) |
| MMSE score | 29.0 (1.2) | 25.6 (3.2) * | 21.7 (3.8) ** |
| eTIV (cm3) | 1438.9 (150.2) | 1485.4 (186.6) | 1481.6 (120.8) |
MMSE: mini mental state examination
eTIV: estimated total intracranial volume
Very mild dementia group is different from Healthy control group, p< .05.
Mild dementia group is different from Very mild dementia group, p< .05.
TCA and subregions differences
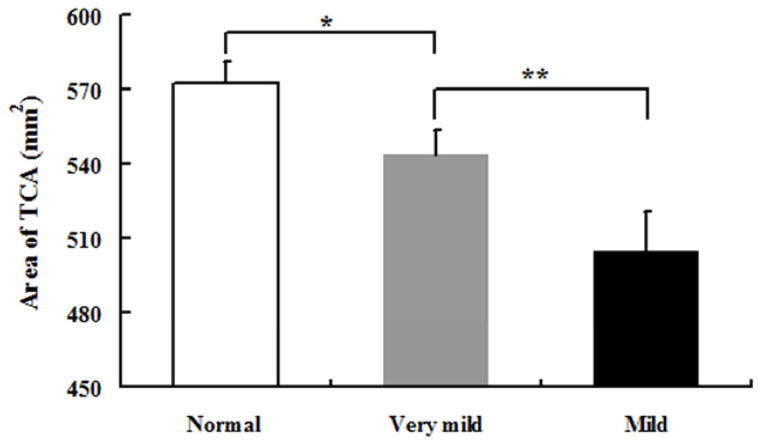
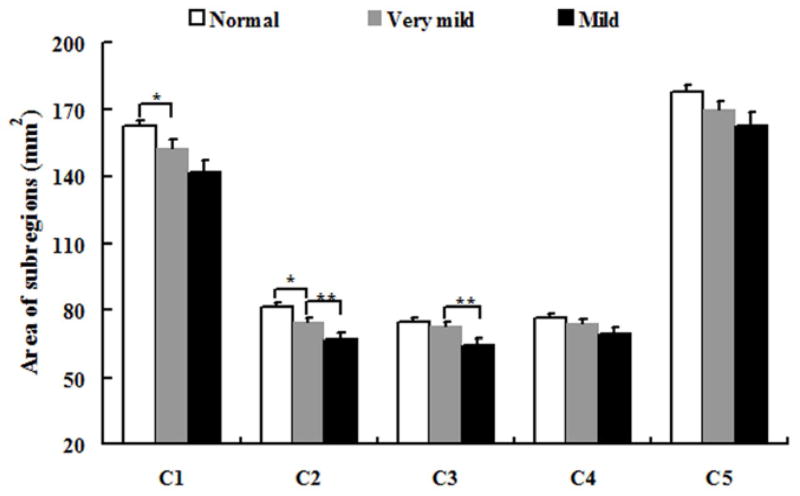
The area of total CC and its subregions were presented in Table 2. A trend of total CC area atrophy presented when CDR varied from 0 to 1 (p< .05) (see Fig. 5), and even can be found when CDR is 0.5. When the group with CDR 0.5 was compared with healthy control (CDR 0) group, we observed a significantly atrophy in CC1 and CC2 (p< .05) (see Fig. 6). When we compared the group (CDR 1) with the group (CDR 0.5), statistically significant differences of callosal subregions reduction were found in CC2 and CC3 (p< .05) (see Fig. 6).
Table 2.
Cross-sectional areas of corpus callosum and its subregions
| Region | Healthy control (n=98) | Very mild dementia (n=70) | Mild dementia (n=28) |
|---|---|---|---|
| TCA | 572.86 (8.51) | 543.89 (10.06) * | 504.71 (15.87) ** |
| CC1 | 162.43 (2.97) | 152.75 (3.51) * | 141.87 (5.54) |
| CC2 | 81.50 (1.54) | 74.59 (1.82) * | 66.84 (2.87) ** |
| CC3 | 74.84 (1.57) | 72.87 (1.86) | 64.65 (2.95) ** |
| CC4 | 76.45 (1.82) | 73.82 (2.15) | 68.89 (3.39) |
| CC5 | 177.65 (3.10) | 169.85 (3.67) | 162.46 (5.78) |
Values represent mean (standard deviation) (mm2). TCA: Total corpus callosum area.
Very mild dementia group is different from Healthy control group, p< .05.
Mild dementia group is different from Very mild dementia group, p< .05.
Fig. 5.
Mean and standard deviation of the TCA in three groups. Abbreviations and symbol (* and **) as in Table 1 and 2.
Fig. 6.
Mean and standard deviation of the area of subregions (from CC1 to CC5) in three groups. Symbol (* and **) as in Table 1 and 2.
Discussion
The CC is the major commissure connecting symmetrical cortical regions of two cerebral hemispheres. AD is a progressive, neurodegenerative disorder associated with impairments in memory, language, and cognition (26). Multiple studies have documented that the callosal atrophy is involved in the patients with AD. Before meeting the criteria of AD, the patients often experience two stages, i.e., very mild (CDR 0.5) and mild dementia (CDR 1). It is necessary to investigate the relation between the callosal change and the early stage of AD.
In this paper, we performed a cross-sectional study to investigate when and where the callosal atrophy occurs along the early course of AD (CDR 0→0.5→1). We compared the callosal subregions of the three groups (with CDR 0, 0.5 and 1, respectively). The results shows that the callosal subregions atrophy is found in CC1 and CC2 when group (CDR 0.5) vs group (CDR 0) while in CC2 and CC3 when group (CDR 1) vs group (CDR 0.5). The results confirm the existence of anterior-to-posterior (CC1→CC2→CC3) callosal atrophy with the degree of dementia increases in the early stage of AD (CDR 0→0.5→1). This finding also complements the myelin breakdown hypothesis (27). According to this hypothesis, the small-diameter late-myelinating fibers are more susceptible to myelin breakdown and affected by neurodegeneration more easily (28, 29). Note that the density of the myelinate fibers decreases from the rostrum and genu to the midbody of CC (CC1→CC2→CC3), and the diameter of the fibers increases accordingly (30, 31). Such a topographical organization of CC are likely responsible for the specific pattern of anterior-to-posterior callosal atrophy in the early stage of AD.
Previous studies reported that the callosal atrophy is predominantly restricted to the anterior part of corpus callosum in MCI and AD (3, 14). The anterior part of CC contains the fibers connecting prefrontal gyrus (32). Thomman also found the frontal atrophic process in patients with MCI and AD (10). However, recent studies demonstrated there were no significant correlations between the gray matter density and the anterior subregions of CC (13, 17). Therefore, the Wallerian degeneration hypothesis as a consequence of the death of projecting pyramidal cells in the neocortex may not account for the anterior atrophy of CC, but might be responsible for the posterior region atrophy of CC in the mild AD patients (3–6, 8, 11), the anterior atrophy of CC is supposed to be explained by myelin breakdown hypothesis.
There are several advantages over in our study. (1) Traditional ROI analysis is time consuming and operator-dependent, since the raters had to draw the boundary of ROI manually. In this paper, we adopted an automatic segmentation method plus operator’s compensation to improve the accuracy and the reproducibility. (2) The subjects concerned in this paper are more than those in the previous studies. Therefore, the discrepancies in the findings can be reduced. (3) Allowing for the factor of age, we selected all controls with age more than sixty to match the patients in early stage of AD. All of these contributions make the result more credible.
Due to lack of MR images of the patients with moderate (CDR 2) and severe dementia (CDR 3), the callosal change in the later stage of AD can not be investigated. In the future, more data should be obtained for the follow-up investigation to clarify how CC changes in the whole process of AD.
In conclusion, we investigated the callosal atrophy based on MRI in the early course of AD. The methods and the tool used in this work make the analysis more credible. Compared to healthy controls, the callosal atrophy of the subjects with CDR 0.5 presents in the anterior subregions. We complemented the myelin breakdown hypothesis and concluded that the anterior-to-posterior callosal atrophy (CC1→CC2→CC3) occurs as the degree of dementia increases (CDR 0→0.5→1). This work contributes to better understanding the development of callosal topography in the process of AD.
Acknowledgments
Grants: This work was supported by National Natural Science Foundation of China (81071215, 81171304 and 81071219), and Science Foundation of Heilongjiang Province (D201062). Additional support was provided by NIH grants P50 AG05681, P01 AG03991, R01 AG021910, P50 MH071616, U24 RR021382, R01 MH56584.
Footnotes
Publisher's Disclaimer: This is a PDF file of an unedited manuscript that has been accepted for publication. As a service to our customers we are providing this early version of the manuscript. The manuscript will undergo copyediting, typesetting, and review of the resulting proof before it is published in its final citable form. Please note that during the production process errors may be discovered which could affect the content, and all legal disclaimers that apply to the journal pertain.
References
- 1.Bronge L, Bogdanovic N, Wahlund LO. Postmortem MRI and histopathology of white matter changes in Alzheimer brains. A quantitative, comparative study. Dement Geriatr Cogn Disord. 2002;13:205–212. doi: 10.1159/000057698. [DOI] [PubMed] [Google Scholar]
- 2.Hua X, Leow AD, Lee S, et al. 3D characterization of brain atrophy in Alzheimer’s disease and mild cognitive impairment using tensor-based morphometry. Neuroimage. 2008;41:19–34. doi: 10.1016/j.neuroimage.2008.02.010. [DOI] [PMC free article] [PubMed] [Google Scholar]
- 3.Chaim TM, Duran FL, Uchida RR, et al. Volumetric reduction of the corpus callosum in Alzheimer’s disease in vivo as assessed with voxel-based morphometry. Psychiatry Res. 2007;154:59–68. doi: 10.1016/j.pscychresns.2006.04.003. [DOI] [PubMed] [Google Scholar]
- 4.Hampel H, Teipel SJ, Alexander GE, et al. Corpus callosum atrophy is a possible indicator of region- and cell type-specific neuronal degeneration in Alzheimer disease: a magnetic resonance imaging analysis. Arch Neurol. 1998;55:193–198. doi: 10.1001/archneur.55.2.193. [DOI] [PubMed] [Google Scholar]
- 5.Hampel H, Teipel SJ, Alexander GE, et al. In vivo imaging of region and cell type specific neocortical neurodegeneration in Alzheimer’s disease. Perspectives of MRI derived corpus callosum measurement for mapping disease progression and effects of therapy. Evidence from studies with MRI, EEG and PET. J Neural Transm. 2002;109:837–855. doi: 10.1007/s007020200069. [DOI] [PubMed] [Google Scholar]
- 6.Teipel SJ, Bayer W, Alexander GE, et al. Regional pattern of hippocampus and corpus callosum atrophy in Alzheimer’s disease in relation to dementia severity: evidence for early neocortical degeneration. Neurobiol Aging. 2003;24:85–94. doi: 10.1016/s0197-4580(02)00044-1. [DOI] [PubMed] [Google Scholar]
- 7.Teipel SJ, Bayer W, Alexander GE, et al. Progression of corpus callosum atrophy in Alzheimer disease. Arch Neurol. 2002;59:243–248. doi: 10.1001/archneur.59.2.243. [DOI] [PubMed] [Google Scholar]
- 8.Teipel SJ, Hampel H, Alexander GE, et al. Dissociation between corpus callosum atrophy and white matter pathology in Alzheimer’s disease. Neurology. 1998;51:1381–1385. doi: 10.1212/wnl.51.5.1381. [DOI] [PubMed] [Google Scholar]
- 9.Teipel SJ, Hampel H, Pietrini P, et al. Region-specific corpus callosum atrophy correlates with the regional pattern of cortical glucose metabolism in Alzheimer disease. Arch Neurol. 1999;56:467–473. doi: 10.1001/archneur.56.4.467. [DOI] [PubMed] [Google Scholar]
- 10.Thomann PA, Wustenberg T, Pantel J, et al. Structural changes of the corpus callosum in mild cognitive impairment and Alzheimer’s disease. Dement Geriatr Cogn Disord. 2006;21:215–220. doi: 10.1159/000090971. [DOI] [PubMed] [Google Scholar]
- 11.Tomaiuolo F, Scapin M, Di Paola M, et al. Gross anatomy of the corpus callosum in Alzheimer’s disease: regions of degeneration and their neuropsychological correlates. Dement Geriatr Cogn Disord. 2007;23:96–103. doi: 10.1159/000097371. [DOI] [PubMed] [Google Scholar]
- 12.Wang PJ, Saykin AJ, Flashman LA, et al. Regionally specific atrophy of the corpus callosum in AD, MCI and cognitive complaints. Neurobiol Aging. 2006;27:1613–1617. doi: 10.1016/j.neurobiolaging.2005.09.035. [DOI] [PMC free article] [PubMed] [Google Scholar]
- 13.Di Paola M, Luders E, Di Iulio F, et al. Callosal atrophy in mild cognitive impairment and Alzheimer’s disease: different effects in different stages. Neuroimage. 2010;49:141–149. doi: 10.1016/j.neuroimage.2009.07.050. [DOI] [PMC free article] [PubMed] [Google Scholar]
- 14.Hallam BJ, Brown WS, Ross C, et al. Regional atrophy of the corpus callosum in dementia. J Int Neuropsychol Soc. 2008;14:414–423. doi: 10.1017/S1355617708080533. [DOI] [PubMed] [Google Scholar]
- 15.Di Paola M, Di Iulio F, Cherubini A, et al. When, where, and how the corpus callosum changes in MCI and AD: a multimodal MRI study. Neurology. 2010;74:1136–1142. doi: 10.1212/WNL.0b013e3181d7d8cb. [DOI] [PubMed] [Google Scholar]
- 16.Wang H, Su MY. Regional pattern of increased water diffusivity in hippocampus and corpus callosum in mild cognitive impairment. Dement Geriatr Cogn Disord. 2006;22:223–229. doi: 10.1159/000094934. [DOI] [PubMed] [Google Scholar]
- 17.Di Paola M, Spalletta G, Caltagirone C. In vivo structural neuroanatomy of corpus callosum in Alzheimer’s disease and mild cognitive impairment using different MRI techniques: a review. J Alzheimers Dis. 2010;20:67–95. doi: 10.3233/JAD-2010-1370. [DOI] [PubMed] [Google Scholar]
- 18.Morris JC. The Clinical Dementia Rating (CDR): current version and scoring rules. Neurology. 1993;43:2412–2414. doi: 10.1212/wnl.43.11.2412-a. [DOI] [PubMed] [Google Scholar]
- 19.Marcus DS, Wang TH, Parker J, et al. Open Access Series of Imaging Studies (OASIS): cross-sectional MRI data in young, middle aged, nondemented, and demented older adults. J Cogn Neurosci. 2007;19:1498–1507. doi: 10.1162/jocn.2007.19.9.1498. [DOI] [PubMed] [Google Scholar]
- 20.Fu Y, Gao W, Zhu M, et al. Computer-assisted automatic localization of the human pedunculopontine nucleus in T1-weighted MR images: a preliminary study. Int J Med Robot. 2009;5:309–318. doi: 10.1002/rcs.262. [DOI] [PubMed] [Google Scholar]
- 21.Hu Q, Nowinski WL. A rapid algorithm for robust and automatic extraction of the midsagittal plane of the human cerebrum from neuroimages based on local symmetry and outlier removal. Neuroimage. 2003;20:2153–2165. doi: 10.1016/j.neuroimage.2003.08.009. [DOI] [PubMed] [Google Scholar]
- 22.Dempster AP, Laird DM, Rubin DB. Maximum likelihood from incomplete data via the EM algorithm. Journal of the Royal Statistical Society. 1977;39:1–38. [Google Scholar]
- 23.Chaudhuri D, Samal A. A simple method for fitting of bounding rectangle to closed regions. Pattern Recognition. 2007;40:1981–1989. [Google Scholar]
- 24.Ryberg C, Rostrup E, Stegmann MB, et al. Clinical significance of corpus callosum atrophy in a mixed elderly population. Neurobiol Aging. 2007;28:955–963. doi: 10.1016/j.neurobiolaging.2006.04.008. [DOI] [PubMed] [Google Scholar]
- 25.Witelson SF. Hand and sex differences in the isthmus and genu of the human corpus callosum. A postmortem morphological study. Brain. 1989;112 (Pt 3):799–835. doi: 10.1093/brain/112.3.799. [DOI] [PubMed] [Google Scholar]
- 26.Cummings JL, Cole G. Alzheimer disease. JAMA. 2002;287:2335–2338. doi: 10.1001/jama.287.18.2335. [DOI] [PubMed] [Google Scholar]
- 27.Bartzokis G. Age-related myelin breakdown: a developmental model of cognitive decline and Alzheimer’s disease. Neurobiol Aging. 2004;25:5–18. doi: 10.1016/j.neurobiolaging.2003.03.001. author reply 49–62. [DOI] [PubMed] [Google Scholar]
- 28.Braak H, Del Tredici K, Schultz C, et al. Vulnerability of select neuronal types to Alzheimer’s disease. Ann N Y Acad Sci. 2000;924:53–61. doi: 10.1111/j.1749-6632.2000.tb05560.x. [DOI] [PubMed] [Google Scholar]
- 29.Tang Y, Nyengaard JR, Pakkenberg B, et al. Age-induced white matter changes in the human brain: a stereological investigation. Neurobiol Aging. 1997;18:609–615. doi: 10.1016/s0197-4580(97)00155-3. [DOI] [PubMed] [Google Scholar]
- 30.Aboitiz F, Montiel J. One hundred million years of interhemispheric communication: the history of the corpus callosum. Braz J Med Biol Res. 2003;36:409–420. doi: 10.1590/s0100-879x2003000400002. [DOI] [PubMed] [Google Scholar]
- 31.Aboitiz F, Rodriguez E, Olivares R, et al. Age-related changes in fibre composition of the human corpus callosum: sex differences. Neuroreport. 1996;7:1761–1764. doi: 10.1097/00001756-199607290-00013. [DOI] [PubMed] [Google Scholar]
- 32.Hofer S, Frahm J. Topography of the human corpus callosum revisited--comprehensive fiber tractography using diffusion tensor magnetic resonance imaging. Neuroimage. 2006;32:989–994. doi: 10.1016/j.neuroimage.2006.05.044. [DOI] [PubMed] [Google Scholar]


