

Abstract
Primary brain tumors are presently classified based on imaging and histopathological techniques, which remains unsatisfaying. We profiled here by quantitative real time PCR (qRT-PCR) the transcripts of eighteen histone deacetylases (HDACs) and a subset of transcriptional co-factors in non-tumoral brain samples from 15 patients operated for epilepsia and in brain tumor samples from 50 patients diagnosed with grade II oligodendrogliomas (ODII, n = 9), grade III oligodendrogliomas (ODIII, n = 22) and glioblastomas (GL, n = 19). Co-factor transcripts were significantly different in tumors as compared to non-tumoral samples and distinguished different molecular subgroups of brain tumors, regardless of tumor grade. Among all patients studied, the expression of HDAC1 and HDAC3 was inversely correlated with survival, whereas the expression of HDAC4, HDAC5, HDAC6, HDAC11 and SIRT1 was significantly and positively correlated with survival time of patients with gliomas. 1H-HRMAS technology revealed metabolomically distinct groups according to the expression of HDAC1, HDAC4 and SIRT1, suggesting that these genes may play an important role in regulating brain tumorigenesis and cancer progression. Our study hence identified different molecular fingerprints for subgroups of histopathologically similar brain tumors that may enable the prediction of outcome based on the expression level of co-factor genes and could allow customization of treatment.
Primary brain tumors are notoriously heterogenous. The overall mortality rate for some tumor subtypes, such as high-grade gliomas, remains high and only limited progress in survival has been achieved in the last decades1. Furthermore, the responsiveness of patients to therapeutic protocols varies with no clear predictive factor to determine treatment response. An in-depth dissection of the molecular basis of resistance to treatment and the identification of specific signaling pathways that are involved in tumor development and progression, are key in the search for a more targeted and effective therapies for brain tumors.
Perhaps equally important to the numerous genetic mutations, amplifications and deletions that accumulate in a given tumor are epigenetic modifications2. One of the best-characterized epigenetic modifications is the acetylation/deacetylation status of lysine residues in histones, which regulates gene transcription by controlling chromatin unfolding (activation) and condensation (silencing), respectively. These two opposing processes are regulated through histone acetyltransferases (HATs) and histone deacetylases (HDACs) (for review see Refs. 3,4,5), respectively. The HDAC family of lysine deacetylases are homologs of the yeast Rpd3/Hda1 deacetylases and contain 11 members termed HDAC1-11 that divide into 3 classes I, II and IV. Class III consists of the sirtuin family of HDACs represented by 7 members (SIRT1-7) sharing a 270 aminoacid catalytic domain and a mandatory metabolic co-factor, NAD+ (reviewed in Ref. 6).
Several HATs and HDACs have been implicated in tumorigenesis, and HDAC inhibitors (HDACi) effectively inhibit tumor growth and progression7,8 (a review). Class I and II HDACs are generally located in the nucleus and are overexpressed in various cancers9,10 (reviews)11,12,13,14,15. Furthermore, class II and IV HDACs were recently shown to be downregulated in glioblastomas16. A set of sirtuin genes, including SIRT1, SIRT3 and SIRT7, are overexpressed in certain cancers17 (a review). The role of SIRT1 in cancer is not fully understood and remains controversial. For instance, when SIRT1 was shown to suppress tumorigenesis in colon cancer growth through deacetylation of β-catenin18, SIRT1-knockdown significantly delayed mitotic entry of glioma cells, inhibited cell growth and proliferation, and promoted apoptosis19. In addition, SIRT1 knockdown sensitized glioma cells to radiation-induced apoptosis20. Recently, SIRT1 was suggested to mediate cell proliferation in gliomas through the connection with the forkhead box M121. In line with the latest cited studies, we have recently shown that specific intestinal loss of SIRT1 protects from colitis-associated colorectal cancer22. Finally, the expression of the « checkpoint » tubulin deacetylase SIRT2 was reported to be reduced in gliomas23,24 and was shown to be required for glioma stem cell proliferation arrest25.
Because of the genetic heterogeneity and the poor treatment responsiveness, a diagnostic approach that establishes the molecular signature for the tumor would be highly beneficial. To this end, we measured the expression of the 18 known HDAC genes and of 6 genes encoding transciptional co-factors in 50 samples representing 3 histopathologically identified gliomas, namely W.H.O. (World Health Organization) grade II oliodendrogliomas (ODII), grade III oliodendrogliomas (ODIII), grade IV glioblastoma (GL), and in 15 control brain samples from epilepsia-operated patients. Cluster analysis of the gene expression data enabled the identification of molecular subgroups of tumors that were undistinguishable by histopathological methods.
Results
Expression pattern of HDACs in brain tumors by qRT-PCR
To characterize the molecular fingerprint of brain tumors, we analyzed by qRT-PCR the expression profile of all HDACs (class I–IV) and six transcriptional co-factors in different brain tumor samples and control brain tissues. All HDACs were expressed in non-tumoral samples, and their expression was altered in many tumor types (Figure 1). For clarity, the levels of significance are presented separately in Table S2. The degree of increase in HDAC1 expression followed the grade of gliomas. HDAC1 levels were significantly increased in ODIII and grade IV gliomas, while the increase in ODII did not reach statistical significance. HDAC2 was increased only in ODIII (1.9-fold, p = 0.051). HDAC3 was significantly increased only in malignant ODIII and GL gliomas. HDAC4 was significantly increased in ODII and ODIII but the expression in glioblastoma was heterogenous among this class of patients and overall did not reach statistical significance (Figure 1 and Table S2). HDAC6 expression was significantly increased in all grades of gliomas, whereas HDAC7 and HDAC10 were significantly increased only in ODIII and GL tumors. HDAC8 and HDAC9 expression levels were not significantly changed in gliomas as compared to control patients. Among class I and II HDACs, HDAC5 was particular and its expression was significantly decreased in ODIII and GL tumors. Class IV HDAC11 seemed to follow a tumor grade gradient in its decrease. Hence, HDAC11 expression was significantly decreased in ODIII tumors and dramatically diminished in GL patients. The decrease in HDAC11 expression in ODII patients did not reach statistical significance. Regarding the sirtuin family of class III HDACs, SIRT1 expression was moderately but significantly increased in ODII and ODIII while it was modestly diminished in GL, yet this decrease was not statistically significant. SIRT2 expression was significantly decreased in most of GL patients with the exception of one patient who had an increased expression. SIRT2 expression was heterogeneous in ODII and ODIII gliomas, a subset of patients exhibiting a moderate increased expression, while most of them had decreased expression levels. SIRT3 expression was significantly decreased in the aggressive GL tumors but the decrease was not significant in grade II and III gliomas. SIRT4 and SIRT5 expression was decreased in most of the patients, but the decrease was not statistically significant due to an increased expression in few patients (Figure 1 and Figure 2). Conversely, SIRT6 expression was moderately and significantly increased in all gliomas. As for SIRT7, the modest increased expression in ODIII and GL tumors was not statistically significant. Regarding the metabolic co-activators PGC1α and PGC1β (encoded by the PPAGC1A and PPARGC1B genes, respectively), PPARGC1A expression was significantly increased in ODIII and GL tumors, whereas PPARGC1B expression was robustly decreased in all gliomas. In average, the decrease in PPARGC1B expression level followed a tumor gradient, grade IV tumors exhibiting the lowest expression. Among the co-repressors, only NCOR2/SMRT was significantly increased in ODIII tumors. The expression of the tumor suppressor gene RB1 was moderately increased in ODII tumors (p = 0.06) and significantly enhanced in grade III and IV gliomas (p < 0.01).
Figure 1. Quantitative expression of the 18 histone deacetylases (HDACs) and 6 metabolic cofactors in different human brain tumors as indicated.

The qRT-PCR data are presented as medians of the gene expression level normalized first to the 18S gene then to non-tumoral specimen (the median of controls was set to 1). The boxplots represent the expression rates ranging from the lowest to the highest value. Outlier values are also represented.
Figure 2.

(A) Unsupervised hierarchical clustering of HDAC and metabolic cofactor gene expression profiles in human brain tumor and non-tumoral (controls) samples. Subgroups identified by cluster analysis are highlighted by horizontal lines for genes and by vertical lines for brain tumor samples. Increased gene expression is represented by the red color and decreased expression in blue. The intensity of the color represents the degree of expression. The same clustering analysis was performed separately for ODII tumor samples (B), ODIII (C), ODII and ODIII together (D) and GL (E).
Cluster analysis of HDAC and NR co-factor expression profiles
Cluster analysis is suited to identify groups of genes that are co-regulated and potentially share functional commonalities. Illustrating this principle, cluster analysis distinguished three main groups of genes based on their expression levels in all tumor types, regardless of the HDAC classification. Of particular note, non-tumoral samples (CO) clustered together and were separated from the tumor samples (Figure 2A). Gene cluster I represents genes that were mostly down-regulated in a subgroup of gliomas (A2b), including HDAC11, PPARGC1B, HDAC9, HDAC5, SIRT3, SIRT5, NCOR1, HDAC8, SIRT4, and SIRT2. In subgroup B, two genes HDAC11 and PPARGC1B were down-regulated in all tumors, suggesting that these co-factors might regulate genes commonly induced in tumorigenesis (e.g. anti-apoptotic and proliferation genes, or genes involved in oxidative metabolism). Other cluster I genes showed heterogeneous expression among the gliomas belonging to this subgroup (Figure 2A). Gene cluster II represents genes that were mostly overexpressed in a subgroup of tumors (B) and include RB1, NCOR2, HDAC6, HDAC10, HDAC3, HDAC7 and HDAC1. In this cluster, HDAC1 was the only gene that was induced in almost all tumor samples, suggesting that HDAC1 play an important role in brain tumorigenesis (Figure 2A). The metabolic regulator PPARGC1A (subcluster IIa) was variably expressed among tumors. Some tumors displayed a robust overexpression of PPARGC1A while other samples showed a strong down-regulation or only a modest change in expression. In addition, two genes SIRT1 and HDAC4 that clustered together (in gene cluster IIa) were strongly overexpressed in two subgroups of tumors (B1a1 and B2) but significantly down-regulated in most of the samples of subgroup A2b.
Panels B to E in Figure 2 represent gene clusters in specific tumor types (ODII, ODIII, ODs and GL). One can appreciate that genes cluster differently in different tumor types that represent different tumor grades, suggesting different molecular signatures for each type or grade. Secondarily, some genes are overexpressed in a group of patients while down-regulated or unchanged in others within the same histopathologic entity, underscoring the molecular heterogeneity of tumors that are indistinguishable by histopathologic means. Finally, within OD tumors, we observed that ODII tumors do not necessarily form a distinguished cluster from ODIII tumors (Figure 2D).
In summary, HDAC and co-factors gene expression levels discriminate subgroups of patients that do not necessarily belong to the same histopathologic grade (e.g. some ODIII cluster with GL tumors, Figure 2A) and even within the same grade, molecular subgroups were identifiable, which challenges the histopathological classification and might explain why all glioma patients do not respond equally to the available therapeutic protocols.
Pearson correlation between the expression level of HDACs and cofactors among gliomas
We derived a heatmap from the gene-to-gene Pearson correlations for the 24 HDACs/cofactors within our qRT-PCR expression profiles in all gliomas, i.e. GL, ODII and ODIII together (Figure 3A). Among the positively co-correlated genes, HDAC1, HDAC3 and HDAC7 formed the clearest cluster. Other clusters with positively co-correlated genes contained PPARGC1B and HDAC11, both strongly down-regulated in gliomas (Figure 1), and HDAC2, HDAC9 and SIRT6. Yet another major positively co-correlated cluster was identified, containing two subclusters of SIRT1, HDAC8, SIRT3 and NCOR1 genes on one hand and HDAC6, HDAC4, NCOR2 and HDAC10 genes on the other. The strongest correlation within this cluster was that between SIRT1 and HDAC4 genes. We also identified clusters of genes that were negatively co-correlated among glioma patients. Hence, we identified HDAC3, HDAC7 and HDAC1 that were found to be robustly and negatively correlated with HDAC11, PPARGC1B, SIRT2 and SIRT4, with the exception of SIRT4 and HDAC1 that were not correlated. This was also the case, though to a lesser extent, for the negative correlations found between the members of the SIRT1, HDAC8 and SIRT3 cluster and the members of the HDAC1, HDAC7 and HDAC3 cluster (Figure 3A). We then analyzed the gene-to-gene correlations separately in the most aggressive gliomas. Amongst the ODIII samples, the strongest positive correlations were within cluster 1: SIRT1, HDAC4 and HDAC10; cluster 2: HDAC6 and SIRT3; cluster 3: NCOR1 and SIRT6; cluster 4: SIRT5, HDAC5 and HDAC8; and cluster 5: HDAC9, HDAC3, HDAC2 and HDAC1 (Figure 3B). For GL, the strongest positive correlations were within cluster 1: SIRT3, NCOR1, HDAC5 and PPARGC1A; cluster 2: HDAC6 and HDAC8; cluster 3: SIRT4 and SIRT7; and cluster 4: HDAC4, SIRT1, SIRT6 and HDAC2 (Figure 3C). Of particular note, also RB1, NCOR2 and HDAC9 were positively correlated indicating that these genes might interact and participate in the pathogenesis of glioblastoma.
Figure 3. Pairwise-Pearson correlation (PPC) analysis of HDACs and co-factors in glioma samples.
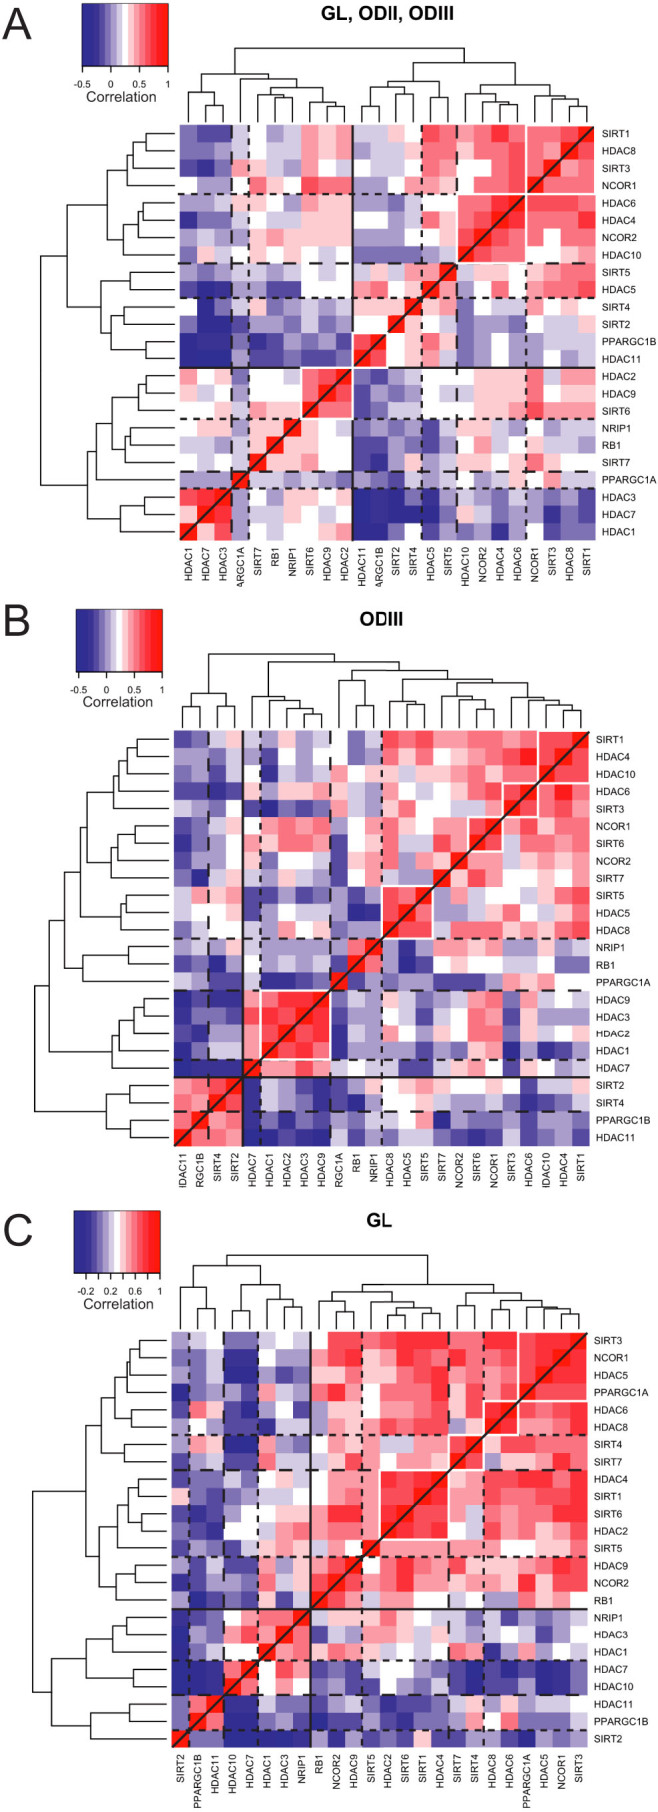
Unsupervised hierarchical clustering was carried out on pairwise Pearson gene-to-gene correlations using heatmap.2 from the R package gplots. Correlation coefficient equal to 1 represents the correlation of each gene to itself and is shown in red with the highest intensity. Negative correlations are shown in a light (poor correlation) to dark (strong correlation) blue color scale. The analysis was performed for all tumors together (GL, ODII and ODIII) (A), or separately for ODIII (B) and GL (C).
These gene-to-gene correlations among HDACs and cofactors might reveal transcriptional cues for other genes involved in a particular signaling pathway involved in the pathogenesis of these tumors. Other experiments are needed to verify the potential physical interaction between the co-correlated genes in the context of brain tumorigenesis.
Correlation of gene expression profile of HDACs and cofactors with survival of patients with gliomas
In order to evaluate the potential for the analyzed 24 HDAC and cofactor genes to serve as markers of how aggressive the gliomas are, we correlated the tumor expression profiles of these genes with the survival time of those 40 patients from whom the tumor samples were obtained (and whom had died during the study period). Of all the genes studied, HDAC1 and HDAC3 were inversely and significantly correlated with the survival of patients with gliomas, when analyzed collectively (p = 0.002 and p = 0.016 respectively, Figure 4). RB1 expression levels tended to correlate negatively with survival of patients, although the correlation did not reach statistical significance (p = 0.072, Figure 4). HDAC4, HDAC5, HDAC6 and HDAC11 expression levels were positively correlated with survival (p = 0.001, p = 0.007, p = 0.04 and p = 0.001 respectively, Figure 4). Among the sirtuin family of HDACs, only SIRT1 correlated significantly with the survival of patients (p = 0.034, Figure 4), while a tendency for SIRT3 was observed (p = 0.053, Figure 4).
Figure 4. Correlation of relative gene expression levels in glioma tumor samples to the time of survival of patients.

Correlations that reached statistical significance are in bold.
Interestingly, when samples were analyzed separately based on tumor grade, HDAC11 expression levels correlated significantly with survival time among GL patients (p = 0.004, n = 15) but not among ODIII patients (p = 0.198, n = 20), suggesting that the decreased expression of HDAC11 in grade IV tumors (i.e. GL) may have a greater impact on tumor aggressiveness and clinical outcome than in the less aggressive grade III oligodendroglioma. Of note, when analyzing ODIII and GL together, HDAC11 still correlated with survival time of patients (p = 0.009, n = 35). As for HDAC4 and HDAC6, the opposite was observed. These genes were correlated with survival time in ODIII patients (p = 0.006 for HDAC4 and p = 0.047 for HDAC6, n = 20) but they did not in GL patients (p = 0.552 for HDAC4 and p = 0.381 for HDAC6, n = 15), suggesting that HDAC4 and HDAC6 may play a greater role in ODIII tumor aggressiveness than in GL tumors.
We then analyzed the mean survival times of patients between the tumor grades. As expected, we observed a clear inverse relationship between the grade of the tumor and the survival time (Figure 5). Interestingly, based on the survival time of patients, the ODIII group was heterogeneous and divided in two groups. One subgroup had a high survival time with an average survival time similar to that of the ODII group (surrounded by the orange dashed ellipse in Figure 5), the second group had a low survival time (red dashed ellipse in Figure 5) similar to the GL patients and even more aggressive in average to the mean survival time of GL.
Figure 5. Mean survival time in patients with grade II, III and IV gliomas.
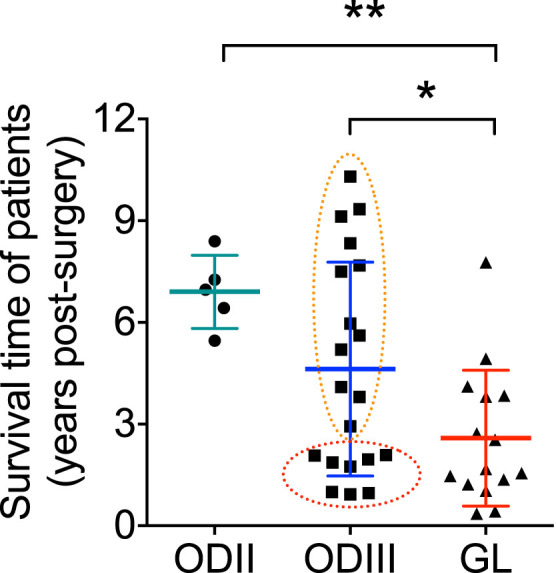
The survival time was determined from the time of surgery until the death of the patient. The orange dashed ellipse represents a distinguished set of histopathological classified ODIII patients whose survival time were much higher from the rest of ODIII patients with poor survival time (red ellipse; some of these tumors were even more aggressive than some grade IV GL tumors). * p < 0.05, ** p < 0.01.
From this survival analysis, we can conclude that of all the HDACs and co-factors analyzed, the expression levels of only a subset of genes correlated significantly with the post-surgery survival time of glioma patients who died during the study period. Furthermore, tumor aggressiveness and survival may be significantly affected by the expression of just one gene (HDAC11 in GL and HDAC4 and HDAC6 in ODIII). Finally, the molecular heterogeneity observed in cluster analysis amongst OD tumors, together with the fact that the mean survival time of a subgroup of ODIII was similar to ODII patients, suggests that the histopathological classification of patients with gliomas does not necessarily follow the level of aggressiveness of the tumors.
1H-HRMAS analysis of brain tumors
We used a metabolomic approach to compare the metabolomic profile of tumors based on their histological grade then on the assignation to different molecular subtypes for genes that were correlated to survival time among glioma patients. We will present only meaningful results. The statistical significance of the different group comparisons was assessed by the partial least square discriminant analysis (PLS-DA) statistical model, a supervised analysis procedure that maximizes the separation between classes based on their metabolomic profile. PLS-DA models were built for each hypothesis using the most discriminating binned variables (e.g. with a variable of importance value superior to the cut off of 1.0) corresponding to the most discriminating metabolites among the following list: Glycine (Gly), glutamate, aspartate, serine, N-acetyl aspartate, acetate, succinate, glycerophosphocholine (GPChol), phosphocholine (PChol), lactate, isoleucine, valine, reduced glutathione (GSH), creatine (Cr), ascorbate, lysine, myo-inositol (MyoI), alanine, taurine and glutamine. We presented in Figure 6A a quantification of the following metabolites, which concentrations have been shown to vary significantly in high grade brain tumors as compared to low grade tumors: PChol, GPChol, Gly, MyoI and Cr26,27,28. We observed that as the grade of tumor increased the GPChol/PChol ratio, MyoI and Cr decreased significantly, whereas Gly and Gly/MyoI ratio were significantly increased (Figure 6A). Since a decreased GPChol/PChol ratio seems to be associated with an increased malignancy and that the expression of some HDACs was correlated with survival, we stratified patients based on the expression of HDAC1, HDAC4 and SIRT1 regardless of tumor grade and compared their metabolomic profiles. Given that all GL patients had an increased HDAC1 expression level, we ran the hypothesis only for ODs. We observed that OD samples with high HDAC1 expression formed a metabolomically distinct group from patients with unchanged (NC = not changed) HDAC1 expression, the former having a significantly lower GPChol/PChol ratio (Figure 6B). Along the same line, glioma samples (ODs and GL) with high HDAC4 and SIRT1 expression were metabolomically different from samples with low HDAC4 and SIRT1 expression, the latter having a significantly lower GPChol/PChol ratio than the former group (Figure 6C and 6D, respectively). Of interest, we observed that the GPChol/PChol ratio correlated with survival time among our glioma patients (Figure 6E). Also, this ratio was negatively and positively correlated with HDAC1 and HDAC4 expression, respectively while the correlation with SIRT1 expression did not reach statistical significance (Figure 6E).
Figure 6. 1H-HRMAS NMR spectroscopy analysis of grade II–IV gliomas.

(A) HRMAS-measured glycerophosphocholine (GPChol), phosphocholine (PChol), glycine (Gly), myo-inositol (MyoI) and creatine (Cr) metabolites in grade II (ODII, n = 9), grade III (ODIII, n = 19) and grade IV (glioblastoma, GL, n = 17). The GPChol/PChol and Gly/MyoI ratios are also presented. (B) Results of two-component PLS-DA model built on the following metabolites: Glycine (Gly), glutamate, aspartate, serine, N-acetyl aspartate, acetate, succinate, glycerophosphocholine (GPChol), phosphocholine (PChol), lactate, isoleucine, valine, reduced glutathione (GSH), creatine (Cr), ascorbate, lysine, myo-inositol (MyoI), alanine, taurine and glutamine among oligodendrogliomas (ODII and ODIII) according HDAC1 expression level. HDAC1-overexpressing tumors (HDAC1 Up, red dots) and samples with unchanged HDAC1 expression (HDAC1 NC, blue triangles) formed metabolomically distinct classes. (C). Results of 2-class PLS-DA model among gliomas (regardless of tumor grade) according to HDAC4 expression level. HDAC4-overexpressing samples (HDAC4 Up, red dots) and samples with downregulated HDAC4 (HDAC4 Do, blue triangles) form two different groups. (D) 2-class PLS-DA model according to SIRT1 expression level in glioma samples. SIRT1-overexpressing samples (SIRT1 Up, red dots) and samples with downregulated SIRT1 (SIRT1 Do, blue triangles) form distinct groups. A zoom of representative spectra indicating the intensity of GPChol, PChol and choline (Cho) as well as the quantification of the GPChol/PChol ratio in each model are presented (B, C and D). E) Correlation of survival time, HDAC1, HDAC4 and SIRT1 expression with GPChol/PChol ratio among gliomas.
Altogether, metabolomic data suggest that a decreased GPChol/PChol ratio is associated with high-grade tumors and that the expression of HDAC1, HDAC4 and SIRT1 may influence tumor aggressiveness through changes in metabolomic profiles of tumors.
Discussion
The expression analysis of the 18 known HDACs and a subset of 6 transcriptional regulators in 50 brain tumors samples obtained from patients operated from grade II–IV gliomas, and 15 non-tumoral samples allowed us to discriminate brain tumors with indistinguishable histopathological features by their different molecular « fingerprints ». The relevance of studying the expression of HDACs in brain tumors lies in the fact that their overexpression has been documented in several cancers, and some HDAC inhibitors have shown clinical efficacy for the treatment of some cancers29,30,31. Of particular note, HDAC5 was the only class II member whose expression was reduced in most tumors studied here (Figure 2A) and robustly so in all of our glioblastoma samples (Figure 2E). Interestingly, HDAC5 overexpression in tumor cell lines has been shown to blunt tumor growth and promote apoptosis through the extrinsic pathway32, underpinning the tumor suppressor potential for HDAC5. In addition, we found a strong positive correlation between HDAC5 expression levels and survival time of patients with gliomas (Figure 4), strengthening the notion that HDAC5 may be an important factor in the epigenetic control of genes involved in tumor growth and apoptosis of cancer cells. Even though the expression level for HDAC4 did not vary within the GL tumors, the expression of HDAC4 correlates positively with a better survival time across all tumor samples (Figures 4). The biological significance of this observation needs further clarification.
Consistent with a recent study showing that class IV HDAC11 was strongly down-regulated in GL tumors16, we found the expression of HDAC11 diminished in all tumor samples, especially those with high grade of malignancy. In addition, we found that HDAC11 expression levels correlated significantly with the survival time of patients with gliomas (all tumor samples combined). This was mainly the case for the most aggressive GL, as HDAC11 expression level was not correlated with the survival time amongst ODIII patients, which could be due to the scattered distribution of survival time in the ODIII group (see Figure 5). In average, HDAC11 expression decreased with the increase in the grade of the tumor (Figure 1). It has been reported that the disruption of HDAC11 in antigen presenting cells (APCs) induces the expression of IL10 and subsequently impairs antigen-specific T cell responses33. These data suggest that HDAC11 may have an important role in modulating the immune response against gliomas, thereby promoting tumor growth suppression. Hence, HDAC11 inhibition below a certain threshold may not be sufficient to the immune system to fight against the tumor, which therefore becomes more aggressive affecting thereby the survival time of patients. Of particular note, it has been shown recently that HDAC6 and HDAC11, which were expressed in opposite manner in our glioma samples (HDAC6 overexpressed and HDAC11 down-regulated), have divergent roles on the transcriptional regulation of IL10 in antigen presenting cells34,35. In view of our data and given the role of HDAC11 in antigen-specific T cell responses, we suggest that restoring HDAC11 expression levels to normal values (e.g. through lentiviral-mediated gene therapy) may improve the survival of patients with gliomas, especially GL.
Regarding the SIRT genes, we observed that expression of the mitochondria-localized SIRT3 was significantly downregulated in GL tumors in average, albeit not in all samples, suggesting a potential role of SIRT3 as a discriminant gene in the molecular signature of brain tumors. SIRT3 was previously described as a tumor suppressor gene, whose suppression induced an increase in glycolysis and a decrease in oxidative phosphorylation36. This is consistent with a potential anti-Warburg effect37 of SIRT3, knowing that aggressive tumors consume glucose at a higher rate than less aggressive ones to generate ATP. Interestingly, we found a modest positive correlation of SIRT3 expression with survival of patients. This could be ascribed to the decreased expression of SIRT3 in highly aggressive GL tumors (Figure 4).
Of particular interest, we found that SIRT1 and HDAC4 co-correlate in GL and in ODIII, suggesting that these genes cooperate to regulate a yet to be identified target gene or gene set. Two transcription factors, myocyte enhancer factor 2 (MEF2), involved in skeletal muscle differentiation, and hypermethylated in cancer 1 (HIC1), silenced in many human cancers, are regulated by SIRT1 and HDAC4 through deacetylation and sumoylation, respectively38,39. We showed that samples with overexpressed HDAC4 and/or SIRT1 were associated with an increased GPChol/PChol ratio. An increased choline kinase (which enhances PChol levels) and glycerophosphodiesterase activities (which decreases GPChol levels) have been linked to enhanced tumorigenesis and cancer cell migration40,41,42. These observations suggest that SIRT1 and HDAC4 may regulate the choline pathway to block tumorigenesis limiting thereby tumor aggressiveness and that their downregulation might predict a bad prognosis in gliomas patients.
It is known that reactive oxygen species (ROS)-mediated mtDNA mutations are associated with malignant cancer progression43. Overexpression of PGC-1 cofactors (α and β) was reported to protect cells against ROS by up-regulating anti-oxidant defense mechanisms44. It is tempting to speculate that the decrease in PPARGC1B observed in our brain tumor samples could participate in the increase in ROS formation and eventually impact on mtDNA mutations. However, the increase in the other PPARGC1, namely PPARGC1A, could be a compensatory mechanism to mitigate the PPARGC1B decrease and hence restrain ROS formation. Moreover, PPARGC1A and PPARGC1B have been shown to protect neurons from mitochondrial loss and oxidative damage45. Interestingly, PPARGC1A expression was differentially affected within our tumor sample of the same histopathological entity. The pathophysiological relevance of this differential expression in PPARGC1A needs to be determined. It is worth mentioning that we did not find any correlation between PPARGC1A and PPARGC1B expression and survival time of patients (Figure 4).
In conclusion, cluster analysis of the 24 genes encoding histone deacetylases and select metabolic regulators in patients with brain glioma tumors allowed us to group genes according to their expression profiles, and facilitated the discrimination of subtypes of primary brain tumors within the same histopathological entity. Furthermore, we found that pairwise Pearson gene-to-gene correlation identified clusters of genes that might cooperate to regulate a yet to be identified signaling pathway(s) in gliomas. We also identified that HDAC1 and HDAC3 expression levels were negatively correlated with survival time among glioma patients, whereas the expression of HDAC4, HDAC5, HDAC6, HDAC11 and SIRT1 was positively correlated with survival time of patients with gliomas. In addition, HRMAS data revealed that patients with the expression profile HDAC1high/HDAC4low/SIRT1low present a decreased GPChol/PChol ratio, a metabolomic hallmark of aggressive brain tumors, while those with a HDAC1NC/HDAC4high/SIRT1high expression profile had significantly higher GPChol/PChol ratio associated with low grade tumors. Concomitant inhibition of HDAC1 and activation of HDAC4/SIRT1 may be salutary in restraining highly aggressive tumor progression and may improve survival time in glioma patients.
A better understanding of how HDACs and metabolic cofactors interact to regulate important genes involved in the pathogenesis of high grade gliomas will help design new molecular therapeutic agents to improve the survival of patients and perhaps even cure these deadly diseases. Another challenge is to unravel why patients belonging to the same histo-pathological entity express differentially a subset of HDACs and cofactors, and how this difference in gene expression influence the aggressiveness of the tumor and thereby survival of patients. Our study has begun to answer these questions, thereby paving the way to the establishment of a molecular « fingerprint » of gliomas as a guide to new therapeutic approaches.
Patients and Methods
Patients
Patients undergoing surgical resection of brain tumors were from the Department of Neurosurgery (Strasbourg University Hospital). Informed written consent was obtained from all patients studied and the study complies with the Helsinki declaration. The protocol was approved by the ethical committee of protection of persons (“Comité de Protection des Personnes”) at the Strasbourg University Hospital (CPP approval number 03/100). Cerebral glioma tumor samples from 50 patients, classified on the basis of the four (I–IV) histo-prognostic grades established by the World Health Organization (WHO), were compared with 15 non-tumoral brain samples from patients operated for epilepsia (CO; n = 15, 30.8 ± 3.2 yrs). Tumor types included grade II oligodendrogliomas (ODII; n = 9, 39.1 ± 3.5 yrs), grade III oligodendrogliomas III (ODIII; n = 22, 44.6 ± 2.5 yrs) and glioblastomas (GL/grade IV; n = 19, 57.6 ± 2.9 yrs). The survival time of operated patients was followed from August 2003 until November 2013, during which 40 patients died (ODII: 5, ODIII: 20, GL: 15).
qRT-PCR analysis for gene expression profile and cluster analysis
HDAC and NR-cofactor gene expression profiles were established by qRT-PCR on a Lightcycler LC480 (Roche®) and then hierarchically clustered as described46. The primer sets used for qRT-PCR analysis are shown in Table S1.
1H-high resonance magic angle spectroscopy ( 1H-HRMAS) analysis
Brain tumor samples were collected with minimum ischemic delays after resection (average time 5 min) and snap-frozen in liquid nitrogen before being stored at −80°C. Biopsy samples (About 20 mg) were prepared at −10°C and introduced into a disposable 30 μl KelF insert. HRMAS spectra were recorded on a Bruker Avance III 500 spectrometer operating at a proton frequency of 500.13 MHz and equipped with a 4 mm double resonance ( 1H, 13C) gradient HRMAS probe as described47.
Statistics
For gene expression levels, the differences between tumors and control samples were considered statistically significant at p < 0.05 using unpaired t-test. The gene expression level was correlated with survival time of patients using regression analysis. Regarding the survival time, the GL/ODII and ODIII/ODII comparisons were considered statistically significant at p < 0.05 using Mann-Whitney test and the GL/ODIII comparison using an unpaired t-test. Cluster analysis and Pearson's correlation coefficients were determined using TMEV 4.1.01 software (www.tm4.org). Boxplots were generated using the R software and GraphPad Prism 6.0. Multiple comparisons of metabolite quantification among ODII, ODIII and GL in HRMAS analysis were considered statistically significant at p < 0.05 using ANOVA followed by Kruskal-Wallis test.
Author Contributions
N.D.Y. and J.A. designed experiments. N.D.Y., S.F. and F.M.M. performed experiments. S.C., G.N. and I.J.N. contributed tools and reagents. N.D.Y., S.F., F.M.M., S.H. and J.A. analyzed data. N.D.Y., S.H. and J.A. wrote the manuscript.
Supplementary Material
supplementary information
Acknowledgments
We acknowledge all members of the JA team for helpful discussions. This work was supported by grants from CNRS, INSERM, ULP, Hôpitaux Universitaires de Strasbourg, NIH (DK069966), the EU Ideas program (ERC; Sirtuins; ERC-2008-AdG-23118), the Academy of Finland (108574 and 110085), the Ecole Polytechnique Fédérale de Lausanne, and the Swiss National Science Foundation (31003A_124713). These investigations were performed after approval by the local Human Investigation Committee (CPP #03/100).
References
- Ostrom Q. T. et al. The epidemiology of glioma in adults: a “state of the science” review. Neuro-oncology, 10.1093/neuonc/nou087 (2014). [DOI] [PMC free article] [PubMed] [Google Scholar]
- Martinez R. & Schackert G. Epigenetic aberrations in malignant gliomas: an open door leading to better understanding and treatment. Epigenetics 2, 147–150 (2007). [DOI] [PubMed] [Google Scholar]
- Lee K. K. & Workman J. L. Histone acetyltransferase complexes: one size doesn't fit all. Nat Rev Mol Cell Biol 8, 284–295 (2007). [DOI] [PubMed] [Google Scholar]
- Yang X. J. & Seto E. The Rpd3/Hda1 family of lysine deacetylases: from bacteria and yeast to mice and men. Nat Rev Mol Cell Biol 9, 206–218 (2008). [DOI] [PMC free article] [PubMed] [Google Scholar]
- Mouchiroud L., Eichner L. J., Shaw R. J. & Auwerx J. Transcriptional Coregulators: Fine-Tuning Metabolism. Cell metabolism 20, 26–40 (2014). [DOI] [PMC free article] [PubMed] [Google Scholar]
- Dali-Youcef N. et al. Sirtuins: the 'magnificent seven', function, metabolism and longevity. Ann Med 39, 335–345 (2007). [DOI] [PubMed] [Google Scholar]
- Park J. H. et al. Class I histone deacetylase-selective novel synthetic inhibitors potently inhibit human tumor proliferation. Clin Cancer Res 10, 5271–5281 (2004). [DOI] [PubMed] [Google Scholar]
- Bolden J. E., Peart M. J. & Johnstone R. W. Anticancer activities of histone deacetylase inhibitors. Nat Rev Drug Discov 5, 769–784 (2006). [DOI] [PubMed] [Google Scholar]
- Glozak M. A. & Seto E. Histone deacetylases and cancer. Oncogene 26, 5420–5432 (2007). [DOI] [PubMed] [Google Scholar]
- Ropero S. & Esteller M. The role of histone deacetylases (HDACs) in human cancer. Mol Oncol 1, 19–25 (2007). [DOI] [PMC free article] [PubMed] [Google Scholar]
- Zhang Z. et al. HDAC6 expression is correlated with better survival in breast cancer. Clin Cancer Res 10, 6962–6968 (2004). [DOI] [PubMed] [Google Scholar]
- Sakuma T. et al. Aberrant expression of histone deacetylase 6 in oral squamous cell carcinoma. International journal of oncology 29, 117–124 (2006). [PubMed] [Google Scholar]
- de Leval L. et al. Use of histone deacetylase 8 (HDAC8), a new marker of smooth muscle differentiation, in the classification of mesenchymal tumors of the uterus. Am J Surg Pathol 30, 319–327 (2006). [DOI] [PubMed] [Google Scholar]
- Wilson A. J. et al. HDAC4 promotes growth of colon cancer cells via repression of p21. Mol Biol Cell 19, 4062–4075 (2008). [DOI] [PMC free article] [PubMed] [Google Scholar]
- Ouaïssi M. et al. High histone deacetylase 7 (HDAC7) expression is significantly associated with adenocarcinomas of the pancreas. Ann Surg Oncol. 15, 2318–2328 (2008). [DOI] [PubMed] [Google Scholar]
- Lucio-Eterovic A. K. et al. Differential expression of 12 histone deacetylase (HDAC) genes in astrocytomas and normal brain tissue: class II and IV are hypoexpressed in glioblastomas. BMC Cancer 8, 243 (2008). [DOI] [PMC free article] [PubMed] [Google Scholar]
- Saunders L. R. & Verdin E. Sirtuins: critical regulators at the crossroads between cancer and aging. Oncogene 26, 5489–5504 (2007). [DOI] [PubMed] [Google Scholar]
- Firestein R. et al. The SIRT1 deacetylase suppresses intestinal tumorigenesis and colon cancer growth. PloS one 3, e2020 (2008). [DOI] [PMC free article] [PubMed] [Google Scholar]
- Qu Y. et al. SIRT1 promotes proliferation and inhibits apoptosis of human malignant glioma cell lines. Neuroscience letters 525, 168–172 (2012). [DOI] [PubMed] [Google Scholar]
- Chang C. J. et al. Enhanced radiosensitivity and radiation-induced apoptosis in glioma CD133-positive cells by knockdown of SirT1 expression. Biochemical and biophysical research communications 380, 236–242 (2009). [DOI] [PubMed] [Google Scholar]
- Zhu G. Y., Shi B. Z. & Li Y. FoxM1 regulates Sirt1 expression in glioma cells. European review for medical and pharmacological sciences 18, 205–211 (2014). [PubMed] [Google Scholar]
- Lo Sasso G. et al. Loss of sirt1 function improves intestinal anti-bacterial defense and protects from colitis-induced colorectal cancer. PloS one 9, e102495 (2014). [DOI] [PMC free article] [PubMed] [Google Scholar]
- Hiratsuka M. et al. Proteomics-based identification of differentially expressed genes in human gliomas: down-regulation of SIRT2 gene. Biochem Biophys Res Commun 309, 558–566 (2003). [DOI] [PubMed] [Google Scholar]
- Inoue T. et al. SIRT2, a tubulin deacetylase, acts to block the entry to chromosome condensation in response to mitotic stress. Oncogene 26, 945–957 (2007). [DOI] [PubMed] [Google Scholar]
- Sayd S. et al. Sirtuin-2 activity is required for glioma stem cell proliferation arrest but not necrosis induced by resveratrol. Stem cell reviews 10, 103–113 (2014). [DOI] [PubMed] [Google Scholar]
- Righi V., Andronesi O. C., Mintzopoulos D., Black P. M. & Tzika A. A. High-resolution magic angle spinning magnetic resonance spectroscopy detects glycine as a biomarker in brain tumors. International journal of oncology 36, 301–306 (2010). [DOI] [PMC free article] [PubMed] [Google Scholar]
- Wright A. J. et al. Ex-vivo HRMAS of adult brain tumours: metabolite quantification and assignment of tumour biomarkers. Molecular cancer 9, 66, 10.1186/1476-4598-9-66 (2010). [DOI] [PMC free article] [PubMed] [Google Scholar]
- Kinoshita Y. & Yokota A. Absolute concentrations of metabolites in human brain tumors using in vitro proton magnetic resonance spectroscopy. NMR Biomed 10, 2–12 (1997). [DOI] [PubMed] [Google Scholar]
- Bug G. et al. Clinical trial of valproic acid and all-trans retinoic acid in patients with poor-risk acute myeloid leukemia. Cancer 104, 2717–2725 (2005). [DOI] [PubMed] [Google Scholar]
- Chavez-Blanco A. et al. Histone acetylation and histone deacetylase activity of magnesium valproate in tumor and peripheral blood of patients with cervical cancer. A phase I study. Molecular cancer 4, 22 (2005). [DOI] [PMC free article] [PubMed] [Google Scholar]
- Duvic M. et al. Phase 2 trial of oral vorinostat (suberoylanilide hydroxamic acid, SAHA) for refractory cutaneous T-cell lymphoma (CTCL). Blood 109, 31–39 (2007). [DOI] [PMC free article] [PubMed] [Google Scholar]
- Huang Y., Tan M., Gosink M., Wang K. K. & Sun Y. Histone deacetylase 5 is not a p53 target gene, but its overexpression inhibits tumor cell growth and induces apoptosis. Cancer research 62, 2913–2922 (2002). [PubMed] [Google Scholar]
- Villagra A. et al. The histone deacetylase HDAC11 regulates the expression of interleukin 10 and immune tolerance. Nat Immunol 10, 92–100 (2009). [DOI] [PMC free article] [PubMed] [Google Scholar]
- Cheng F. et al. Divergent roles of histone deacetylase 6 (HDAC6) and histone deacetylase 11 (HDAC11) on the transcriptional regulation of IL10 in antigen presenting cells. Molecular immunology 60, 44–53 (2014). [DOI] [PMC free article] [PubMed] [Google Scholar]
- Deubzer H. E. et al. HDAC11 is a novel drug target in carcinomas. Int J Cancer 132, 2200–2208 (2013). [DOI] [PubMed] [Google Scholar]
- Kim H. S. et al. SIRT3 is a mitochondria-localized tumor suppressor required for maintenance of mitochondrial integrity and metabolism during stress. Cancer Cell 17, 41–52 (2010). [DOI] [PMC free article] [PubMed] [Google Scholar]
- Warburg O. On the origin of cancer cells. Science 123, 309–314 (1956). [DOI] [PubMed] [Google Scholar]
- Zhao X., Sternsdorf T., Bolger T. A., Evans R. M. & Yao T. P. Regulation of MEF2 by histone deacetylase 4- and SIRT1 deacetylase-mediated lysine modifications. Mol Cell Biol 25, 8456–8464 (2005). [DOI] [PMC free article] [PubMed] [Google Scholar]
- Stankovic-Valentin N. et al. An acetylation/deacetylation-SUMOylation switch through a phylogenetically conserved psiKXEP motif in the tumor suppressor HIC1 regulates transcriptional repression activity. Mol Cell Biol 27, 2661–2675 (2007). [DOI] [PMC free article] [PubMed] [Google Scholar]
- Cuadrado A., Carnero A., Dolfi F., Jimenez B. & Lacal J. C. Phosphorylcholine: a novel second messenger essential for mitogenic activity of growth factors. Oncogene 8, 2959–2968 (1993). [PubMed] [Google Scholar]
- Glunde K. et al. Hypoxia regulates choline kinase expression through hypoxia-inducible factor-1 alpha signaling in a human prostate cancer model. Cancer research 68, 172–180 (2008). [DOI] [PMC free article] [PubMed] [Google Scholar]
- Stewart J. D. et al. Choline-releasing glycerophosphodiesterase EDI3 drives tumor cell migration and metastasis. Proc Natl Acad Sci U S A 109, 8155–8160 (2012). [DOI] [PMC free article] [PubMed] [Google Scholar]
- Ishikawa K. et al. ROS-generating mitochondrial DNA mutations can regulate tumor cell metastasis. Science 320, 661–664, 10.1126/science.1156906 (2008). [DOI] [PubMed] [Google Scholar]
- St-Pierre J. et al. Suppression of reactive oxygen species and neurodegeneration by the PGC-1 transcriptional coactivators. Cell 127, 397–408 (2006). [DOI] [PubMed] [Google Scholar]
- Wareski P. et al. PGC-1{alpha} and PGC-1{beta} regulate mitochondrial density in neurons. J Biol Chem 284, 21379–21385 (2009). [DOI] [PMC free article] [PubMed] [Google Scholar]
- Gofflot F. et al. Systematic gene expression mapping clusters nuclear receptors according to their function in the brain. Cell 131, 405–418 (2007). [DOI] [PubMed] [Google Scholar]
- Imperiale A. et al. A new specific succinate-glutamate metabolomic hallmark in SDHx-related paragangliomas. PloS one 8, e80539 (2013). [DOI] [PMC free article] [PubMed] [Google Scholar]
Associated Data
This section collects any data citations, data availability statements, or supplementary materials included in this article.
Supplementary Materials
supplementary information