Background: Conjugating enzymes such as UDP-glucuronosyltransferases (UGTs) determine small molecule bioavailability.
Results: UGT1A8 is induced by certain fatty acids and functionally localizes in the basolateral plasmalemma in HT29-MTX goblet cells.
Conclusion: The conjugation pattern is asymmetric, suggesting association of UGT1A8 with membrane transporters.
Significance: The enzyme localization allows the cell to carry out conjugation without the small molecule entering into the interior of the cell.
Keywords: Cell Polarity, Fatty Acid, Flavonoid, Intestinal Metabolism, Membrane Enzyme, Polyunsaturated Fatty Acid (PUFA), Uridine 5'-Diphosphoglucuronosyltransferase (UDP-glucuronosyltransferase), Xenobiotic
Abstract
UDP-glucuronosyltransferases (UGTs) are highly expressed in liver, intestine and kidney, and catalyze the glucuronic acid conjugation of both endogenous compounds and xenobiotics. Using recombinant human UGT isoforms, we show that glucuronic acid conjugation of the model substrate, (−)-epicatechin, is catalyzed mainly by UGT1A8 and UGT1A9. In HepG2 cells, pretreatment with polyunsaturated fatty acids increased substrate glucuronidation. In the intestinal Caco-2/HT29-MTX co-culture model, overall relative glucuronidation rates were much higher than in HepG2 cells, and (−)-epicatechin was much more readily conjugated when applied to the basolateral side of the cell monolayer. Under these conditions, 95% of the conjugated product was effluxed back to the site of application, and none of the other phase 2-derived metabolites followed this distribution pattern. HT29-MTX cells contained >1000-fold higher levels of UGT1A8 mRNA than Caco-2 or HepG2 cells. Gene expression of UGT1A8 increased after treatment of cells with docosahexaenoic acid, as did UGT1A protein levels. Immunofluorescence staining and Western blotting showed the presence of UGT1A in the basal and lateral parts of the plasma membrane of HT29-MTX cells. These results suggest that some of the UGT1A8 enzyme is not residing in the endoplasmic reticulum but spans the plasma membrane, resulting in increased accessibility to compounds outside the cell. This facilitates more efficient conjugation of substrate and is additionally coupled with rapid efflux by functionally associated basolateral transporters. This novel molecular strategy allows the cell to carry out conjugation without the xenobiotic entering into the interior of the cell.
Introduction
The group of UDP-glucuronosyltransferase (UGT)4 enzymes is a large family involved in phase II metabolism. In vertebrates, the UGT protein spans the endoplasmic reticulum (ER) membrane with the active site facing the ER lumen (1). UGTs catalyze the transfer of glucuronic acid from the co-factor UDP-glucuronic acid (UDPGA) to a nucleophilic group of the substrate, increasing the size and polarity of the compound and thus enabling active transport and cellular efflux (2). UGTs display broad substrate specificity ranging from drugs (3, 4) to environmental pollutants (5–7) and endogenous compounds (8–11). (−)-Epicatechin is a plant-derived phenolic compound that inhibits NADPH oxidase, affects NO signaling, and modulates endothelial function (12). This class of compounds is very efficiently conjugated with glucuronic acid (13–15). Glucuronidation dramatically affects the distribution and biological activity of both epicatechin and endogenous compounds such as bile acids (13, 16–18). Phase II metabolism is almost entirely facilitated by the UGT1A and UGT2B families (19), with the highest UGT activity found in liver and intestine. Ohno and Nakajin (20) analyzed samples from various tissues for relative mRNA abundance of different UGT isoforms. Overall, they reported much higher levels of UGT2B than UGT1A forms, except for UGT1A9 which is highly expressed in kidney. The main UGT2B isoforms in hepatic tissue are UGT2B4 and UGT2B15, and the main UGT1A forms are UGT1A1 and UGT1A9. In the intestine, UGT2B7, UGT2B17, UGT1A1, and UGT1A10 were most abundant (20).
The impact of dietary fatty acids on UGT activity has been investigated with inconsistent results. Some studies found that fatty acids could inhibit UGT activity, whereas others concluded that they increase conjugation rates (21–27).
Upon entering the cell, fatty acids are bound by fatty acid-binding protein and then either esterified and stored as triglycerides or coenzyme A-conjugated and used for energy production (28). The effect of acyl-CoAs on UGT activity in vitro depends on concentration and microsomal pretreatment with de-latency agents (e.g. detergents or alamethicin). High acyl-CoA concentrations inhibited whereas lower concentrations enhanced UGT activity. In intact microsomes, acyl-CoAs and free unsaturated fatty acids resulted in activity enhancement, but in detergent-treated microsomes activity was reduced (29). Unsaturated fatty acids could inhibit glucuronidation of 4-methylumbelliferone by human kidney cortical microsomes and recombinant UGT1A9 and UGT2B7 enzymes. The greater the degree of fatty acid unsaturation, the more pronounced the inhibition (30).
Studies using recombinant enzyme found that PUFAs inhibited UGT1A1 glucuronidation of estradiol in vitro with docosahexaenoic acid (DHA) having the greatest effect. DHA also inhibited enzyme activity in vivo, increasing bilirubin levels 48 h after oral administration of low concentrations of DHA, but high DHA concentrations had the opposite effect (31). In addition, this and other studies have reported an increase in UGT expression with unsaturated fatty acid feeding. This could be explained by in vitro results that show that PUFA metabolites of the lipoxygenase or cyclooxygenase pathways and some free fatty acids activate peroxisome proliferator-activated receptors α and γ (PPARα and PPARγ), which then stimulate UGT gene transcription (32–34).
The examples given above indicate that fatty acids can have a different impact on UGT activity and expression depending on the model and conditions employed. In this study, different tissue culture models were employed to investigate the effect of dietary fatty acids on glucuronidation of epicatechin. This compound was chosen as there are increasing numbers of reports on the effects of this class of compounds on NO metabolism, and glucuronidation of epicatechin is low in vitro (35) despite evidence that epicatechin is extensively conjugated with glucuronic acid in vivo (36, 37).
EXPERIMENTAL PROCEDURES
Chemicals, Cell Lines, and Reagents
All cell culture consumables, acetonitrile, formic acid, stearic, linolenic and arachidonic acid, (−)-epicatechin, 3,4-dimethoxycinnamic acid, ascorbic acid, and protease inhibitor mixture were purchased from Sigma; RIPA buffer, EZ-Link Sulfo-NHS-LC-biotin, high capacity streptavidin-agarose resin, and bicinchoninic acid (BCA) kit were purchased from Pierce; eicosapentaenoic acid and DHA were purchased from Cayman Chemical; all ProteinSimple consumables and reagents were purchased from ProteinSimple (San Jose, CA). Baculovirus-infected insect cells expressing human UGT isoforms were purchased from BD Biosciences.
Antibodies
UGT1A was obtained from Santa Cruz Biotechnology (Dallas, TX); GAPDH, Na+/K+-ATPase, and α-actinin were from Cell Signaling Technologies (New England Biolabs, Herts, UK). Secondary antibodies for SIMON and WES ProteinSimple were provided by ProteinSimple and used neat. The Caco-2 cell line (HTB-37) and the HepG2 cell line (HB-8065) were obtained from American Type Culture Collection (ATCC) (Manassas, VA), the HT29-MTX cell line (38) was a generous gift from the Nestlé Research Center (Lausanne, Switzerland).
Cell Culture
Caco-2 and HT29-MTX cells were routinely cultured in low glucose Dulbecco's modified Eagle's medium (DMEM) supplemented with 15% fetal bovine serum (FBS) for Caco-2 and 10% FBS for HT29-MTX, 100 units/ml penicillin, 0.1 mg/ml streptomycin, and 0.25 μg/ml amphotericin B (full medium) at 37 °C with 5% CO2 in a humidified atmosphere. Cells were subcultured when reaching ∼90% confluency and seeded into flasks at 1 × 104 cm−2. For metabolism experiments and surface biotinylation, cells were seeded onto Corning transwell plates of 4.67 cm2 growth area (Lowell) at a ratio of 24:76 HT29-MTX/Caco-2 and a seeding density of 6 × 104 cm−2, unless stated otherwise. Both cell lines were maintained in full medium containing 10% FBS and 50 μm fatty acid dissolved in ethanol (final concentration 0.5%) or the corresponding amount of solvent for controls during their entire differentiation time of 21 days. Cells supplemented with DHA or eicosapentaenoic acid and their controls were also incubated with 100 μm of the antioxidant α-tocopherol. The medium was replaced every other day. For gene expression studies and protein quantification, cells were seeded onto 6-well plastic plates.
HepG2 cells were grown in minimum essential medium (MEM) supplemented with 10% FBS, nonessential amino acids, 100 μm sodium pyruvate, 100 units/ml penicillin, and 0.1 mg/ml streptomycin. Cells were seeded on 6-well plastic plates at a seeding density of 1 × 105 cm−2.
Metabolism Experiments
On day 22 or day 5 after seeding (Caco-2/HT29-MTX or HepG2, respectively), cells were washed twice with HBSS, and if grown on permeable supports, transepithelial electrical resistance was measured using a Millicell ERS Ohm meter in HBSS + 1.8 mm Ca2+. The average transepithelial electrical resistance of co-cultures grown in 6-well transwell plates was 300 ohms. Cell layers were incubated with 200 μm epicatechin, and 100 μm ascorbic acid was dissolved in HBSS + 1.8 mm Ca2+ either for 120 min (HepG2) or for 90 min from the apical or basolateral side (co-cultures and HT29-MTX cells).
Epicatechin Metabolite Analysis by LC-MS/MS
After incubation of cells with epicatechin, 1.5 ml of the transport buffer was removed, acidified with 100 mm acetic acid, mixed with 50 μm of the internal standard 3,4-dimethoxycinnamic acid and 100 μm ascorbic acid. Cell layers were then washed three times with HBSS and lysed with 80% methanol containing 100 μm ascorbic acid and 5 μm internal standard. Cells were then scraped, collected with the lysate, and vortexed vigorously. The lysate was then centrifuged, and the supernatant was dried under vacuum and reconstituted in 100 μl of solvent A.
For LC-MS/MS analysis of epicatechin metabolites, separation was achieved with an Agilent 1200 series HPLC on a Phenomenex Kinetex C18 column (2.6 μm, 150 × 2.1 mm) and a 10-μl sample injection. Solvent A consisted of 94.5% MilliQ water, 5% acetonitrile, and 0.5% formic acid. Solvent B consisted of 94.5% acetonitrile, 5% MilliQ water, and 0.5% formic acid. The flow rate was 0.4 ml/min. The solvent gradient started at 0% B for 3 min, a linear increase to 50% solvent B from 3 to 16 min, 100% solvent B for 4 min, and return to 0% solvent B at 23 min (39). Epicatechin aglycone and conjugates were detected with an Agilent 6410 triple quadrupole LC-MS/MS in negative MRM mode for the following transitions: epicatechin (m/z = 289 → 245), methyl-epicatechin (m/z = 303 → 165), epicatechin-sulfate (m/z = 369 → 289), epicatechin-glucuronide (m/z = 465 → 289), methyl-epicatechin-sulfate (m/z = 383 → 303), methyl-epicatechin-glucuronide (m/z = 479 → 303).
Identification of metabolite stereoisomers was achieved by comparison with previous publications where authentic standards were available. Actis-Goretta et al. (40) employed very similar chromatography conditions as described here, and therefore peaks in the this study were identified accordingly.
For estimation of relative concentration, the volume of the HT29-MTX cell monolayer was calculated using immunofluorescence (IF) staining of the cell membrane as detailed below. The distance between the apical and basolateral membrane was measured by confocal microscopy and was an average of 15 μm estimated from 24 independent experiments. With a growth area of 4.67 cm2 for transwell plates and 9.5 cm2 for solid 6-well plates, the volume of a cell monolayer was calculated as 7 and 14 μl, respectively.
Protein Analysis by Capillary Electrophoresis in Nano-capillaries
For UGT1A protein detection, HT29-MTX cells grown on solid supports were washed with ice-cold PBS, scraped, and lysed in RIPA buffer containing 0.5% protease inhibitor mixture by gently rocking the samples on ice for 30 min. The lysate was centrifuged at 14,000 × g for 10 min, and the total protein concentration of the supernatant was determined by BCA microplate assay according to the manufacturer's instructions. For the biotinylation and pulldown experiments, UGT1A protein abundance was determined using the ProteinSimple system “SIMON” according to the manufacturer's instructions with the following modifications: loading time of the stacking matrix was increased to 17.0 s, loading time of the sample was increased to 12.0 s, and separation time was increased to 47.0 min. Samples were denatured by incubation with sample buffer at room temperature for 30 min. All primary antibodies were used at a dilution of 1:100. For analysis of UGT1A protein level after DHA treatment, the ProteinSimple system “WES” was used according to standard protocol, and the primary antibody incubation was extended to 1 h. α-Actinin (1:200) was used as a loading control in the same capillary with UGT1A (1:100). A standard curve was constructed with different amounts of cell lysate to test linearity of both antibodies and loading sample concentration; 0.08 mg/ml was found optimal for signals of both antibodies. Quantification of peak areas and gel image reconstruction was carried out using ProteinSimple Compass software. Three molecular weight fluorescent standards, incorporated with every sample, were run in every capillary and used to assign the molecular weights to the corresponding peaks.
Cell Surface Biotinylation and Pull Down
HT29-MTX cells grown on permeable supports were washed twice with ice-cold PBS and incubated with 0.25 mg/ml EZ-Link Sulfo-NHS-LC-biotin dissolved in HBSS + 1.8 mm CaCl2 from either the apical or basolateral side. After 4 h of incubation on ice, the reaction was stopped by the addition of 40 mm Tris to quench the remaining Sulfo-NHS-LC-biotin. Cells were washed twice with Tris-buffered saline (TBS) and lysed with RIPA buffer containing 0.5% protease inhibitor mixture. After rocking on ice for 20 min, lysates were centrifuged at 14,000 × g for 10 min, and the supernatant was incubated with 25 μl of high capacity streptavidin-agarose resin overnight at 8 °C with constant gentle shaking. The supernatant was removed; the resin washed three times with TBS, and samples were eluted in 20 μl of 4× ProteinSimple sample buffer containing 0.2 m DTT. 10 μl of sample was used for analysis by capillary electrophoresis as described above.
Immunofluorescence Staining and Microscopy
HT29-MTX cells were seeded onto Millicell cell culture inserts (12-well, PET 0.4 μm pore size, Millipore) at a density of 6 × 104 cm−2 and maintained for 21 days. For staining, cells were fixed with 4% paraformaldehyde in PBS, permeabilized with 0.1% Triton X-100, and incubated with UGT1A (sc-25847) and MRP1 (sc-18835) antibody at a dilution of 1:50 for 1 h. After washing with PBS, cells were further incubated with Alexa488-conjugated donkey anti-rabbit IgG and CyTM3-conjugated donkey anti-mouse IgG obtained from Jackson ImmunoResearch (West Grove, PA) at a 1:300 dilution. Alternatively, to visualize endoplasmic reticulum, calnexin primary antibody (sc-6465) was used at a 1:20 dilution followed by Alexa488-conjugated donkey anti-goat secondary antibody. In these experiments, UGT1A was simultaneously detected using the sc-23847 primary antibody and CyTM3-conjugated donkey anti-rabbit IgG. After that, cell layers were stained with 0.2 μg/ml DAPI and mounted on microscope slides with ProLong Gold antifade reagent mounting medium (Molecular Probes, Carlsbad, CA). Cells were imaged using Zeiss LSM510 or LSM700 confocal microscopes.
Widefield images of Caco-2/HT29-MTX co-cultures were acquired using the Leica EL6000 microscope. Percentage of each cell line in the monolayer at day 21 was calculated from widefield images using the ImageJ software (National Institutes of Health).
Gene Expression Analysis
Cells were seeded onto solid supports at 6 × 104 cm−2 and maintained in full medium supplemented with DHA or vehicle for 22 days (Caco-2 and HT29-MTX) or 5 days (HepG2). Cells were washed with HBSS and scraped, and mRNA was extracted using the Ambion RNAqueous kit from Invitrogen, according to the manufacturer's protocol. RNA (1 μg) was transcribed to cDNA using the Applied Biosystems high capacity RNA to cDNA kit. 100 ng of cDNA were used to analyze gene expression by TaqMan real time PCR using Applied Biosystems TaqMan gene expression assays and TaqMan gene expression master mix according to the manufacturer's protocol on a StepOnePlus real time PCR system. GAPDH was used as reference (NM_002046.3, VIC/MGB_PL, 4326317E).
Absolute Quantification of UGT1A Isoforms in HT29-MTX Cells
The QX100 Droplet digital PCR system (Bio-Rad) was used to quantify expression of different UGT1A isoforms in HT29-MTX cells from three biological replicates in three seeding experiments (total n = 9), with three technical replicates (total n = 27). mRNA was extracted as above, and following DNase treatment (TURBO DNA-free kit, Ambion, Invitrogen), to exclude genomic DNA contamination, 1 μg was transcribed to cDNA as above. 65 ng of transcribed DNA diluted with Milli-Q water to 9 μl was introduced in every 20-μl assay/well, including 1 μl of UGT FAMTM-labeled TaqMan primer (Invitrogen) and 10 μl of digital droplet PCR Supermix for Probes (Bio-Rad). Droplets were generated according to the manufacturer's guidelines with the QX100 Droplet generator (Bio-Rad) before cycling in a C1000 Touch thermal cycler (Bio-Rad) at optimal temperature for every primer for 30 min followed by 95 °C (10 min), 40 cycles of 94 °C (0.5 min) followed by 60 °C (60 min), and 98 °C (10 min). Plates were held at 12 °C between amplification and droplet reading. On average, digital droplet PCR yielded a number of 14,098 accepted droplets with a standard deviation of 972 droplets. Data from the QX100 Droplet Reader were analyzed with the QuantaSoft software (Kosice, Slovakia). Fluorescent droplets were deemed positive by automatically set thresholds, and the concentration of the target DNA in copies/μl was calculated from the fraction of positive reactions using Poisson distribution analysis.
In Vitro Glucuronidation Assay
Activity of different UGT isoforms toward epicatechin was tested using recombinant human enzymes expressed in insect microsomes. In vitro glucuronidation assay was performed as described by Wong et al. (41).
Statistics
Statistical analysis was conducted with SPSS version 22. Values shown are the mean of n independent experiments ± S.E. unless otherwise indicated. For analysis of statistically significant differences, unpaired Students t test was used.
RESULTS
Highest UGT activity has been found in the liver, and so the HepG2 hepatic cell line was first used to investigate the effect of chronic supplementation with different fatty acids on glucuronidation rate (Fig. 1). Stearic acid (C18:0) had no effect on metabolite formation, although PUFA increased glucuronidation as assessed by formation of the most abundant metabolite epicatechin-3′-glucuronide (EC-3′-Glc). Eicosapentaenoic acid (C20:5) increased only intracellular EC-3′-Glc levels, whereas α-linolenic acid (C18:3), arachidonic acid (C20:4), and DHA (C22:6) increased both intra- and extracellular EC-3′-Glc concentrations.
FIGURE 1.
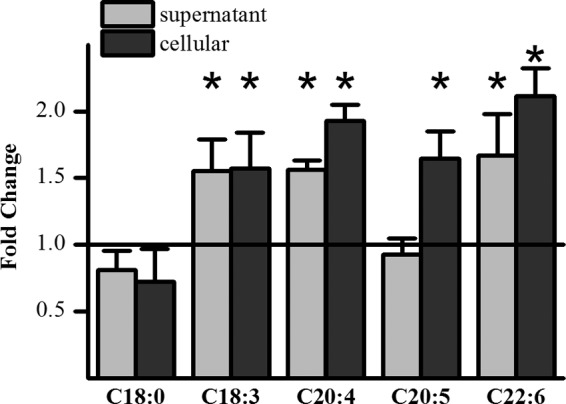
Effect of PUFAs on EC-3′-Glc formation in HepG2 cells. Ratio of EC-3′-Glc concentration detected in the supernatant and the cell lysate of fatty acid-pretreated cells (50 μm, 5 days) compared with the concentration detected in vehicle only-treated cells. Cells were incubated with 200 μm (−)-epicatechin for 2 h. *, p ≤ 0.05; n = 6.
Apart from the liver, the small intestine has also been shown to have high capacity for glucuronidation. Therefore, a cell culture model of the small intestine was chosen to further investigate the impact of fatty acid pretreatment on glucuronic acid conjugation. DHA increased conjugation rates 2-fold in HepG2 cells and was therefore selected to assess glucuronidation in the Caco-2/HT29-MTX co-culture model. Cells were treated with DHA for their entire differentiation time of 22 days, and controls were treated with vehicle only. Fig. 2 shows the amount of several epicatechin metabolites in different compartments of the cell model. All glucuronide isomers showed the same pattern of distribution; the highest concentration was found intracellularly, and the highest amount was found in the basolateral well when substrate was applied basolaterally. Surprisingly, there was a dramatic ∼50-fold difference depending on whether substrate was applied to the apical or basolateral side. DHA treatment was able to further increase glucuronide levels up to 4-fold in all compartments. None of the products from the other conjugating enzymes sulfotransferase (SULT) and catechol-O-methyltransferase exhibited the same pattern of distribution as glucuronides. Fig. 2 shows representative graphs for the most abundant metabolites 3′-methyl-epicatechin (3′-meEC), epicatechin-3′-sulfate (EC-3′-sulfate), and 3′-methyl-epicatechin-7-sulfate (3′-EC-7-sulfate). For all these compounds, the highest concentration was found intracellularly, but unlike the glucuronic acid conjugates, the highest amount was not detected in samples from the basolateral well but in cell lysates. Aglycone applied to the basolateral side resulted in 5-fold higher concentrations of sulfate and methyl conjugates than aglycone applied to the apical side, but this difference is small in comparison with the 50-fold difference observed with glucuronic acid conjugates. The methyl-sulfate double conjugate even showed converse distribution, with 5-fold higher amounts detected when epicatechin was applied apically. None of the non-glucuronide metabolites demonstrated a pronounced difference in apical and basolateral distribution, indicating that these conjugates are not preferentially transported to the side of aglycone application, in contrast to the effect observed with glucuronides. DHA treatment had no impact on the activity of catechol-O-methyltransferase or SULT, in contrast with UGT. The fact that DHA increased the amount of only one type of metabolite shows that there is a specific effect of DHA on that enzyme, and it is not a generic mechanism that is altered. Also, the striking difference in glucuronide production depending on the aglycone transport direction (a → b versus b → a) is unique to UGT products, and so it does not stem from an increased uptake of epicatechin and consequent increase in substrate availability from the basolateral side, because then the concentration of SULT and catechol-O-methyltransferase products would also have been increased. Therefore, UGT shows a unique pattern of activity that is asymmetrically distributed within the cell and responds to DHA supplementation. The existing model of an enzyme solely residing in the ER cannot explain the observations presented here.
FIGURE 2.
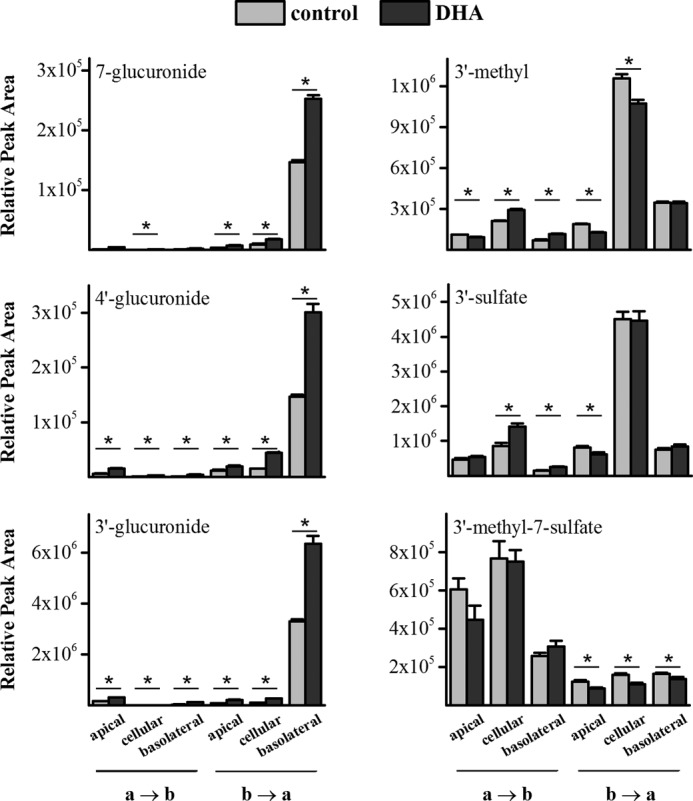
Impact of DHA pretreatment on (−)-epicatechin metabolism by Caco-2/HT29-MTX co-cultures. Cells were seeded onto permeable supports at a ratio of Caco-2/HT29-MTX 76/24 and supplemented with 50 μm DHA or vehicle for their entire differentiation time of 21 days. For metabolism experiments, cells were incubated with 200 μm epicatechin in HBSS + 1.8 mm Ca2+ from either the apical (a → b) or basolateral (b → a) side. After a 90-min incubation, samples were taken from the apical and basolateral wells, and cells were washed three times and then lysed with 80% methanol. Data represent the entire amount of a specific metabolite in that compartment. *, ≤0.05; n = 6.
The Caco-2/HT29-MTX seeding ratio of 76:24, used for the transport experiments, was chosen to represent the percentage of goblet cells in the small intestine. Because Caco-2 cells grow faster than HT29-MTX cells, seeding 24% goblet cells typically resulted in 13 ± 2% goblet cells in the monolayer after differentiation, growing as patches of Caco-2 cells with ribbons of HT29-MTX running through (Fig. 3A). To investigate whether the seeding ratio of the two cell lines has an impact on glucuronidation activity, different ratios were tested. Fig. 3B shows the impact of increasing amounts of HT29-MTX cells in the model on glucuronic acid conjugation rates. There is an almost linear relationship between EC-3′-Glc production and the percentage of goblet cells seeded. This indicates that Caco-2 cells make only a minor contribution to the overall glucuronidation rate and that either the activity or the abundance of UGT isoforms is much greater in HT29-MTX cells.
FIGURE 3.
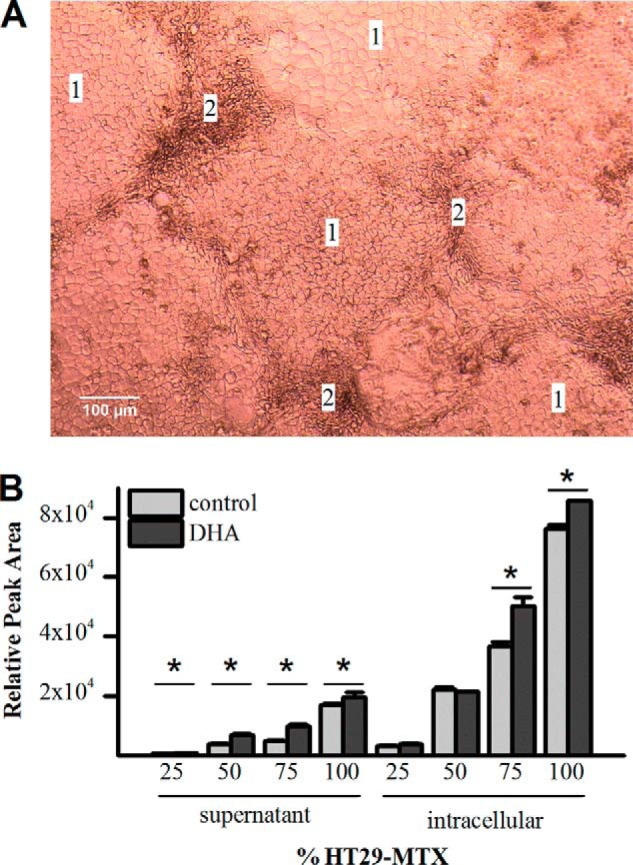
Impact of Caco-2/HT29-MTX seeding ratio. A, representative widefield microscopy image of Caco-2/HT29-MTX co-culture seeded at a ratio of 76:24 at day 21 after seeding, with typical pattern of cell type distribution. Areas labeled 1 contain Caco-2 cells; areas labeled 2 contain HT29-MTX cells. B, HT29-MTX cells are the main source of UGT activity in co-cultures. Cells were seeded on solid supports with increasing percentage of HT29-MTX cells (25, 50, 75, and 100%) and treated with either 50 μm DHA or vehicle for 21 days. Cell layers were incubated with 200 μm epicatechin from the apical side for 90 min. Glucuronic acid conjugates in supernatant and cell lysates were analyzed by LC-MS/MS. The amounts of the most abundant metabolite (E-3′-Glc) are shown. *, p ≤ 0.05; n = 3.
The UGT isoforms that catalyze glucuronidation of epicatechin are not known so recombinant human UGTs expressed in insect microsomes were used to determine specificity. The following three UGTs of the 1A family showed significant activity toward epicatechin: UGT1A1, UGT1A8, and UGT1A9 (Fig. 4). Consistent with epicatechin metabolism by liver and intestinal cells, EC-3′-Glc was produced with the highest rate, followed by EC-7-Glc and then EC-4′-Glc.
FIGURE 4.
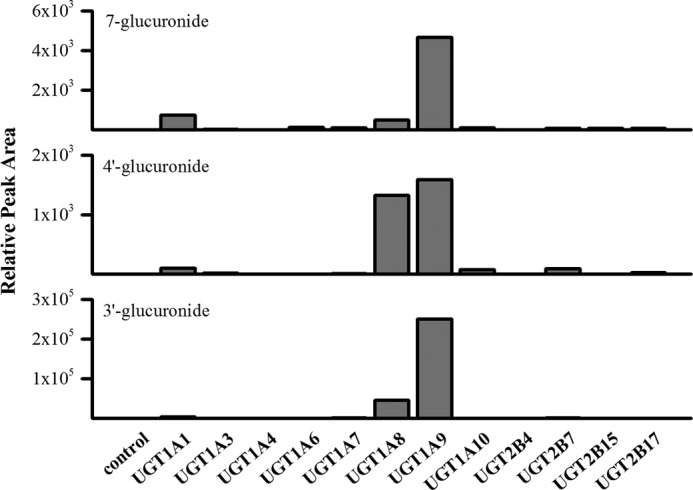
In vitro glucuronidation of epicatechin by recombinant human UGT isoforms expressed in insect microsomes. Microsomes corresponding to 0.5 mg/ml protein were incubated with 50 μm epicatechin for 60 min at 37 °C in the presence of 0.025 mg/ml alamethicin, 100 μm ascorbic acid, and 1 mm UDPGA in phosphate buffer. Conjugates were analyzed by LC-MS/MS. n = 2.
Gene expression of the relevant isoforms UGT1A1, UGT1A8, and UGT1A9 was investigated in HepG2, Caco-2, and HT29-MTX cells. Fig. 5A shows their relative mRNA abundance normalized to the housekeeping gene GAPDH. For all three UGT isoforms, similar mRNA levels were found in Caco-2 and HepG2 cells. Absolute quantification of all UGT1A isoforms in HT29-MTX cells (Table 1) showed ∼100-fold higher levels of UGT1A8 and 1A10 mRNA compared with 1A1, 1A3, 1A7, and 1A9, and 10-fold higher than UGT1A6. Because UGT1A8 has the highest activity on epicatechin, this isoform is predicted to be the dominant epicatechin-conjugating UGT in Caco-2/HT29-MTX co-cultures. The impact of chronic DHA treatment on UGT gene expression was measured after a 21-day treatment in Caco-2 and HT29-MTX cells grown separately and after a 5-day treatment in HepG2 cells. UGT1A1 expression was up-regulated in Caco-2 and HT29-MTX cells, and UGT1A8 was up-regulated in HT29-MTX and HepG2 cells. UGT1A9 was less affected by DHA treatment (Fig. 5B).
FIGURE 5.
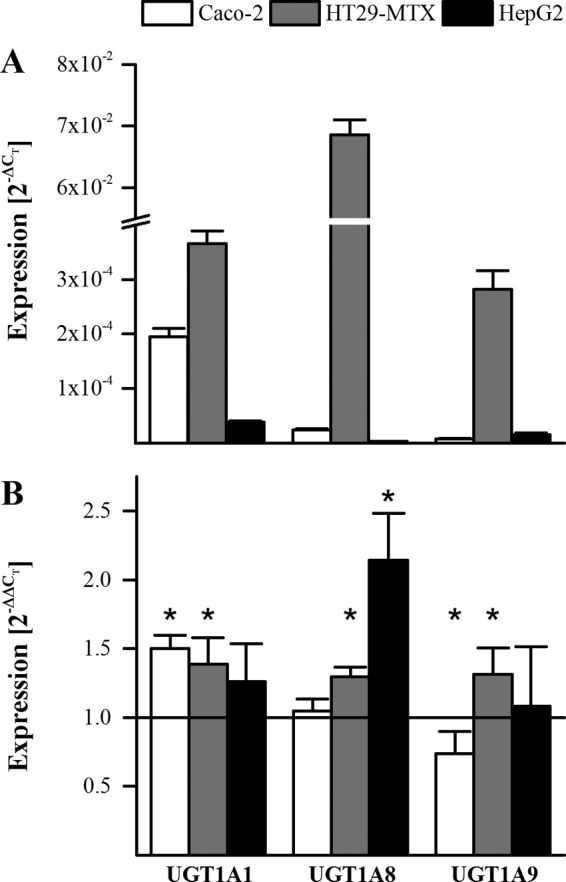
UGT expression in Caco-2, HT29-MTX, and HepG2 cells. A, expression of UGT1A1, UGT1A8, and UGT1A9 normalized to levels of the housekeeping gene GAPDH (presented as 2−ΔCT). B, impact of chronic DHA supplementation (50 μm; 21 days for Caco-2 and HT29-MTX; 5 days for HepG2) on UGT expression. *, p ≤ 0.05; n = 5.
TABLE 1.
mRNA expression of UGT1A isoforms expressed in HT29-MTX cells
The exact copy number of each UGT1A isoform was quantified by droplet digital PCR in triplicate of nine biological replicates from three independent experiments (n = 27) with TaqMan probes after DNase treatment of the mRNA.
| TaqMan primer ID | Copies/50 pg cDNA (n = 9) | |
|---|---|---|
| UGT1A1 | Hs02511055_s1 | 0.6 ± 0.2 |
| UGT1A3 | Hs04194492_g1 | 0.4 ± 0.2 |
| UGT1A6 | Hs01592477_m1 | 4.7 ± 1.2 |
| UGT1A7 | Hs02517015_s1 | 0.5 ± 0.2 |
| UGT1A8 | Hs01592482_m1 | 47.5 ± 10.2 |
| UGT1A9 | Hs02516855_sH | 0.6 ± 0.2 |
| UGT1A10 | Hs02516990_s1 | 45 ± 8.9 |
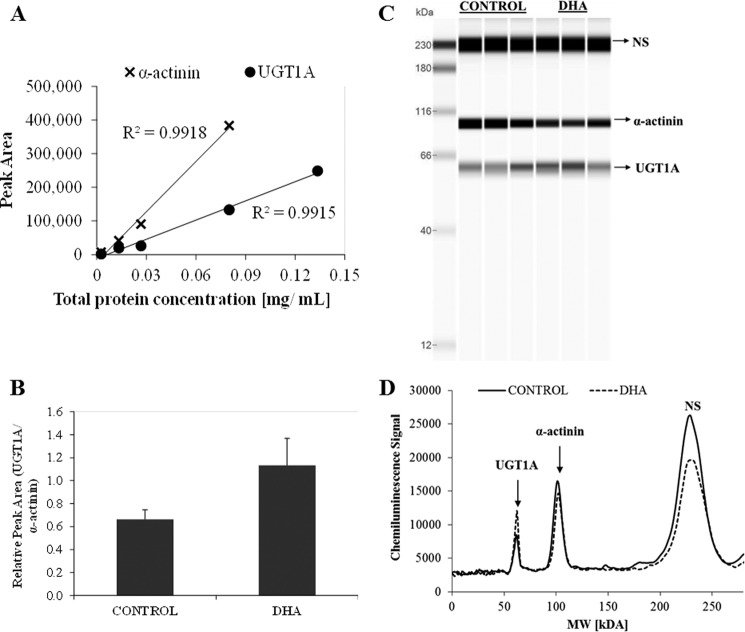
As no specific UGT1A8 antibody was commercially available, the impact of DHA on protein levels of UGT1A8 in HT29-MTX cells was assessed using a generic UGT1A antibody recognizing all isoforms of that family. However, having shown that in this cell line UGT1A8 and 1A10 are much more abundant than the other UGTs investigated, we predicted confidently that the UGT1A detected by that antibody will be mainly UGT1A8 and 1A10. The antibody characteristics and dose response are shown in Fig. 6. Using this quantification with α-actinin as internal standard, we show that UGT1A levels increased by 70% with chronic DHA treatment in HT29-MTX whole cell lysates (Fig. 7).
FIGURE 6.
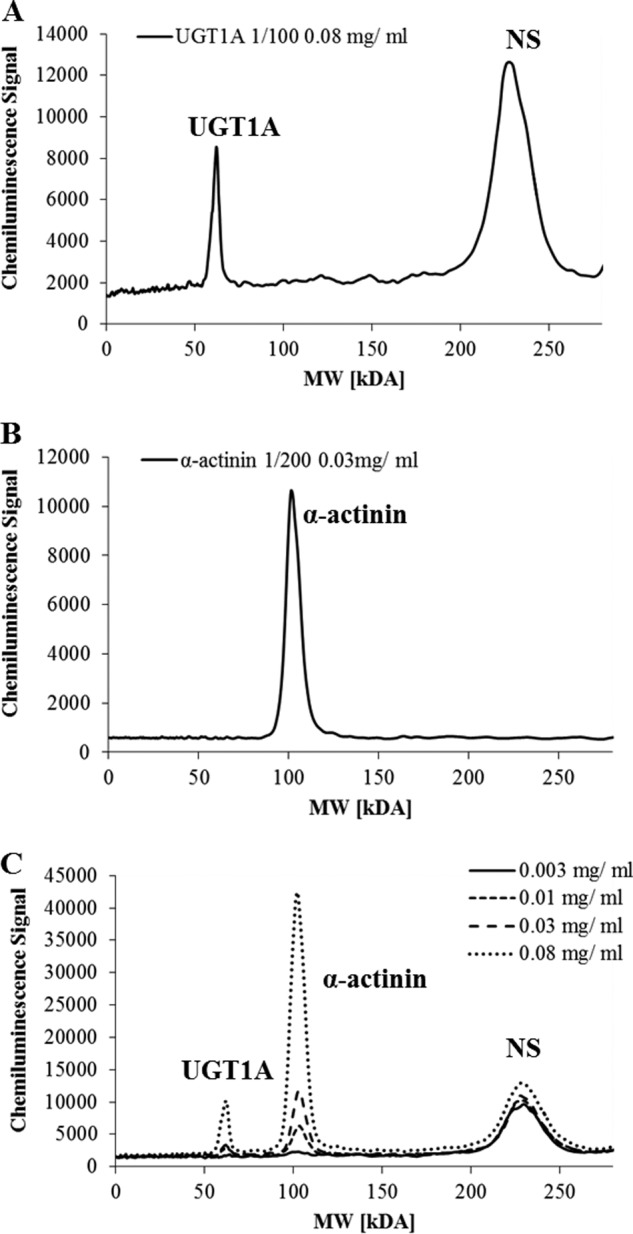
Specificity of antibodies used for UGT1A detection (A) and α-actinin (B) is shown. C, pherogram view of different amounts of whole cell lysate analyzed for standard curve construction. NS denotes nonspecific interactions of the UGT1A antibody with the fluorescence standards used in the ProteinSimple WES system. Antibody dilution and total protein concentration are indicated.
FIGURE 7.
Effect of chronic DHA supplementation on UGT1A protein levels in HT29-MTX cells detected with the ProteinSimple WES system. A, standard curve of multiplexed UGT1A and α-actinin in whole cell lysate. B, peak areas of UGT1A protein levels detected in whole lysate of cells treated with 50 μm DHA or vehicle for 21 days. (t(6.3) = −4.6, p = 0.003, n = 6.) Error bars represent standard deviation; 400 ng of total protein was loaded per lane. C, reconstructed gel image view of three representative biological replicates for control and DHA-treated samples. D, pherogram view of cell lysates before and after treatment with DHA. NS denotes nonspecific interactions of the UGT1A antibody with the fluorescence standards used in the ProteinSimple WES system.
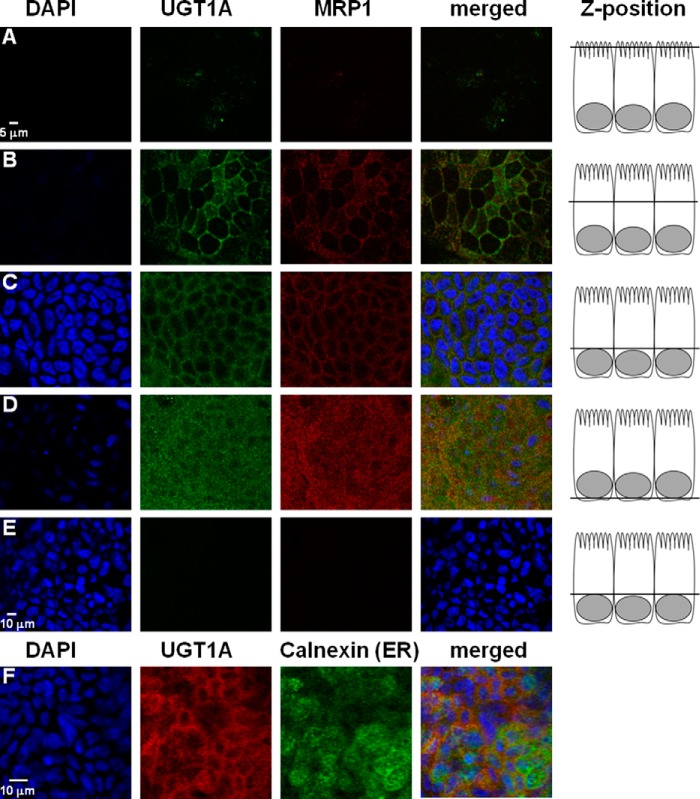
As discussed above, the metabolic pattern indicates that there might be a more complex mechanism to substrate glucuronidation by UGT1A8 than the model of an ER membrane-residing enzyme. Fig. 8 shows that UGT1A(8/10) was detected in the plasma membrane, co-localizing with the plasma membrane marker MRP1. The signal was stronger in lateral and basal membranes than on the apical side. Calnexin staining was used to visualize the ER, which was distributed evenly throughout the cell, and it only partially overlapped with the UGT1A(8/10) staining (Fig. 8F). So far, most UGT isoforms have been described to localize to the ER. Goblet cells have a unique structure with most of the apical lumen being filled with mucus-containing granules and the basolateral lumen holding the nucleus. This conformation leaves little room for cytosolic organelles like the Golgi and the ER, which are consequently very much localized in the peripheral space of the cell, close to the plasma membrane. Considering this spatial peculiarity, it might be that the apparent co-localization of UGT and membrane marker MRP1 is due to the ER-residing UGT being localized just below the plasma membrane (42).
FIGURE 8.
Indirect immunofluorescence staining of UGT1A and MRP1 in HT29-MTX cells grown on permeable supports. Images were taken at 2 μm intervals along the z axis. Rows A–D show representative images of 24 independent experiments. Staining revealed pronounced UGT1A signal in the lateral and basal plasma membrane, very similar to the plasma membrane protein MRP1. Row E shows control cell monolayers incubated with DAPI and secondary antibody only. Row F shows differential staining for UGT1A and ER marker calnexin obtained as a sum of z-slices through the cell.
To confirm whether UGT1A(8/10) spans the outer membrane, cell surface biotinylation and pulldown with streptavidin resin were performed. UGT1A(8/10) protein was detected on the apical and basolateral surface of HT29-MTX cells grown on permeable supports (Fig. 9). The enzyme was more abundant in the lysate from cells incubated with biotin labeled from the basolateral side than in lysate of cells labeled from the apical side. Intracellular protein GAPDH was used as a negative control to monitor cell membrane integrity during biotinylation, and plasma membrane spanning Na+/K+-ATPase was used as a positive control for successful biotinylation and pulldown. No GAPDH could be detected in the apical surface lysate, which confirms the presence of UGT1A in the plasma membrane.
FIGURE 9.

Cell surface biotinylation of HT29-MTX cells. A, specificity of antibodies used for UGT1A and control protein detection with the ProteinSimple SIMON system. B, relative peak area of protein levels detected in surface biotinylation samples after streptavidin pulldown (UGT1A, Na+/K+-ATPase) and in whole cell lysate (GAPDH).
The results described above show that at least some of the UGT1A(8/10) pool is plasma membrane spanning in HT29-MTX cells. It is not clear, however, what the orientation of the enzyme in the plasma membrane is. If it was inserted the same way as into the ER membrane, the enzyme's active site would be facing the extracellular space. If it was inserted the opposite way, the cytoplasmic tail would be outside the cell. In the first case, with the active site facing the extracellular space, the availability of the co-factor UDPGA would be the rate-limiting step of the enzyme reaction. High concentrations of substrate are in contact with the cell surface in transport experiments, but the co-factor would have to be exported from the cytosol to reach the active site of the enzyme. To test whether the active site is exposed to the extracellular space, the glucuronidation rate of substrate epicatechin was measured with and without externally supplied co-factor. Adding UDPGA externally did not increase EC-3′-Glc levels in either the supernatant or the cytosol (Fig. 10), indicating that the UDPGA-binding site of the enzyme is not exposed on the cell surface.
FIGURE 10.
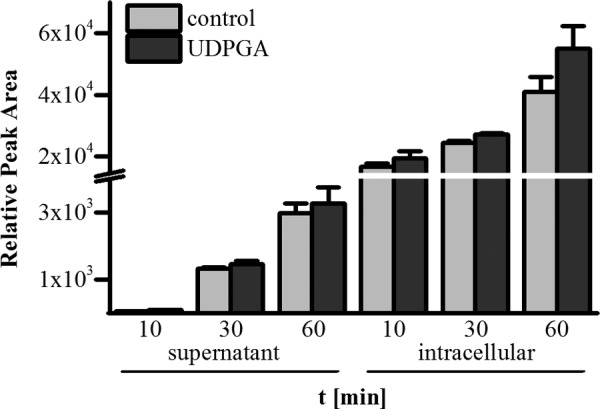
Impact of extracellular UDPGA on EC-3′-Glc formation by HT29-MTX cells. Cells grown on solid supports were incubated with 200 μm epicatechin and 200 μm UDPGA in HBSS + 1.8 mm Ca2+ for 10, 30, and 60 min. Controls were incubated with epicatechin only (n = 3).
DISCUSSION
Previous studies that examined the effect of fatty acids on glucuronidation, using microsomes or animal models, have generated diverse conclusions. In this study, chronic fatty acid supplementation was used to elucidate the impact of lipids on glucuronic acid conjugation, using epicatechin as a model substrate. Epicatechin was preferentially glucuronidated by UGT1A9, which is mainly expressed in liver, and also by UGT1A8, which is extrahepatic and mainly expressed in the small intestine but also in kidney (29, 43–47). In the intestinal Caco-2/HT29-MTX model, UGT1A8 and 1A10 were the most abundant isoforms. UGT1A8 expression was much higher in HT29-MTX than in Caco-2 cells. In the small intestine, UGT1A1 and UGT1A10 are the dominant isoforms of the UGT1A family (20, 48). HT29-MTX cells are goblet cells and one of five different cell types present in the intestine where it only amounts to 10–15% of the mucosa (49). In total mRNA extracts of intestinal tissue samples, the expression patterns of enterocytes would be predominant as they are the major cell types present in that tissue.
Previously, it has not been reported how the gene expression profile of enzymes involved in phase II metabolism varies in the different intestinal cell types. Goblet cells are generally not thought to be extensively involved in nutrient and xenobiotic metabolism. Their main function is to produce and excrete mucus that will act as a diffusion barrier and protect the intestinal epithelium from pathogen invasion, mechanical stress, and injury (50). However, it is possible that some UGT isoforms may serve an alternative function in mucus-secreting cells than in enterocytes, as seen for SULTs. SULTs also conjugate xenobiotics in most cell types, but in goblet cells they sulfonate mucin molecules. The increase of SULT protein along the length of the intestine results in elevated acidity of the intestinal mucus layer toward the colon (51–53).
In metabolism experiments, using the Caco-2/HT29-MTX co-culture, a previously unseen distribution pattern of glucuronic acid conjugates was observed, which was due to the glucuronidation activity of the HT29-MTX cells. There were considerable differences in conjugation rate depending on the transport direction. When the aglycone was applied to the apical side of the cell layer, which in vivo corresponds to the UGT substrate reaching the intestinal mucosa from the gut lumen, glucuronidation was much lower than when aglycone was applied to the basolateral side, which in vivo would correspond to UGT substrate taken up into the mucosa from the submucosa. Glucuronides were preferentially transported to the side of epicatechin application. These observations fit well with results obtained by indirect immunofluorescence staining of HT29-MTX cells for UGT1A as high levels of UGT1A were observed in the lateral and basal parts of the plasma membrane. We hypothesize that after entering the cell, the substrate is readily glucuronidated by UGT localized at the plasma membrane and quickly exported to the extracellular space by basolaterally located efflux transporters. When substrate was applied to the basolateral side, 95% of EC-3′-Glc produced was transported to the basolateral compartment. Such a highly efficient efflux of product suggests that EC-Glc is a potential allocrite of a transporter located in the immediate vicinity of the enzyme (Fig. 11). All UGT isoforms contain a signal peptide at the N terminus, which targets the nascent protein to the ER, and a C-terminal ER retention signal. The signal peptide is cleaved off after insertion of the protein into the ER membrane. However, it is still not entirely clear which sequence elements retain the UGT protein in the ER. It has been shown that the transmembrane domain and the cytosolic tail act as stop sequences that anchor the enzyme in the ER membrane and that the cytosolic tail contains a retrieval signal that targets any escaped protein for transport from the Golgi back to the ER. When the transmembrane domain and cytosolic tail were fused with the extracellular domain of CD4, this plasma membrane protein became the ER resident (54). However, neither deleting the N-terminal signal peptide nor removing the cytosolic tail and transmembrane domain had an impact on UGT1A6 ER localization. Instead, it was the internal membrane anchoring region that played a vital role in ER localization of that UGT enzyme (55, 56).
FIGURE 11.
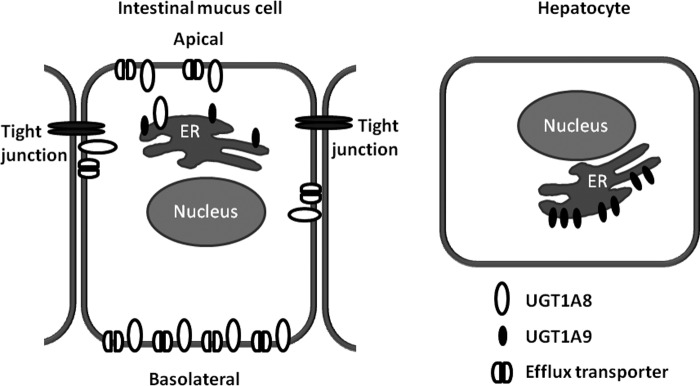
Model showing proposed UGT1A8 and UGT1A9 localization in hepatocytes and intestinal mucus cells.
Some reports have also detected UGT protein or activity in the nuclear envelope and the Golgi (57–59). Early studies even found UGT activity in the plasma membrane of liver cells (60–62). In this study, a stronger signal and activity were associated with the basolateral membrane, whereas in another report with a similar staining pattern of intestinal tissue samples, the strongest signal was toward the apical surface of crypt cells (63, 64). The presence of the mucus layer produced by HT29-MTX cells could restrict diffusion of the antibody to the apical but not the basolateral cell surface, in comparison with intestinal samples that are sliced and stained along the lateral axis.
All UGT1A isoforms are alternative splice variants from a single gene locus with only the first N-terminal exon being unique for each isoform and exons 2–5 being shared among all UGT1A forms. A number of single nucleotide polymorphisms (SNPs) have been reported for all UGT isoforms. Eight different mutations have been described for UGT1A8, leading to three allelic variants. All three alleles were cloned and expressed in HEK293 cells, but none of them were localized in the plasma membrane (65). One mutation in the signal peptide region (T4A) of UGT1A8 has been reported but not cloned and expressed in vitro (66). Several studies observed that the enzymes translated from the three different alleles had different glucuronidation activity. UGT1A8*1 and UGT1A8*2 (A173G) have similar activity, whereas UGT1A8*3 (C277Y) only shows very low activity (9, 65) and has been identified as a risk factor in colorectal cancer (67). UGT1A8*3 occurs with low frequency in the general population but is much more abundant in tumor cells. Because most cell lines are carcinoma-derived, such increased abundance of this low activity allele might help to explain some inconsistencies between in vivo and in vitro results.
Fatty acids have previously been shown to up-regulate expression of some UGTs in vivo. Interestingly, DHA treatment increased expression of UGT1A8 in HepG2 and HT29-MTX cells but not of UGT1A9, even though DHA has been shown to increase PPARα activity in Caco-2 cells (68), and UGT1A9 expression was shown to be up-regulated with increased PPARα activity (32).
In summary, it was shown that HT29-MTX cells display a unique distribution of UGT1A8/10 protein in the plasma membrane, with UGT1A8 showing a functional catalytic localization to the basolateral membrane. Further studies will have to show whether this is a common feature of mucus cells that has so far been overlooked because most studies on UGT activity and localization have been conducted using liver cells where that particular isoform is not expressed.
Footnotes
- UGT
- UDP-glucuronosyltransferase
- DHA
- docosahexaenoic acid
- PPAR
- peroxisome proliferator-activated receptor
- SULT
- sulfotransferase
- ER
- endoplasmic reticulum
- PUFA
- polyunsaturated fatty acid
- UDPGA
- UDP-glucuronic acid
- HBSS
- Hanks' buffered saline solution
- EC-3′-Glc
- epicatechin-3′-glucuronide
- epicatechin
- (−)-epicatechin.
REFERENCES
- 1. Rouleau M., Collin P., Bellemare J., Harvey M., Guillemette C. (2013) Protein-protein interactions between the bilirubin-conjugating UDPglucuronosyltransferase UGT1A1 and its shorter isoform 2 regulatory partner derived from alternative splicing. Biochem. J. 450, 107–114 [DOI] [PubMed] [Google Scholar]
- 2. Rowland A., Miners J. O., Mackenzie P. I. (2013) The UDP-glucuronosyltransferases: Their role in drug metabolism and detoxification. Int. J. Biochem. Cell Biol. 45, 1121–1132 [DOI] [PubMed] [Google Scholar]
- 3. Grosse L., Campeau A.-S., Caron S., Morin F.-A., Meunier K., Trottier J., Caron P., Verreault M., Barbier O. (2013) Enantiomer selective glucuronidation of the non-steroidal pure anti-androgen bicalutamide by human liver and kidney: role of the human UDP-glucuronosyltransferase (UGT)1A9 enzyme. Basic Clin. Pharmacol. Toxicol. 113, 92–102 [DOI] [PMC free article] [PubMed] [Google Scholar]
- 4. Gill K. L., Houston J. B., Galetin A. (2012) Characterization of in vitro glucuronidation clearance of a range of drugs in human kidney microsomes: comparison with liver and intestinal glucuronidation and impact of albumin. Drug Metab. Dispos. 40, 825–835 [DOI] [PMC free article] [PubMed] [Google Scholar]
- 5. Malfatti M. A., Wu R. W., Felton J. S. (2005) The effect of UDP-glucuronosyltransferase 1A1 expression on the mutagenicity and metabolism of the cooked-food carcinogen 2-amino-1-methyl-6-phenylimidazo 4,5-b pyridine in CHO cells. Mutat. Res. 570, 205–214 [DOI] [PubMed] [Google Scholar]
- 6. Leung H. Y., Wang Y., Leung L. K. (2007) Differential effect of over-expressing UGT1A1 and CYP1A1 on xenobiotic assault in MCF-7 cells. Toxicology 242, 153–159 [DOI] [PubMed] [Google Scholar]
- 7. Xu L., Krenitsky D. M., Seacat A. M., Butenhoff J. L., Tephly T. R., Anders M. W. (2006) N-Glucuronidation of perfluorooctanesulfonamide by human, rat, dog, and monkey liver microsomes and by expressed rat and human UDP-glucuronosyltransferases. Drug Metab. Dispos. 34, 1406–1410 [DOI] [PubMed] [Google Scholar]
- 8. Jenkinson C., Petroczi A., Naughton D. P. (2013) Effects of dietary components on testosterone metabolism via UDP-glucuronosyltransferase. Front. Endocrinol. 4, 80. [DOI] [PMC free article] [PubMed] [Google Scholar]
- 9. Thibaudeau J., Lépine J., Tojcic J., Duguay Y., Pelletier G., Plante M., Brisson J., Têtu B., Jacob S., Perusse L., Bélanger A., Guillemette C. (2006) Characterization of common UGT1A8, UGT1A9, and UGT2B7 variants with different capacities to inactivate mutagenic 4-hydroxylated metabolites of estradiol and estrone. Cancer Res. 66, 125–133 [DOI] [PubMed] [Google Scholar]
- 10. Kato Y., Ikushiro S., Emi Y., Tamaki S., Suzuki H., Sakaki T., Yamada S., Degawa M. (2008) Hepatic UDP-glucuronosyltransferases responsible for glucuronidation of thyroxine in humans. Drug Metab. Dispos. 36, 51–55 [DOI] [PubMed] [Google Scholar]
- 11. Cheng Z., Radominska-Pandya A., Tephly T. R. (1999) Studies on the substrate specificity of human intestinal UDP-glucuronosyltransferases 1A8 and 1A10. Drug Metab. Dispos. 27, 1165–1170 [PubMed] [Google Scholar]
- 12. Jiménez R., Duarte J., Perez-Vizcaino F. (2012) Epicatechin: endothelial function and blood pressure. J. Agric. Food Chem. 60, 8823–8830 [DOI] [PubMed] [Google Scholar]
- 13. Wu B., Kulkarni K., Basu S., Zhang S., Hu M. (2011) First-pass metabolism via UDP-glucuronosyltransferase: a barrier to oral bioavailability of phenolics. J. Pharm. Sci. 100, 3655–3681 [DOI] [PMC free article] [PubMed] [Google Scholar]
- 14. Ng S. P., Wong K. Y., Zhang L., Zuo Z., Lin G. (2004) Evaluation of the first-pass glucuronidation of selected flavones in gut by Caco-2 monolayer model. J. Pharm. Pharm. Sci. 8, 1–9 [PubMed] [Google Scholar]
- 15. Singh R., Wu B., Tang L., Hu M. (2011) Uridine diphosphate glucuronosyltransferase isoform-dependent regiospecificity of glucuronidation of flavonoids. J. Agric. Food Chem. 59, 7452–7464 [DOI] [PMC free article] [PubMed] [Google Scholar]
- 16. Wong C. C., Barron D., Orfila C., Dionisi F., Krajcsi P., Williamson G. (2011) Interaction of hydroxycinnamic acids and their conjugates with organic anion transporters and ATP-binding cassette transporters. Mol. Nutr. Food Res. 55, 979–988 [DOI] [PubMed] [Google Scholar]
- 17. Trottier J., Verreault M., Grepper S., Monté D., Bélanger J., Kaeding J., Caron P., Inaba T. T., Barbier O. (2006) Human UDP-glucuronosyltransferase (UGT)1A3 enzyme conjugates chenodeoxycholic acid in the liver. Hepatology 44, 1158–1170 [DOI] [PubMed] [Google Scholar]
- 18. Lévesque E., Beaulieu M., Hum D. W., Bélanger A. (1999) Characterization and substrate specificity of UGT2B4 (E-458): a UDP-glucuronosyltransferase encoded by a polymorphic gene. Pharmacogenetics 9, 207–216 [PubMed] [Google Scholar]
- 19. Meech R., Miners J. O., Lewis B. C., Mackenzie P. I. (2012) The glycosidation of xenobiotics and endogenous compounds: versatility and redundancy in the UDP glycosyltransferase superfamily. Pharmacol. Ther. 134, 200–218 [DOI] [PubMed] [Google Scholar]
- 20. Ohno S., Nakajin S. (2009) Determination of mRNA expression of human UDP-glucuronosyltransferases and application for localization in various human tissues by real-time reverse transcriptase-polymerase chain reaction. Drug Metab. Dispos. 37, 32–40 [DOI] [PubMed] [Google Scholar]
- 21. Zakim D., Goldenberg J., Vessey D. A. (1973) Influence of membrane lipids on regulatory properties of UDP-glucuronyltransferase. Eur. J. Biochem. 38, 59–63 [DOI] [PubMed] [Google Scholar]
- 22. Zakim D. (1970) Regulation of microsomal enzymes by phospholipids: 1. Effect of phospholipases and phospholipids on glucose-6-phosphatase. J. Biol. Chem. 245, 4953–4961 [PubMed] [Google Scholar]
- 23. Vessey D. A., Zakim D. (1971) Regulation of microsomal enzymes by phospholipids: 2. Activation of hepatic uridine diphosphate-glucuronyltransferase. J. Biol. Chem. 246, 4649–4656 [PubMed] [Google Scholar]
- 24. Dannenberg A. J., Zakim D. (1992) Dietary lipid regulates the amount and functional state of UDP-glucuronosyltransferase in rat liver. J. Nutr. 122, 1607–1613 [DOI] [PubMed] [Google Scholar]
- 25. Dannenberg A. J., Yang E. K., Aharon D. (1993) Dietary lipids induce phase 2 enzymes in rat small-intestine. Biochim. Biophys. Acta 1210, 8–12 [DOI] [PubMed] [Google Scholar]
- 26. Dannenberg A. J., Yang E. K. (1992) Effect of dietary lipids on levels of UDP-glucuronosyltransferase in liver. Biochem. Pharmacol. 44, 335–340 [DOI] [PubMed] [Google Scholar]
- 27. Kato J., Ikemoto A., Mizutani T. (2003) The effect of dietary fatty acids on the expression levels and activities of hepatic drug metabolizing enzymes. J. Health Sci. 49, 105–114 [Google Scholar]
- 28. Abumrad N. A., Davidson N. O. (2012) Role of the gut in lipid homeostasis. Physiol. Rev. 92, 1061–1085 [DOI] [PMC free article] [PubMed] [Google Scholar]
- 29. Okamura K., Ishii Y., Ikushiro S., Mackenzie P. I., Yamada H. (2006) Fatty acyl-CoA as an endogenous activator of UDP-glucuronosyltransferases. Biochem. Biophys. Res. Commun. 345, 1649–1656 [DOI] [PubMed] [Google Scholar]
- 30. Tsoutsikos P., Miners J. O., Stapleton A., Thomas A., Sallustio B. C., Knights K. M. (2004) Evidence that unsaturated fatty acids are potent inhibitors of renal UDP-glucuronosyltransferases (UGT): kinetic studies using human kidney cortical microsomes and recombinant UGT1A9 and UGT2B7. Biochem. Pharmacol. 67, 191–199 [DOI] [PubMed] [Google Scholar]
- 31. Shibuya A., Itoh T., Tukey R. H., Fujiwara R. (2013) Impact of fatty acids on human UDP-glucuronosyltransferase 1A1 activity and its expression in neonatal hyperbilirubinemia. Sci. Reports 10.1038/srep02903 [DOI] [PMC free article] [PubMed] [Google Scholar]
- 32. Barbier O., Villeneuve L., Bocher V., Fontaine C., Torra I. P., Duhem C., Kosykh V., Fruchart J. C., Guillemette C., Staels B. (2003) The UDP-glucuronosyltransferase 1A9 enzyme is a peroxisome proliferator-activated receptor α and γ target gene. J. Biol. Chem. 278, 13975–13983 [DOI] [PubMed] [Google Scholar]
- 33. Forman B. M., Chen J., Evans R. M. (1997) Hypolipidemic drugs, polyunsaturated fatty acids, and eicosanoids are ligands for peroxisome proliferator-activated receptors α and δ. Proc. Natl. Acad. Sci. U.S.A. 94, 4312–4317 [DOI] [PMC free article] [PubMed] [Google Scholar]
- 34. Kliewer S. A., Sundseth S. S., Jones S. A., Brown P. J., Wisely G. B., Koble C. S., Devchand P., Wahli W., Willson T. M., Lenhard J. M., Lehmann J. M. (1997) Fatty acids and eicosanoids regulate gene expression through direct interactions with peroxisome proliferator-activated receptors α and γ. Proc. Natl. Acad. Sci. U.S.A. 94, 4318–4323 [DOI] [PMC free article] [PubMed] [Google Scholar]
- 35. Vaidyanathan J. B., Walle T. (2002) Glucuronidation and sulfation of the tea flavonoid (−)-epicatechin by the human and rat enzymes. Drug Metab. Dispos. 30, 897–903 [DOI] [PubMed] [Google Scholar]
- 36. Stalmach A., Mullen W., Steiling H., Williamson G., Lean M. E., Crozier A. (2010) Absorption, metabolism, and excretion of green tea flavan-3-ols in humans with an ileostomy. Mol. Nutr. Food Res. 54, 323–334 [DOI] [PubMed] [Google Scholar]
- 37. Auger C., Mullen W., Hara Y., Crozier A. (2008) Bioavailability of polyphenon E flavan-3-ols in humans with an ileostomy. J. Nutr. 138, 1535S–1542S [DOI] [PubMed] [Google Scholar]
- 38. Lesuffleur T., Barbat A., Dussaulx E., Zweibaum A. (1990) Growth adaptation to methotrexate of ht-29 human colon-carcinoma cells is associated with their ability to differentiate into columnar absorptive and mucus-secreting cells. Cancer Res. 50, 6334–6343 [PubMed] [Google Scholar]
- 39. Clarke K. A., Dew T. P., Watson R. E., Farrar M. D., Bennett S., Nicolaou A., Rhodes L. E., Williamson G. (2014) High performance liquid chromatography tandem mass spectrometry dual extraction method for identification of green tea catechin metabolites excreted in human urine. J. Chromatogr. B Analyt. Technol. Biomed. Life Sci. 972, 29–37 [DOI] [PubMed] [Google Scholar]
- 40. Actis-Goretta L., Lévèques A., Giuffrida F., Romanov-Michailidis F., Viton F., Barron D., Duenas-Paton M., Gonzalez-Manzano S., Santos-Buelga C., Williamson G., Dionisi F. (2012) Elucidation of (−)-epicatechin metabolites after ingestion of chocolate by healthy humans. Free Radic. Biol. Med. 53, 787–795 [DOI] [PubMed] [Google Scholar]
- 41. Wong C. C., Meinl W., Glatt H.-R., Barron D., Stalmach A., Steiling H., Crozier A., Williamson G. (2010) In vitro and in vivo conjugation of dietary hydroxycinnamic acids by UDP-glucuronosyltransferases and sulfotransferases in humans. J. Nutr. Biochem 21, 1060–1068 [DOI] [PubMed] [Google Scholar]
- 42. Specian R. D., Oliver M. G. (1991) Functional biology of intestinal goblet cells. Am. J. Physiol. 260, C183–C193 [DOI] [PubMed] [Google Scholar]
- 43. Fallon J. K., Neubert H., Hyland R., Goosen T. C., Smith P. C. (2013) Targeted quantitative proteomics for the analysis of 14 UGT1As and-2Bs in human liver using NanoUPLC-MS/MS with selected reaction monitoring. J. Proteome Res. 12, 4402–4413 [DOI] [PubMed] [Google Scholar]
- 44. Izukawa T., Nakajima M., Fujiwara R., Yamanaka H., Fukami T., Takamiya M., Aoki Y., Ikushiro S., Sakaki T., Yokoi T. (2009) Quantitative analysis of UDP-glucuronosyltransferase (UGT) 1A and UGT2B expression levels in human livers. Drug Metab. Dispos. 37, 1759–1768 [DOI] [PubMed] [Google Scholar]
- 45. Sato Y., Nagata M., Tetsuka K., Tamura K., Miyashita A., Kawamura A., Usui T. (2014) Optimized methods for targeted peptide-based quantification of human uridine 5′-diphosphate-glucuronosyltransferases in biological specimens using liquid chromatography-tandem mass spectrometry. Drug Metab. Dispos. 42, 885–889 [DOI] [PubMed] [Google Scholar]
- 46. Hanioka N., Nonaka Y., Saito K., Negishi T., Okamoto K., Kataoka H., Narimatsu S. (2012) Effect of aflatoxin B1 on UDP-glucuronosyltransferase mRNA expression in HepG2 cells. Chemosphere 89, 526–529 [DOI] [PubMed] [Google Scholar]
- 47. Harbourt D. E., Fallon J. K., Ito S., Baba T., Ritter J. K., Glish G. L., Smith P. C. (2012) Quantification of human uridine-diphosphate glucuronosyl transferase 1A isoforms in liver, intestine, and kidney using nanobore liquid chromatography-tandem mass spectrometry. Anal. Chem. 84, 98–105 [DOI] [PMC free article] [PubMed] [Google Scholar]
- 48. Court M. H., Zhang X., Ding X., Yee K. K., Hesse L. M., Finel M. (2012) Quantitative distribution of mRNAs encoding the 19 human UDP-glucuronosyltransferase enzymes in 26 adult and 3 fetal tissues. Xenobiotica 42, 266–277 [DOI] [PubMed] [Google Scholar]
- 49. Noah T. K., Donahue B., Shroyer N. F. (2011) Intestinal development and differentiation. Exp. Cell Res. 317, 2702–2710 [DOI] [PMC free article] [PubMed] [Google Scholar]
- 50. Johansson M. E., Sjövall H., Hansson G. C. (2013) The gastrointestinal mucus system in health and disease. Nat. Rev. Gastroenterol. Hepatol. 10, 352–361 [DOI] [PMC free article] [PubMed] [Google Scholar]
- 51. Croix J. A., Bhatia S., Gaskins H. R. (2011) Inflammatory cues modulate the expression of secretory product genes, Golgi sulfotransferases and sulfomucin production in LS174T cells. Exp. Biol. Med. 236, 1402–1412 [DOI] [PubMed] [Google Scholar]
- 52. Campbell B. J., Rowe G. E., Leiper K., Rhodes J. M. (2001) Increasing the intra-Golgi pH of cultured LS174T goblet-differentiated cells mimics the decreased mucin sulfation and increased Thomsen-Friedenreich antigen (Galβ1–3GalNacα-) expression seen in colon cancer. Glycobiology 11, 385–393 [DOI] [PubMed] [Google Scholar]
- 53. Forstner J., Roomi N., Khorasani R., Kuhns W., Forstner G. (1991) Effect of reserpine on the histochemical and biochemical properties of rat intestinal mucin. Exp. Mol. Pathol. 54, 129–143 [DOI] [PubMed] [Google Scholar]
- 54. Barré L., Magdalou J., Netter P., Fournel-Gigleux S., Ouzzine M. (2005) The stop transfer sequence of the human UDP-glucuronosyltransferase 1A determines localization to the endoplasmic reticulum by both static retention and retrieval mechanisms. FEBS J. 272, 1063–1071 [DOI] [PubMed] [Google Scholar]
- 55. Ouzzine M., Magdalou J., Burchell B., Fournel-Gigleux S. (1999) An internal signal sequence mediates the targeting and retention of the human UDP-glucuronosyltransferase 1A6 to the endoplasmic reticulum. J. Biol. Chem. 274, 31401–31409 [DOI] [PubMed] [Google Scholar]
- 56. Ouzzine M., Magdalou J., Burchell B., Fournel-Gigleux S. (1999) Expression of a functionally active human hepatic UDP-glucuronosyltransferase (UGT1A6) lacking the N-terminal signal sequence in the endoplasmic reticulum. FEBS Lett. 454, 187–191 [DOI] [PubMed] [Google Scholar]
- 57. Zaleski J., Bansal S. K., Gessner T. (1982) Nuclear membrane-bound UDP-glucuronsyltransferase of rat-liver. Can. J. Biochem. 60, 972–978 [DOI] [PubMed] [Google Scholar]
- 58. Chowdhury J. R., Novikoff P. M., Chowdhury N. R., Novikoff A. B. (1985) Distribution of UDPglucuronosyltransferase in rat tissue. Proc. Natl. Acad. Sci. U.S.A. 82, 2990–2994 [DOI] [PMC free article] [PubMed] [Google Scholar]
- 59. Hauser S. C., Ziurys J. C., Gollan J. L. (1984) Subcellular distribution and regulation of hepatic bilirubin UDP-glucuronyltransferase. J. Biol. Chem. 259, 4527–4533 [PubMed] [Google Scholar]
- 60. Antoine B., Magdalou J., Siest G. (1983) Functional-heterogeneity of UDP-glucuronosyltransferases in different membranes of rat-liver. Biochem. Pharmacol. 32, 2629–2632 [DOI] [PubMed] [Google Scholar]
- 61. Antoine B., Magdalou J., Siest G. (1984) Kinetic-properties of UDP-glucuronosyltransferase(s) in different membranes of rat-liver cells. Xenobiotica 14, 575–579 [DOI] [PubMed] [Google Scholar]
- 62. Magdalou J., Antoine B., Ratanasavanh D., Siest G. (1982) Phenobarbital induction of cytochrome-P-450 and UDP-glucuronosyltransferase in rabbit liver plasma-membranes. Enzyme 28, 41–47 [DOI] [PubMed] [Google Scholar]
- 63. Strassburg C. P., Kneip S., Topp J., Obermayer-Straub P., Barut A., Tukey R. H., Manns M. P. (2000) Polymorphic gene regulation and interindividual variation of UDP-glucuronosyltransferase activity in human small intestine. J. Biol. Chem. 275, 36164–36171 [DOI] [PubMed] [Google Scholar]
- 64. Strassburg C. P., Nguyen N., Manns M. P., Tukey R. H. (1999) UDP-glucuronosyltransferase activity in human liver and colon. Gastroenterology 116, 149–160 [DOI] [PubMed] [Google Scholar]
- 65. Huang Y. H., Galijatovic A., Nguyen N., Geske D., Beaton D., Green J., Green M., Peters W. H., Tukey R. H. (2002) Identification and functional characterization of UDP-glucuronosyltransferases UGT1A8*1, UGT1A8*2, and UGT1A8*3. Pharmacogenetics 12, 287–297 [DOI] [PubMed] [Google Scholar]
- 66. Mojarrabi B., Mackenzie P. I. (1998) Characterization of two UDP-glucuronosyltransferases that are predominantly expressed in human colon. Biochem. Biophys. Res. Commun. 247, 704–709 [DOI] [PubMed] [Google Scholar]
- 67. Wang M., Sun D.-F., Wang S., Qing Y., Chen S., Wu D., Lin Y.-M., Luo J.-Z., Li Y.-Q. (2013) Polymorphic expression of UDP-glucuronosyltransferase UGTlA gene in human colorectal cancer. PLoS One 8, e57045. [DOI] [PMC free article] [PubMed] [Google Scholar]
- 68. Kimura R., Takahashi N., Lin S., Goto T., Murota K., Nakata R., Inoue H., Kawada T. (2013) DHA attenuates postprandial hyperlipidemia via activating PPARα in intestinal epithelial cells. J. Lipid Res. 54, 3258–3268 [DOI] [PMC free article] [PubMed] [Google Scholar]


