

Background: Mothers against decapentaplegic homolog 3 (SMAD3) and FNDC5/irisin are molecules that modulate energy metabolism and body weight regulation.
Results: SMAD3 negatively regulates irisin during exercise and suppresses FNDC5 and PGC-1α in cultured skeletal muscle cells.
Conclusion: SMAD3 suppresses irisin/FNDC5 in skeletal muscle.
Significance: This study sheds light on the poorly understood regulation of irisin/FNDC5 in skeletal muscle.
Keywords: Exercise, Obesity, Skeletal Muscle, SMAD Transcription Factor, Transforming Growth Factor Beta (TGF-B), Irisin
Abstract
Beige adipose cells are a distinct and inducible type of thermogenic fat cell that express the mitochondrial uncoupling protein-1 and thus represent a powerful target for treating obesity. Mice lacking the TGF-β effector protein SMAD3 are protected against diet-induced obesity because of browning of their white adipose tissue (WAT), leading to increased whole body energy expenditure. However, the role SMAD3 plays in WAT browning is not clearly understood. Irisin is an exercise-induced skeletal muscle hormone that induces WAT browning similar to that observed in SMAD3-deficient mice. Together, these observations suggested that SMAD3 may negatively regulate irisin production and/or secretion from skeletal muscle. To address this question, we used wild-type and SMAD3 knock-out (Smad3−/−) mice subjected to an exercise regime and C2C12 myotubes treated with TGF-β, a TGF-β receptor 1 pharmacological inhibitor, adenovirus expressing constitutively active SMAD3, or siRNA against SMAD3. We find that in Smad3−/− mice, exercise increases serum irisin and skeletal muscle FNDC5 (irisin precursor) and its upstream activator peroxisome proliferator-activated receptor γ coactivator 1-α (PGC-1α) to a greater extent than in wild-type mice. In C2C12 myotubes, TGF-β suppresses FNDC5 and PGC-1α mRNA and protein levels via SMAD3 and promotes SMAD3 binding to the FNDC5 and PGC-1α promoters. These data establish that SMAD3 suppresses FNDC5 and PGC-1α in skeletal muscle cells. These findings shed light on the poorly understood regulation of irisin/FNDC5 by demonstrating a novel association between irisin and SMAD3 signaling in skeletal muscle.
Introduction
The dramatic rise in global obesity prevalence is a growing health concern. Obesity is the leading cause of type 2 diabetes mellitus and increases the risk of hypertension, dyslipidemia, and metabolic syndrome in addition to costing the United States $147 billion/year (1–3). Obesity is a multifaceted disease encompassing numerous tissues, but at its core obesity results from an imbalance between energy intake and energy expenditure. Excess calories consumed are stored as triglycerides primarily in white adipose tissue (WAT)2 but also ectopically in liver, muscle, and pancreas resulting in tissue dysfunction and insulin resistance (4, 5). Thus, preventing excessive fat accumulation represents an attractive avenue for obesity therapeutics.
Mammals, including adult humans, have two classes of adipose tissue that function in opposition to WAT to burn stored fat and are a major contributor to the basal metabolic rate (6–11). Brown adipose tissue (BAT) is characterized by high expression of the mitochondrial protein uncoupling protein-1 (UCP-1) and its transcriptional regulator peroxisome proliferator-activated receptor γ coactivator 1-α (PGC-1α) and functions primarily to generate heat (6, 12–14). Beige adipose cells display an intermediate phenotype between WAT and BAT cells and are predominantly found interspersed within WAT and in some instances in skeletal muscle (9, 15). Most interesting to researchers searching for obesity treatments is that an increased abundance of beige adipose cells can be induced by exercise, hormone stimulation, or cold exposure, suggesting that pharmacological intervention may also increase beige adipose cell abundance (15–17).
Irisin is a recently discovered myokine involved in energy metabolism and weight loss by inducing WAT browning through the p38 MAPK and ERK pathways (16, 18). Other studies suggest that irisin may induce browning centrally through a PGC-1α estrogen-related receptor-α BDNF pathway (19, 20). Irisin is a cleavage product of the membrane protein FNDC5 (fibronectin type III domain containing 5) (21, 22) and is a PGC-1α-regulated hormone secreted from skeletal muscle cells during (or following) exercise (16). Subsequent to its discovery, circulating irisin was found in adult humans and shown to be induced by exercise (23–27) and by cold exposure (28). Recently, a series of studies have demonstrated that the TGF-β pathway plays an important role in energy expenditure and body weight regulation (29–32). We previously published that loss of the TGF-β effector protein, SMAD3 (mothers against decapentaplegic homolog 3), results in the transformation of WAT to a BAT-like/beige cell phenotype, thus increasing basal energy expenditure and protecting against high fat diet-induced obesity and type 2 diabetes mellitus (31). However, it is unclear how SMAD3 loss leads to WAT adopting BAT-like/beige cell characteristics. Interestingly, the phenotypic transition from WAT to beige adipose cells in SMAD3-deficient mice is similar to that induced by irisin, and both appear to be regulated by PGC-1α (16, 31). Thus, we sought to explore the hypothesis that SMAD3 regulates the WAT to BAT phenotypic conversion, at least partially, by negatively regulating irisin production and/or secretion from skeletal muscle. We find that exercise increases serum irisin and skeletal muscle FNDC5 and PGC-1α in Smad3−/− mice to a greater extent than in wild-type mice. Following TGF-β treatment in cultured C2C12 myotubes, SMAD3 binds the promoter regions of PGC-1α and FNDC5 associated with a suppression of PGC-1α and FNDC5 mRNA and protein levels. Furthermore, using adenoviral expression of constitutively active SMAD3 and siRNA knockdown of SMAD3 in cultured C2C12 myotubes, we find that TGF-β suppresses PGC-1α and FNDC5 via SMAD3. These data establish SMAD3 as a novel molecular regulator of irisin/FNDC5 transcription and strengthen our previous observations that the SMAD3 pathway plays an integral role in regulating whole body energy homeostasis.
EXPERIMENTAL PROCEDURES
Cell Lines and Drugs
C2C12 mouse myoblasts were cultured in a 5% CO2 incubator at 37 °C in DMEM (Gibco) supplemented with 10% fetal bovine serum (Gemini Bio-Products) and 0.5% penicillin:streptomycin (Gibco). C2C12 cells were differentiated into myotubes by culturing in DMEM (Gibco) supplemented with 10% horse serum (Gemini Bio-Products), 1.0 μm insulin, and 0.5% penicillin:streptomycin. C2C12 cells were seeded to ∼80% confluence and were treated in differentiation media for the indicated amount of time prior to experimentation. The drugs were as follows: TGF-β (1.0 or 10.0 ng/ml), TGF-β receptor-1 inhibitor (SB431543; 1.0 or 10 μm; Sigma) (33) or vehicle (DMSO). TGF-β was kindly provided by Dr. Kathy Flanders (NCI, National Institutes of Health).
Exercising Mice
C57BL/6J male mice were housed with free access to food and water with a 12 h:12 h light:dark cycle and studied between 8 and 25 weeks of age. The generation of Smad3−/− mice has been described previously (34, 35). All animal experiments were approved by the National Institutes of Health Animal Care and Use Committees. All experiments were conducted in accordance with the National Institutes of Health Guide for the Care and Use of Animals. Mice were subjected to one of three exercise regimes between 6 and 15 weeks of age. The three exercise regimes were as follows: free running via voluntary running wheel (3 weeks) (Single Activity Wheel Chamber System, model 80820); forced running on a treadmill (90 min/day, 2–3 weeks, 12–18 meters/min, 10° incline) (Columbus Instruments, Model Eco-6M); and forced swimming in a countercurrent swim tank (90 min/day, 2–3 weeks, 1.2–1.7 liters/min, 30–32 °C) (36). During the duration of the exercising, mice were weighed, and serum was collected. The mice were euthanized at the end of the study for further analysis.
High Fat Diet and Metabolic Studies
Male C57BL/6J mice were weaned onto a high fat diet (20% kcal protein, 20% kcal carbohydrates, and 60% kcal fat; Research Diets Inc.) at 3 weeks of age. Body weight, serum irisin, and serum TGF-β were assessed at the indicated time points. Fat mass was measured using dual energy x-ray absorptiometry. The mice were euthanized at the end of the study for further analysis. Serum irisin and TGF-β were assessed when indicated using an irisin or TGF-β ELISA (Phoenix Pharmaceuticals and R&D Systems, respectively). Blood (20 μl for TGF-β or 50 μl for irisin) was drawn from tail bleed (into heparinized hematocrit tubes; Drummond) and centrifuged (6,000 rpm, 20 min). The supernatant was used in an ELISA.
SDS-PAGE and Immunoblotting
Following treatment, C2C12 cells were washed in PBS, and total protein was extracted following homogenization in lysis buffer (Cell Signaling). Following tissue extraction, 100 μg of tissue was homogenized in lysis buffer (Cell Signaling). Homogenate was centrifuged (4 °C, 14,000 rpm, 15 min), and the supernatant was used to determine protein concentration (Pierce BCA protein assay kit). Following SDS-PAGE (12–50 μg of protein), protein was transferred onto a PVDF membrane (PALL Life Sciences) and blocked (5% milk, 90 min). Membranes were incubated with primary antibodies (overnight, 4 °C) on a rocker. Immunoblotting primary antibodies were monoclonal rabbit anti-phospho-Smad3 (Ser-423/425) (1:500) (Abcam), polyclonal rabbit anti-Smad3 (1:400) (Abcam), polyclonal rabbit anti-FNDC5 (1:1000) (Abcam), polyclonal rabbit anti-PGC-1 (1:400) (Santa Cruz), and monoclonal rabbit anti-GAPDH (1:4000) (Cell Signaling Technology). Following primary incubation, membranes were washed (once for 5 min, TBS + 0.1% Tween 20) and incubated with secondary antibodies (45 min, room temp.). Secondary antibodies were horseradish peroxidase-conjugated goat anti-mouse or goat anti-rabbit. Following secondary incubation, membranes were washed (three times for 10 min, TBS + 0.1% Tween 20), and detection of immunoreactive bands was performed using the ECL Western blotting substrate (GE Healthcare). Western blots were quantified with ImageJ software and normalized to GAPDH or total SMAD3.
Chromatin Immunoprecipitation
ChIP was performed using the ChIP-IT Express kit according to the manufacturer's instructions (Active Motif). Following treatment, C2C12 cells were fixed in 1.0% formaldehyde (25 °C, 10 min), washed (10 s, PBS), and scraped in ice-cold PBS. Following centrifugation (4 °C, 2,500 rpm, 10 min) the pellet was lysed, homogenized using a Dounce homogenizer, and centrifuged (4 °C, 5,000 rpm, 10 min). The pellet was resuspended in shearing buffer, and the DNA was sheared by sonication (Branson Sonifier 250; 15 pulses, 20 s) and centrifuged (4 °C, 14,000 rpm, 10 min). The chromatin in the supernatant was immunoprecipitated with polyclonal rabbit anti-Smad3 antibody (Abcam, ab28379) (40 μg of chromatin, 2 μg of antibody, 4 °C, overnight) and washed (three times for 10 s, ChIP buffers 1 and 2). The chromatin was eluted (elution buffer AM2), reverse cross-linked (reverse cross-linking buffer, 95 °C, 15 min), purified using phenol/chloroform/isoamyl alcohol (25:24:1) (Invitrogen), washed in 70% EtOH, and dissolved in distilled H2O. Promoter occupancy was determined by quantitative real time PCR. Primer sequences (Integrated DNA Technologies) are available upon request.
Quantitative Real Time PCR
Total RNA was extracted from cells or tissue in TRIzol reagent (Invitrogen), washed in 75% EtOH, and dissolved in distilled H2O. 1.0 μg of RNA was reverse transcribed using iScript cDNA synthesis kit (Bio-Rad) with random hexamers (iCycler; Bio-Rad). mRNA expression of target genes was quantified using Power SYBR Green PCR Master Mix (Applied Biosystems). mRNA expression was normalized to β-actin expression. Primer sequences (Integrated DNA Technologies) are available upon request.
Adenoviral Transduction
C2C12 cells were transduced with adenovirus (multiplicity of infection of 100) harboring constitutively active SMAD3 (CA-SMAD3) on day 1 of differentiation. After 48 h, cells were treated with respective drugs for an additional 24 h. Following treatment, cells were washed (1× PBS), and RNA was extracted as above. CA-SMAD3 was kindly provided by Dr. Ying Zhang (NCI, National Institutes of Health) (37).
siRNA Knockdown of SMAD3
C2C12 cells were plated in 12-well plates (40 × 103cells/well) and differentiated for 4 days. The cells were transfected on day 1 of differentiation for 48 h with 0.2 μl of DharmaFECT transfection reagent (Dharmacon) and 25 nm of control or SMAD3 siRNA (Dharmacon) in 0.5 ml of medium. 48 h after transfection, cells were treated with respective drugs for 24 h. Following treatment cells were washed (once in PBS), and RNA was extracted as above.
Luciferase Assay
C2C12 mouse myoblasts were plated in 24-well plates (15 × 103cells/well) and differentiated for 4 days. Cells were transfected on day 2 of differentiation for 24 h with 3 μl of X-tremeGENE HP DNA transfection reagent (Roche) and 1.0 μg of GAGA-Luc in 0.5 ml of medium. 24 h after transfection cells were treated with respective drugs for 24 h. Following treatment cells were washed (once with PBS), lysed with Promega cell culture lysis reagent, and centrifuged (4 °C, 14,000 rpm, 10 min), and protein concentration was determined (Pierce BCA protein assay kit). Luciferase assay (Promega) was performed according to manufactures instructions. Values are reported as relative luciferase units corrected for protein concentration.
Statistical Analysis
All results are presented as means ± S.E. unless otherwise stated. All data were analyzed using the unpaired two-tailed Student's t test. A value of p < 0.05 was considered statistically significant.
RESULTS
Previous studies in our laboratory have shown that the TGF-β effector protein SMAD3 is a crucial regulator of energy homeostasis and body weight regulation. Loss of SMAD3 is protective against high fat diet-induced obesity and type 2 diabetes mellitus. This is attributed to WAT browning leading to increased energy expenditure and decreased fat accumulation (31). Irisin is a PGC-1α-induced myokine secreted from skeletal muscle following exercise and acts on WAT to induce browning, similarly to that observed in SMAD3-deficient mice (16, 31). Thus, we investigated whether the SMAD3 pathway negatively regulates irisin production and/or secretion from skeletal muscle.
Serum Irisin and Muscle FNDC5 Are Regulated by SMAD3
To determine whether SMAD3 is involved in the regulation of FNDC5 and PGC-1α, we used SMAD3 knock-out (Smad3−/−) mice. Compared with lean sedentary WT mice, lean sedentary Smad3−/− mice showed a slight trend for increased serum irisin and skeletal muscle FNDC5 protein expression (Fig. 1, A and B). Because irisin is an exercise-regulated hormone, we exercised a group of WT and Smad3−/− mice on a treadmill for 90 min/day for 2 weeks. In contrast to sedentary mice, when Smad3−/− mice were subjected to 2 weeks of exercise, they showed a 145% increase in serum irisin compared with a 50% increase in exercised WT control mice (Fig. 1C). In addition, exercised Smad3−/− mice showed higher skeletal muscle PGC-1α and FNDC5 protein levels compared with exercised WT mice (Fig. 1D).
FIGURE 1.

Serum irisin and muscle FNDC5 are regulated by SMAD3. A, serum irisin in lean sedentary male WT and Smad3−/− mice (n = 5–25 mice). B, protein expression and quantification in quadriceps muscle of lean sedentary male WT and Smad3−/− mice (n = 5–25 mice). C, serum irisin following 1 week of treadmill exercise in lean WT and Smad3−/− male and female mice (n = 6–8 mice). D, protein expression and quantification in quadriceps muscle of exercised mice from C. The results represent the means ± S.E. (versus WT mice when not indicated). E–G, C2C12 myoblasts were differentiated into myotubes for 3 days prior to treatment with TGF-β or TGF-βR1 inhibitor (SB431543) for 24 h (the results are from at least three experiments). Cells were harvested on day 4 for mRNA and protein analysis. F and G, effects of TGF-β or SB431543 treatments (24 h) on gene (F) and protein (G) expression in C2C12 myotubes. The samples from the PGC-1α representative image were run on the same gel but were noncontinuous. The results represent the means ± S.E. (versus differentiation (Diff.) media vehicle). #, <0.08; *, p < 0.05; **, p < 0.01; ***, p < 0.001.
TGF-β Suppresses FNDC5 and PGC-1α in Cultured Skeletal Muscle Cells
To understand the role of SMAD3 signaling in irisin production and/or secretion in more detail, we used the in vitro model system of mouse C2C12 myoblasts treated with TGF-β, the predominate SMAD3 activator (38). C2C12 myoblasts can be differentiated into mature myotubes; thus, we explored first the effects of SMAD3 activation or inhibition on differentiated mature C2C12 myotubes and second the effects of SMAD3 activation or inhibition on C2C12 myoblasts treated during the process differentiation into myotubes. C2C12 myoblasts were differentiated for 3 days into myotubes and then treated with TGF-β or an inhibitor for TGF-β receptor 1 (TGF-βR1) for 1 day (Fig. 1E). Compared with undifferentiated C2C12 myoblasts, differentiated C2C12 myotubes have increased mRNA levels and protein expression of PGC-1α and FNDC5 (Fig. 1, F and G). Treatment of differentiated C2C12 myotubes with TGF-β suppressed PGC-1α and FNDC5 mRNA levels and FNDC5 protein expression, whereas treatment with TGF-βR1 inhibitor led to an increase in PGC-1α mRNA levels (Fig. 1, F and G). In differentiated C2C12 myotubes, the TGF-β suppression of PGC-1α mRNA began early at 4 h, whereas the suppression of FNDC5 mRNA was not observed until later at 8 h (Fig. 2A). A similar time-dependent effect was observed following inhibition of TGF-βR1; PGC-1α mRNA increased early at 4 h. However, FNDC5mRNA decreased later at 24 h. C2C12 myoblasts were then differentiated into myotubes for 4 days in the presence of TGF-β or TGF-βR1 inhibitor (Fig. 3A). Compared with treatments after differentiation of myoblasts into myotubes (Figs. 1, E–G, and 2), continual treatment with TGF-β during differentiation of C2C12 myoblasts into myotubes (Fig. 3, A–C) suppressed PGC-1α and FNDC5 mRNA levels and protein expression to a much greater extent, whereas treatment with TGF-βR1 inhibitor led to a greater increase in PGC-1α and FNDC5 mRNA levels (compare Fig. 1F with Fig. 3B). Lastly, SMAD7 mRNA levels, a positive control for SMAD3 activation, were increased by TGF-β and suppressed by TGF-βR1 inhibitor, whereas Myf5 mRNA levels, a positive control for C2C12 myoblasts differentiation into myotubes, were increased following differentiation (Figs. 1F, 2, A and B, and 3B). These results suggest that SMAD3 may suppress PGC-1α and FNDC5 mRNA levels and protein expression in cultured muscle cells and that the negative regulation by SMAD3 is most effective during muscle differentiation (compare Fig. 1F with Fig. 3B).
FIGURE 2.

TGF-β suppresses FNDC5 expression in cultured skeletal muscle cells in a time-dependent manner. A and B, C2C12 myoblasts were differentiated into myotubes for 3 days prior to treatment with TGF-β or TGF-βR1 inhibitor (SB431543) for 24 h. The cells were harvested on day 4 for mRNA and protein analysis. A, time course of TGF-β treatments on gene expression in C2C12 myotubes. B, time course of SB431543 treatments on gene expression in C2C12 myotubes (the results are from at least three experiments). The results represent the means ± S.E. (versus differentiation (Diff.) media vehicle). #, <0.08; *, p < 0.05; **, p < 0.01; ***, p < 0.001.
FIGURE 3.

SMAD3 binds the promoter regions of FNDC5 and PGC-1α in cultured skeletal muscle cells. A–E, C2C12 myoblasts were differentiated into myotubes for 4 days in the continued presence of TGF-β or TGF-βR1 inhibitor (SB431543). The cells were harvested on day 4 for mRNA and protein analysis. Undiff., undifferentiated. B and C, effects of TGF-β or SB431543 treatments (96 h) on gene (B) and protein (C) expression in differentiating C2C12 myoblasts. The samples from the FNDC5 representative image were run on the same gel but were noncontinuous (the results are from at least three experiments). D and E, effects of TGF-β treatments (96 h) on SMAD3 occupancy of the PGC-1α and FNDC5 promoter in differentiating C2C12 myoblasts. Graphs represent relative expression of PGC-1α and FNDC5 promoter DNA following ChIP. D, PGC-1α promoter occupancy by SMAD3. The right graph represents promoter region −125 to +32, and the left graph represents promoter region −7280 to −7083. E, FNDC5 promoter occupancy by SMAD3. The right graph represents promoter region −805 to −675, and the left graph represents promoter region −3197 to −3061 (the results are from two experiments). The results represent the means ± S.E. (versus differentiation (Diff.) media vehicle). #, <0.08; *, p < 0.05; **, p < 0.01; ***, p < 0.001.
SMAD3 Binds the Promoter Regions of FNDC5 and PGC-1α in Cultured Skeletal Muscle Cells
We next inquired whether the changes in expression of PGC-1α and FNDC5 transcripts were a direct effect of SMAD3 binding to their respective promoters (38). We have previously demonstrated that SMAD3 binds the PGC-1α promoter and suppresses its activity in cultured 3T3-L1 adipose cells (31). To investigate whether SMAD3 was suppressing PGC-1α and FNDC5 mRNA levels in C2C12 myotubes by binding to and inhibiting their respective promoters, we performed ChIP against SMAD3 in C2C12 myotubes. C2C12 myoblasts were differentiated for 4 days into myotubes in the presence of TGF-β (Fig. 3A). Compared with undifferentiated C2C12 myoblasts, differentiated C2C12 myotubes have slightly increased SMAD3 binding to the PGC-1α and FNDC5 promoter (Fig. 3, D and E). During differentiation of C2C12 myoblasts into myotubes, treatment with TGF-β increased SMAD3 binding to the PGC-1α and FNDC5 promoter (Fig. 3, D and E) that was associated with suppressed PGC-1α and FNDC5 mRNA levels (Fig. 3B). These results demonstrate that SMAD3 binds the promoter regions of PGC-1α and FNDC5 and suggests that SMAD3 suppresses PGC-1α and FNDC5 mRNA levels by inhibiting the activation of their respective promoters.
FNDC5 and PGC-1α Are Regulated by SMAD3 in Cultured Skeletal Muscle Cells
We have shown that SMAD3 regulates irisin/FNDC5 in vivo (Fig. 1, A–D) and established in a cell culture system that SMAD3 potentially suppresses FNDC5 and PGC-1α by inhibiting their respective promoters. To further demonstrate that SMAD3 suppresses FNDC5 and PGC-1α in skeletal muscle, we used siRNA to knock down SMAD3 and an adenovirus harboring constitutively active (CA)-SMAD3 to overexpress CA-SMAD3 in C2C12 myotubes (37). C2C12 myoblasts were differentiated for 3 days into myotubes in the presence of SMAD3 siRNA and then treated with TGF-β or a TGF-βR1 inhibitor for 1 day (Fig. 4A). Compared with transfection of C2C12 myotubes with nontargeting siRNA, transfection with siRNA against SMAD3 knocked down SMAD3 mRNA levels and protein levels by 30 and 38%, respectively (Fig. 4, B and C). Although the siRNA only modestly knocked down SMAD3 protein levels, it was sufficient to block 50% of SMAD3 activity as assessed by a SMAD3 luciferase reporter construct and 48% of SMAD3 activity as assessed by expression of the SMAD3 target gene SMAD7 (Fig. 4, D and E). Treatment of C2C12 myotubes transfected with a SMAD3 luciferase reporter construct with TGF-β increased luciferase activity, whereas treatment with TGF-β together with either TGF-βR1 inhibitor or SMAD3 siRNA prevented the increase in luciferase activity (Fig. 4D). Transfection of differentiating C2C12 myotubes with SMAD3 siRNA suppressed the mRNA levels of the SMAD3 target gene SMAD7 (Fig. 4E) and blocked the TGF-β induced increase in SMAD7 mRNA levels (Fig. 4E). These data demonstrate the effectiveness of SMAD3 siRNA in knocking down and inhibiting SMAD3 activity (Fig. 4, B–E). Compared with nontargeting siRNA, SMAD3 siRNA had no effect on FNDC5 or PGC-1α mRNA levels (Fig. 4E). Treatment with TGF-β suppressed FNDC5 and PGC-1α mRNA levels, and this suppression was prevented by SMAD3 siRNA knockdown (Fig. 4E). These results demonstrate the requirement for SMAD3 in the TGF-β-mediated suppression of FNDC5 and PGC-1α mRNA levels.
FIGURE 4.

FNDC5 and PGC-1α are regulated by SMAD3 in cultured skeletal muscle cells. A–H, C2C12 myoblasts were transfected with nontargeting control siRNA or siRNA against SMAD3 or transduced with control adenovirus harboring green fluorescent protein or adenovirus harboring CA-SMAD3 during differentiation into myotubes and then treated (24 h) with TGF-β or TGF-βR1 inhibitor (SB431543) continuously during the last day of differentiation. Diff., differentiated; Undiff., undifferentiated. B and C, mRNA and protein expression in differentiated C2C12 myoblasts transfected with siRNA for 72 h. D, relative luciferase activity normalized to protein levels in differentiated C2C12 myoblasts transfected with a GAGA-Luc expression plasmid, transfected with siRNA and treated (24 h) with TGF-β or SB431543. E, effects of TGF-β treatment (24 h) on gene expression in C2C12 myotubes. F, relative luciferase activity normalized to protein levels in differentiated C2C12 myoblasts transfected with a GAGA-Luc expression plasmid, transduced with adenovirus, and treated (24 h) with TGF-β or SB431543. G, mRNA expression in differentiated C2C12 myoblasts transduced with adenovirus for 72 h. H, effects of TGF-β and SB431543 treatments (24 h) on gene expression in C2C12 myotubes (the results are from at least three experiments). The results represent the means ± S.E. (versus differentiation media vehicle when not indicated). #, <0.08; *, p < 0.05; **, p < 0.01; ***, p < 0.001.
C2C12 myoblasts were differentiated for 3 days into myotubes in the presence of CA-SMAD3 and then treated with TGF-β or a TGF-βR1 inhibitor for 1 day (Fig. 4A). Transduction of C2C12 myotubes with adenovirus harboring constitutively active SMAD3 led to a greater than 10-fold increase in SMAD3 mRNA compared with adenovirus harboring green fluorescent protein (Fig. 4G). Treatment of C2C12 myotubes transfected with a SMAD3 luciferase reporter construct with TGF-β increased luciferase activity, whereas treatment with TGF-β together with a TGF-βR1 inhibitor prevented the increase in luciferase activity (Fig. 4F). Adenoviral transduction with CA-SMAD3 increased luciferase activity to a much greater extent than TGF-β treatment, and the luciferase activity was not blocked by treatment with a TGF-βR1 inhibitor (Fig. 4F). Furthermore, adenoviral transduction of differentiating C2C12 myotubes with CA-SMAD3 increased mRNA levels of the SMAD3 target gene SMAD7 (Fig. 4H) and blocked the TGF-βR1 inhibitor-induced suppression of SMAD7 mRNA levels (Fig. 4H). These data demonstrate the effectiveness of overexpressing CA-SMAD3 in increasing SMAD3 activity (Fig. 4, F–H). Adenoviral transduction of differentiating C2C12 myotubes with CA-SMAD3 suppressed PGC-1α and FNDC5 mRNA levels similar to TGF-β treatment (Fig. 4H). Treatment with TGF-βR1 inhibitor led to an increase in FNDC5 and PGC-1α mRNA levels, and this increase was prevented by CA-SMAD3 expression (Fig. 4H). Taken together with the siRNA data (Fig. 4, B–E) and the data from Smad3−/− mice (Fig. 1, A–D), these results further demonstrate that SMAD3 suppresses both PGC-1α and FNDC5 levels.
Exercise Increases Serum Irisin and Skeletal Muscle FNDC5 and Induces Browning in Subcutaneous Adipose Tissue
Published reports show that the role of SMAD3 signaling in regulating energy homeostasis, WAT browning, and body weight is most pronounced under conditions of metabolic stress such as prolonged cold exposure or high fat feeding (30, 31). Before investigating the role of SMAD3 in regulating irisin in obese mice, we first established an exercise regime that led to increased irisin and WAT browning in lean mice. It was previously reported that mice exercised with free running wheels or in a countercurrent swim tank have increased serum irisin causing WAT browning (16). We began our study using three types of exercise (free running wheels, treadmill, and countercurrent swim tank) to determine which model gives the strongest increase in irisin for further experimentation. For the treadmill and swimming models, mice were exercised for 3 weeks at 90 min/day, and we found that compared with sedentary mice, both treadmill- and swimming-exercised mice showed a 33% increase in serum irisin at week 2 along with an increase in the area under the curve over the 3 weeks of exercise (Fig. 5, A and B). However, only the treadmill-exercised mice showed an associated increase in FNDC5 mRNA expression levels and protein expression in skeletal muscle (Fig. 5, C–E). Both treadmill- and swimming-exercised mice showed similar increases in skeletal muscle PGC-1α mRNA levels and protein expression, demonstrating the effectiveness of the exercise regimes. The increase in serum irisin was associated with increased subcutaneous WAT browning markers in exercised mice (Fig. 5F). Thus, compared with sedentary mice, exercised mice have increased expression of the BAT markers PGC-1α; its downstream target UCP-1, the major protein responsible for nonshivering thermogenesis; and PRDM16 (PR domain containing 16), the transcriptional regulator of BAT differentiation (39) (Fig. 5F). For the free running model, mice had free access to a running wheel for 3 weeks. Although FNDC5 and PGC-1α protein levels were increased after 3 weeks of voluntary running, there was no increase in serum irisin (Fig. 5, D and E, and data not shown). Because treadmill exercise gave the strongest serum irisin and skeletal muscle FNDC5 response, it was used for the high fat diet (HFD) study below.
FIGURE 5.

Exercise increases serum irisin and skeletal muscle FNDC5 and induces browning in subcutaneous adipose tissue of lean mice. A, percent increase in serum irisin during 3 weeks of treadmill or swimming exercise in wild-type male mice. *, treadmill versus sedentary; §, swimming versus sedentary. B, area under the curve (AUC) of the absolute serum irisin values (ng/ml) over 3 weeks of exercise. C, gene expression in quadriceps muscle of mice from A following 3 weeks of exercise. D and E, protein expression and quantification in quadriceps muscle of mice from A plus an additional group of mice exercised by free running for 3 weeks. F, gene expression of brown adipose tissue markers in subcutaneous fat of mice from A (n = 8 mice per group). The results represent the means ± S.E. (versus sedentary mice). #, <0.08; *, p < 0.05; **, p < 0.01; ***, p < 0.001.
Irisin Is Inversely Correlated with SMAD3 in Exercised Obese Mice
To explore the role of SMAD3 signaling in regulating irisin production and/or secretion under conditions of metabolic stress, we fed one group of mice a 60% HFD for 9 weeks and obtained a second group of age-matched lean mice fed a normal chow diet (NCD). Both groups of mice were exercised by treadmill for 2 weeks. Compared with normal chow fed mice, HFD feeding led to increased body weight, predominately composed of adipose tissue, and mild hyperglycemia, demonstrating the effectiveness of the HFD (Fig. 6, A–C). Two weeks of treadmill exercise produced similar increases in serum irisin in both lean and HFD-fed mice compared with sedentary control mice (Fig. 6, D and E). The increased serum irisin in exercised lean and HFD-fed mice was associated with increased skeletal muscle PGC-1α and FNDC5 mRNA levels (Fig. 6F). Compared with sedentary controls, only the exercised HFD-fed mice showed a decrease in serum TGF-β levels (Fig. 6, G and H).
FIGURE 6.

Irisin is negatively correlated with pSMAD3 in exercised obese mice. A, body weight measured in age matched male wild-type mice fed a NCD and male wild-type mice fed a HFD at the indicated time points. B and C, fat mass (B) and fasting blood glucose (C) in mice from A measured at 9 weeks. D, area under the curve (AUC) of the absolute serum irisin values (ng/ml) over 2 weeks of exercise. E, percent increase in serum irisin during 2 weeks of treadmill exercise in mice from A. *, NCD treadmill versus NCD sedentary; §§, HFD treadmill versus HFD sedentary. F, gene expression in quadriceps muscle of mice from A following 2 weeks of treadmill exercise. G, serum TGF-β levels in mice from A following 1 week of treadmill exercise. H, percent decrease in serum TGF-β in mice from A following 1 week of treadmill exercise. I, protein expression and quantification in quadriceps muscle of mice from A (n = 6–8 mice per group). The results represent the means ± S.E. (versus NCD sedentary mice when not indicated). #, <0.08; *, p < 0.05; **, p < 0.01; ***, p < 0.001.
We last investigated whether SMAD3 may play a role in the negative regulation of irisin in vivo. Compared with sedentary lean mice, sedentary HFD-fed mice show increased skeletal muscle total SMAD3 and phosphorylated SMAD3 (pSMAD3) (Fig. 6I). Exercised lean mice, compared with sedentary mice, showed an increase in pSMAD3 and total SMAD3 (Fig. 6I). In contrast to exercised lean mice, in which pSMAD3 was increased, exercised HFD-fed mice showed reduced pSMAD3, whereas total SMAD3 levels remained unchanged (Fig. 6I). The decreased pSMAD3 in HFD-fed exercised mice is consistent with the decrease in serum TGF-β levels (Fig. 6, G and H) and suggests that SMAD3 negatively regulates irisin production and/or secretion under conditions of metabolic stress such as obesity.
DISCUSSION
Obesity results from an imbalance between energy intake and energy expenditure. Thus, preventing excess energy from being stored as fat in WAT and ectopically in liver, muscle, and pancreas represents an attractive avenue for obesity therapeutics. We previously reported that inhibition of SMAD3 signaling protects against obesity and type 2 diabetes during high fat feeding (31). Here we provide data, using cultured skeletal muscle cells and SMAD3-deficient mice, demonstrating that SMAD3 negatively regulates irisin production and/or secretion from skeletal muscle cells by suppressing FNDC5 and PGC-1α mRNA and protein levels. These data establish SMAD3 as a novel molecular regulator of irisin/FNDC5 transcription in skeletal muscle.
SMAD3 suppresses FNDC5 and PGC-1α in skeletal muscle cells. First, TGF-β treatment, the predominate activator of SMAD3, suppressed while TGF-βR1 inhibition increased FNDC5 and PGC-1α mRNA levels. Second, expression of CA-SMAD3 prevented the TGF-βR1 inhibition-induced increase in FNDC5 and PGC-1α mRNA levels, whereas siRNA knockdown of SMAD3 prevented the TGF-β-induced suppression of FNDC5 and PGC-1α mRNA levels. Third, exercised Smad3−/− mice had increased serum irisin and skeletal muscle FNDC5 and PGC-1α protein levels compared with exercised wild-type mice. Lastly, TGF-β treatment led to SMAD3 binding to the FNDC5 and PGC-1α promoters, suggesting that the inhibition is due to SMAD3 inhibiting FNDC5 and PGC-1α promoter activity. These findings are summarized in Fig. 7. This is the first report of SMAD3 regulating irisin production and/or secretion by suppressing FNDC5 and PGC-1α in skeletal muscle. We and others have previously reported that TGF-β/SMAD3 activation suppresses PGC-1α in 3T3-L1 adipocytes and A549 lung cells, whereas TGF-β3 induces PGC-1α in differentiating human mesenchymal stem cells (31, 40, 41). Thus, our data both support and add to the literature of the SMAD3-PGC-1α pathway.
FIGURE 7.
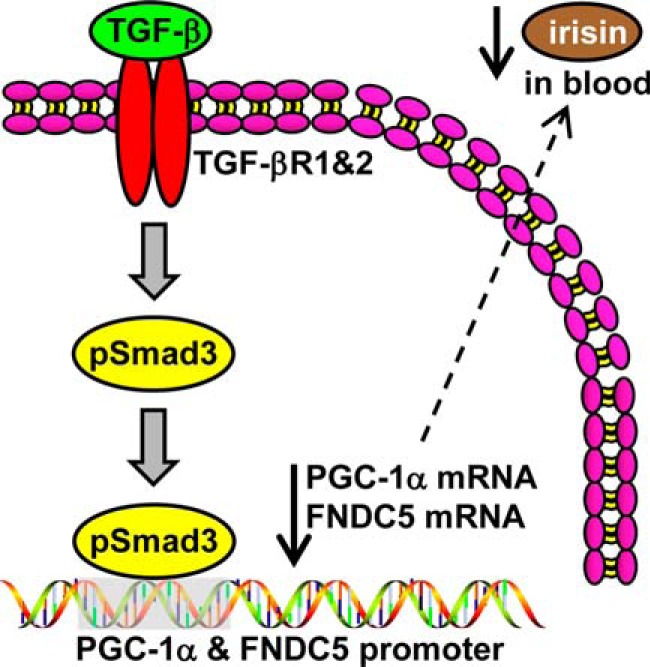
SMAD3 suppresses irisin production and/or secretion from skeletal muscle by inhibiting FNDC5 and PGC-1α expression. TGF-β binds the TGF-βR1/TGF-βR2 complex, SMAD3 is phosphorylated and translocates into the nucleus to bind the promoters of PGC-1α and FNDC5 to suppress their transcription. Suppression of FNDC5 transcription and protein leads to decrease in circulating irisin.
Bostrom et al. (16) previously reported that irisin is a PGC-1α-dependent myokine and our findings support this conclusion. Using TGF-β as an activator of SMAD3 (38), we found that following TGF-β administration in cultured skeletal muscle cells PGC-1α mRNA levels decreased beginning at 4 h and remained suppressed through 24 h, whereas FNDC5 mRNA levels did not begin decreasing until 8 h and were maximally suppressed at 24 h. The expression kinetics of PGC-1α and FNDC5 mRNA support the notion that PGC-1α regulates FNDC5 expression. Furthermore, we found that TGF-β treatment during C2C12 differentiation suppressed FNDC5 and PGC-1α mRNA levels to a much greater extent than treatment after differentiation arguing for a continual effect of SMAD3 on the expression of these proteins. This may be due to SMAD3 programming of C2C12 cells during differentiation because SMAD3 associates with master transcription factors during muscle differentiation (42). Alternatively, this could be a result of TGF-β-induced inhibition of C2C12 differentiation via SMAD3 (43).
We used TGF-β as an activator of SMAD3 in our cell culture experiments (38). Although we used siRNA knockdown of SMAD3, overexpression of CA-SMAD3 and Smad3−/− mice to demonstrate the role of SMAD3 in suppressing FNDC5/irisin, there is the possibility that other pathways downstream of TGF-β are involved. In addition to SMAD3, TGF-β also signals through other SMADs in addition to noncanonical, non-SMAD pathways (mitogen-activated protein kinases and c-Jun N-terminal kinases pathways) (44, 45). With the exception of SMAD7, which we used as a control because it is potently increased by TGF-β, we have not explored the role of the other SMADs in the TGF-β suppression of FNDC5 and PGC-1α. Kollias et al. (46) reported that SMAD7 enhances C2C12 differentiation by directly interacting with the muscle regulatory factor (MyoD), demonstrating the importance of other SMADs in C2C12 functions. Future studies are needed to determine whether other SMADs are involved in the suppression of FNDC5 and/or PGC-α in skeletal muscle.
In obese exercised mice, we found a negative association between serum irisin and skeletal muscle SMAD3. Obese sedentary mice had higher skeletal muscle phosphorylation (pSMAD3) than lean sedentary mice, an observation we also see in adipose tissue and liver.3 In contrast to lean mice, where exercise increased skeletal muscle pSMAD3, exercise decreased skeletal muscle pSMAD3 in obese mice. Importantly, the decrease in skeletal muscle pSMAD3 in obese mice was associated with increased skeletal muscle FNDC5 mRNA and serum irisin, suggesting that SMAD3 negatively regulates irisin. Furthermore, the decrease in pSMAD3 in exercised obese mice was associated with a decrease in serum TGF-β, although it is not clear whether this is responsible for the decreased pSMAD3. It is possible that TGF-β may not be the sole regulator of pSMAD3 or irisin in exercised mice. Exercised lean mice showed increased skeletal muscle pSMAD3 and no changes in serum TGF-β levels. Further, there is no correlation between serum TGF-β and irisin in exercised lean mice, and lastly, there is only a weak negative correlation between serum TGF-β and irisin in exercised obese mice (data not shown). It is plausible that the in vivo regulation of SMAD3 and irisin may be due to another circulating factor or to a distinct exercised-induced cellular pathway.
SMAD3 has been demonstrated to signal independently of TGF-β. For example, myostatin and activin, TGF-β superfamily members, are known to signal through SMAD3 via the activin type II receptor (47–50). Shan et al. (51) reported that myostatin, in sedentary mice, negatively regulates skeletal muscle FNDC5 production through the AMPK-PGC-1α pathway to inhibit WAT browning via decreased serum irisin. Yoshida et al. (52) reported that activin A, similarly to TGF-β, inhibits brown adipogenesis by suppressing sterol regulatory element-binding protein 1c. However, neither group explored the role of exercise or SMADs in their study.
SMAD3 activity in response to exercise appears to be regulated differently in lean and obese mice. Exercised lean mice showed increased skeletal muscle pSMAD3, suggesting activation of the SMAD3 pathway, whereas exercised obese mice, in contrast, showed decreased skeletal muscle pSMAD3, suggesting inactivation of the SMAD3 pathway. How can exercise, known to provide numerous beneficial metabolic effects (16, 53–56), both increase and decrease pSMAD3? It may be that chronic pSMAD3, such as that observed in skeletal muscle (this study), liver,3 and WAT during obesity (31, 57), is metabolically harmful, whereas acute pSMAD3, such as that induced by exercise, is metabolically beneficial. Thus, in skeletal muscle from lean mice in which pSMAD3 is low, exercise increases pSMAD3, whereas in skeletal muscle from obese mice in which pSMAD3 is chronically elevated, exercise decreases pSMAD3. Evidence is accumulating that SMAD3 signaling is increased in WAT and skeletal muscle of obese mice and humans associated with insulin resistance and poor metabolic function (31, 57, 58). In addition, strength training exercise (24 and 48 h) decreases pSMAD3 in skeletal muscle of overweight older men (59). Furthermore, the phosphorylation status of SMAD3 is not indicative of which promoters it is regulating, and indeed, SMAD3 regulates cellular promoters in a cell type-specific manner (42).
Although irisin was discovered 3 years ago, the ability of exercise to induce irisin secretion into the circulation, and its role in WAT browning in humans remains unresolved. Hofmann et al. (60) recently reported in a review that of 10 human studies assessing the role of exercise in inducing muscle FNDC5 mRNA expression or increasing circulating irisin, only half reported a positive effect of exercise on FNDC5/irisin induction. Of an additional three studies, only one reported an increase in serum irisin following exercise (27, 61, 62). However, the 13 studies used different lengths (acute versus chronic) and intensities of exercise, and the human populations studied differed. For example, two of the studies only included obese individuals, one included heart failure patients, one included anorexic patients, and many were composed of either all old or all young subjects (60). It is plausible that differences in exercise protocols could account for the variations in the obtained results. Huh et al. (23) and Kraemer et al. (26) both reported that irisin is increased acutely (1 week and 54 min, respectively) following exercise, but after chronic exercise (8 weeks and 90 min, respectively), irisin levels are no longer increased. The one constant in the large majority of all irisin studies, with the exception of one study (63), is that they all acknowledge that humans produce and secrete irisin into the circulation (60). Further studies are needed to determine how (or whether) exercise increases irisin in humans and whether exercised-induced irisin leads to WAT browning.
In summary, our data show that the SMAD3 pathway negatively regulates irisin production and/or secretion by inhibiting FNDC5 and its upstream activator, PGC-1α, gene expression in skeletal muscle cells. Further elucidation of the mechanisms underlying the SMAD3 inhibition of irisin may reveal novel drug targets for inducing WAT browning. Indeed, earlier this year, Cypess et al. (64) showed that pharmacological induction of human BAT/beige fat by the Food and Drug Administration-approved β-3-adrenergic receptor agonist mirabegron is sufficient to increase resting metabolic activity by 203 ± 40 kcal/day. With respect to SMAD3, the Food and Drug Administration recently granted Novartis a breakthrough therapy designation for their human anti-ActRII antibody (BYM338 or bimagrumab) that works by inhibiting the myostatin/activin type II receptor and preventing myostatin-induced pSMAD3 (65). Although designed for treatment of severe muscle wasting, our results suggest it could be adapted for promoting WAT browning by increasing skeletal muscle irisin production. In addition, Genzyme and Cambridge Antibody Technology developed a human monoclonal antibody called fresolimumab (GC1008) that binds and inhibits all three isoforms of TGF-β (66). It is currently in phase II trials for steroid-resistant primary focal segmental glomerulosclerosis, but we have previously demonstrated that a mouse analog of fresolimumab (1D11) ameliorates obesity and type 2 diabetes in obese mice by suppressing SMAD3 activity and increasing WAT browning (31).
In conclusion, although beige fat has been very recently recognized to play a role in energy homeostasis, it is important to better understand which signaling pathways regulate its appearance and activation. Our studies support the role of TGF-β/SMAD3 signals in driving beige fat development via modulating the FNDC5/PGC-1α axis. Specifically, our findings shed light on the poorly understood regulation of FNDC5/irisin by demonstrating that SMAD3 regulates irisin/FNDC5 production and/or secretion from skeletal muscle.
Acknowledgments
We appreciate the support of members of the Rane laboratory. We are grateful to Paola Aldana for assistance in exercising mice, collecting serum, and assisting with the SMAD3 ChIP. We are grateful to the NHLBI murine phenotyping core and Michele Allen for assistance in exercising mice. We are grateful to Dr. Kathy Flanders (NCI, National Institutes of Health) for providing TGF-β and to Dr. Ying Zhang (NCI, National Institutes of Health) for providing the CA-SMAD3. We thank the National Institutes of Health Fellows Editorial Board for editing and proofreading services.
This work was supported, in whole or in part, by the National Institutes of Health intramural program.
J. P. Tiano, S. G. Rane, U. Wankhade, and H. Yadav, unpublished data.
- WAT
- white adipose tissue
- BAT
- brown adipose tissue
- PGC-1α
- peroxisome proliferator-activated receptor γ coactivator 1-α
- TGF-βR1
- TGF-β receptor 1
- CA
- constitutively active
- HFD
- high fat diet
- NCD
- normal chow diet
- pSMAD3
- phosphorylated SMAD3.
REFERENCES
- 1. Kelly T., Yang W., Chen C. S., Reynolds K., He J. (2008) Global burden of obesity in 2005 and projections to 2030. Int. J. Obes. (Lond.) 32, 1431–1437 [DOI] [PubMed] [Google Scholar]
- 2. Finkelstein E. A., Trogdon J. G., Cohen J. W., Dietz W. (2009) Annual medical spending attributable to obesity: payer-and service-specific estimates. Health Aff. (Millwood) 28, w822–w831 [DOI] [PubMed] [Google Scholar]
- 3. Crawford A. G., Cote C., Couto J., Daskiran M., Gunnarsson C., Haas K., Haas S., Nigam S. C., Schuette R. (2010) Prevalence of obesity, type II diabetes mellitus, hyperlipidemia, and hypertension in the United States: findings from the GE Centricity Electronic Medical Record database. Popul. Health Manag. 13, 151–161 [DOI] [PubMed] [Google Scholar]
- 4. Kim J. Y., van de Wall E., Laplante M., Azzara A., Trujillo M. E., Hofmann S. M., Schraw T., Durand J. L., Li H., Li G., Jelicks L. A., Mehler M. F., Hui D. Y., Deshaies Y., Shulman G. I., Schwartz G. J., Scherer P. E. (2007) Obesity-associated improvements in metabolic profile through expansion of adipose tissue. J. Clin. Invest. 117, 2621–2637 [DOI] [PMC free article] [PubMed] [Google Scholar]
- 5. Fabbrini E., Magkos F., Mohammed B. S., Pietka T., Abumrad N. A., Patterson B. W., Okunade A., Klein S. (2009) Intrahepatic fat, not visceral fat, is linked with metabolic complications of obesity. Proc. Natl. Acad. Sci. U.S.A. 106, 15430–15435 [DOI] [PMC free article] [PubMed] [Google Scholar]
- 6. Cannon B., Nedergaard J. (2004) Brown adipose tissue: function and physiological significance. Physiol. Rev. 84, 277–359 [DOI] [PubMed] [Google Scholar]
- 7. Cypess A. M., Lehman S., Williams G., Tal I., Rodman D., Goldfine A. B., Kuo F. C., Palmer E. L., Tseng Y. H., Doria A., Kolodny G. M., Kahn C. R. (2009) Identification and importance of brown adipose tissue in adult humans. N. Engl. J. Med. 360, 1509–1517 [DOI] [PMC free article] [PubMed] [Google Scholar]
- 8. Zingaretti M. C., Crosta F., Vitali A., Guerrieri M., Frontini A., Cannon B., Nedergaard J., Cinti S. (2009) The presence of UCP1 demonstrates that metabolically active adipose tissue in the neck of adult humans truly represents brown adipose tissue. FASEB J. 23, 3113–3120 [DOI] [PubMed] [Google Scholar]
- 9. Wu J., Boström P., Sparks L. M., Ye L., Choi J. H., Giang A. H., Khandekar M., Virtanen K. A., Nuutila P., Schaart G., Huang K., Tu H., van Marken Lichtenbelt W. D., Hoeks J., Enerbäck S., Schrauwen P., Spiegelman B. M. (2012) Beige adipocytes are a distinct type of thermogenic fat cell in mouse and human. Cell 150, 366–376 [DOI] [PMC free article] [PubMed] [Google Scholar]
- 10. Sharp L. Z., Shinoda K., Ohno H., Scheel D. W., Tomoda E., Ruiz L., Hu H., Wang L., Pavlova Z., Gilsanz V., Kajimura S. (2012) Human BAT possesses molecular signatures that resemble beige/brite cells. PLoS One 7, e49452. [DOI] [PMC free article] [PubMed] [Google Scholar]
- 11. Sacks H. S., Fain J. N., Bahouth S. W., Ojha S., Frontini A., Budge H., Cinti S., Symonds M. E. (2013) Adult epicardial fat exhibits beige features. J. Clin. Endocrinol. Metab. 98, E1448–E1455 [DOI] [PubMed] [Google Scholar]
- 12. Puigserver P., Wu Z., Park C. W., Graves R., Wright M., Spiegelman B. M. (1998) A cold-inducible coactivator of nuclear receptors linked to adaptive thermogenesis. Cell 92, 829–839 [DOI] [PubMed] [Google Scholar]
- 13. Finck B. N., Kelly D. P. (2006) PGC-1 coactivators: inducible regulators of energy metabolism in health and disease. J. Clin. Invest. 116, 615–622 [DOI] [PMC free article] [PubMed] [Google Scholar]
- 14. Fernandez-Marcos P. J., Auwerx J. (2011) Regulation of PGC-1α, a nodal regulator of mitochondrial biogenesis. Am. J. Clin. Nutr. 93, 884S–890S [DOI] [PMC free article] [PubMed] [Google Scholar]
- 15. Schulz T. J., Huang T. L., Tran T. T., Zhang H., Townsend K. L., Shadrach J. L., Cerletti M., McDougall L. E., Giorgadze N., Tchkonia T., Schrier D., Falb D., Kirkland J. L., Wagers A. J., Tseng Y. H. (2011) Identification of inducible brown adipocyte progenitors residing in skeletal muscle and white fat. Proc. Natl. Acad. Sci. U.S.A. 108, 143–148 [DOI] [PMC free article] [PubMed] [Google Scholar]
- 16. Boström P., Wu J., Jedrychowski M. P., Korde A., Ye L., Lo J. C., Rasbach K. A., Boström E. A., Choi J. H., Long J. Z., Kajimura S., Zingaretti M. C., Vind B. F., Tu H., Cinti S., Højlund K., Gygi S. P., Spiegelman B. M. (2012) A PGC1-α-dependent myokine that drives brown-fat-like development of white fat and thermogenesis. Nature 481, 463–468 [DOI] [PMC free article] [PubMed] [Google Scholar]
- 17. Lee P., Werner C. D., Kebebew E., Celi F. S. (2013) Functional thermogenic beige adipogenesis is inducible in human neck fat. Int. J. Obes. (Lond.) 38, 170–176 [DOI] [PMC free article] [PubMed] [Google Scholar]
- 18. Zhang Y., Li R., Meng Y., Li S., Donelan W., Zhao Y., Qi L., Zhang M., Wang X., Cui T., Yang L. J., Tang D. (2014) Irisin stimulates browning of white adipocytes through mitogen-activated protein kinase p38 MAP kinase and ERK MAP kinase signaling. Diabetes 63, 514–525 [DOI] [PMC free article] [PubMed] [Google Scholar]
- 19. Cao L., Choi E. Y., Liu X., Martin A., Wang C., Xu X., During M. J. (2011) White to brown fat phenotypic switch induced by genetic and environmental activation of a hypothalamic-adipocyte axis. Cell Metab. 14, 324–338 [DOI] [PMC free article] [PubMed] [Google Scholar]
- 20. Wrann C. D., White J. P., Salogiannnis J., Laznik-Bogoslavski D., Wu J., Ma D., Lin J. D., Greenberg M. E., Spiegelman B. M. (2013) Exercise induces hippocampal BDNF through a PGC-1α/FNDC5 pathway. Cell Metab. 18, 649–659 [DOI] [PMC free article] [PubMed] [Google Scholar]
- 21. Teufel A., Malik N., Mukhopadhyay M., Westphal H. (2002) Frcp1 and Frcp2, two novel fibronectin type III repeat containing genes. Gene 297, 79–83 [DOI] [PubMed] [Google Scholar]
- 22. Ferrer-Martínez A., Ruiz-Lozano P., Chien K. R. (2002) Mouse PeP: a novel peroxisomal protein linked to myoblast differentiation and development. Dev. Dyn. 224, 154–167 [DOI] [PubMed] [Google Scholar]
- 23. Huh J. Y., Panagiotou G., Mougios V., Brinkoetter M., Vamvini M. T., Schneider B. E., Mantzoros C. S. (2012) FNDC5 and irisin in humans: I. predictors of circulating concentrations in serum and plasma and II. mRNA expression and circulating concentrations in response to weight loss and exercise. Metab. Clin. Exp. 61, 1725–1738 [DOI] [PMC free article] [PubMed] [Google Scholar]
- 24. Lecker S. H., Zavin A., Cao P., Arena R., Allsup K., Daniels K. M., Joseph J., Schulze P. C., Forman D. E. (2012) Expression of the irisin precursor FNDC5 in skeletal muscle correlates with aerobic exercise performance in patients with heart failure. Circ. Heart Fail. 5, 812–818 [DOI] [PMC free article] [PubMed] [Google Scholar]
- 25. Norheim F., Langleite T. M., Hjorth M., Holen T., Kielland A., Stadheim H. K., Gulseth H. L., Birkeland K. I., Jensen J., Drevon C. A. (2014) The effects of acute and chronic exercise on PGC-1α, irisin and browning of subcutaneous adipose tissue in humans. FEBS J. 281, 739–749 [DOI] [PubMed] [Google Scholar]
- 26. Kraemer R. R., Shockett P., Webb N. D., Shah U., Castracane V. D. (2014) A transient elevated irisin blood concentration in response to prolonged, moderate aerobic exercise in young men and women. Horm. Metab. Res. 46, 150–154 [DOI] [PubMed] [Google Scholar]
- 27. Young Huh J., Siopi A., Mougios V., Hee Park K., Mantzoros C. S. (2015) Irisin in response to exercise in humans with and without metabolic syndrome. J. Clin. Endocrinol. Metab. 100, E453–E457 [DOI] [PubMed] [Google Scholar]
- 28. Lee P., Linderman J. D., Smith S., Brychta R. J., Wang J., Idelson C., Perron R. M., Werner C. D., Phan G. Q., Kammula U. S., Kebebew E., Pacak K., Chen K. Y., Celi F. S. (2014) Irisin and FGF21 are cold-induced endocrine activators of brown fat function in humans. Cell Metab. 19, 302–309 [DOI] [PMC free article] [PubMed] [Google Scholar]
- 29. Lin H. M., Lee J. H., Yadav H., Kamaraju A. K., Liu E., Zhigang D., Vieira A., Kim S. J., Collins H., Matschinsky F., Harlan D. M., Roberts A. B., Rane S. G. (2009) Transforming growth factor-β/Smad3 signaling regulates insulin gene transcription and pancreatic islet beta-cell function. J. Biol. Chem. 284, 12246–12257 [DOI] [PMC free article] [PubMed] [Google Scholar]
- 30. Tan C. K., Leuenberger N., Tan M. J., Yan Y. W., Chen Y., Kambadur R., Wahli W., Tan N. S. (2011) Smad3 deficiency in mice protects against insulin resistance and obesity induced by a high-fat diet. Diabetes 60, 464–476 [DOI] [PMC free article] [PubMed] [Google Scholar]
- 31. Yadav H., Quijano C., Kamaraju A. K., Gavrilova O., Malek R., Chen W., Zerfas P., Zhigang D., Wright E. C., Stuelten C., Sun P., Lonning S., Skarulis M., Sumner A. E., Finkel T., Rane S. G. (2011) Protection from obesity and diabetes by blockade of TGF-β/Smad3 signaling. Cell Metab. 14, 67–79 [DOI] [PMC free article] [PubMed] [Google Scholar]
- 32. Yan J., Zhang H., Yin Y., Li J., Tang Y., Purkayastha S., Li L., Cai D. (2014) Obesity- and aging-induced excess of central transforming growth factor-β potentiates diabetic development via an RNA stress response. Nat. Med. 20, 1001–1008 [DOI] [PMC free article] [PubMed] [Google Scholar]
- 33. Inman G. J., Nicolás F. J., Callahan J. F., Harling J. D., Gaster L. M., Reith A. D., Laping N. J., Hill C. S. (2002) SB-431542 is a potent and specific inhibitor of transforming growth factor-β superfamily type I activin receptor-like kinase (ALK) receptors ALK4, ALK5, and ALK7. Mol. Pharmacol. 62, 65–74 [DOI] [PubMed] [Google Scholar]
- 34. Datto M. B., Frederick J. P., Pan L., Borton A. J., Zhuang Y., Wang X. F. (1999) Targeted disruption of Smad3 reveals an essential role in transforming growth factor β-mediated signal transduction. Mol. Cell. Biol. 19, 2495–2504 [DOI] [PMC free article] [PubMed] [Google Scholar]
- 35. Yang X., Letterio J. J., Lechleider R. J., Chen L., Hayman R., Gu H., Roberts A. B., Deng C. (1999) Targeted disruption of SMAD3 results in impaired mucosal immunity and diminished T cell responsiveness to TGF-β. EMBO J. 18, 1280–1291 [DOI] [PMC free article] [PubMed] [Google Scholar]
- 36. Matsumoto K., Ishihara K., Tanaka K., Inoue K., Fushiki T. (1996) An adjustable-current swimming pool for the evaluation of endurance capacity of mice. J. Appl. Physiol. 81, 1843–1849 [DOI] [PubMed] [Google Scholar]
- 37. Millet C., Yamashita M., Heller M., Yu L. R., Veenstra T. D., Zhang Y. E. (2009) A negative feedback control of transforming growth factor-β signaling by glycogen synthase kinase 3-mediated Smad3 linker phosphorylation at Ser-204. J. Biol. Chem. 284, 19808–19816 [DOI] [PMC free article] [PubMed] [Google Scholar]
- 38. Attisano L., Wrana J. L. (2002) Signal transduction by the TGF-β superfamily. Science 296, 1646–1647 [DOI] [PubMed] [Google Scholar]
- 39. Seale P., Bjork B., Yang W., Kajimura S., Chin S., Kuang S., Scimè A., Devarakonda S., Conroe H. M., Erdjument-Bromage H., Tempst P., Rudnicki M. A., Beier D. R., Spiegelman B. M. (2008) PRDM16 controls a brown fat/skeletal muscle switch. Nature 454, 961–967 [DOI] [PMC free article] [PubMed] [Google Scholar]
- 40. Kawakami Y., Tsuda M., Takahashi S., Taniguchi N., Esteban C. R., Zemmyo M., Furumatsu T., Lotz M., Izpisúa Belmonte J. C., Asahara H. (2005) Transcriptional coactivator PGC-1α regulates chondrogenesis via association with Sox9. Proc. Natl. Acad. Sci. U.S.A. 102, 2414–2419 [DOI] [PMC free article] [PubMed] [Google Scholar]
- 41. Sohn E. J., Kim J., Hwang Y., Im S., Moon Y., Kang D. M. (2012) TGF-β suppresses the expression of genes related to mitochondrial function in lung A549 cells. Cell Mol. Biol. (Noisy-le-Grand) 58, (suppl.) OL1763–7 [PubMed] [Google Scholar]
- 42. Mullen A. C., Orlando D. A., Newman J. J., Lovén J., Kumar R. M., Bilodeau S., Reddy J., Guenther M. G., DeKoter R. P., Young R. A. (2011) Master transcription factors determine cell-type-specific responses to TGF-β signaling. Cell 147, 565–576 [DOI] [PMC free article] [PubMed] [Google Scholar]
- 43. Liu D., Black B. L., Derynck R. (2001) TGF-β inhibits muscle differentiation through functional repression of myogenic transcription factors by Smad3. Genes Dev. 15, 2950–2966 [DOI] [PMC free article] [PubMed] [Google Scholar]
- 44. Derynck R., Zhang Y. E. (2003) Smad-dependent and Smad-independent pathways in TGF-β family signalling. Nature 425, 577–584 [DOI] [PubMed] [Google Scholar]
- 45. Shi Y., Massagué J. (2003) Mechanisms of TGF-β signaling from cell membrane to the nucleus. Cell 113, 685–700 [DOI] [PubMed] [Google Scholar]
- 46. Kollias H. D., Perry R. L., Miyake T., Aziz A., McDermott J. C. (2006) Smad7 promotes and enhances skeletal muscle differentiation. Mol. Cell. Biol. 26, 6248–6260 [DOI] [PMC free article] [PubMed] [Google Scholar]
- 47. Lokireddy S., McFarlane C., Ge X., Zhang H., Sze S. K., Sharma M., Kambadur R. (2011) Myostatin induces degradation of sarcomeric proteins through a Smad3 signaling mechanism during skeletal muscle wasting. Mol. Endocrinol. 25, 1936–1949 [DOI] [PMC free article] [PubMed] [Google Scholar] [Retracted]
- 48. Kim W. K., Choi H. R., Park S. G., Ko Y., Bae K. H., Lee S. C. (2012) Myostatin inhibits brown adipocyte differentiation via regulation of Smad3-mediated β-catenin stabilization. Int. J. Biochem. Cell Biol. 44, 327–334 [DOI] [PubMed] [Google Scholar]
- 49. Goodman C. A., McNally R. M., Hoffmann F. M., Hornberger T. A. (2013) Smad3 induces atrogin-1, inhibits mTOR and protein synthesis, and promotes muscle atrophy in vivo. Mol. Endocrinol. 27, 1946–1957 [DOI] [PMC free article] [PubMed] [Google Scholar]
- 50. Bonala S., Lokireddy S., McFarlane C., Patnam S., Sharma M., Kambadur R. (2014) Myostatin induces insulin resistance via Casitas B-lineage lymphoma b (Cblb)-mediated degradation of insulin receptor substrate 1 (IRS1) protein in response to high calorie diet intake. J. Biol. Chem. 289, 7654–7670 [DOI] [PMC free article] [PubMed] [Google Scholar] [Retracted]
- 51. Shan T., Liang X., Bi P., Kuang S. (2013) Myostatin knockout drives browning of white adipose tissue through activating the AMPK-PGC1α-Fndc5 pathway in muscle. FASEB J. 27, 1981–1989 [DOI] [PMC free article] [PubMed] [Google Scholar]
- 52. Yoshida H., Kanamori Y., Asano H., Hashimoto O., Murakami M., Kawada T., Matsui T., Funaba M. (2013) Regulation of brown adipogenesis by the Tgf-β family: involvement of Srebp1c in Tgf-β- and Activin-induced inhibition of adipogenesis. Biochim. Biophys. Acta 1830, 5027–5035 [DOI] [PubMed] [Google Scholar]
- 53. Baar K. (2004) Involvement of PPARγ co-activator-1, nuclear respiratory factors 1 and 2, and PPARα in the adaptive response to endurance exercise. Proc. Nutr. Soc. 63, 269–273 [DOI] [PubMed] [Google Scholar]
- 54. Boström P., Mann N., Wu J., Quintero P. A., Plovie E. R., Panáková D., Gupta R. K., Xiao C., MacRae C. A., Rosenzweig A., Spiegelman B. M. (2010) C/EBPβ controls exercise-induced cardiac growth and protects against pathological cardiac remodeling. Cell 143, 1072–1083 [DOI] [PMC free article] [PubMed] [Google Scholar]
- 55. Pedersen B. K., Febbraio M. A. (2012) Muscles, exercise and obesity: skeletal muscle as a secretory organ. Nat. Rev. Endocrinol. 8, 457–465 [DOI] [PubMed] [Google Scholar]
- 56. Ruas J. L., White J. P., Rao R. R., Kleiner S., Brannan K. T., Harrison B. C., Greene N. P., Wu J., Estall J. L., Irving B. A., Lanza I. R., Rasbach K. A., Okutsu M., Nair K. S., Yan Z., Leinwand L. A., Spiegelman B. M. (2012) A PGC-1α isoform induced by resistance training regulates skeletal muscle hypertrophy. Cell 151, 1319–1331 [DOI] [PMC free article] [PubMed] [Google Scholar]
- 57. Tsurutani Y., Fujimoto M., Takemoto M., Irisuna H., Koshizaka M., Onishi S., Ishikawa T., Mezawa M., He P., Honjo S., Maezawa Y., Saito Y., Yokote K. (2011) The roles of transforming growth factor-β and Smad3 signaling in adipocyte differentiation and obesity. Biochem. Biophys. Res. Commun. 407, 68–73 [DOI] [PubMed] [Google Scholar]
- 58. Watts R., McAinch A. J., Dixon J. B., O'Brien P. E., Cameron-Smith D. (2013) Increased Smad signaling and reduced MRF expression in skeletal muscle from obese subjects. Obesity (Silver Spring) 21, 525–528 [DOI] [PubMed] [Google Scholar]
- 59. Dalbo V. J., Roberts M. D., Sunderland K. L., Poole C. N., Stout J. R., Beck T. W., Bemben M., Kerksick C. M. (2011) Acute loading and aging effects on myostatin pathway biomarkers in human skeletal muscle after three sequential bouts of resistance exercise. J. Gerontol. A Biol. Sci. Med. Sci. 66, 855–865 [DOI] [PubMed] [Google Scholar]
- 60. Hofmann T., Elbelt U., Stengel A. (2014) Irisin as a muscle-derived hormone stimulating thermogenesis: a critical update. Peptides 54, 89–100 [DOI] [PubMed] [Google Scholar]
- 61. Kurdiova T., Balaz M., Vician M., Maderova D., Vlcek M., Valkovic L., Srbecky M., Imrich R., Kyselovicova O., Belan V., Jelok I., Wolfrum C., Klimes I., Krssak M., Zemkova E., Gasperikova D., Ukropec J., Ukropcova B. (2014) Effects of obesity, diabetes and exercise on Fndc5 gene expression and irisin release in human skeletal muscle and adipose tissue: in vivo and in vitro studies. J. Physiol. 592, 1091–1107 [DOI] [PMC free article] [PubMed] [Google Scholar]
- 62. Tsuchiya Y., Ando D., Goto K., Kiuchi M., Yamakita M., Koyama K. (2014) High-intensity exercise causes greater irisin response compared with low-intensity exercise under similar energy consumption. Tohoku J. Exp. Med. 233, 135–140 [DOI] [PubMed] [Google Scholar]
- 63. Raschke S., Elsen M., Gassenhuber H., Sommerfeld M., Schwahn U., Brockmann B., Jung R., Wisløff U., Tjønna A. E., Raastad T., Hallén J., Norheim F., Drevon C. A., Romacho T., Eckardt K., Eckel J. (2013) Evidence against a beneficial effect of irisin in humans. PLoS One 8, e73680. [DOI] [PMC free article] [PubMed] [Google Scholar]
- 64. Cypess A. M., Weiner L. S., Roberts-Toler C., Elía E. F., Kessler S. H., Kahn P. A., English J., Chatman K., Trauger S. A., Doria A., Kolodny G. M. (2015) Activation of human brown adipose tissue by a β3-adrenergic receptor agonist. Cell Metab. 21, 33–38 [DOI] [PMC free article] [PubMed] [Google Scholar]
- 65. Lach-Trifilieff E., Minetti G. C., Sheppard K., Ibebunjo C., Feige J. N., Hartmann S., Brachat S., Rivet H., Koelbing C., Morvan F., Hatakeyama S., Glass D. J. (2014) An antibody blocking activin type II receptors induces strong skeletal muscle hypertrophy and protects from atrophy. Mol. Cell. Biol. 34, 606–618 [DOI] [PMC free article] [PubMed] [Google Scholar]
- 66. Trachtman H., Fervenza F. C., Gipson D. S., Heering P., Jayne D. R., Peters H., Rota S., Remuzzi G., Rump L. C., Sellin L. K., Heaton J. P., Streisand J. B., Hard M. L., Ledbetter S. R., Vincenti F. (2011) A phase 1, single-dose study of fresolimumab, an anti-TGF-β antibody, in treatment-resistant primary focal segmental glomerulosclerosis. Kidney Int. 79, 1236–1243 [DOI] [PMC free article] [PubMed] [Google Scholar]