Background: Coiled-coil coactivators can enhance HIF-dependent gene transcription via direct interaction with the HIF/ARNT heterodimer.
Results: ARNT uses the β-sheet of the PAS-B domain to recruit coiled-coil coactivators.
Conclusion: Coiled-coil coactivators bridge HIF and ARNT via the PAS-B domain β-sheet contacts to both proteins to form a ternary structure.
Significance: This work reveals the mechanism for assembling a coiled-coil coactivator complex with the HIF-2 transcription factor heterodimer.
Keywords: Crystal Structure, Hypoxia-inducible Factor (HIF), Nuclear Magnetic Resonance (NMR), Transcription Coactivator, Transcription Regulation, ARNT, TACC3, Coiled-coil Coactivator Recruitment
Abstract
The hypoxia-inducible factor complex (HIF-α·aryl hydrocarbon receptor nuclear translocator (ARNT)) requires association with several transcription coactivators for a successful cellular response to hypoxic stress. In addition to the conventional global transcription coactivator CREB-binding protein/p300 (CBP/p300) that binds to the HIF-α transactivation domain, a new group of transcription coactivators called the coiled-coil coactivators (CCCs) interact directly with the second PER-ARNT-SIM (PAS) domain of ARNT (ARNT PAS-B). These less studied transcription coactivators play essential roles in the HIF-dependent hypoxia response, and CCC misregulation is associated with several forms of cancer. To better understand CCC protein recruitment by the heterodimeric HIF transcription factor, we used x-ray crystallography, NMR spectroscopy, and biochemical methods to investigate the structure of the ARNT PAS-B domain in complex with the C-terminal fragment of a coiled-coil coactivator protein, transforming acidic coiled-coil coactivator 3 (TACC3). We found that the HIF-2α PAS-B domain also directly interacts with TACC3, motivating an NMR data-derived model suggesting a means by which TACC3 could form a ternary complex with HIF-2α PAS-B and ARNT PAS-B via β-sheet/coiled-coil interactions. These findings suggest that TACC3 could be recruited as a bridge to cooperatively mediate between the HIF-2α PAS-B·ARNT PAS-B complex, thereby participating more directly in HIF-dependent gene transcription than previously anticipated.
Introduction
Hypoxia-inducible factor (HIF)3 proteins are the central regulators of the mammalian hypoxia response (1), consisting of an O2-regulated α subunit (HIF-1α, -2α, and -3α) and the stably expressed β subunit (ARNT or HIF-β) (2). Under hypoxia, stabilized HIF-α and ARNT subunits dimerize through the N-terminal basic helix loop helix (bHLH) and two Per-ARNT-Sim (PAS) domains. This heterodimer binds to the hypoxia-response element promoter with its N-terminal bHLH domain and controls the transcription of hundreds of target genes such as pro-angiogenic factors and metabolic enzymes (2, 3).
HIF target gene regulation depends on the participation of several transcription cofactors. The intrinsically unfolded C-terminal transactivation domain of HIF-α subunit plays a major role in this process by directly interacting with the global transcription coactivator CBP/p300 (4). Interestingly, recent studies revealed a group of transcription coactivators involved in cancer development and progression, namely the coiled-coil coactivators (CCCs), could be recruited in a transactivation domain-independent manner (5–7). Three CCC family members have been described to date as follows: coiled-coil coactivator (8), thyroid hormone receptor interacting protein 230 (TRIP230) (9), and transforming acidic coiled-coil 3 (TACC3) (10). Under normal situations, these coactivators play an essential role in the hypoxia response by directly interacting with the ARNT subunit in a promoter-specific way. However, misregulation by overexpression or activating fusions caused by chromosomal translocations (e.g. FGF receptor-TACC3) is sufficient for transformation and is associated with the development of glioblastoma, renal cell carcinoma, and other cancers (11).
To investigate the molecular details of the HIF·CCC complex, we first characterized the structure of minimal interacting fragments of ARNT·TACC3 using x-ray crystallography and solution NMR spectroscopy. We previously reported that ARNT PAS-B utilizes its Fα-helix as the main interface to directly bind to the C terminus of TACC3 in vitro (6). However, crystal structures solved in this study directly demonstrate that the β-sheet of ARNT PAS-B serves as the TACC3-binding site. Subsequent solution NMR measurements reveal that the HIF-2α PAS-B β-sheet also binds to the TACC3 C terminus. Based on these observations, we generated a ternary complex model of ARNT PAS-B·TACC3·HIF-2α PAS-B that is supported by several lines of experimental data. The cooperative formation of a ternary complex among TACC3, ARNT PAS-B, and HIF-2α PAS-B described here could shed light on the general mechanism of the CCC protein recruitment in HIF signaling and provide a structural framework to inform future anti-cancer therapies.
EXPERIMENTAL PROCEDURES
Plasmids
For bacterial expression, human ARNT PAS-B domain (356–470) and mutants were cloned into the pHis-parallel (12) and pHisGβ1-parallel (13) expression vectors. Human HIF-2α PAS-B domain (240–350) and mutants were cloned into pHis-parallel vector and pGST-parallel vector. Mouse TACC3(585–631) was cloned into pGST-parallel vector. GCN4-TACC3-CT was made by fusing Saccharomyces cerevisiae GCN4 residues 264–281 (14) to the N terminus of mouse TACC3 residues 610–631. GCN4-TACC3-CT was cloned into the pHisGβ1-parallel vector.
Protein Purification
Proteins were expressed from BL21(DE3) cells (New England Biolabs) grown in LB or M9 minimal media (supplemented with 1 g/liter 15NH4Cl, Cambridge Isotope Laboratories) at 37 °C and induced with 500 μm isopropyl 1-thio-β-d-galactopyranoside at an A600 of 0.7. After overnight growth at 20 °C, cells were harvested by spinning at 4 °C, 4700 × g for 40 min. The pellet was resuspended in buffer and stored at −80 °C. Purification was conducted using affinity chromatography (nickel-Sepharose high performance or glutathione-Sepharose 4B, GE Healthcare). Affinity tags (GST, His, or HisGβ1) were cleaved by His6-tobacco etch virus protease overnight at 4 °C, followed by size-exclusion chromatography (Superdex 75, GE Healthcare). NMR experiments were performed in 25 mm Tris (pH 7.5), 17 mm NaCl, 5 mm β-mercaptoethanol, and 10% D2O.
Pulldown Assay
For pulldown experiments, 5 μm purified His-ARNT PAS-B and 8–15 μm TACC3 were incubated with 15 μl of nickel-nitrilotriacetic acid beads overnight at 4 °C. Beads were washed twice with buffer before elution. Eluted protein was resolved in SDS-PAGE and stained with Coomassie Blue stain.
X-ray Crystallography
Single crystals of ARNT PAS-B·GCN4-TACC3-CT D622A/E629A were grown by hanging drop vapor diffusion against 1.0 m succinic acid (pH 6.5), in 25 mm Tris (pH 7.5), 17 mm NaCl, 5 mm β-mercaptoethanol buffer. Drops containing 2 μl of 2.5 mg/ml ARNT PAS-B·GCN4-TACC3-CT D622A/E629A (molar ratio = 1:2) were mixed with 0.7 μl 1.0 m succinic acid (pH 6.5) (reservoir solution) and 0.3 μl 30% sorbitol (additive). Crystals were observed within 2 days and reached maximum size within 1 week at 20 °C. The crystals exhibited C2 space group symmetry with cell dimensions of a = 116.85 Å, b = 59.82 Å, c = 73.51 Å, and β = 97.85°, contained two molecules of ARNT PAS-B and one molecule of GCN4-TACC3-CT D622A/E629A per asymmetric unit, and diffracted to a minimum Bragg spacing (dmin) of 3.15 Å when exposed to synchrotron radiation.
The ARNT PAS-B E362R·TACC3-CT·HIF-2α PAS-B R247E structure was obtained under a different condition. The ARNT PAS-B E362R·TACC3 heterodimer protein complex was formed by mixing equal volumes of 300 μm ARNT PAS-B E362R with 300 μm of the TACC3 disulfide Cys-621–Cys-621 cross-linked dimer. The ARNT PAS-B E362R·TACC3 heterodimer and HIF-2α PAS-B R247E protein were further purified separately by size-exclusion chromatography on a Superdex 75 column (GE Healthcare) equilibrated with 50 mm Tris (pH 7.5), 17 mm NaCl. The final ARNT PAS-B E362R·TACC3·HIF-2α PAS-B R247E sample was formed by mixing equimolar amounts of all proteins and concentrated using an Amicon ultrafiltration device (Millipore) to 8 mg/ml for crystallization. Crystals of ARNT PAS-B E362R·TACC3-CT·HIF-2α PAS-B R247E were grown using the sitting-drop vapor diffusion method from drops containing 0.2 μl of protein (8 mg/ml) and 0.2 μl of reservoir solution (1.6 m MgSO4, 0.1 m MES (pH 6.5)) and equilibrated over reservoir solution at 20 °C. Cryoprotection was performed by transferring the crystals to a final solution of 1.6 m MgSO4, 0.1 m MES (pH 6.5), 20% ethylene glycol, and were flash-cooled in liquid nitrogen. The crystals exhibited P41212 space group symmetry with cell dimensions of a = 96.14 Å, c = 182.84 Å, contained two molecules of ARNT PAS-B E362R, two molecules of TACC3 S-S-linked dimer, and one molecule of HIF-2α PAS-B R247E per asymmetric unit, and diffracted to a minimum Bragg spacing (dmin) of 3.20 Å when exposed to synchrotron radiation.
Diffraction data for both complexes were collected at the Advanced Photon Source beamline 19-ID and were indexed, integrated, and scaled using the HKL-3000 (15) program package. Data collection statistics are provided in Table 1. For the ARNT PAS-B·GCN4-TACC3-CT D622A/E629A data, extending the resolution limit beyond 3.15 Å did not substantially improve calculated electron density maps and provided poorer refinement results, likely due to anisotropy that in turn limited data completeness in the highest resolution shells.
TABLE 1.
X-ray crystallography data processing and refinement statistics
Data for the outermost shell are given in parentheses. NA means not applicable.
| Data collection | ||
| Crystal | ARNT PAS-B·GCN4-TACC3-CT D622A/E629A | ARNT PAS-B E362R·TACC3-CT·HIF-2α PAS-B R247E |
| Space group | C2 | P41212 |
| Wavelength (Å) | 0.97951 | 0.97951 |
| Resolution range (Å) | 44.3–3.15 (3.20–3.15) | 48.07–3.20 (3.26–3.20) |
| Unique reflections | 8,354 (278) | 14,853 (705) |
| Multiplicity | 3.5 (2.3) | 7.2 (4.8) |
| Data completeness (%) | 94.9 (65.1) | 99.9 (98.7) |
| Rmerge (%)a | 10.5 (46.2) | 14.8 (100.0) |
| Rpim (%)b | —c | 6.8 (62.9) |
| I/σ(I) | 14.8 (1.55) | 11.6 (1.3) |
| Wilson B-value (Å2) | 73.6 | 48.3 |
| Refinement statistics | ||
| Resolution range (Å) | 44.3–3.15 (3.35–3.15) | 48.07–3.20 (3.26–3.20) |
| No. of reflections Rwork/Rfree | 8,332/832 (954/106) | 12,842/626 (1,782/93) |
| Data completeness (%) | 94.2 (73.0) | 86.8 (49.0) |
| Atoms (non-H protein/ions) | 2,108/NA | 4,082/10 |
| Rwork (%) | 24.7 (27.9) | 23.1 (32.3) |
| Rfree (%) | 27.2 (31.2) | 27.0 (34.0) |
| r.m.s.d. bond length (Å) | 0.004 | 0.008 |
| r.m.s.d. bond angle (°) | 0.759 | 0.93 |
| Mean B-value (Å2) (protein/ions) | 65.1/NA | 56.1/52.7 |
| Ramachandran plot (%) (favored/additional/disallowed)d | 95.9/4.1/0.0 | 97.5/2.3/0.2 |
| Maximum likelihood coordinate error | 0.31 | 0.47 |
| Missing residues | A: 356–360, 447–454, 465–470. B: 356–360, 447–453, 465–470., C: 626–631., D: 595, 627–631. | A: 356–360, 449–451, 465–470. C: 630–631., D: 356–360, 450–452, 465–470. G: 235–238, 345–350. |
a Rmerge = 100 ΣhΣi|Ih,i − 〈Ih〉|/ΣhΣi 〈Ih,i〉, where the outer sum (h) is over the unique reflections, and the inner sum (i) is over the set of independent observations of each unique reflection.
b Rpim = 100 ΣhΣi(1/(nh − 1))1/2|Ih,i − 〈Ih〉|/ΣhΣi 〈Ih,i〉, where nh is the number of observations of reflections h.
c Information was not reported in this version of HKL3000 when processing the data.
d Data are as defined by the validation suite MolProbity (19).
Phases for ARNT PAS-B·GCN4-TACC3-CT D622A/E629A were obtained via molecular replacement in the program Phaser (16) using a search model derived from the previously determined ARNT PAS-B domain crystal structure (PDB code 4EQ1 (17)). Two copies of ARNT PAS-B were located in the asymmetric unit, and inspection of the electron density maps revealed density corresponding to the coiled-coil domain, which was initially modeled as a pair of idealized polyalanine helices. Identification of the inter-helical disulfide bond allowed accurate assignment of GCN4-TACC3 density for residues 595–626.
Refinement was performed to a resolution of 3.15 Å with noncrystallographic symmetry restraints using the program Phenix (18) with a random 10% of all data set aside for an Rfree calculation. The final refinement included two ARNT PAS-B monomers (excluding extended loop residues 447–454) and one TACC3 homodimer (modeling residues 595–625 of monomer C and residues 596–626 of monomer D). The Rwork is 0.247 and the Rfree is 0.272. A Ramachandran plot generated with MolProbity (19) indicated that 95.9% of all protein residues are in the most favored regions, and none occupies disallowed regions.
Phases for ARNT PAS-B E362R·TACC3-CT·HIF-2α PAS-B R247E crystals were also obtained via molecular replacement with Phaser. PAS domain search models were constructed from the previously determined ARNT PAS-B E362R·HIF-2α PAS-B R247E heterodimer coordinates (PDB code 3F1O (20)) by removal of N- and C-terminal residues 356–361 and 448–453 from ARNT PAS-B E362R, and residues 236–242 and 345–349 from HIF-2α PAS-B R247E. The search model for the TACC3 domain was derived from residues 595 to 609 of the ARNT PAS-B·GCN4-TACC3-CT D622A/E629A structure, with all residues converted to alanine. Two copies of ARNT PAS-B E362R and two copies of the TACC3-CT homodimer were located in the unit cell. Inspection of these initial electron density maps revealed density corresponding to additional helical density at both the N and C termini of the TACC3-CT. Phases were further improved by density modification with 2-fold noncrystallographic symmetry averaging in the program Parrot (21) resulting in a figure-of-merit of 0.745. A model containing 92.7% of all residues in the two TACC3 domains was automatically generated in the program Buccaneer (22). The inter-helical disulfide bond used to confirm the register of the helices was observed in one TACC3 homodimer (chains E and F) but was reduced in the second homodimer (chains B and C). Inspection of electron density maps after rigid body refinement of the ARNT PAS-B E362R·TACC3 heterodimer using Phenix revealed unmodeled density suggestive of another PAS domain. Identification of this as the HIF-2α PAS-B R247E domain (and not the ARNT PAS-B E364R) was confirmed via the statistics from molecular replacement in Phaser and inspection of kicked omit maps following refinement in Phenix.
Additional residues for ARNT PAS-B E362R·TACC3·HIF-2α PAS-B R247E were manually modeled in the programs O (23) and Coot (24). Refinement was performed to a resolution of 3.20 Å using the program Phenix with a random 10% of all data set aside for an Rfree calculation. Noncrystallographic symmetry averaging and reference model restraints were used in initial rounds of refinement but were removed once the Rfree dropped below 0.30, and the geometry was stabilized. Because of the low resolution of the data, grouped isotropic as well as TLS atomic displacement parameters were refined. Mean atomic displacement parameters were 43.1–56.4 Å2 for the domains of the ARNT PAS-B E362R·TACC3 heterodimer and 83.3 Å2 for the HIF-2α PAS-B R247E domain. The current model contains two ARNT PAS-B E362R monomers (excluding extended loop residues 449–451 for monomer A and residue 450 of monomer D); two TACC3 homodimers, including residues 582–631 of monomers B, E, and F, and residues 582–629 of monomer C; one monomer of HIF-2α PAS-B R247E, including residues 239–344; and two sulfate anions. The final Rwork and Rfree values are 0.231 and 0.270. A Ramachandran plot generated with Molprobity indicated that 97.5% of all protein residues are in the most favored regions, and 0.2% (one residue) in the disallowed regions. A complete summary of phasing and model refinement statistics for both complexes are provided in Table 1.
Microscale Thermophoresis (MST)
MST experiments were conducted using a Monolith NT.115 (NanoTemper). ARNT PAS-B E362R was labeled with the blue fluorescent dye NT-495-NHS using a vendor-supplied kit (NanoTemper) and buffer exchanged to the assay buffer (25 mm Tris (pH 7.5), 17 mm NaCl, 0.05% Tween 20, and 5 mm β-mercaptoethanol). Titrations were conducted with a constant 500 nm fluorophore-labeled ARNT PAS-B (ARNT PAS-B E362R-fluor) against up to 500 μm titrant in standard coated capillaries. Each data point was measured in triplicate. Single-site fitting was done by NanoTemper data analysis software. For bimodal MST data, a fitting model for the formation of ABB complexes was constructed in a Python script. The script uses a numerical method to determine the concentrations of all possible (macroscopic) species as follows: free A, free B, AB, and ABB. The overall thermophoretic signal (f) was considered to be a linear combination of the signals of the detectable species, f(B), f(AB), and f(ABB) (21). The two B-binding sites were constrained to have identical microscopic binding affinities, meaning that the macroscopic binding constant of the formation of the ABB complex was 4-fold higher than that for the formation of the AB complex.
NMR Spectroscopy
NMR experiments were carried out at 25 °C on Varian 600 and 800 MHz spectrometers. Chemical shift assignments of ARNT PAS-B and HIF-2α PAS-B were used as established previously (25, 26). All NMR data were processed with NMRpipe/NMRDraw (27) and analyzed with NMRViewJ (Version 9.0.0, One Moon Scientific). Heat maps of peak broadening and PRE effects on the ARNT PAS-B and HIF-2α PAS-B crystal structures were generated by PyMOL (Version 1.5.0.3, Schrödinger, LLC).
Paramagnetic Relaxation Enhancement
PRE was measured by comparing the backbone amide proton transverse (1HN T2) relaxation rates under paramagnetic and diamagnetic conditions. These relaxation rates were determined using a modified 15N/1H TROSY-HSQC experiment with delay times of 6.5, 8, 10, 13, 16, and 26 ms. Rates were calculated using NMRViewJ (Version 9.0.0, One Moon Scientific). Paramagnetic labeling with (1-oxyl-2,2,5,5-tetramethyl-Δ3-pyrroline-3-methyl) methanethiosulfonate (MTSL) or (1-oxyl-2,2,5,5-tetramethylpyrroline-3-yl) carbamidoethyl methanethiosulfonate (CMTSL) (Toronto Research Chemicals) at a specific cysteine site of target protein was conducted by incubating protein and spin label at a 1:2 molar ratio under a nonreducing condition and rotating overnight at room temperature. Labeled protein was purified by gel filtration through a Superdex 75 column. A diamagnetic control was generated by adding 10-fold sodium dithionite to the labeled protein and purging with N2(g) for 30 min to quench the spin label.
HADDOCK Modeling
A TACC3 C-terminal peptide (residues 585–631) was modeled using Rosetta (28) as a parallel coiled-coil dimer based on the GCN4-TACC3-CT crystal structure (determined above). Complexes of ARNT PAS-B·TACC3(585–631) and HIF-2α PAS-B·TACC3(585–631) were generated by rigid body docking (HADDOCK 2.0 web server (28)) using the TACC3(585–631) homodimer model, ARNT PAS-B crystal structure (PDB code 4EQ1), and HIF-2α PAS-B crystal structure (PDB code 3F1O, chain A) (20). Active residues used for docking are listed in Table 2. Passive residues were automatically defined around the active residues. Docking and refining were done following the default parameters, including semiflexible simulated annealing of all proteins in the 200 lowest intermolecular energy solutions and refinement in explicit water. C2 symmetry restraints were turned on to lock TACC3 as a parallel dimer in the docking process.
TABLE 2.
Active residues in HADDOCK modeling
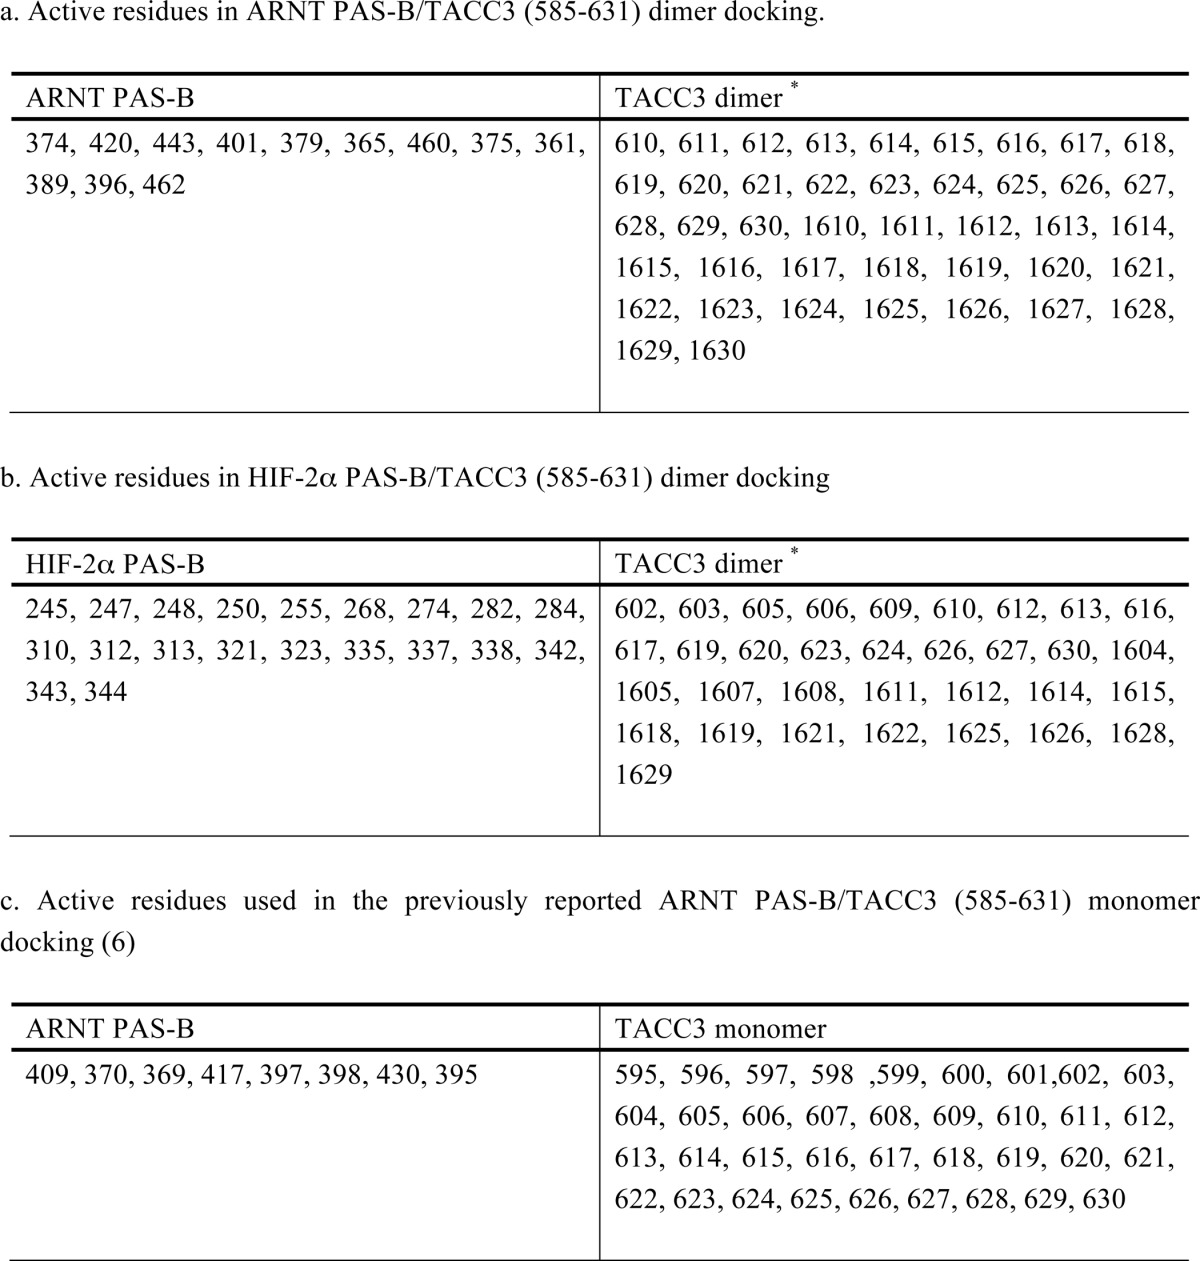
* TACC3 residue numbers <1000 represent residues on one monomer (residue numbering = that of primary sequence); residue numbers >1000 indicate residues on the adjacent TACC3 monomer (residue numbering = native + 1000).
RESULTS
Overall Structure of ARNT·TACC3
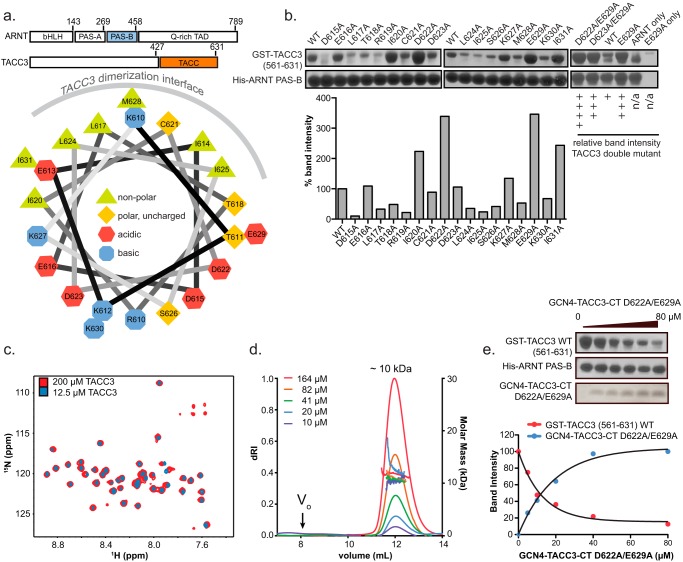
The ARNT PAS-B domain and the last 20 amino acids of the TACC3 parallel dimer (residues 610–631) of the TACC domain have been identified as the minimum binding fragments that are necessary and sufficient to form the ARNT·TACC3 complex (Fig. 1a) (6). However, high resolution structural studies of the wild-type ARNT PAS-B·TACC3 complex have been complicated by the moderate (low micromolar) affinity observed for this protein/protein interaction.
FIGURE 1.
GCN4-TACC3-CT D622A/E629A is a constitutive homodimeric TACC3 construct with enhanced ARNT PAS-B binding. a, upper panel, schematic of full-length ARNT and TACC3 proteins, with directly interacting domains of the two proteins highlighted in blue (ARNT PAS-B) and orange (TACC domain). Lower panel, helical wheel projection of TACC3 WT(610–631). b, alanine scan of GST-TACC3(561–631) by pulldown assay, demonstrating that TACC3 D622A and E629A show dramatically enhanced affinity with ARNT PAS-B as individual and coupled point mutations. c, 15N/1H TROSY spectra of GCN4-TACC3-CT D622A/E629A at high (200 μm, 16 scans/increment, red) concentrations and low (12.5 μm, 128 scans/increment, blue contours) concentrations. Under both conditions, peaks in these spectra are well dispersed and superimposed well, indicating that this TACC3 construct is well folded and homogeneous under high and low concentration. d, Superdex 75 size-exclusion chromatography with in-line multiangle laser light scattering shows that this TACC3 construct forms a constitutive dimer (theoretical molar mass = 9.7 kDa for dimer) at concentrations between 10 and 164 μm. e, Ni2+ pulldown assay demonstrates that GCN4-TACC3-CT D622A/E629A competes with GST-TACC3(561–631) WT for ARNT PAS-B binding, indicating that GCN4-TACC3-CT D622A/E629A shares the same ARNT PAS-B binding interface with GST-TACC3(561–631) WT.
To optimize the ARNT·TACC3 complex for crystallography, we conducted an alanine scan of the TACC3 C terminus (TACC3-CT), identifying multiple mutations that appeared to strengthen the ARNT PAS-B·TACC3-CT complex as accessed by coprecipitation (Fig. 1, a and b). Among these mutations, two changes to surface-exposed charged residues (D622A and E629A) exhibited the strongest effects, whereas a TACC3 D622A/E629A double mutant provided an even stronger result (Fig. 1b). An N-terminal GCN4 fusion with TACC3-CT(610–631) D622A/E629A was used to ensure that the TACC3 double mutant was present as a constitutive homodimer (Fig. 1, c and d) (14, 29). Well dispersed peaks representing 43 out of 44 residues in the 15N/1H TROSY spectra demonstrated that the GNC4 fusion protein is well folded in solution (Fig. 1c). Nicely superimposed peaks in the 15N/1H TROSY spectra and the constant molar mass determined by size-exclusion multiangle laser light scattering further confirmed that the GCN4 fusion protein is a homogeneous homodimer at various concentrations in solution (Fig. 1, c and d). The GCN4-TACC3-CT D622A/E629A protein can also compete away the WT GST-TACC3(561–631) from a pre-formed complex with ARNT PAS-B in a pulldown assay, demonstrating that this stabilized dimeric high affinity TACC3 construct shares the same binding interface on ARNT PAS-B as WT TACC3 (Fig. 1e).
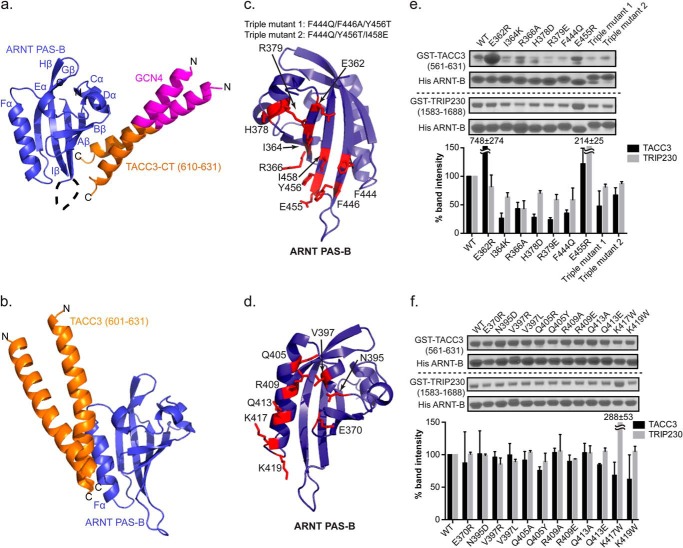
The high affinity ARNT PAS-B·GCN4-TACC3-CT D622A/E629A complex readily crystallized, ultimately providing a 3.15 Å dataset that was phased by molecular replacement using a crystal structure of the isolated ARNT PAS-B domain as a search model (Table 1 and Fig. 2a, PDB code 4LPZ) (17). As anticipated, GCN4-TACC3-CT D622A/E629A crystallized as a parallel coiled-coil dimer. Although the TACC3 portion of the fusion protein (Fig. 2a, orange, residue 610–631) contacts the β-sheet of ARNT PAS-B, burying a surface area of 610 Å2, the GCN4 tag (magenta) does not directly contact ARNT. Interestingly, the ARNT·TACC3 binding interface shown in this structure is different from a previous NMR-guided computational model where TACC3 makes primary contacts with ARNT PAS-B on the Fα-helix (Fig. 2b) (5). This observation makes it critical to further validate the current crystal structure.
FIGURE 2.
Structure and validation of the ARNT PAS-B·GCN4-TACC3-CT D622A/E629A complex. a, crystal structure of ARNT and TACC3 minimum interacting fragments (PDB code 4LPZ) as follows: ARNT PAS-B (blue)·GCN4-TACC3-CT D622A/E629A (orange). The GCN4 dimerization tag engineered into the TACC3 fragment is shown in magenta. In this structure, TACC3 binds to the β-sheet side of the ARNT PAS-B domain. b, HADDOCK model of a previous ARNT PAS-B·TACC3 complex model, showing TACC3 binding to ARNT PAS-B on the Fα helix (6). c and d, locations of sites on ARNT PAS-B β-sheet (c) and Fα helix (d) to test the structural models of ARNT/TACC3 interactions. e, Ni2+ pulldown assay and band quantification (mean ± one S.D., n = 2) shows that His-ARNT PAS-B β-sheet mutations modulate the binding of WT GST-TACC3, indicating that the β-sheet of ARNT PAS-B is the direct TACC3 binding interface. Similar to TACC3 interaction, nickel pulldown assay and band quantification (mean ± one S.D., n = 2) shows His-ARNT PAS-B β-sheet mutations change its affinity for WT GST-TRIP230(1583–1688), indicating that the β-sheet of ARNT PAS-B is the major interface for TRIP230 binding as well. f, nickel pulldown assay and band quantification show that His-ARNT PAS-B Fα mutation is unable to alter its affinity with WT GST-TACC3(581–631) and WT GST-TRIP230(1583–1688), indicating that the Fα is not the major CCC binding interface.
Validating the Binding Interface in ARNT PAS-B·GCN4-TACC3-CT D622A/E629A Crystal Structure by Mutagenesis
To confirm the ARNT·TACC3 binding interface revealed in our crystal structure of the complex, we extensively mutated the ARNT·TACC3 binding interface on the ARNT PAS-B side. As expected, single and triple mutants on the β-sheet of the PAS domain attenuated TACC3 binding (Fig. 2, c and e), although mutations on the ARNT Fα-helix, a surface that is not involved in the crystallographically defined binding interface, did not show comparable reduction in TACC3 binding (Fig. 2, d and f), confirming the ARNT PAS-B β-sheet as the major TACC3 binding interface.
We additionally tested the ARNT PAS-B complex with another CCC protein, TRIP230, testing whether ARNT PAS-B recruits a different CCC protein via the same β-sheet interface, as suggested by prior competition assays (6). As was the case for TACC3, most β-sheet mutants weakened the ARNT·TRIP230 interaction, whereas the Fα-helix mutants showed minimum effects, demonstrating that the ARNT PAS-B β-sheet is essential for CCC protein recruitment (Fig. 2, e and f).
Electrostatic Interactions Are Critical for ARNT·TACC3 Binding
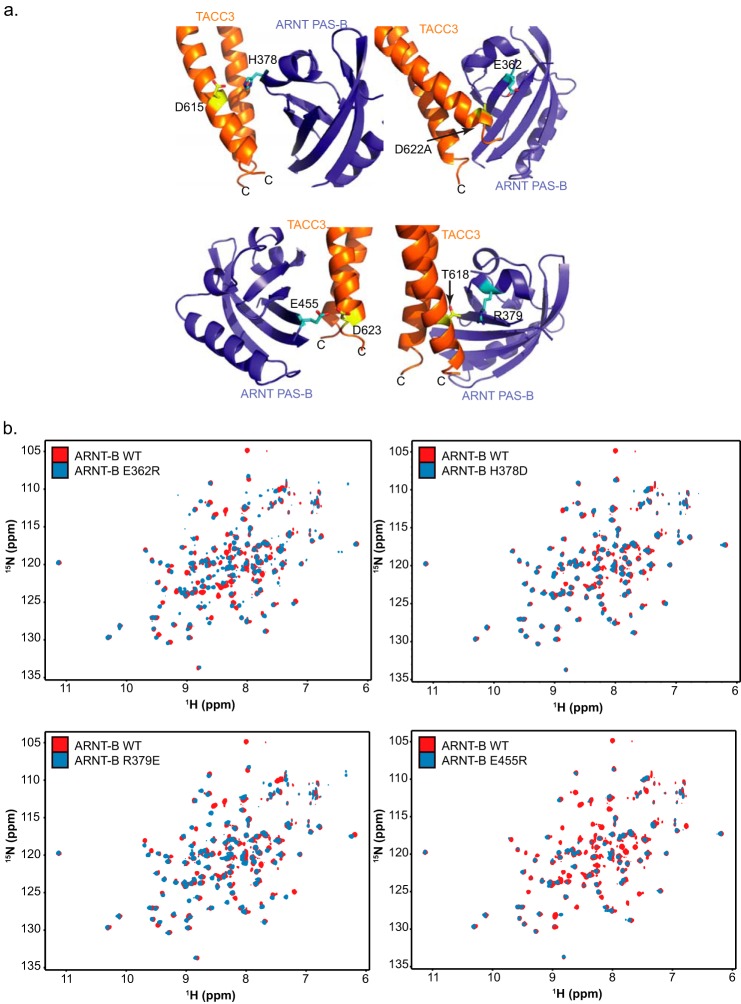
A close look at the binding interface of ARNT PAS-B and GCN4-TACC3-CT D622A/E629A revealed many inter-protein contacts involving charged residues. Mutations at two such residues on ARNT PAS-B (H378D and R379E) markedly reduced complexation with TACC3 in pulldown assays (Fig. 2, c and e), likely by removing an interface-spanning salt bridge by exchanging a stabilizing +/− charged residue pair for a repelling −/− charged pair (Fig. 3a). However, ARNT PAS-B E362R and E455R showed enhanced complex formation with TACC3 (Fig. 2, c and e), likely due to the formation of a new salt bridge with TACC3 Asp-622 and Asp-623, respectively, by flipping a −/− charged residue pair to a +/− charged pair (Fig. 3a). 15N/1H HSQC spectra of all four mutants overlapped nicely with the WT ARNT PAS-B spectrum (Fig. 3b); the most substantial differences were observed with E455R, which exhibited peak loss in ∼20% of residues suggestive of exchange broadening from increased dynamics, but otherwise it retained many peaks with characteristic chemical shifts identical to wild type. Taken together, these NMR data demonstrate that the binding perturbation observed in pulldown assays was not caused by protein unfolding or other artifacts (Fig. 3b).
FIGURE 3.
Illustration of four key residue pairs at the ARNT PAS-B·TACC3 interface. a, several pairs of residues at the ARNT·TACC3 interface involve charged groups; changing the electrostatic status of these residues can affect the ARNT PAS-B·TACC3 interaction (Fig. 2, c and e). b, 15N/1H HSQC spectra of four key ARNT PAS-B mutants shown in a confirm that these mutants are not unfolded by the mutations and adopt similar structures to the wild-type proteins, as established by good chemical shift dispersion and overlap with the WT ARNT PAS-B spectrum. These data further confirm that the effects observed in Fig. 2, c and e, are not due to protein misfolding.
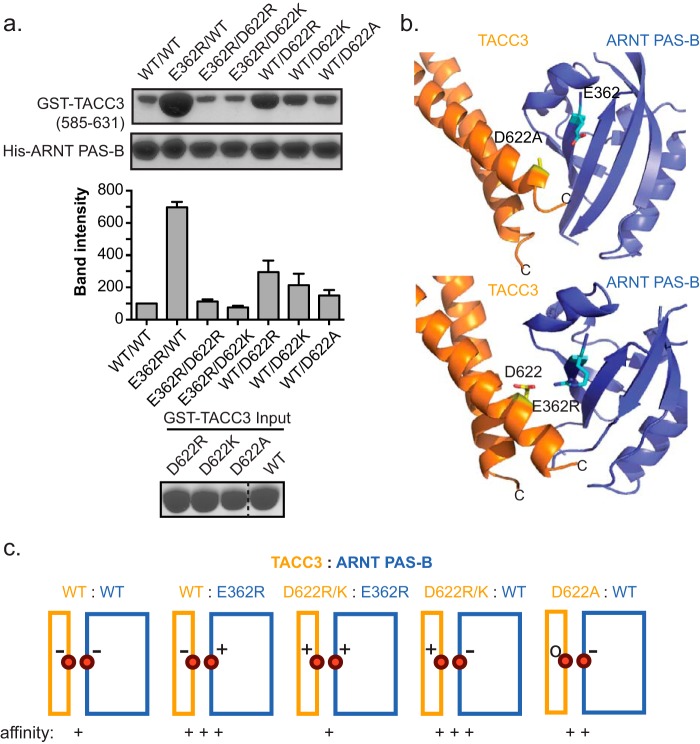
Likewise, the high affinity mutants used in crystallography appear to work by alleviating electrostatic repulsion present at the ARNT·TACC3 interface by removing one negatively charged residue in the −/− charged residue pair consisting of TACC3 Asp-622 and ARNT PAS-B Glu-362. To test this hypothesis, a mutagenesis study with different combinations of charged residues at the ARNT Glu-362 and TACC3 Asp-622 positions was conducted to examine the binding affinity alteration. As expected, the highest affinity enhancement was observed in the ARNT E362R·TACC3 WT, ARNT WT·TACC3 D622R, and ARNT WT·D622K complex, where a pair of +/− residues face each other at the binding interface. Moderate affinity enhancement was shown in the ARNT WT·TACC3 D622A complex, where one of the negatively charged residues was replaced with a neutral residue. Minimal effects were observed in both the −/− pairs present in the ARNT WT·TACC3 WT complex, and for +/+ pair complexes such as ARNT E362R·TACC3 D622R and ARNT E362R·ACC3 D622K (Fig. 4, a and c). We observed such a salt bridge in another ARNT·TACC3 complex crystal structure solved to 3.2 Å resolution (ARNT PAS-B E362R·TACC3(585–631) WT) (Figs. 4b and 5a and Table 1, PDB code 4PKY). Superimposition of this structure with the previous ARNT PAS-B·GCN4-TACC3-CT D622A/E629A crystal structure showed excellent similarity (r.m.s.d. = 0.9 Å over 153 aligned Cα carbons; Fig. 5b), suggesting that the different mutations involved in stabilizing the two complexes had minimal effects on the observed structures. The stabilizing effects of ARNT Glu-362 and TACC3 Asp-622 mutations further establish their importance as critical contact spots at the binding interface, with changes to their charges substantially affecting binding. These results also confirmed that the ARNT PAS-B β-sheet, where residue 362 is located, is directly associated in TACC3 complexation.
FIGURE 4.
Charge swaps between interacting pairs of residues in ARNT·TACC3 complex further confirms the interacting interface. a, Ni2+ pulldown assay to measure binding between residue pair His-ARNT PAS-B Glu-362 and GST-TACC3 Asp-622 mutants. Residue pairs with favorable (+/−) or neutral (−/0) electrostatics (e.g. E362R/WT, WT/D622R, and WT/D622A) increase the apparent affinity, although repulsive (−/−, +/+) pairs (e.g. E362R/D622R and E362R/D622K) reduce the binding affinity. GST-TACC3 input gel shows equal loading amount. b, crystal structures of ARNT PAS-B·GCN4-TACC3-CT D622A/E629A (upper panel) and ARNT PAS-B E362R·TACC3(585–631) WT (lower panel) show the close proximity of ARNT PAS-B Glu-362 to TACC3 Asp-622 in both structures. The ARNT/TACC3 affinity improvement in both mutant complexes seems likely to be caused by alleviation of the electrostatic repulsion between these negatively charged groups in WT proteins. c, schematic summary of the relationship between interfacial charge-charge interactions and ARNT/TACC3 affinity (TACC3, orange; ARNT PAS-B, blue).
FIGURE 5.
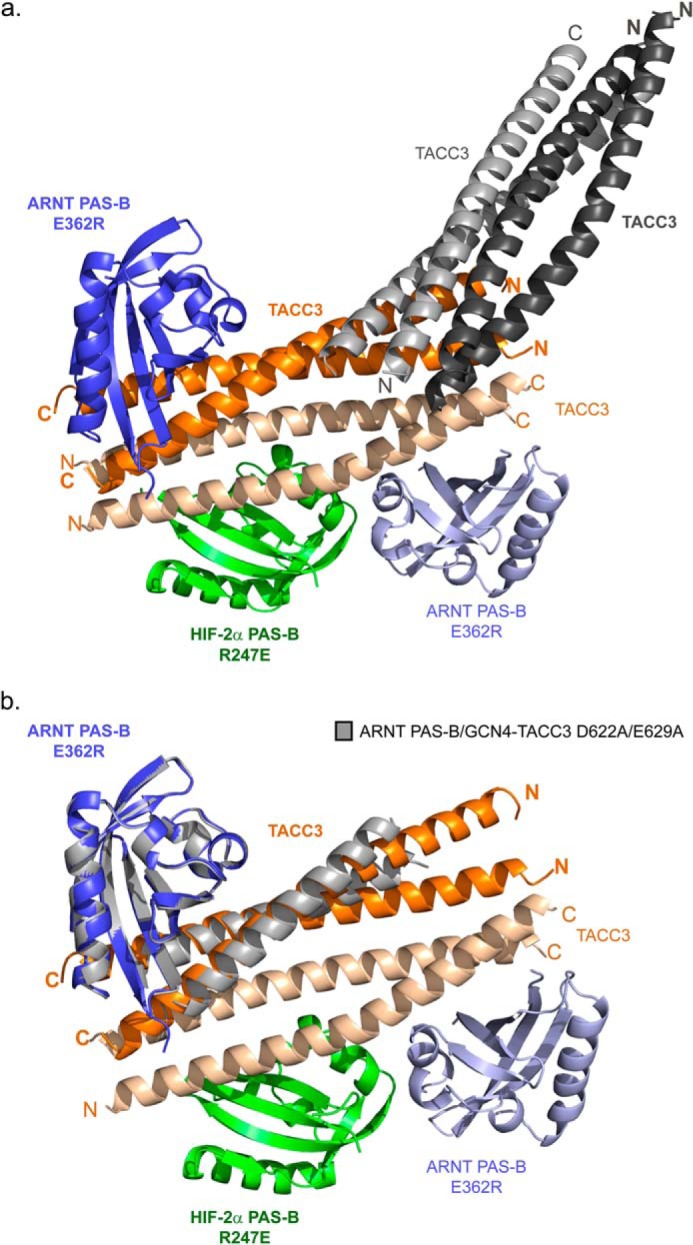
ARNT PAS-B E362R·TACC3-CT/HIF-2α PAS-B R247E structure adopts a similar ARNT·TACC3 interface to the ARNT PAS-B·GCN4-TACC3-CT D622A/E629A structure. a, ARNT PAS-B E362R·TACC3-CT·HIF-2α PAS-B R247E structure with symmetry mates (PDB code 4PKY). ARNT PAS-B E362R, TACC3, and HIF-2α PAS-B R247E are highlighted in blue, orange, and green, respectively. Monomers within the crystallographic asymmetric unit are shown in color and boldface text. Noncrystallographic symmetry-related monomers within the same asymmetric unit are shown in lighter color. Two TACC3(585–631) homodimers related by crystallographic symmetry are shown in shades of gray; these bind in approximately the noncrystallographic symmetry (-equivalent position as the monomer of HIF-2α PAS-B R247E. In this structure, ARNT PAS-B E362R forms major contacts with the TACC3(585–631) C terminus via the PAS-B β-sheet, consistent with the ARNT PAS-B·GCN4-TACC3-CT D622A/E629A crystal structure (Fig. 2a). The monomer of HIF-2α PAS-B R247E displays minimal contact with the N-terminal portion of the TACC3(585–631) homodimer, with a buried surface area of <500 Å2. The minimal buried surface area and the lack of a second HIF-2α PAS-B R247E monomer bound to the noncrystallographic 2-fold related TACC3 homodimer suggests that the HIF-2α PAS-B R247E is simply a part of the crystalline lattice, and this interaction would not be observed in solution. b, superposition of ARNT·TACC3 portion of the ARNT PAS-B E362R·TACC3-CT·HIF-2α PAS-B R247E structure with ARNT PAS-B·GCN4-TACC3-CT D622A/E629A structure (gray). Two structures overlaid very well with a backbone r.m.s.d. = 0.9 Å over 153 aligned Cα.
ARNT·TACC3 Interaction in Solution Is Similar to the Crystal Structure
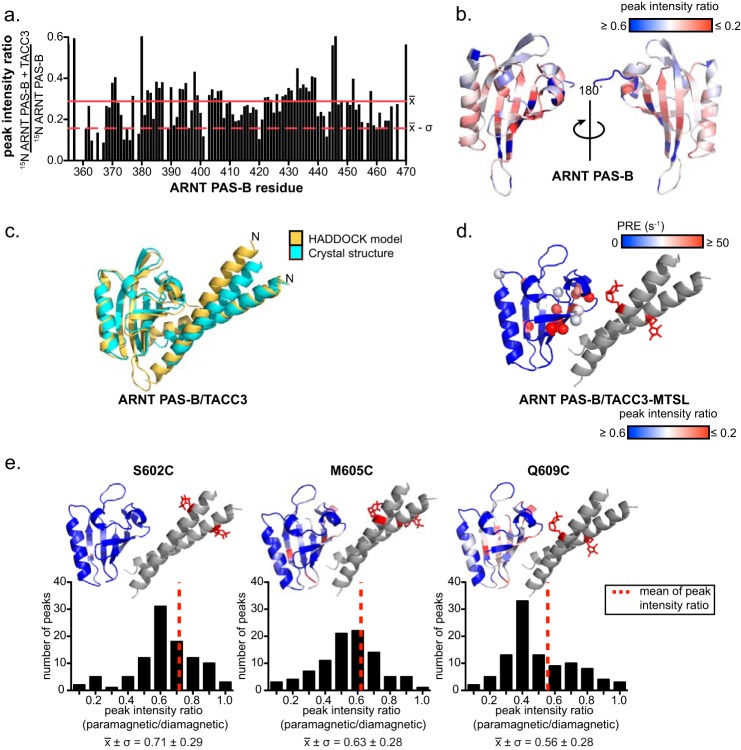
Although our two independent crystal structures and accompanying mutagenesis data supported the use of an ARNT β-sheet binding mode, we sought to further validate this with additional structural information from the ARNT PAS-B·TACC3 complex in solution. To do so, we titrated TACC3(585–631) into 15N-labeled ARNT PAS-B, with complex formation monitored by 15N/1H HSQC spectra. We observed intermediate chemical exchange behavior from the ARNT signals as TACC3 was titrated, suggesting a low to mid-micromolar range affinity. The most severely broadened residues were localized to the β-sheet of ARNT PAS-B (Fig. 6, a and b) (17, 26), consistent with this site binding TACC3. Analyzing these data with the protein rigid body docking program HADDOCK (28) found TACC3 interacting with the ARNT PAS-B β-sheet in a fashion similar to that observed in the crystal structure (Fig. 6c). Superposition of this solution NMR-guided model with the ARNT PAS-B E362R·TACC3(585–631) crystal structure revealed good agreement between solid state and solution measurements (r.m.s.d. = 2.1 Å over 163 aligned Cα carbons).
FIGURE 6.
Solution NMR studies of ARNT·TACC3 complexes are consistent with the crystal structures. a, ARNT PAS-B·TACC3 interaction observed by solution NMR. 225 μm TACC3(585–631) WT (monomeric concentration) was mixed into 100 μm 15N-labeled ARNT PAS-B. The peak broadening ratio of ARNT PAS-B residues caused by addition of TACC3 is plotted in a bar graph (mean intensity ratio, red line; mean intensity ratio −σ, red dashed line). b, ARNT PAS-B peak intensity ratio mapped onto the ARNT PAS-B crystal structure (PDB code 4EQ1 (17)) and PRE broadening effects mapped from low (blue) to high (red), with the largest broadening effects shown on the β-sheet. c, HADDOCK model of ARNT·TACC3 complex using the most severely broadened residues (peak intensity ratio ≤) as active residues. The top scoring HADDOCK model (lowest energy) is shown in yellow, superimposed on the ARNT PAS-B E362R·TACC3(585–631) crystal structure (cyan) (Cα r.m.s.d. = 2.1 Å). d, PRE effects of TACC3(585–631) Q609C-MTSL on 15N-labeled ARNT PAS-B mapped on the ARNT PAS-B·GCN4-TACC3-CT D622A/E629A crystal structure (approximate location of the MTSL group shown as red sticks). ARNT PAS-B residues with pronounced PRE effects are highlighted as spheres and colored from lower (blue) to higher (red) effects. Note that residues with the large PRE effects (red spheres) are mostly localized near the spin label. e, PRE experiments with TACC3 constructs with different spin label sites demonstrated consistent ARNT·TACC3 orientations in solution and solid state. Upper panel, individual spin label positions on TACC3 (Ser-602, Met-605, and Gln-609, shown as red sticks) and their corresponding peak broadening effects mapped on 15N-labeled ARNT PAS-B (blue, less broadening; red, more broadening). TACC3 Q609C-MTSL induced the most substantial peak broadening effects, whereas TACC3 M605C- and S602C-MTSL induced less broadening consistent with further distance from ARNT PAS-B. Lower panel, peak broadening ratio distribution induced by the corresponding spin labels. Histograms of these ratios show mean peak intensity ratio histograms shift to a lower number (to the left, more broadening) when moving the spin label toward the C terminus of TACC3, demonstrating that the average distance between spin labels and ARNT PAS-B sites (r) follows the progression rS602C > rM605C > rQ609C.
To further bolster support of the present HADDOCK-calculated model, we obtained long range distance restraints between sites on the TACC3 dimer and those in bound ARNT PAS-B domains using PRE (30). In this experiment, TACC3(585–631) residue Gln-609 was mutated to a cysteine (Q609C), facilitating the cross-linking of the nitroxyl spin label MTSL to this position (Fig. 6d). T2 relaxation rates were measured from 15N-labeled ARNT PAS-B residues by TROSY-HSQC in the presence of TACC3(585–631) Q609C-MTSL under both oxidative (paramagnetic status) and reducing conditions (diamagnetic status, negative control). The observed net change in relaxation rates measured under oxidative and reducing conditions were converted to PRE values (s−1). Residues close to the MTSL unpaired electron (less than 25 Å) should have larger differences in relaxation rates between these two conditions and correspondingly larger PRE values (highlighted in red spheres, Fig. 6d), whereas residues that are far away from the spin label should have smaller PRE values. For TACC3 Q609C-MTSL, 15N-labeled ARNT PAS-B amide groups with the largest PRE values mapped to ARNT PAS-B sites proximal to TACC3 Gln-609 in the crystal structure (Fig. 6d). MTSL labeling at other TACC3 sites more distal to ARNT PAS-B in the crystal structure (S602C and M605C) attenuated the observed PRE effects (Fig. 6e). These solution NMR experiments collected from wild-type proteins provide key independent confirmations of the complex arrangement observed in the ARNT PAS-B·TACC3 crystal structures.
HIF-2α PAS-B Also Directly Interacts with the TACC3 C Terminus
TACC3-dependent transactivation of HIF genes requires the formation of a HIF-2α, ARNT, and TACC3 ternary complex (6). We monitored formation of this complex using MST, a technique that detects macromolecular associations by changes in thermophoretic mobility, which in turn depends on complex molecular weight, hydration, and other parameters (31). MST data collected while titrating TACC3 into a sample of ARNT PAS-B E362R revealed three distinct states with increasing TACC3 concentrations (Fig. 7a) as follows: a free ARNT PAS-B domain; a 2:1 ARNT·TACC3 dimer complex; and a final complex with a 1:1 ARNT·TACC3 dimer (state iii). These data established the potential for a TACC3 dimer to simultaneously engage two PAS-B domains, as required for formation of the ternary complex.
FIGURE 7.

HIF-2α PAS-B cooperatively forms a TACC3-mediated ternary complex with ARNT PAS-B. a, TACC3 binds ARNT PAS-B E362R. TACC3(561–631) dimer was titrated into ARNT PAS-B E362R-fluor and monitored by changes in microscale thermophoresis. With increasing TACC3 concentrations, we observed three binding stages: (i) ARNT PAS-B E362R alone (blue); (ii) two ARNT PAS-B E362R bound to one TACC3 dimer (yellow); (iii) one ARNT PAS-B E362R bound to one TACC3 dimer (red). Subsequent experiments were conducted at 2 μm TACC3 dimer concentration, where a 1:1 ratio of ARNT PAS-B to TACC3 dimer is present (dashed line). b, HIF-2α PAS-B forms a ternary complex with ARNT PAS-B E362R·TACC3 complex. Titrating HIF-2α PAS-B into preformed ARNT PAS-B E362R-fluor·TACC3 complex (red) showed an approximate midpoint of ∼30 μm HIF-2α PAS-B, indicating that HIF-2α PAS-B bound ARNT PAS-B E362R-fluor·TACC3 to form a ternary complex. Titrating HIF-2α PAS-B into ARNT PAS-B E362R-fluor alone (blue) begins to saturate only at higher HIF-2α PAS-B concentrations, consistent with the low affinity between HIF-2α PAS-B and ARNT PAS-B E362R(20). c, HIF-2α PAS-B inhibitor (compound 2 (32)) reduces the apparent affinity of HIF-2α PAS-B to form a ternary complex with ARNT·TACC3. Titrating an equimolar mixture of HIF-2α PAS-B/compound 2 into ARNT PAS-B E362R-fluor·TACC3 showed at a least 10-fold higher apparent Kd value compared with the DMSO control (apparent Kd ∼30 μm), indicating reduced affinity between HIF and ARNT·TACC3 in the presence of compound 2. This result also demonstrated that HIF-2α PAS-B β-sheet is critical for this ternary complex formation.
Using conditions we identified to make the 1:1 ARNT PAS-B E362R·TACC3 dimer complex, we titrated HIF-2α PAS-B into these samples and controls of ARNT PAS-B E362R alone (Fig. 7b). As expected, HIF-2α PAS-B formed ternary complexes with the ARNT PAS-B E362R·TACC3 complex. Notably, this interaction was an order of magnitude tighter than the HIF-2α·ARNT PAS-B E362R interaction on its own (Fig. 7b). Although the MST data establishes the existence of this three-way complex, they do not provide complementary views of the structural arrangements within the complex. A key piece of inferential information about this arrangement was provided by examining the effects of adding an allosteric HIF-2α inhibitor, compound 2 (32), to the ternary complex. This chemical binds within the HIF-2α PAS-B domain, triggering structural changes on its β-sheet and is known to down-regulate HIF-2-driven transcription in cells. Here, we found that compound 2 weakened the binding of HIF-2α PAS-B to the ARNT·TACC3 binary complex by approximately an order of magnitude (Fig. 7c). This result discounts any potential nonspecific interaction between HIF-2α PAS-B interacting with the ARNT·TACC3 complex and further implicates the use of the HIF-2α PAS-B β-sheet as the binding surface for this interaction.
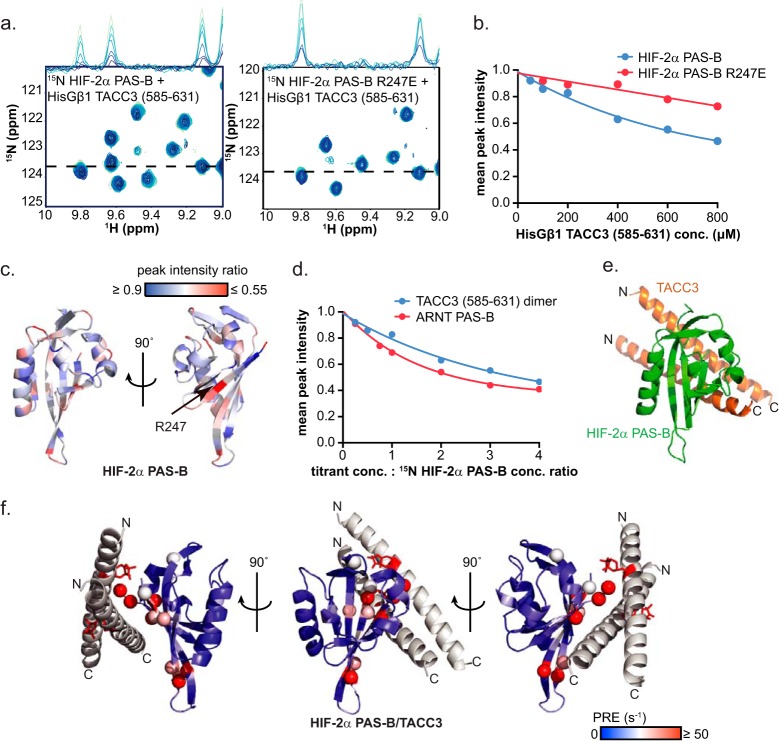
To get direct evidence for this interaction, we titrated HisGβ1-TACC3(585–631) into 15N-labeled HIF-2α PAS-B samples, using 15N/1H HSQC spectra to monitor binding. These NMR data revealed TACC3-dependent peak broadening effects (Fig. 8, a and b) at sites that mapped predominantly to the HIF-2α PAS-B β-sheet (Fig. 8c). HIF-2α PAS-B residue Arg-247 was particularly broadened (Fig. 8c). Mutating HIF-2α Arg-247 to glutamic acid attenuated the overall peak broadening effect (Fig. 8, a and b), further confirming HIF-2α PAS-B β-sheet as the TACC3-binding site. Moreover, the degree of peak intensity changes induced by TACC3 in 15N-labeled HIF-2α PAS-B WT spectra were comparable with those caused by ARNT PAS-B in similar titrations (25), suggesting that the HIF-2α PAS-B·TACC3 interaction has a similar binding affinity (Fig. 8d).
FIGURE 8.
HIF-2α PAS-B directly interacts with TACC3. a, HisGβ1 TACC3(585–631) induces peak broadening in 15N/1H HSQC spectra upon progressive addition to either 15N-labeled HIF-2α PAS-B WT and 15N-labeled HIF-2α PAS-B R247E, indicating direct interactions between HIF-2α PAS-B and TACC3. TACC3 concentration-dependent peak broadening is illustrated as one-dimensional traces of the 1H dimension (with increasing concentrations of HIF-2α going from light to dark blue). b, quantification of a shows weaker TACC3-mediated broadening effects for HIF-2α PAS-B R247E than HIF-2α PAS-B WT, suggesting that residue Arg-247 is involved in TACC3 binding. c, 15N-labeled HIF-2α PAS-B peak broadening ratio is mapped on the HIF-2α PAS-B crystal structure (PDB code 3F1O (20)) (peak broadening is colored from less (blue) to more (red) with the largest effects apparent on the β-sheet). Residue Arg-247 was substantially affected by the TACC3 binding (black arrow). d, 15N-labeled HIF-2α PAS-B·HisGβ1 TACC3(585–631) interaction shows comparable peak broadening effects as the 15N-labeled HIF-2α PAS-B/ARNT PAS-B interaction, demonstrating that the TACC3-induced peak broadening is not due to nonspecific aggregation. e, HADDOCK (28) model of the binary HIF-2α PAS-B·TACC3 complex was generated by utilizing the top 20 most severely broadened HIF-2α PAS-B residues in 15N-labeled HIF-2α PAS-B·TACC3 titration experiment and all solvent-exposed TACC3 residues in TACC3-CT as active residues (see Table 2). The most abundant cluster from the prediction is shown here, where TACC3 binds to HIF-2α PAS-B at the β-sheet. f, TACC3-Q609C-MTSL induces significant PRE effects at positions adjacent to the spin label as predicted in the HIF-2α PAS-B·TACC3 HADDOCK model, demonstrating that the model accurately represents the solution complex.
Based on these NMR mapping data, we generated a HADDOCK model of the TACC3 C- terminal dimer bound to HIF-2α PAS-B on the β-sheet (Fig. 8e and Table 2). We further validated this HIF-2α PAS-B·TACC3 HADDOCK model by PRE experiments where TACC3(585–631) Q609C-MTSL induced PRE effects on several 15N-labeled HIF-2α PAS-B β-sheet residues that are adjacent to the spin label (red stick) (Fig. 8f).
Model of the ARNT·TACC3·HIF Ternary Complex
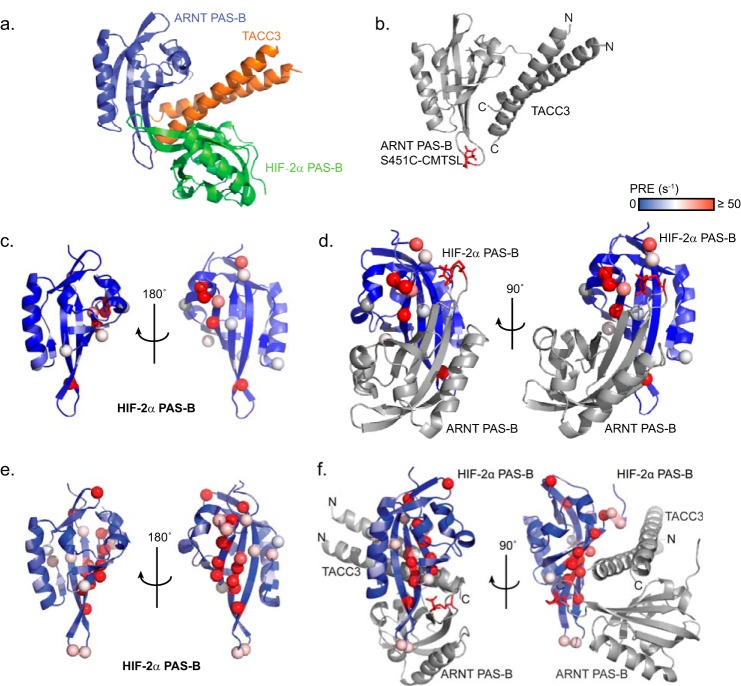
The preceding biophysical characterization and computational model of the HIF-2α PAS-B·TACC3 complex provides the structural basis for an initial view of ARNT·TACC3·HIF ternary complex assembly. By comparing the TACC3-binding modes with both HIF-2α and ARNT PAS-B, we hypothesized that TACC3 could use both sides of the coiled-coil dimer to simultaneously recruit HIF-2α and ARNT via their PAS-B β-sheets to assemble the ternary complex observed by MST. As a starting model for the ARNT·TACC3·HIF ternary complex, we superimposed the TACC3 dimers from the experimental ARNT PAS-B·TACC3 crystal structure (PDB code 4LPZ) and HIF-2α PAS-B·TACC3 HADDOCK model (Fig. 9a). Assembled together into this model, the ARNT and HIF-2α PAS-B β-sheets are able to simultaneously contact opposite surfaces of the TACC3 dimer.
FIGURE 9.
Characterization of the ARNT PAS-B·TACC3·HIF-2α PAS-B ternary complex. a, HADDOCK model (28) of the ARNT PAS-B·TACC3·HIF-2α PAS-B ternary complex, generated using residues described in Table 2. b, approximate location of the ARNT PAS-B·TACC3 complex labeled with CMTSL at ARNT residue 451 (red sticks). c, titrating ARNT PAS-B S451C-CMTSL into 15N-labeled HIF-2α PAS-B induced several PRE effects on the β-sheet of HIF-2α PAS-B. Highly affected HIF-2α PAS-B residues are highlighted in spheres, and the overall PRE effect is colored from less (blue) to more (red). d, PRE effects from c are mapped onto the HIF-2α PAS-B·ARNT PAS-B crystal structure (PDB code 3F1O (20)), showing that the most highly affected residues are localized close to the CMTSL spin label (red sticks). e, adding TACC3 into 15N-labeled HIF-2α PAS-B·ARNT PAS-B S451C-CMTSL heterodimer induces stronger PRE effects at a larger number of sites on the HIF-2α PAS-B β-sheet, consistent with more complex formation and shorter distances between the CMTSL label and HIF-2α PAS-B residues via a TACC3-dependent complex rearrangement. f, TACC3-dependent PRE effects in e are mapped on the ternary structure model in a (blue–red, low to high PRE effect), highlighting the most affected residues in red spheres. Most spheres surround the S451C-CMTSL spin label (red sticks), suggesting a good agreement between the experimental data and the ternary structure model.
To validate this model, we obtained distance restraints between ARNT PAS-B S451C-CMTSL and 15N-labeled HIF-2α PAS-B residues by PRE under conditions with or without TACC3 (Fig. 9b). In the absence of TACC3, only a few HIF-2α PAS-B residues (located at the beginning of the Aβ strand) were affected by the ARNT-bound spin label (Fig. 9c). These sites agree with the anti-parallel assembly in our previously determined HIF-2α·ARNT PAS-B crystal structure (Fig. 9d) (20), suggesting that some of this complex formed under these solution conditions. These PRE effects on 15N-labeled HIF-2α PAS-B were substantially enhanced in the presence of TACC3, especially for residues in the Hβ and Iβ strands, indicating both a closer proximity and different arrangement to the ARNT PAS-B S451C-CMTSL spin label in the presence of TACC3 (Fig. 9e). This result is well accommodated with a ternary structure model where most of the highly affected residues (spheres) are clustered in the vicinity of ARNT PAS-B S451C-CMTSL spin label (red sticks) (Fig. 9f). Taken together, this ternary complex model successfully integrates data from multiple biophysical and biochemical approaches, including the effects of an allosteric HIF-2α PAS-B inhibitor (32), giving us confidence in its representation of the solution complex of these three proteins.
DISCUSSION
Our HIF·TACC3 structural study reveals a unique mode of transcription activator/coactivator recruitment in the HIF-mediated hypoxia response, adding to the previously described canonical recruitment of p300 coactivator with transcriptional activation domains in the HIF-α C terminus (4). Here, we solved two crystal structures of ARNT PAS-B·TACC3 complexes and characterized the wild-type ARNT·TACC3 interaction in solution. These results consistently show that the ARNT PAS-B β-sheet provides the direct interface for TACC3 binding. Interestingly, this β-sheet interaction surface has also been found for other intermolecular interactions, such as with the HIF-α PAS-B domains (20), and more broadly with PAS domains in other bHLH/PAS transcription factors (33) and other types of proteins (13). Although this result might initially suggest competition between TACC3 and HIF-α PAS-B for ARNT binding, our MST data clearly demonstrate a cooperative effect among the three proteins (Fig. 7b).
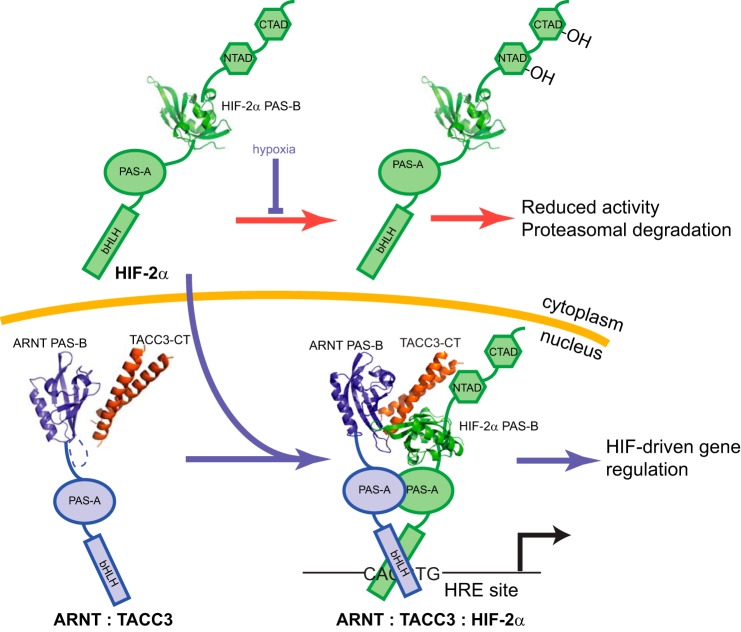
To provide a structural basis for this cooperativity, we generated a data-driven model where TACC3 mediates a ternary complex with both PAS-B domains. Our model suggests that the ARNT PAS-B β-sheet can be bound either directly by HIF-2α (20) or TACC3 itself; if the latter, a new HIF-2α PAS-B-binding site is available on the opposite side of the TACC3 dimer to form the ternary complex. As a result, recruiting TACC3 to the β-sheet of ARNT PAS-B will not impair the integrity of the larger HIF-α·ARNT heterodimer nor its transcription factor activity (Fig. 10).
FIGURE 10.
Model of the role of TACC3 within HIF-2 transcriptional activation. HIF complexes are bHLH-PAS heterodimers that include an O2-sensitive HIF-α subunit and a constitutive ARNT subunit. Under normoxia, O2-dependent hydroxylation of HIF-2α decreases its abundance and activity (red arrows) (2). Such modifications do not happen on ARNT and TACC3 so the ARNT·TACC3 complex is readily assembled in the nucleus. Hypoxia stops the hydroxylation, allowing HIF-2α to accumulate in the nucleus and complex with ARNT·TACC3. Here, we propose that TACC3 simultaneously engages the PAS-B domains from both HIF-2α and ARNT PAS-B, directing recruitment of this CCC protein to hypoxia-responsive enhancer (HRE) sites, controlling target gene transcription (blue arrows).
We suggest that the alternative ARNT PAS-B binding modes indicated by our work, direct binding to HIF-2α PAS-B or in a ternary complex with HIF-2α and TACC3, may be in equilibrium in the full-length heterodimeric transcription factor. As such, mutations or other factors that shift this equilibrium would be expected to shift the ability of the HIF transcription factor to activate gene transcription, with accompanying potential for misregulation. Notably, two such alterations are correlated within patient-derived tumor samples of various urogenital cancers (34), including a somatic TACC3 alteration in the ARNT·HIF-α interacting region (D622N in mouse sequence; D829N in human) and up-regulation of TACC3 levels through gene amplification in 5–10% of these cancers. We postulate that these effects could stabilize the formation of the HIF-α·TACC3·ARNT ternary complex, either by a stabilizing mutation that functions similarly to our TACC3 D622A mutant in our crystallography study or by mass action, with the net effect of inappropriately enhancing HIF-dependent gene up-regulation.
On a technical point, it is worth noting that the binding models we describe here for ARNT·TACC3 interactions differ somewhat from a previous NMR-guided model (Fig. 2b) (6). Our initial model, generated with a more limited set of experimental data and before the solutions of our crystal structures, identified the Fα-helix as the principal TACC3-binding site. With the new data presented here, we rigorously tested predictions of both the Fα-helix and β-sheet-directed binding models in light of the differences among them. Several lines of evidence, particularly the minimal effects of ARNT Fα-helix mutants on TACC3 binding and the largest magnitude NMR broadening effects clustering on the ARNT β-sheet, unambiguously establish that the current structure represents the solution structure of the ARNT PAS-B·TACC3 complex.
Closing with the broader context for this work, the ARNT·CCC interaction plays an important role in mammalian hypoxia response. Because ARNT is the common partner for all three HIF-α paralogs, blocking ARNT·CCC interactions could affect all HIF-α-containing transcription factors. This suggests that directly targeting the ARNT·CCC complex may represent an interesting approach to regulate HIF activity in cancer therapy, complementing previously described methods that target specific HIF-α isoforms (32, 35). In such work, our in vitro small molecule inhibitors that target a water-binding cavity inside ARNT PAS-B, induce conformational changes, and disrupt full-length ARNT/TACC3 interactions (17) represent a starting point for the development of such approaches. As such, further refinement of these inhibitors, particularly to optimize cellular and in vivo potency, could be a promising therapeutic route for HIF-dependent cancer treatment and a powerful tool for studying CCC function in hypoxia signaling pathways.
Acknowledgments
We thank Dr. Richard Bruick for discussions about this work and HIF signaling in general, Drs. Arati Ramesh and Dominika Borek for their kind help with x-ray crystallography data analysis, Dr. Fernando Correa for assistance with PRE data analysis, and Dr. Chad Brautigam for assistance with MST assay. Portions of this work were performed at Argonne National Laboratory, Structural Biology Center at the Advanced Photon Source. The Argonne National Laboratory is operated by UChicago Argonne, LLC, for the United States Department of Energy, Office of Biological and Environmental Research under Contract DE-AC02-06CH11357.
This work was supported, in whole or in part, by National Institutes of Health Grants R01 GM081875, P01 CA095471, and F32 CA130441. This work was also supported by Cancer Prevention and Research Institute of Texas Grants RP100846 and RP130513.
The atomic coordinates and structure factors (codes 4LPZ and 4PKY) have been deposited in the Protein Data Bank (http://wwpdb.org/).
- HIF
- hypoxia inducible factor
- ARNT
- aryl hydrocarbon receptor nuclear translocator
- bHLH
- basic helix loop helix
- PAS
- Per-ARNT-Sim
- CCC
- coiled-coil coactivator
- TACC
- transforming acidic coiled-coil coactivator
- FGFR
- fibroblast growth factor receptor
- PRE
- paramagnetic relaxation enhancement
- MST
- microscale thermophoresis
- MTSL
- (1-oxyl-2,2,5,5-tetramethyl-Δ3-pyrroline-3-methyl) methanethiosulfonate
- CMTSL
- (1-oxyl-2,2,5,5-tetramethylpyrroline-3-yl) carbamidoethyl methanethiosulfonate
- PDB
- Protein Data Bank
- r.m.s.d.
- root mean square deviation.
REFERENCES
- 1. Majmundar A. J., Wong W. J., Simon M. C. (2010) Hypoxia-inducible factors and the response to hypoxic stress. Mol. Cell 40, 294–309 [DOI] [PMC free article] [PubMed] [Google Scholar]
- 2. Semenza G. L. (2012) Hypoxia-inducible factors in physiology and medicine. Cell 148, 399–408 [DOI] [PMC free article] [PubMed] [Google Scholar]
- 3. Gordan J. D., Simon M. C. (2007) Hypoxia-inducible factors: central regulators of the tumor phenotype. Curr. Opin. Genet. Dev. 17, 71–77 [DOI] [PMC free article] [PubMed] [Google Scholar]
- 4. Freedman S. J., Sun Z. Y., Poy F., Kung A. L., Livingston D. M., Wagner G., Eck M. J. (2002) Structural basis for recruitment of CBP/p300 by hypoxia-inducible factor-1α. Proc. Natl. Acad. Sci. U.S.A. 99, 5367–5372 [DOI] [PMC free article] [PubMed] [Google Scholar]
- 5. Partch C. L., Card P. B., Amezcua C. A., Gardner K. H. (2009) Molecular basis of coiled coil coactivator recruitment by the aryl hydrocarbon receptor nuclear translocator (ARNT). J. Biol. Chem. 284, 15184–15192 [DOI] [PMC free article] [PubMed] [Google Scholar]
- 6. Partch C. L., Gardner K. H. (2011) Coactivators necessary for transcriptional output of the hypoxia-inducible factor, HIF, are directly recruited by ARNT PAS-B. Proc. Natl. Acad. Sci. U.S.A. 108, 7739–7744 [DOI] [PMC free article] [PubMed] [Google Scholar]
- 7. Partch C. L., Gardner K. H. (2010) Coactivator recruitment: a new role for PAS domains in transcriptional regulation by the bHLH-PAS family. J. Cell. Physiol. 223, 553–557 [DOI] [PMC free article] [PubMed] [Google Scholar]
- 8. Kim J. H., Stallcup M. R. (2004) Role of the coiled-coil coactivator (CoCoA) in aryl hydrocarbon receptor-mediated transcription. J. Biol. Chem. 279, 49842–49848 [DOI] [PubMed] [Google Scholar]
- 9. Beischlag T. V., Taylor R. T., Rose D. W., Yoon D., Chen Y., Lee W. H., Rosenfeld M. G., Hankinson O. (2004) Recruitment of thyroid hormone receptor/retinoblastoma-interacting protein 230 by the aryl hydrocarbon receptor nuclear translocator is required for the transcriptional response to both dioxin and hypoxia. J. Biol. Chem. 279, 54620–54628 [DOI] [PubMed] [Google Scholar]
- 10. Sadek C. M., Jalaguier S., Feeney E. P., Aitola M., Damdimopoulos A. E., Pelto-Huikko M., Gustafsson J. A. (2000) Isolation and characterization of AINT: a novel ARNT interacting protein expressed during murine embryonic development. Mech. Dev. 97, 13–26 [DOI] [PubMed] [Google Scholar]
- 11. Singh D., Chan J. M., Zoppoli P., Niola F., Sullivan R., Castano A., Liu E. M., Reichel J., Porrati P., Pellegatta S., Qiu K., Gao Z., Ceccarelli M., Riccardi R., Brat D. J., et al. (2012) Transforming fusions of FGFR and TACC genes in human glioblastoma. Science 337, 1231–1235 [DOI] [PMC free article] [PubMed] [Google Scholar]
- 12. Sheffield P., Garrard S., Derewenda Z. (1999) Overcoming expression and purification problems of RhoGDI using a family of “parallel” expression vectors. Protein Expr. Purif. 15, 34–39 [DOI] [PubMed] [Google Scholar]
- 13. Harper S. M., Neil L. C., Gardner K. H. (2003) Structural basis of a phototropin light switch. Science 301, 1541–1544 [DOI] [PubMed] [Google Scholar]
- 14. Greenfield N. J., Montelione G. T., Farid R. S., Hitchcock-DeGregori S. E. (1998) The structure of the N terminus of striated muscle α-tropomyosin in a chimeric peptide: nuclear magnetic resonance structure and circular dichroism studies. Biochemistry 37, 7834–7843 [DOI] [PubMed] [Google Scholar]
- 15. Minor W., Cymborowski M., Otwinowski Z., Chruszcz M. (2006) HKL-3000: the integration of data reduction and structure solution–from diffraction images to an initial model in minutes. Acta Crystallogr. D Biol. Crystallogr. 62, 859–866 [DOI] [PubMed] [Google Scholar]
- 16. McCoy A. J., Grosse-Kunstleve R. W., Adams P. D., Winn M. D., Storoni L. C., Read R. J. (2007) Phaser crystallographic software. J. Appl. Crystallogr. 40, 658–674 [DOI] [PMC free article] [PubMed] [Google Scholar]
- 17. Guo Y., Partch C. L., Key J., Card P. B., Pashkov V., Patel A., Bruick R. K., Wurdak H., Gardner K. H. (2013) Regulating the ARNT/TACC3 axis: multiple approaches to manipulating protein/protein interactions with small molecules. ACS Chem. Biol. 8, 626–635 [DOI] [PMC free article] [PubMed] [Google Scholar]
- 18. Afonine P. V., Mustyakimov M., Grosse-Kunstleve R. W., Moriarty N. W., Langan P., Adams P. D. (2010) Joint x-ray and neutron refinement with phenix.refine. Acta Crystallogr. D Biol. Crystallogr. 66, 1153–1163 [DOI] [PMC free article] [PubMed] [Google Scholar]
- 19. Chen V. B., Arendall W. B., 3rd, Headd J. J., Keedy D. A., Immormino R. M., Kapral G. J., Murray L. W., Richardson J. S., Richardson D. C. (2010) MolProbity: all-atom structure validation for macromolecular crystallography. Acta Crystallogr. D Biol. Crystallogr. 66, 12–21 [DOI] [PMC free article] [PubMed] [Google Scholar]
- 20. Scheuermann T. H., Tomchick D. R., Machius M., Guo Y., Bruick R. K., Gardner K. H. (2009) Artificial ligand binding within the HIF2α PAS-B domain of the HIF2 transcription factor. Proc. Natl. Acad. Sci. U.S.A. 106, 450–455 [DOI] [PMC free article] [PubMed] [Google Scholar]
- 21. Cowtan K. (2010) Recent developments in classical density modification. Acta Crystallogr. D Biol. Crystallogr. 66, 470–478 [DOI] [PMC free article] [PubMed] [Google Scholar]
- 22. Cowtan K. (2006) The Buccaneer software for automated model building. 1. Tracing protein chains. Acta Crystallogr. D Biol. Crystallogr. 62, 1002–1011 [DOI] [PubMed] [Google Scholar]
- 23. Jones T. A., Zou J. Y., Cowan S. W., Kjeldgaard M. (1991) Improved methods for building protein models in electron density maps and the location of errors in these models. Acta Crystallogr. A 47, 110–119 [DOI] [PubMed] [Google Scholar]
- 24. Emsley P., Lohkamp B., Scott W. G., Cowtan K. (2010) Features and development of Coot. Acta Crystallogr. D Biol. Crystallogr. 66, 486–501 [DOI] [PMC free article] [PubMed] [Google Scholar]
- 25. Erbel P. J., Card P. B., Karakuzu O., Bruick R. K., Gardner K. H. (2003) Structural basis for PAS domain heterodimerization in the basic helix-loop-helix-PAS transcription factor hypoxia-inducible factor. Proc. Natl. Acad. Sci. U.S.A. 100, 15504–15509 [DOI] [PMC free article] [PubMed] [Google Scholar]
- 26. Card P. B., Erbel P. J., Gardner K. H. (2005) Structural basis of ARNT PAS-B dimerization: use of a common β-sheet interface for hetero- and homodimerization. J. Mol. Biol. 353, 664–677 [DOI] [PubMed] [Google Scholar]
- 27. Delaglio F., Grzesiek S., Vuister G. W., Zhu G., Pfeifer J., Bax A. (1995) NMRPipe: a multidimensional spectral processing system based on UNIX pipes. J. Biomol. NMR 6, 277–293 [DOI] [PubMed] [Google Scholar]
- 28. de Vries S. J., van Dijk M., Bonvin A. M. (2010) The HADDOCK web server for data-driven biomolecular docking. Nat. Protoc. 5, 883–897 [DOI] [PubMed] [Google Scholar]
- 29. O'Shea E. K., Klemm J. D., Kim P. S., Alber T. (1991) X-ray structure of the GCN4 leucine zipper, a two-stranded, parallel coiled coil. Science 254, 539–544 [DOI] [PubMed] [Google Scholar]
- 30. Iwahara J., Clore G. M. (2006) Detecting transient intermediates in macromolecular binding by paramagnetic NMR. Nature 440, 1227–1230 [DOI] [PubMed] [Google Scholar]
- 31. Duhr S., Braun D. (2006) Why molecules move along a temperature gradient. Proc. Natl. Acad. Sci. U.S.A. 103, 19678–19682 [DOI] [PMC free article] [PubMed] [Google Scholar]
- 32. Scheuermann T. H., Li Q., Ma H. W., Key J., Zhang L., Chen R., Garcia J. A., Naidoo J., Longgood J., Frantz D. E., Tambar U. K., Gardner K. H., Bruick R. K. (2013) Allosteric inhibition of hypoxia inducible factor-2 with small molecules. Nat. Chem. Biol. 9, 271–276 [DOI] [PMC free article] [PubMed] [Google Scholar]
- 33. Huang N., Chelliah Y., Shan Y., Taylor C. A., Yoo S. H., Partch C., Green C. B., Zhang H., Takahashi J. S. (2012) Crystal structure of the heterodimeric CLOCK:BMAL1 transcriptional activator complex. Science 337, 189–194 [DOI] [PMC free article] [PubMed] [Google Scholar]
- 34. Forbes S. A., Tang G., Bindal N., Bamford S., Dawson E., Cole C., Kok C. Y., Jia M., Ewing R., Menzies A., Teague J. W., Stratton M. R., Futreal P. A. (2010) COSMIC (the Catalogue of Somatic Mutations in Cancer): a resource to investigate acquired mutations in human cancer. Nucleic Acids Res. 38, D652–D657 [DOI] [PMC free article] [PubMed] [Google Scholar]
- 35. Rogers J. L., Bayeh L., Scheuermann T. H., Longgood J., Key J., Naidoo J., Melito L., Shokri C., Frantz D. E., Bruick R. K., Gardner K. H., MacMillan J. B., Tambar U. K. (2013) Development of inhibitors of the PAS-B domain of the HIF-2α transcription factor. J. Med. Chem. 56, 1739–1747 [DOI] [PMC free article] [PubMed] [Google Scholar]


