Abstract
Objective
Recent evidence suggests that some of the Diagnostic and Statistical Manual of Mental Disorders, Fourth Edition personality disorder (PD) criteria contain measurement bias across age groups. Specifically, this research showed that younger and older adults were differentially likely to endorse certain PD criteria, even when both groups were statistically matched using mechanisms of item response theory (IRT) for degree of PD pathology. For the analyses presented here, the authors used data from a large epidemiological study (N=43,093), the National Epidemiologic Survey on Alcohol and Related Conditions, to examine the influence of this item-level measurement bias for reaching accurate algorithmic PD diagnoses of older adults.
Methods
Joint probability analyses were used to determine the net effect of the item-level bias on the possible over- or underdiagnosis of six PDs in older adults.
Results
When older adults were compared to younger adults at equivalent levels of PD pathology, they were more likely to receive diagnoses of obsessive-compulsive and schizoid PDs. In contrast, they were less likely to receive diagnoses of avoidant and dependent PDs. Younger and older adults were equally likely to receive diagnoses of histrionic and paranoid PDs. Of the seven PDs assessed in this dataset, only these six lend themselves to this type of analysis; antisocial PD differs because a diagnosis depends upon the presence of conduct disorder.
Conclusion
These findings raise concerns regarding the interpretation of existing older adult PD prevalence data.
Keywords: Age bias, item response theory, personality disorder
Concern over possible age bias in Diagnostic and Statistical Manual of Mental Disorders (DSM) personality disorder (PD) criteria dates back to the publication of DSM–III.1 Since that time, clinicians and researchers who work with older adults have recommended that DSM criteria should be used cautiously with this age group.2,3 These advocates noted that approximately 25% of DSM criteria contain poor face validity for use with older adults.4 They pointed out, for example, that the criterion for avoidant PD (“avoids occupational activities that involve significant interpersonal contact …”) may not be useful for the assessment of PD pathology in an older, retired person.3
Although convincing arguments have been made about the limited face validity for many of the PD criteria,3,4 only recently has there been empirical support for these arguments.1 In a recent empirical study,1 item response theory (IRT) analyses of a large public dataset indicated that approximately 29% of DSM–IV criteria were endorsed at different rates by younger and older adults when controlling for level of PD pathology. In other words, younger and older adults with the same amount of pathology endorsed specific items at different rates. This suggests that the items measure PD pathology differently across these age groups, and hence contain bias.
In addition to revealing which items contain bias, results from this study showed the direction of the measurement bias for each item. For example, older adults were more likely to endorse the criterion for schizoid PD (“has little, if any, interest in having sexual experiences with another person”) when compared to equally schizoid younger adults. Older adults' endorsement of this schizoid item may very well be related to physiological changes that make sexual experiences less enjoyable or social changes that make sexual partners less available. In contrast to the example above, older adults were less likely to endorse other items, even when controlling for level of PD pathology. For example, they were less likely to endorse the item for dependent PD (“goes to excessive lengths to obtain nurturance and support from others, to the point of volunteering to do things that are unpleasant”). Older adults may be less likely to endorse this item because they readily receive support (and are even reinforced) for subtle dependent-like behaviors.5 Therefore, older adults may only rarely have to use unreasonable tactics in order to receive support from others.
Although there is evidence that demonstrates the presence and direction of measurement bias for individual items,1 the diagnostic implications of this item-level bias are unknown. This study was designed to examine the impact of item-level measurement bias on sets of items that, when viewed as a whole, can lead to the diagnosis of a PD. The possibility that a PD diagnosis could be more or less likely for older adults, solely based upon the measurement bias at the individual item level, implies that particular PDs in older adults may be over- or underdiagnosed. This possibility brings into question the validity of existing PD prevalence data.
The current prevalence estimates for PDs in younger and older adults seem to reveal a trend. Eight studies have compared the prevalence of PDs across younger and older age groups.1,6–12 Among these, seven indicate that PDs are diagnosed less frequently in older adults.1,6–10 Closer examination of the data reveals differing trends across particular PDs (Table 1). Although older adults are almost uniformly less likely to be diagnosed with antisocial, borderline, and histrionic PDs, the other disorders show mixed results. For example, seven of the eight studies examined the prevalence of obsessive-compulsive PD across younger and older age groups. In three of these seven studies, younger adults were diagnosed more frequently with obsessive-compulsive PD than older adults. In three others, younger adults were diagnosed less frequently with this PD than older adults. In the remaining study, younger and older adults were equally likely to receive the diagnosis. A similar mixed trend across these studies is found for avoidant, dependent, narcissistic, paranoid, schizoid, and schizotypal PDs.
Table 1. Prevalence of PDs Across Younger and Older Age Groups (expressed as rounded percentages).
| Antisocial | Avoidant | Borderline | Dependlent | Histrionic | Narcissistic | Obsessive- Compulsive |
Paranoid | Schizoid | Schizotypal | |||||||||||
|---|---|---|---|---|---|---|---|---|---|---|---|---|---|---|---|---|---|---|---|---|
|
|
|
|
|
|
|
|
|
|
|
|||||||||||
| Younger | Older | Younger | Older | Younger | Older | Younger | Older | Younger | Older | Younger | Older | Younger | Older | Younger | Older | Younger | Older | Younger | Older | |
| Ames & Molinari6 | 3 | 2 | 1 | 1 | 2 | 1 | 2 | 2 | 3 | 2 | 1 | 0 | 2 | 1 | 1 | 2 | 1 | 2 | 3 | 1 |
| Balsis et al.1 | 4 | 0 | 3 | 1 | NA | NA | 1 | 0 | 2 | 0 | NA | NA | 6 | 2 | 6 | 1 | 4 | 2 | NA | NA |
| Casey & Schrodt7 | 2 | 0 | 0 | 1 | 5 | 0 | 11 | 4 | 3 | 1 | 7 | 1 | 4 | 1 | 1 | 0 | 0 | 0 | 1 | 0 |
| Fogel & Westlake8 | 0 | 0 | NA | NA | NA | NA | 3 | 2 | 2 | 1 | NA | NA | 0 | 5 | NA | NA | NA | NA | NA | NA |
| Kenan et al.9 | 4 | 0 | 1 | 0 | 11 | 0 | 3 | 7 | 3 | 5 | 2 | 7 | 1 | 4 | 1 | 0 | 0 | 0 | 2 | 2 |
| Mezzich et al.10 | 5 | 0 | 1 | 0 | 3 | 0 | 3 | 1 | 2 | 0 | 1 | 0 | 1 | 1 | 0 | 0 | 0 | 0 | 1 | 0 |
| Molinari et al.11 | 4 | 3 | 11 | 12 | 22 | 7 | 13 | 9 | 23 | 0 | 4 | 4 | 5 | 12 | 0 | 17 | 0 | 6 | 9 | 6 |
| Narrow et al.12 | 2 | 0 | NA | NA | NA | NA | NA | NA | NA | NA | NA | NA | NA | NA | NA | NA | NA | NA | NA | NA |
NA: not assessed.
It is not surprising that these prevalence data are ambiguous because they rely on a measurement system that is unclear.13 Consider again the item for avoidant PD: “avoids occupational activities that involve significant interpersonal contact.” This item leaves investigators who assess PD pathology in older retired patients unsatisfied at best and guessing at worst. How should an investigator apply this item when working with an older, retired adult? There are several possibilities. The investigator could try to adjust the intent of the item to fit the older adult context. For example, the investigator might ask an older female patient whether she avoids social or volunteer activities, instead of asking her whether she avoids occupational activities. This approach could be problematic because adjusting the item this way may change the meaning of the item. Avoiding social and volunteer activities is not necessarily equivalent to avoiding occupational activities. Alternatively, the investigator could ask the patient to recall a previous time when this item was relevant and report on personality functioning from that time period. This approach could be problematic as well, because it relies on retrospective reporting that may be unreliable. In addition, such reporting may not accurately capture the presentation of a patient's current personality that has changed since the time of retirement, making this assessment unrelated to present personality functioning. A third approach that the investigator could take when trying to assess this feature of avoidant PD is to take the item at face value. It is unfortunate that this intuitive option, to apply an item at face value, may be the most egregious option of the three, because the item clearly contains no face validity for use with older, retired patients. Given that there are a variety of ways that these DSM criteria may have been adjusted across these studies, it is not surprising that different prevalence trends across age groups emerge. It is important to add that many other factors may also influence prevalence data across younger and older age groups, including sampling strategies and assessment methods.
To begin to understand the true prevalence of PDs across age groups, we must first understand whether certain PDs are under or overestimated. This is the goal of the current study. The analyses presented here are intended to reveal whether the presence of measurement bias for particular items has influenced the prevalence rates of PDs for older adults in the largest epidemiological study of PDs that included older adults.
Methods
Participants
The data used in the original analysis1 came from the 2000–2001 wave of the National Epidemiologic Survey on Alcohol and Related Conditions (NESARC) conducted by the National Institute of Alcohol Abuse and Alcoholism. This public dataset consists of a nearly nationally representative sample of noninstitutionalized adults 18 to 98 years old in the United States. Data were collected by over 1,800 trained assistants who interviewed 43,093 participants in person.14 Our original analysis of these data focused on participants who fell into two age groups. The first age group consisted of 18- to 34-year-olds and the second age group consisted of 65- to 98-year-olds. The sample size differed slightly for each PD because analyses were run separately for each PD, and cases were deleted that had more than two missing data points. For antisocial PD, there were 13,455 younger adults and 7,970 older adults. For avoidant PD, there were 13,427 younger adults and 7,937 older adults. For dependent PD, there were 13,414 younger adults and 7,932 older adults. For histrionic PD, there were 13,360 younger adults and 7,882 older adults. For obsessive-compulsive PD, there were 13,391 younger adults and 7,907 older adults. For paranoid PD, there were 13,388 younger adults and 7,909 older adults. For schizoid PD, there were 13,346 younger adults and 7,872 older adults.
Seven types of PD (antisocial, avoidant, dependent, histrionic, obsessive-compulsive, paranoid, and schizoid) were assessed using a fully structured diagnostic interview based on DSM–IV criteria, the Alcohol Use Disorder and Associated Disabilities Interview Schedule—DSM–IV (AUDADIS-IV).15 The interview consisted of a series of yes/no questions answered by the participant regarding DSM–IV PD features across the lifetime. Alpha reliabilities for each PD scale were excellent, each >0.97. Test retest reliability ranged from fair (k = 0.40 for histrionic PD) to good (k = 0.67 for antisocial PD).16 Factor analyses confirmed that the items for each PD contribute to one and only one latent variable. To determine whether a participant met a specific DSM–IV PD criterion, questions from the interview were sometimes combined (see the appendix from our original paper1 to learn more specifically how questions from the interview mapped onto DSM–IV diagnostic criteria).
Data Analysis
Before describing more specific elements of the present results, it is important to illustrate how one can investigate measurement bias17 at different levels of PD pathology. The presence of measurement bias can be detected via differential item functioning (DIF) analyses conducted within an item response theory (IRT) framework.18 For the application of IRT in this context, diagnostic criteria from a particular PD (e.g., the seven avoidant PD criteria) are conceptualized as indicators of a latent variable, as in factor analysis. Here, the latent variable is a type of PD pathology (e.g., avoidant PD pathology).
To illustrate DIF as it relates to PD data, we plot the item characteristic curve (ICC) for each item in each group (younger and older). The ICCs to be presented are given by the two-parameter logistic model,19 which is a function of two item parameters and the latent variable. An ICC describes the likelihood that a particular item is endorsed at different levels of the latent pathology. If the likelihood does not differ between groups, then the ICCs lie on top of each other and the item contains no measurement bias. If the likelihood differs between age groups, then ICCs do not lie on top of one another and the item contains measurement bias.
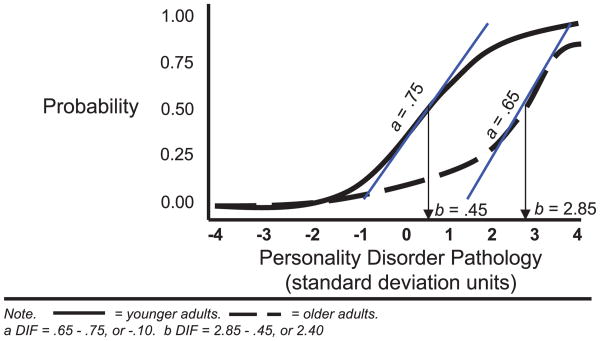
Consider the example ICCs in Figure 1. Levels of the latent variable (in standard units; mean: 0, SD: 1.0) are represented on the abscissa (x-axis). The probability that the item will be endorsed is plotted on the ordinate (y-axis). These ICCs are defined by two item parameters, a discrimination or a parameter and a threshold or b parameter. The a parameter is the slope of the curve at a probability of 50%. aDIF then is the difference between the younger and older adults' (older minus younger) a parameters. In Figure 1, the slope of the younger adult ICC at a probability of 50% is 0.75, whereas the analogous slope for the older adults is 0.65. The difference between these two values (older minus younger) is −0.10. If this so-called aDIF value is positive and significant, then the item is more related to the latent variable for older as compared to younger adults. In contrast, if the value is negative and significant, then the item is less related to the latent variable for older versus younger adults. In the example above, the value for aDIF is quite small, indicating that this item is related to the latent variable to a similar degree for both age groups.
Figure 1. An Illustration of aDIF and bDIF.
The b parameter of an ICC is the value of the latent variable in SD units where the probability is 50%. The bDIF value then is the difference between the b parameters for the two groups. In Figure 1, the b parameter for younger adults is 0.45 because that is the value on the abscissa where probability equals 50%. The analogous value for older adults is 2.85. The difference between these two values (older minus younger), or the bDIF, is 2.40. If this value is positive and significant, then more PD pathology is needed for older adults before they will endorse the item 50% of the time as compared to how much pathology must be present for younger adults to endorse the item 50% of the time. Because bDIF has a scale in SD units, we can easily conceptualize the magnitude of the bDIF. In our example, bDIF is 2.40, which means that 2.40 more SDs of pathology are needed for older adults before they will endorse the item at the same rate (50% of the time) as younger adults.
An alternate way to explore Figure 1 is to start at a particular level of PD pathology, say 2.0 SDs, and find the probability that the item would be endorsed by younger and older adults. At 2.0 SDs of pathology, younger adults have a 75% probability of endorsing this item, whereas older adults only have a 23% probability of endorsing it, a difference of 53%. Consider that this item is only one of seven that comprise a particular disorder. The probability of endorsement across all seven items at a particular level of PD pathology can be combined to examine the joint likelihood that an individual with a given amount of PD pathology would meet a particular diagnosis. In the case of avoidant PD, which requires the presence of four or more criteria for diagnosis, one could determine the joint likelihood that the person would meet four or more criteria. This value can be calculated for the person assuming that he or she is a younger adult, and it can be calculated for the individual assuming that the individual is an older adult. The difference between these two values is a value that indicates the impact of the net DIF across all seven items.
Before presenting the joint probability analyses, it is helpful to chart the younger and older ICCs for each item evaluated in the original study.1 We can chart these ICCs based on the a and b parameters provided in that paper (the a and b parameters for the anchor items were established via similar IRT-based procedures). Charting ICCs for each of the items allows us to explore DIF at different levels of PD pathology. Our original study found no instances of statistically significant aDIF across age groups. In other words, each item was similarly related to the latent PD variable (e.g., avoidant PD pathology) across older and younger adults. The study also found that 29% of the items examined contained meaningful (≥0.30) bDIF. So for each of these items, older and younger adults with equivalent amounts of PD pathology were differentially likely to endorse the items. Because our original study found meaningful bDIF only, we focus on bDIF in this article.
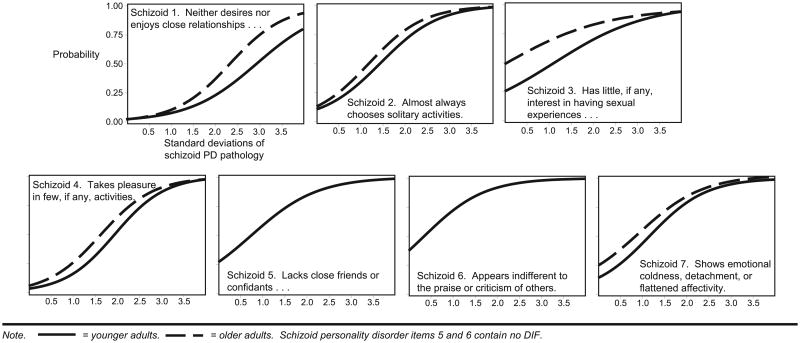
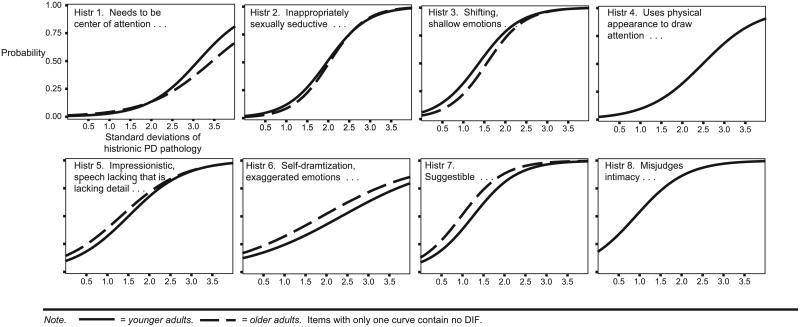
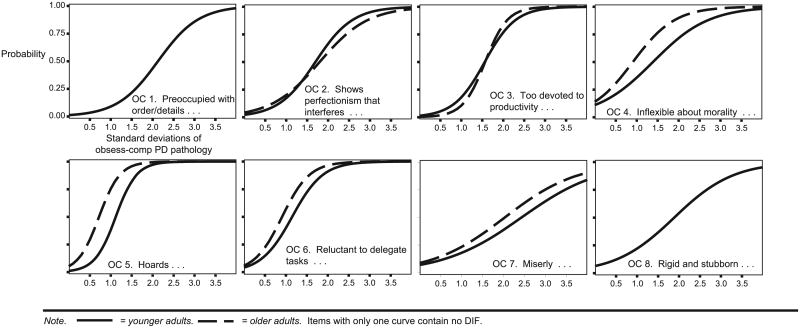
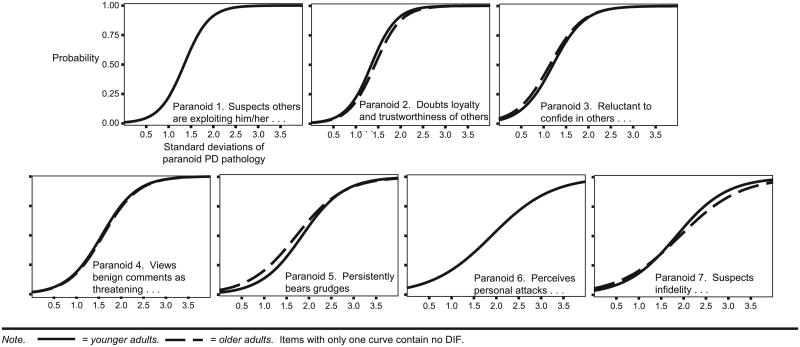
The degree of bDIF at different levels of PD pathology from this study can be explored by considering the ICCs for each of the items for a particular disorder. Consider the ICCs for schizoid PD (Figure 2). These ICCs describe how each schizoid item functions across age groups at varying levels of PD pathology. For this PD, two items (nos. 5 and 6) functioned in an equivalent way across the age groups, meaning that they contained no DIF (as you can see their ICCs nearly lie on top of each other). Each of the other items revealed somewhat different DIF trends. The item “neither desires nor enjoys close relationships” had approximately equivalent probabilities of endorsement by younger and older adults when PD pathology ranged between 0.0 and 1.5 SDs above the mean. This trend changed for 1.5 SDs above the mean, when the endorsement probability became much higher for older adults. In contrast, the item regarding the enjoyment of sexual experiences showed large DIF at very low levels of PD pathology. This difference then narrowed as the severity of PD pathology increased. This quick exploration of schizoid items alone reveals that DIF for each item may follow a unique pattern. As such, it is important to examine DIF separately for each item. ICCs for each criterion across all PDs are included in the appendix. An inspection of the appendix confirms that each item's ICCs are unique.
Figure 2. Item Characteristic Curves for Schizoid PD Across Younger and Older Age Groups.
Note that in Figure 2 and in the appendix, we report values on the abscissa that range from 0.0 to 4.0 SDs. We include only positive values because the phenomena of interest are those aspects of personality that are dysfunctional and occur rarely. Hence, functioning below the mean (better than average functioning) is not closely considered and perhaps not even measured well by the diagnostic criteria. Previous investigators have suggested that 2.0 SDs above the mean is a reasonable place to demarcate the presence of a PD.20 We do not hold strong beliefs about the most appropriate demarcation point, but we find it reasonable to assume that positive values of PD pathology are most closely related to our interest, which is abnormal PD pathology.
Note that items within each PD contain different degrees of measurement bias at different levels of PD pathology. As such, aggregating all the DIF (measurement bias) across items within a PD at varying levels of PD pathology can reveal the differential likelihood that an older adult would receive a diagnosis, relative to a younger adult with an equivalent level of PD pathology. These differential likelihoods across age groups are particularly relevant because they raise questions about the interpretation of existing data that were collected and aggregated under the assumption that items do not contain age bias.
The analyses in the current paper are intended to begin to explore the degree of inaccuracy in the existing data. These analyses build from our original analysis to explore the net DIF for each set of items that make up a PD. Results of the original analysis included the a and b parameters that defined the ICCs for items by age group (older and younger). From these ICCs, probabilities of endorsement at different levels of PD pathology in SD units (0.0, 0.5, 1.0,…, 3.5) were identified. At each level of PD pathology (e.g., 1.5 SDs), the probability of endorsement for each item that makes up a particular PD was identified. Then these probabilities of endorsing a particular item were combined separately for younger and older adults to assess the net probability that the diagnosis would be applied to a hypothetical member of each group.
To illustrate how these probabilities were combined, consider an example of avoidant PD. This PD requires the presence of four or more items. That is, a participant needs to endorse four to seven items to receive this diagnosis. There are 35 distinct ways in which four items can be endorsed, 21 ways five items can be endorsed, 7 ways six items can be endorsed, and of course only 1 way all seven items can be endorsed. In total, there are 64 distinct ways to receive a diagnosis of avoidant PD. A person could receive a diagnosis of avoidant PD by endorsing items 1, 2, 3, and 4, but not items 5, 6, and 7. So the probability that each of these events happened (that item one was endorsed, item 2 was endorsed, item 3 was endorsed, item 4 was endorsed, item 5 was not endorsed, item 6 was not endorsed, and item 7 was not endorsed) were established via the ICCs for these items. Then, to establish the joint likelihood that these seven events would occur together, these seven individual probabilities were multiplied together. Next, the probability of receiving the diagnosis of avoidant PD the other 63 ways was determined similarly. Finally, all of these 64 probabilities were added together. The resultant number represents the probability that a person from a particular age group (younger or older) would receive a diagnosis of avoidant PD at the particular level of PD pathology considered. Essentially, these analyses extend the multiplicative law of probability for independent events to combinations of events21 (assuming local independence which is a usual assumption in IRT). The probabilities for a younger person were established by examining the younger adult ICCs, whereas the probabilities for an older adult were established by examining the older adult ICCs. This process of establishing joint likelihoods was repeated for each age group across each level of PD pathology for each PD. One assumption of multiplying individual probabilities to establish joint probabilities is that each item is independent of the next item. Participants in this study were instructed to answer each question in an independent fashion, without considering earlier responses. In addition, the DSM criteria to which these questions were closely linked are presumed to be independent of each other.
For the joint probability analyses, the number of endorsed items required to meet a diagnosis varied by disorder (avoidant=4+; dependent=5+; histrionic=5+; obsessive-compulsive=4+; paranoid= 4+; schizoid=4+). Probabilities of antisocial PD diagnosis differed because a diagnosis according to DSM–IV is contingent upon meeting the diagnosis of conduct disorder. The data presented here only consider the other six disorders.
A bootstrap procedure was used to establish a confidence interval around each joint probability estimate. An example may help illustrate the steps taken for each bootstrap. Remember that 64 individual probabilities originally were summed together to establish each joint probability estimate for avoidant PD. For each avoidant PD joint probability estimate, the 64 individual probabilities were bootstrapped (resampled randomly with replacement) to create 100 samples with 64 individual probabilities. The 64 individual probabilities in each of these 100 samples were summed, making a vector of 100 joint probability estimates. The SE of the mean of this vector was calculated. This SE was then used to derive a confidence interval (±1.96 SE), which was applied to the original joint probability estimate. For the interested reader, the confidence intervals accompany their respective joint probability estimates in Table 2.
Table 2. Probability that Younger and Older Adults Will Receive Particular DSM-IV Diagnoses at Varying Degrees of PD Pathology.
| PD Pathology (SD) |
Avoidant | Dependent | Histrionic | Obsess-Compulsive | Paranoid | Schizoid | ||||||
|---|---|---|---|---|---|---|---|---|---|---|---|---|
|
|
|
|
|
|
|
|||||||
| Younger | Older | Younger | Older | Younger | Older | Younger | Older | Younger | Older | Younger | Older | |
| 0.0 | 0% (±0.00) | 0% (±0.00) | 0% (±0.00) | 0% (±0.00) | 0% (±0.00) | 0% (±0.00) | 0% (±0.00) | 0% (±0.00) | 0% (±0.00) | 0% (±0.00) | 1% (±0.07) | 4% (±0.22) |
| 0.5 | 0% (±0.00) | 0% (±0.00) | 0% (±0.00) | 0% (±0.00) | 0% (±0.01) | 0% (±0.01) | 0% (±0.01) | 2% (±0.07) | 0% (±0.00) | 0% (±0.00) | 7% (±0.40) | 16% (±1.72) |
| 1.0 | 1% (±0.03) | 0% (±0.01) | 0% (±0.00) | 0% (±0.00) | 2% (±0.09) | 3% (±0.14) | 10% (±0.23) | 24% (±0.95) | 6% (±0.14) | 7% (±0.15) | 26% (±1.24) | 45% (±2.07) |
| 1.5 | 21% (±0.45) | 10% (±0.28) | 0% (±0.00) | 0% (±0.00) | 16% (±0.70) | 19% (±0.84) | 58% (±1.27) | 76% (±2.32) | 51% (±1.14) | 51% (±1.00) | 59% (±2.17) | 77% (±2.71) |
| 2.0 | 72% (±1.54) | 55% (±1.70) | 6% (±0.09) | 2% (±0.05) | 52% (±2.18) | 57% (±2.39) | 92% (±2.43) | 100% (±356) | 96% (±3.51) | 95% (±3.56) | 86% (±3.61) | 94% (±4.37) |
| 2.5 | 98% (±4.67) | 92% (±4.07) | 54% (±0.46) | 29% (±0.96) | 85% (±3.83) | 88% (±4.04) | 97% (±5.15) | 100% (±5.96) | 100% (±8.49) | 100% (±7.66) | 97% (±5.78) | 98% (±6.35) |
| 3.0 | 100% (±9.74) | 99% (±7.22) | 95% (±3.76) | 83% (±3.65) | 97% (±5.08) | 98% (±5.74) | 98% (±8.96) | 100% (±10.20) | 100% (±12.86) | 100% (±12.41) | 100% (±8.17) | 100% (±10.99) |
| 3.5 | 100% (±13.63) | 100% (±10.52) | 100% (±9.89) | 9% (±8.70) | 100% (±6.69) | 99% (±8.59) | 99% (±12.66) | 100% (±14.03) | 100% (±16.55) | 100% (±15.46) | 100% (±10.91) | 100% (±14.46) |
Notes: Data are percent (95% confidence interval). Bolded pairs indicate that values also meet a difference threshold of at least 6%. Standard errors to calculate confidence intervals were obtained through bootstrap procedures. Confidence intervals are centered on the original joint probability estimates, not the means derived from the bootstraps.
Results
Across all of the six disorders, both age groups had lower probabilities of receiving a PD diagnosis at lower levels of PD pathology when compared to higher levels of PD pathology (Table 2). For example, avoidant PD had nearly a 0% probability of endorsement for both younger and older adults between 0.0 and 1.0 SDs of avoidant PD pathology. At 1.5 SDs of avoidant PD pathology, the values became uniformly positive but remained relatively low, 21% for younger adults and 10% for older adults. These values continued to increase across higher levels of PD pathology until they reached near 100% at 3.0 SDs of PD pathology.
Examining the disorders across younger and older age groups revealed three trends. First, younger adults had a lower probability of receiving a PD diagnosis compared to older adults for obsessive-compulsive and schizoid PDs. At 1.5 SDs of obsessive-compulsive PD pathology, for example, younger adults had a 58% probability of receiving that diagnosis. Meanwhile, older adults had a 76% probability of receiving that same diagnosis. This trend also was pronounced for schizoid PD. Younger adults with 1.5 SDs of schizoid PD pathology had a 58% probability of receiving a PD diagnosis while 77% of older adults had that same probability.
Second, for avoidant and dependent PDs, younger adults had a higher probability of receiving a PD diagnosis when compared to older adults. At 2.0 SDs of avoidant PD pathology, for example, younger adults had a 72% probability of receiving a diagnosis whereas older adults only had a 55% chance of receiving a diagnosis. A similar trend is found for dependent PD. Younger adults with 2.0 SDs of dependent PD pathology have a 6% probability of receiving a diagnosis whereas older adults with equivalent levels of PD pathology have a 2% probability of receiving a diagnosis.
Finally, the probability of receiving a diagnosis differed only minimally for the two disorders that contained very little DIF: histrionic and paranoid PDs. The differences in the probabilities of receiving a diagnosis for these PDs between younger and older adults were very small. Consider the values for histrionic PD. The differences between younger and older adults were on average less than two percentage points. For paranoid PD, the differences between younger and older adults never differed by more than one percentage point.
Discussion
Results showed that item-level biases in DSM PD criteria may differentially influence the likelihood of PD diagnoses for older adults. At lower levels of obsessive-compulsive and schizoid PD pathology, younger adults had higher probabilities of receiving a diagnosis when compared to equivalently obsessive-compulsive and schizoid older adults. Assuming that DSM classification system measures accurately the prevalence of PDs in younger adults (the group that was most closely considered when the classification system was created), the literature may overestimate the actual prevalence of obsessive-compulsive and schizoid PD pathology in older adults. Meanwhile, the opposite trend may be true for avoidant and dependent PDs. In other words, previous studies may underestimate the prevalence of avoidant and dependent PDs in older adults. In contrast, it appears as though histrionic and paranoid PD rates may be measured comparably in younger and older adults. Although three PDs (borderline, narcissistic, schizotypal) were not evaluated in the original study, one might predict that these PDs would show negative bDIF that could help account for the overall negative prevalence of PDs commonly found across broad age groups.1,6–10,12 These findings are consistent with other explanations that address how bias in diagnostic criteria may contribute to differing prevalence rates.22
The current analyses suggest that existing data regarding the prevalence of PDs in older adults may be inaccurate due to the presence of measurement bias, but they do not explain the underlying cause(s) of that measurement bias. One potential reason for the measurement bias is that the same latent personality presents differently across younger and older age groups. This idea is consistent with the notion of heterotypic continuity,23 which refers to the possibility that the same latent personality can present differently across different contexts. The implication here is that later life represents a context that shapes the presentation of personality. If the presentation of the same personality is different across age groups, then diagnostic criteria designed to identify personality only in a younger age group will fail to identify that same personality equally well in an older age group. This possibility requires further empirical exploration.
An age-neutral diagnostic system could help remedy several problems with the current diagnostic criteria. This type of diagnostic system would allow clinicians and investigators who work with older adults the freedom to apply diagnostic criteria to their older clients in the same manner they apply diagnostic criteria to their younger adult clients, thus bringing consistency to their diagnostic evaluations. In addition, such a system would offer investigators a valuable tool for understanding the true prevalence rates of PDs across the lifespan and help to develop a better understanding of the nature of PD pathology in later life. Alternatively, it may be valuable to consider the possibility of adjusting the number of criteria required to meet a specific PD diagnosis for older adults.
These analyses have several limitations. First, they are bound by all of the limitations of our original analysis, including the assumptions of IRT. A primary assumption of IRT is that the items in question measure a unidimensional latent trait. To ensure that the data met this assumption, we conducted confirmatory factor analyses. These analyses indicated that a unidimensional latent trait did indeed underlie the observed variable scores. Although it is possible that the unidimensionality is not maintained at all levels of the latent trait, there is no reason or precedent to believe that holds for these subsamples.
It is perhaps important to reiterate that the data collected in the NESARC study were collected using standard epidemiological measurement tools (i.e., laypersons using structured diagnostic interviews). The data were not collected by experienced mental health professionals who could rely on their own experience and clinical judgment to draw inferences about the presence of pathological personality features and the extent to which they led to subjective distress or interpersonal impairment. Finally, the results of this study require replication, and future analyses should extend this research to the three PDs that were not assessed in this study. Also, additional verification of these results using additional statistical methods is warranted.
In sum, the current analyses shed new light on existing data, suggesting that older adults are diagnosed more often with schizoid and obsessive-compulsive PDs and less often with avoidant and dependent PDs when compared to younger adults with equivalent PD pathology. These analyses also raise practical concerns about the utility of DSM classification system for measuring PDs in older adults.
Acknowledgments
This work was supported by the National Institute of Mental Health (START-MH fellowship and 1F31-MH075336-01A1 to SB; R01-MH51187 to TFO).
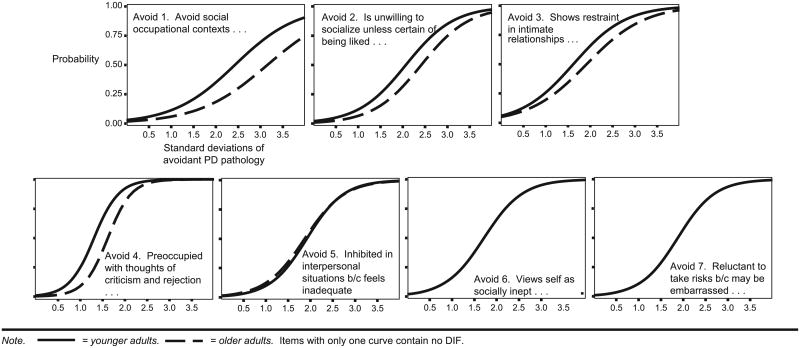
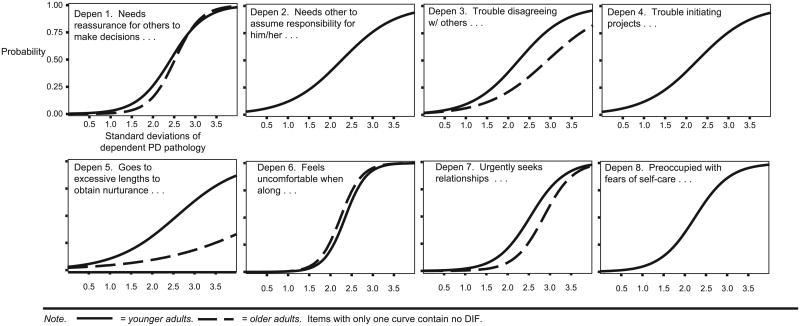
Appendix. Item Characteristic Curves for Personality Disorder Criteria Across Younger and Older Age Groups
1. Item characteristic curves for avoidant personality disorder across younger and older age groups
2. Item characteristic curves for dependent personality disorder across younger and older age groups
3. Item characteristic curves for histrionic personality disorder across younger and older age groups
4. Item characteristic curves for obsessive-compulsive personality disorder across younger and older age groups
5. Item characteristic curves for paranoid personality disorder across younger and older age groups
References
- 1.Balsis S, Gleason MEJ, Woods CM, et al. An item response theory analysis of DSM–IV personality disorder criteria across younger and older age groups. Psychol Aging. 2007;22:171–185. doi: 10.1037/0882-7974.22.1.171. [DOI] [PMC free article] [PubMed] [Google Scholar]
- 2.Rosowsky E, Gurian B. Borderline personality disorder in late life. Int Psychogeriatrics. 1991;3:39–52. doi: 10.1017/s1041610291000509. [DOI] [PubMed] [Google Scholar]
- 3.Segal DL, Coolidge FL, Rosowsky E. Personality disorders and older adults: Diagnosis, assessment, and treatment. Hoboken, NJ: John Wiley & Sons; 2006. [Google Scholar]
- 4.Agronin ME, Maletta G. Personality disorders in late life: Understanding the gap in research. Am J Geriatr Psychiatry. 2000;8:4–18. doi: 10.1097/00019442-200002000-00002. [DOI] [PubMed] [Google Scholar]
- 5.Baltes MM. The etiology and maintenance of dependency in the elderly: three phases of operant research. Behav Therapy. 1988;19:301–319. [Google Scholar]
- 6.Ames A, Molinari V. Prevalence of personality disorders in community-living elderly. J Geriatr Psychiatry Neurol. 1994;7:209–215. doi: 10.1177/089198879400700311. [DOI] [PubMed] [Google Scholar]
- 7.Casey DA, Schrodt CJ. Axis II diagnoses in geriatric patients. J Geriatr Psychiatry Neurol. 1989;2:87–88. doi: 10.1177/089198878900200206. [DOI] [PubMed] [Google Scholar]
- 8.Fogel BS, Westlake R. Personality disorder diagnoses and age in inpatients with major depression. J Clin Psychiatry. 1990;51:232–235. [PubMed] [Google Scholar]
- 9.Kenan MM, Kendjelic EM, Molinari VA, et al. Age-related differences in the frequency of personality disorders among inpatient veterans. Int J Geriatr Psychiatry. 2000;15:831–837. doi: 10.1002/1099-1166(200009)15:9<831::aid-gps208>3.0.co;2-h. [DOI] [PubMed] [Google Scholar]
- 10.Mezzich JE, Fabrega H, Coffman GA, et al. Comprehensively diagnosing geriatric patients. Comp Psychiatry. 1987;28:68–76. doi: 10.1016/0010-440x(87)90046-0. [DOI] [PubMed] [Google Scholar]
- 11.Molinari V, Ames A, Essa M. Prevalence of personality disorders in two geropsychiatric inpatient units. J Geriatr Psychiatry Neurol. 1994;7:209–215. doi: 10.1177/089198879400700403. [DOI] [PubMed] [Google Scholar]
- 12.Narrow WE, Rae DS, Robins LN, et al. Revised prevalence estimates of mental disorders in the United States. Arch Gen Psychiatry. 2002;59:115–122. doi: 10.1001/archpsyc.59.2.115. [DOI] [PubMed] [Google Scholar]
- 13.Abrams RC, Horowitz SV. Personality disorders after age 50: A meta-analytic review of the literature. In: Rosowsky RC, Abrams RA, editors. Personality Disorders in Older Adults: Emerging issues in Diagnosis and Treatment. Mahwah, NJ: Erlbaum; 1999. pp. 55–68. [Google Scholar]
- 14.Grant BF, Kaplan K, Shepard J, et al. Source and accuracy statement for wave 1 of the 2001-2002 National Epidemiologic Survey on Alcohol and Related Conditions. Bethesda: National Institute on Alcohol Abuse and Alcoholism; 2003. [Google Scholar]
- 15.Grant BF, Dawson DA, Hasin DS. The alcohol use disorder and associated disabilities interview schedule DSM–IV version. Bethesda: National Institutes on Alcohol Abuse and Alcoholism; 2001. [Google Scholar]
- 16.Grant BF, Hasin DS, Stinson FS, et al. Co-occurrence of 12-month mood and anxiety disorders and personality disorders in the US: results from the national epidemiologic survey on alcohol and related conditions. J Psychiatric Res. 2004;61:361–368. doi: 10.1016/j.jpsychires.2004.05.004. [DOI] [PubMed] [Google Scholar]
- 17.Thissen D, Steinberg L, Gerrard M. Beyond group-mean differences: The concept of item bias. Psychol Bull. 1986;99:118–128. [Google Scholar]
- 18.Hambleton RK, Swaminathan H, Rogers HJ. Fundamentals of Item Response Theory. Newbury Park, CA: Sage Publications; 1991. pp. 109–122. [Google Scholar]
- 19.Birnbaum A. Some latent trait models. In: Lord FM, Novick MR, editors. Statistical Theories of Mental Test Scores. Reading, MA: Addison and Wesley; 1968. pp. 395–479. [Google Scholar]
- 20.Westen D, Shedler J. Revising and assessing Axis II, part II: toward an empirically based and clinically useful classification of personality disorders. Am J Psychiatry. 1999;156:273–285. doi: 10.1176/ajp.156.2.273. [DOI] [PubMed] [Google Scholar]
- 21.Hays WL. Statistics. Fort Worth, TX: Harcourt; 1994. pp. 134–135. [Google Scholar]
- 22.Segal DL, Hook JN, Coolidge Fl. Personality dysfunction, coping styles, and clinical symptoms in younger and older adults. J Clin Geropsychol. 2001;7:201–211. [Google Scholar]
- 23.Mroczek DK, Hurt SW, Berman WH. Conceptual and methodological issues in the assessment of personality disorders in older adults. In: Rosowsky E, Abrams RC, Zweig RA, editors. Personality Disorders in Older Adults: Emerging Issues in Diagnosis and Treatment. Mahwah, NJ: Erlbaum; 1999. pp. 135–152. [Google Scholar]


