Abstract
Background
Contamination of tomatoes by Salmonella can occur in agricultural settings. Little is currently understood about how agricultural inputs such as pesticide applications may impact epiphytic crop microflora and potentially play a role in contamination events. We examined the impact of two materials commonly used in Virginia tomato agriculture: acibenzolar-S-methyl (crop protectant) and copper oxychloride (pesticide) to identify the effects these materials may exert on baseline tomato microflora and on the incidence of three specific genera; Salmonella, Xanthomonas and Paenibacillus.
Results
Approximately 186 441 16S rRNA gene and 39 381 18S rRNA gene sequences per independent replicate were used to analyze the impact of the pesticide applications on tomato microflora. An average of 3 346 677 (634 892 974 bases) shotgun sequences per replicate were used for metagenomic analyses.
Conclusion
A significant decrease in the presence of Gammaproteobacteria was observed between controls and copper-treated plants, suggesting that copper is effective at suppressing growth of certain taxa in this class. A higher mean abundance of Salmonella and Paenibacillus in control samples compared to treatments may suggest that both systemic and copper applications diminish the presence of these genera in the phyllosphere; however, owing to the lack of statistical significance, this could also be due to other factors. The most distinctive separation of shared membership was observed in shotgun data between the two different sampling time-points (not between treatments), potentially supporting the hypothesis that environmental pressures may exert more selective pressures on epiphytic microflora than do certain agricultural management practices. © 2014 The Authors. Journal of the Science of Food and Agriculture published by John Wiley & Sons Ltd on behalf of Society of Chemical Industry.
Keywords: tomatoes, phyllosphere, 16S 18S, metagenomic, phytobiome
Introduction
Describing how native phyllosphere microflora plays a role in the introduction and survival of pathogens in produce commodities is of great interest to food safety research. Tomatoes have been implicated in Salmonella illness outbreaks over 17 times in the years spanning 1990 to 2010,1 making this crop a valuable model for food safety research. Research is still nascent with regard to the description of a baseline microflora for any crop, and especially for crops grown in different biogeographic regions or under different agricultural management conditions. Despite a growing body of research, there are still huge data gaps in this research arena.
The DelMarva Peninsula of eastern Delaware, Maryland and Virginia is home to a thriving tomato industry, to which outbreak strains of Salmonella have been traced on at least four occasions in the past ten years.1 This makes this biogeographic region a valuable study site to improve understanding of baseline microflora of tomatoes in response to applications of commonly used pesticides.
Pest pressures for tomatoes grown in Virginia come primarily from the following organisms; bacterial spot (Xanthomonas campestris pv. versicatoria), bacterial speck (Pseudomonas syringae pv.), bacterial wilt (Ralstonia solanacearum), early blight (Alternaria solani), late blight (Phytophthora infestans), tomato leaf spot (Septoria lycopersici), fusarium crown rot (Fusarium oxysporum f.sp. radicis), fusarium wilt (Fusarium oxysporum f.sp. lycopersici), and southern blight (Sclerotium rolfsii).
Two materials currently being evaluated for efficacy in the management of some of these pests include; acibenzolar-S-methyl, a benzothiadiazole (BTH) (brand name Actigard) and copper oxychloride (brand name Kocide). Acibenzolar-S-methyl is considered a systemic crop protectant which reportedly functions by mimicking pathogen–host interactions and evoking systemic acquired resistance in plants.2 In contrast, copper oxychloride and other copper formulations have been used for centuries to inhibit cellular growth by the introduction of toxic levels of copper ions into the phylloplane, which stunt fungal and bacterial cell growth. Because the activities of the systemic and copper materials are so markedly different, we hypothesized that they would impact tomato phyllosphere microbial ecology differently as well. Establishing whether or not these impacts might have important consequences for produce safety was one objective of this study. A second objective was to evaluate whether or not a difference in the presence of several specific bacterial genera could be correlated to either treatment or controls. The first bacterial genus of interest was Salmonella, due to the importance of this organism in foodborne illness and the history of outbreaks linked to tomatoes grown in the Virginia area. A second genus of interest was Xanthomonas, due to its importance in tomato plant pathology for this region. The third genus of interest was Paenibacillus, because of its reported activity as a Salmonella antagonist.3 Paenibacillus has been shown to kill Salmonella in laboratory settings3 and to co-enrich during culturing methods designed to detect the presence of Salmonella.4,5 This means that detection or recovery of Salmonella from agricultural samples is likely impeded when Paenibacillus spp. are present, thereby confounding the understanding of food safety risks associated with agricultural commodities. The data generated in this study also establish a baseline taxonomic survey of both fungal and bacterial microbiota associated with tomato plants grown in eastern Virginia to address a current data gap.
Materials and Methods
Field collection
Tomato seeds of cultivar BHN 585 (large, round, fresh market) were sown in seedling trays in the greenhouse, and transplanted at 7 weeks to the fields at the Research and Extension Center of Virginia Tech in Painter, Virginia (latitude 37.58°, longitude −75.78°). Tomato plants were planted in 61 m growing rows with approximately 110 plants per row, with 0.5 m between individual plants. Tomato plants were staked and stringed. Independent plots were comprised of 27 plants in 12.2 m. The plots of 27 plants were maintained in triplicate for each treatment (systemic and copper) and for control plots. Buffer plants (no treatment) were planted between each plot and between each experimental row. Applications of pesticide and protectant materials were mixed and applied according to the labels of the two pesticides, for tomato field treatment. The converted maximum label concentration rates for the equivalent application of 370 L ha−1 of Kocide 3000 46WG and Actigard 50WG are 1.2 g L−1 and 60 mg L−1, respectively. Both pesticides were mixed with water and applied by manual spraying at bi-weekly intervals. No specific permissions were required for collection from these research fields, other than the consent of the Virginia Tech agricultural research scientists and extension agents who direct the activities of this Agricultural Experiment Station. These field studies did not involve endangered or protected species. Samples were collected from each treatment on 16 September and 12 October 2009. Approximately four tomatoes and ten leaves were collected per replicate. Replicate samples were composites – collected by walking down an independent replicate plot comprised of 27 plants and collecting from as many as ten plants – spread throughout the plot. Leaves and tomatoes were placed in Ziploc bags (using gloves) and stored in a cooler at approximately 4 °C until they were returned to the laboratory.
Laboratory processing
In the laboratory, 300 mL sterile water was added to each bag of tomatoes and leaves. The mixture was sonicated for 6 min on each side (12 min total) using a Branson Ultrasonic Bath 8510 (Branson Ultrasonics, Danbury, CT, USA). The wash was centrifuged at 9000 × g for 1 h to create a pellet of phyllosphere microflora for subsequent DNA extraction. DNA was extracted from the resulting pellet using the Promega Wizard® Genomic DNA purification kit (cat. #A1120; Promega Corporation, Madison, WI, USA) following the extraction protocol for Gram-positive bacterial species.
16S/18S tailed-end amplicon sequencing
16S/18S amplicon sequencing was performed according to Illumina's Overview of tailed amplicon sequencing approach with MiSeq protocol. This two-step polymerase chain reaction (PCR) approach utilizes sequence-specific primers and Nextera DNA index kit (Illumina, San Diego, CA, USA). Sequence-specific primers (IDT Inc., Coralville, IA, USA) were designed according to low-diversity amplicon specifications, shown below. Adapter overhang sequences TCGTCGGCAGCGTCAGATGTGTATAAGAGACAG and GTCTCGTGGGCTCGGAGATGTGTATAAGAGACAG were added to the 5′ end of the forward and reverse primers respectively. The 5′ overhang sequences on the primers are complementary to oligonucleotides within the Nextera DNA indices. This permits the addition of a unique sample index and P5/P7 adapters to make the template compatible for hybridization to the flow cell. 16S/18S rRNA genes are highly conserved, which causes signal saturation during Illumina sequencing; therefore, in order to generate amplicon diversity, random staggering nucleotide sequences, ranging from 0 to 16 nucleotides, were incorporated between overhang adapter sequences and sequence-specific primers. Each sample was amplified with a different set of forward and reverse primers. Sequence-specific primers used for the first round of PCR were as follows: 16S amplicons 5′-GTGCCAGCMGCCGCGGTAA (forward) and 5′-GGACTACHVGGGTWTCTAAT-3′ (reverse);6 18S rRNA gene amplicons GGAAGGGRTGTATTTATTAG (forward), GTAAAAGTCCTGGTTCCCC (reverse), EF4 5′-GGAAGGGRTGTATTTATTAG-3′ (forward) and Fung5 5′-GTAAAAGTCCTGGT TCCCC-3′ (reverse).7 Emerald Green GT PCR Master Mix (Takara Bio Inc. Otsu, Shiga, Japan) was used to generate amplicons. Thermocycler settings used for PCR were as follows: 95 °C, 3 min; 94 °C, 1 min; 56 °C, 1 min; 72 °C, 1 min; cycle 29 times; 72 °C, 5 min; 4 °C forever. PCR samples were run on a 2% agarose E-gel® (Invitrogen, Carlsbad, CA, USA) with a 100 bp ladder (Invitrogen, Carlsbad, CA, USA). Clean PCR product was obtained using AMPure XT® beads (Beckman Coulter Inc., Brea, CA, USA) to remove fragments smaller than 100 bases. Two microliters of product from the first round of PCR was used as a template for the second round of PCR. One microliter of each index N50X and N70X was added to the PCR reaction. Each sample had a different combination of N50X and N70X indices and there were no repeats. PCR was performed using the same thermocycler settings from the first round of PCR. Product obtained from the second round of PCR was cleaned using AMPure XT beads. Sample DNA concentration was determined using Qubit® high-sensitivity assay (Life Technologies, Grand Island, NY, USA).
Samples were then diluted to 2 nmol L−1 with EB buffer (Qiagen, Hilden, Germany) and pooled using 10 µL of each sample. Ten microliters were taken from the amplicon multiplex sample and denatured with 10 µL of 0.2 mol L−1 NaOH. This process was performed simultaneously for a 2 nmol L−1 PhiX sample (Illumina) in a separate tube. Samples were incubated at room temperature for 5 min; then 980 µL HT1 buffer (Illumina) was added to each sample to create a final concentration of 20 pmol L−1. PhiX and amplicon multiplex samples were diluted to 5 pmol L−1 in 500 µL, and pooled together at a 1:1 ratio for a final volume of 1000 µL. Six hundred microliters of the combined sample was loaded on a MiSeq V2 cartridge (Illumina). The sample was sequenced on a MiSeq V2 platform.
Nextera XT DNA shotgun sequence sample preparation and sequencing
Sample DNA concentration was determined using Qubit high-sensitivity assay. Isolates were diluted to 1 ng 5 µL−1 (0.2 ng µL−1) to be used as input for the Nextera XT DNA sample preparation kit (Illumina). Samples were 'tagmented' and amplified with the associated Nextera XT index kit according to the manufacturer's specifications. Finalized libraries were normalized to 2–4 nmol L−1 and denatured using Nextera XT normalization beads (Illumina) and 0.1 mol L−1 NaOH, respectively. A metagenomic multiplex sample was achieved by pooling 10 µL of each isolate. Twenty-four microliters of the multiplex sample were added to 576 µL HT1 buffer (Illumina) for a final volume of 600 µL and loaded on to a MiSeq V2 cartridge. Sample was sequenced on a MiSeq V2 platform.
Sequence assembly and quality filtering
Prior to analyses, samples were filtered to remove poor-quality regions and reads using the dynamic trimming algorithm implemented in the program SolexaQA with default parameter settings (http://www.biomedcentral.com/1471-2105/11/485). For shotgun metagenomic samples we merged overlapping reads using the program Fast Length Adjustment of SHort reads (FLASH)8 using the default parameter settings. For the 16S and 18S rRNA gene amplicon datasets, we analyzed the set of reads with the best mean quality scores. All sequences were deposited in the Short Read Archive of NCBI under BioProject ID PRJNA255414.
Taxonomic annotation
We annotated the microbial diversity associated with 16S rRNA gene amplicons using the QIIME program (Quantitative Insights Into Microbial Ecology), which uses the Greengenes database (http://greengenes.lbl.gov/) at the Lawrence Berkeley National Library. For annotation of the 18S dataset, we used the SILVA reference database (http://www.arb-silva.de) with the QIIME pipeline. For shotgun datasets, we assigned taxonomy to shotgun reads using the lowest common ancestor approach with the web-based tools in MG-RAST,9 which represents a more conservative approach than the assignment of taxonomy based on the best similarity hit in which reads may be assigned to more than one taxonomic identity. MG-RAST uses the M5 non-redundant database (M5NR), a compilation of many databases (e.g. BLAST nr, KEGG and Uniprot) as the reference database. For all analyses in MG-RAST we used a maximum e-value cut-off of 1.0−5, minimum percent identity of 95% and minimum alignment length of 33 amino acids (99 bp; MG-RAST classifications are based on amino acid similarity). Overall taxonomic differences were estimated through the construction of a principal coordinates analysis (PCoA) based on normalized Bray–Curtis distances. To account for differences in the number of reads among the samples, we only present the normalized abundances of different taxonomic groups.
Targeted bacterial detection
Because we were specifically interested in the presence of Salmonella in all of the samples, we used a pipeline developed by Dr Antonio Gonzalez known as Platypus Conquistador, available at https://github.com/qiime/platypus. The concept for this detection pipeline was to create two databases to use with a BLAST approach. One database contained only the taxonomic group of interest and the second database contained all other genomes available at the IMG (Integrated Microbial Genomes and Metagenomes) database hosted by the Joint Genome Institute (JGI, DOE, http://img.jgi.doe.gov). For each sample, shotgun reads were BLASTed to each database and the results were compared using Platypus Conquistador to find hits with higher scores to the database of the pathogen of interest – or hits that only matched the pathogen of interest database (in this case Salmonella). The BLAST analyses were done with an e-value = 1e − 30 and the platypus step was done with a minimum alignment length of 100 and percent identity of 100%. We performed paired t-tests using R,10 to determine whether there were significant differences between the treatments (systemic and copper) and the control (untreated) with regard to differential abundance of Salmonella, Xanthomonas and Paenibacillus.
Results
Approximately 236 000 raw 16S rRNA gene sequences with an average length of 249 bases were acquired for each independent replicate of systemic, copper and control tomato phyllosphere samples. These data were further culled using quality trimming methods described above under 'Materials and methods', to an average of 186 441 sequences per replicate, with an average length of 167 bases. An average of 60 000 18S rRNA gene sequences, with an average length of 189 bases, were culled to an average of 39 381 sequences per replicate, with an average length of 106 bases. For the shotgun data, an average of 3 346 677 were recovered per sample replicate (634 892 974 bases) with an average length of 195 bases for use in downstream analyses.
Bacterial and eukaryotic diversity and structure
Examining bacterial diversity, represented by16S rRNA gene amplicons for the three sample groups (systemic, copper and control), we did not see a significant treatment effect with regard to taxonomic composition, using operational taxonomic units (OTUs) at 97% similarity (Fig. 1a). There did, however, appear to be a difference in species richness between the two sampling time-points. On average, fewer OTUs were observed in September when compared to October (Fig. 1b). This trend of clustering by time-point instead of by treatment is also evident in a tree-based visualization of the shared 16S taxonomy associated with the treatments and the time-points (Fig. 2). The clearest separation by time-point instead of by treatment was observed in shotgun data (Fig. 3b). September and October time-points are clearly separated in this principal component analysis, while the treatments cannot be differentiated (Fig. 3a).
Figure 1.
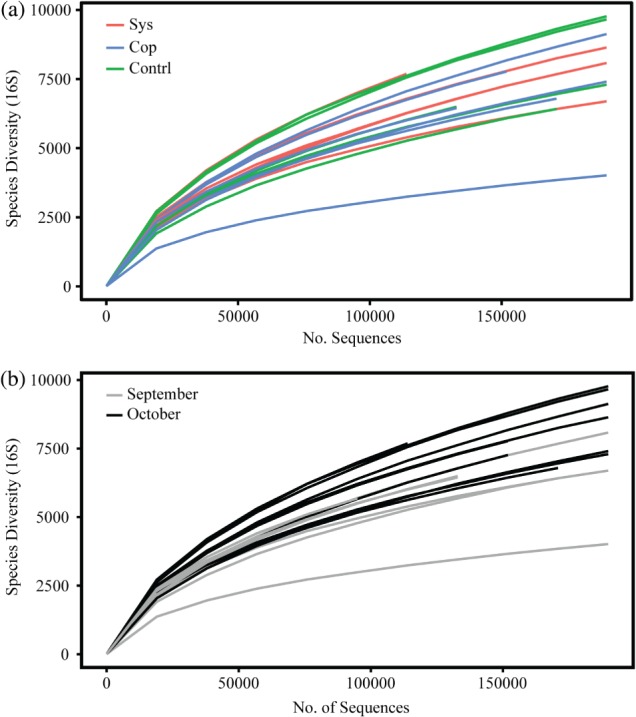
Rarefaction plots based on the 16S rDNA sequences, with samples grouped by treatment (a) and sampling date (b).
Figure 2.
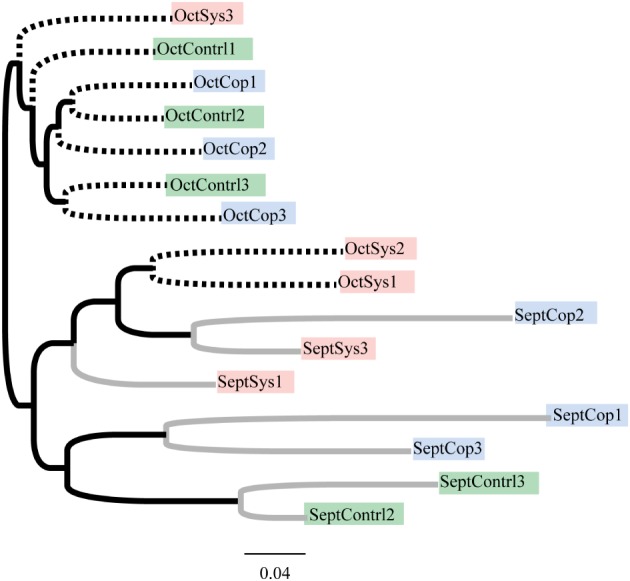
Dendrogram showing the similarities between bacterial communities found within each sample based on Unifrac distances. Tips are color-coded by treatment; gray branches denote samples collected in September and dashed branches denote samples collected in October.
Figure 3.
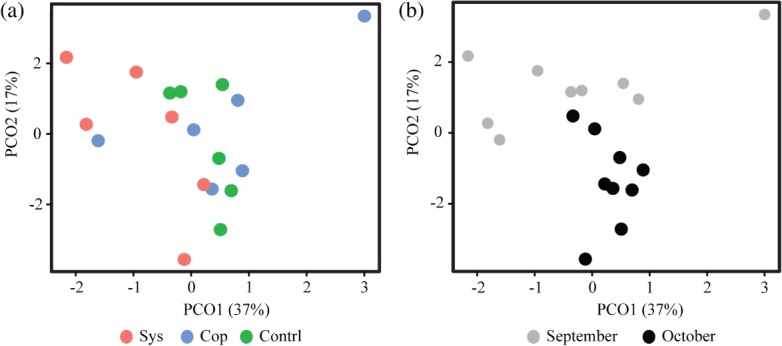
Principal coordinate analysis (PCoA) plots for shotgun datasets by treatment (a) and sampling date (b).
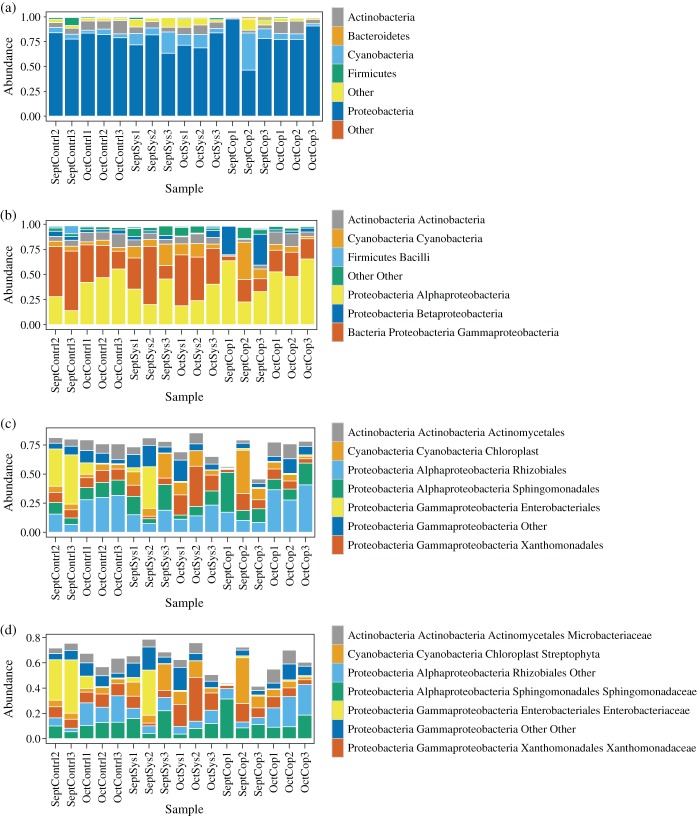
A taxonomic overview of observed bacteria is shown in Fig. 4. One of the most interesting taxonomic differences in bacterial microflora observed between treatments was a statistically significant (P < 0.05) increase, in the abundance of Gammaproteobacteria in systemic and control samples when compared to copper (Fig. 5a). The systemic pesticide reportedly functions by enacting an enhanced defense status in the plant – not by any mode of direct 'kill', as copper does. The topical activity of the copper pesticide seems to have a stronger ability to reduce levels of one or more Gammaproteobacteria taxa. The relative abundances of genera within Enterobacteriaceae have been plotted in Fig. 6 to provide more insight into which members of this family may be driving the significant differences observed at the higher taxonomic level of class (Gammaproteobacteria). Although not significant at P < 0.05), the pesticides (systemic and copper) appeared to play a role in the reduced abundance of Buttiauxella, Cronobacter, Pantoea and Providencia relative to controls (Fig. 6).
Figure 4.
Plots of relative abundance of bacterial phylum (a), class (b), order (c) and family (d).
Figure 5.
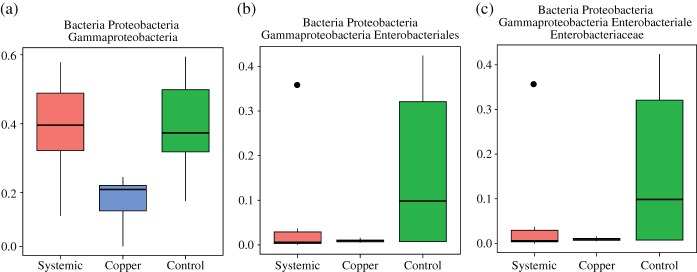
Boxplots showing the differences in relative abundance of sequences assigned to different taxonomic groups within the Proteobacteria. Boxes depict the interquartile (IQR) range and whiskers indicate 1.5 IQR. The horizontal black line represents the mean.
Figure 6.
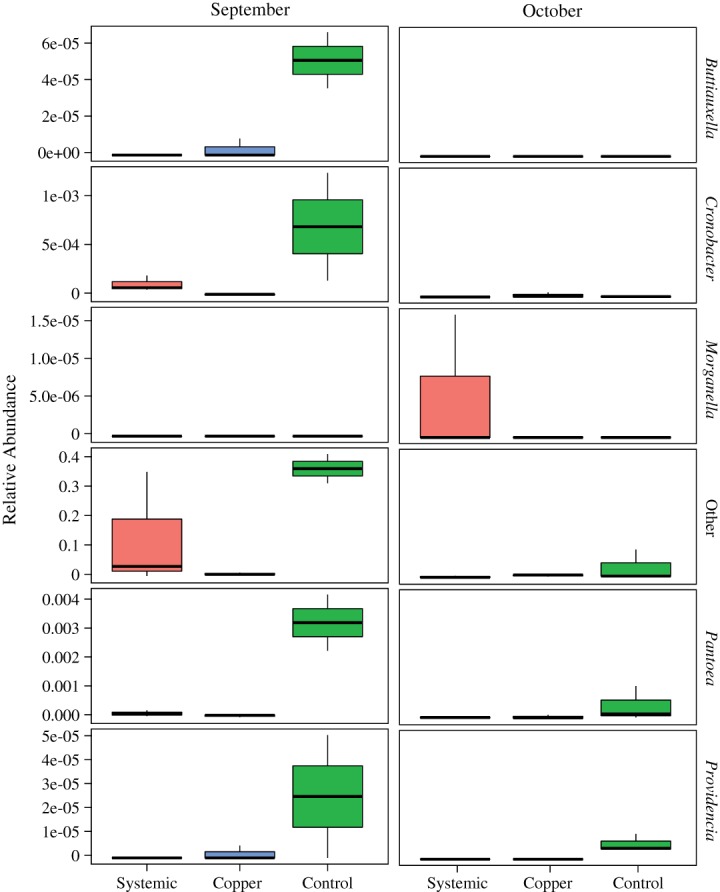
Boxplots showing the relative abundances of sequences assigned to different genera within the Enterobacteriaceae. Boxes depict the interquartile (IQR) range and whiskers indicate 1.5 IQR. The horizontal black line represents the mean.
For the Eukarya, based on the use of 18S rRNA gene amplicons, we observed no distinguishable differences in alpha and beta diversity between treatments and time-points looking at rarefaction curves (not shown) and principal coordinate analyses (not shown). We did not observe an average increased diversity in the October time-point when compared to September as we did with the 16S rRNA gene dataset. An overview of the fungal taxonomy associated with all samples is shown in Fig. 7.
Figure 7.

Differences in the abundance of different fungal groups across the samples grouped by sampling date.
Detection of Salmonella
When we searched specifically for the presence and/or differential abundance of Salmonella in any of the treatments, we used the previously described Platypus Conquistador pipeline on the shotgun sequence data and then performed pairwise tests using R to see if any of the treatments differed significantly by number of reads classified to the taxa of interest (in this case Salmonella) (Fig. 8 and Table1). There was a higher mean abundance of Salmonella in controls relative to treatments. With a greater number of independent replicates, we might have been able to identify statistical significance, but our current data can only effectively describe trends.
Figure 8.
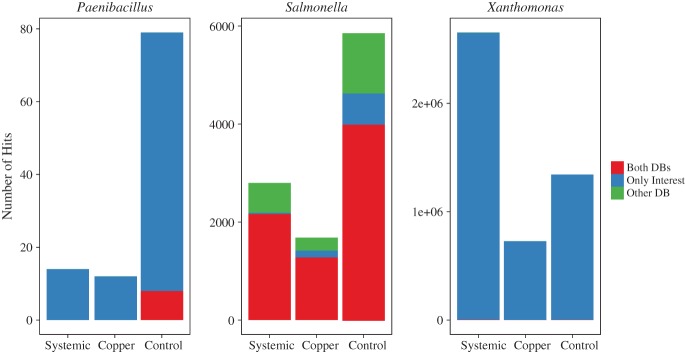
Number of hits classified to three different bacterial genera based on the method implemented in Platypus Conquistador. 'Both DBs' represents sequences whose bit score when blasted against the target database (e.g., Paenibacillus) was the same as that observed when BLASTed against the 'other' database (e.g. contains no Paenibacillus genomes). 'Only Interest' denotes sequences that only hit to the target database. 'Other DB sequences' are those that hit to the other database with a better bit-score than to the target database.
Table 1.
Mean number of sequences within each treatment that only matched to the Salmonella database using Platypus Conquistador
| Systemic | Copper | Control | |
|---|---|---|---|
| Systemic | 4.3 | 0.202 | 0.149 |
| Copper | 23.5 | 0.227 | |
| Control | 105 |
Detection of Xanthomonas
We also used the Platypus Conquistador pipeline to look specifically for presence and/or differential abundance of the important plant pathogen Xanthomonas campestris, although we did not attempt to identify Xanthomonas by species. Highest mean abundance of the genus Xanthomonas was observed in systemic treated plants (Fig. 8 and Table2). Perhaps there is something about the heightened systemic acquired resistance cascade of biochemistry that is actually conducive to growth of Xanthomonas.
Table 2.
Mean number of sequences within each treatment that only matched to the Xanthomonas database using Platypus Conquistador
| Systemic | Copper | Control | |
|---|---|---|---|
| Systemic | 441462 | 0.3322 | 0.5015 |
| Copper | 121043 | 0.1848 | |
| Control | 223603 |
Detection of Paenibacillus
There are multiple reports of Paenibacillus species isolated from phyllosphere, rhizosphere and agricultural soil environments, and this genus is reported to play important roles in plant health and ecology.11 Specifically, Paenibacillus is known to produce antibiotics that can be antagonistic to other bacterial and fungal species.12 Work in our own labs has demonstrated that Paenibacillus is effective at killing Salmonella and inhibiting numerous other foodborne pathogens.3 A patent has been filed13and work is underway to test efficacy of Paeni-applications as biopesticides and post-harvest sprays. It has also been shown that media-based methods to culture Salmonella from phyllosphere samples unintentionally co-enrich Paenibacillus spp.,4,5 which, as previously mentioned, is effective in killing Salmonella. This recent understanding has highlighted the importance of understanding the presence of Paenibacillus in agricultural environments and how it may be impacted by diverse pesticide materials to better understand the dynamics associated with culture-based methods to detect Salmonella from agricultural commodities. A higher mean abundance of Paenibacillus was observed in controls relative to treatments – which might suggest that both systemic and topical (copper) fungicides diminish the presence of Paenibacillus spp. in the phyllosphere (Fig. 8 and Table3). However, due to the fact that no statistical significance at P < 0.05 could be reported, the reduced abundance of Paenibacillus in the treated samples could just as easily be caused by other factors.
Table 3.
Mean number of sequences within each treatment that only matched to the Paenibacillus database using Platypus Conquistador
| Systemic | Copper | Control | |
|---|---|---|---|
| Systemic | 2.33 | 0.826 | 0.289 |
| Copper | 2 | 0.273 | |
| Control | 11.83 |
Discussion
The phyllosphere of crops and natural areas is estimated to span 1018 cm2 of surface area and to support between 104 and 108 cells per square centimeter of leaf tissue — an estimated 1026 organisms in total.14 Despite this vast and far-reaching ecology, very little is currently understood about any core microbiome that may be associated with a specific crop or a specific genus, species or cultivar, and even less is known about the impact of agricultural practices on endemic microbial ecology associated with food crops. Food safety initiatives have been one of the driving forces behind the culture-independent description of food plant phyllosphere communities. Understanding how human pathogens are introduced to the phyllosphere and how they persist once introduced is an important research gap that, when filled, will greatly mitigate future risks to consumers. An emerging trend in published and unpublished works has revealed that the most significant differences between phyllosphere communities are often independent of agricultural treatments being investigated, such as the copper and systemic pesticides described here, but rather associated with diverse environmental pressures. Telias et al.15 exposed field-grown tomato to two different water sources to examine the relative safety of water sources used in agriculture (surface vs. ground water). Although very distinct microbial consortia were documented for each water source, when applied to tomatoes the impact on the plants' phyllosphere composition was minimal.15 Pressures associated with the phyllosphere were more significant drivers of the microbial diversity associated with the tomato fruits than either of the water sources. All phyllosphere samples clustered together in principal coordinate analyses, regardless of which water source had come in contact with the tomatoes.15 Another example of the importance of environmental pressures on phyllosphere microflora was demonstrated by Perazzolli et al.,16 who found that epiphytic microflora associated with grapevines was not significantly altered by treatment with different pesticides (bio-control and traditional pesticide). Instead, the primary driver of differences observed in microbial diversity and structure for epiphytic communities associated with grapevines appeared to be the biogeography of the three different sites where the plants were grown.
One of the most interesting trends observed in the work presented here is that, despite the fact that vastly different materials were applied to tomato plants (systemic, copper and control), the most striking differences in microbial community structure and diversity were observed between time-points and not treatments. This observation is based on the following trends: the average number of 16S OTUs (Fig. 1b) and the principal component analysis of shared membership associated with the shotgun data (Fig. 2b). It is likely that environmental factors play a more important role in food safety considerations than previously realized. Wind, emissions, nearby factories, animal farms, sands, dusts and other airborne particulates may be the most important factors in contamination events and subsequent persistence of pathogens in fresh produce commodities. The trends observed in this study certainly suggest that more work is needed in this area to better describe the most important risk factors associated with production of fresh produce.
Conclusions
We documented a significant difference (P < 0.05) in the reduced abundance of Gammaproteobacteria in copper-treated plants compared to controls (Fig. 5a). Gammaproteobacteria is the class of bacteria that is home to Salmonella, Escherichia and other significant Enterobacteriaceae pathogens. We also observed a higher mean abundance of Enterobacteriaceae in controls relative to both treatments (Fig. 5b, c). The perturbation of Enterobacteriaceae in the phyllosphere ecology of a food plant may influence niche dynamics and impact the survival of introduced pathogens. Not statistically significant, but still interesting, was the higher mean abundance of Salmonella and Paenibacillus observed in controls relative to treatments, suggesting that both systemic and topical pesticides may reduce the incidence of these important genera in the phyllosphere of tomatoes. We also documented a higher mean abundance of Xanthomonas in the systemic treatment. As previously mentioned, systemic (acibenzolar-S-methyl) can impact biochemical cascades in plants, inducing molecules that may actually be desirable to certain genera and thus create a preferential habitat for certain species. Most intriguing was the clear separation of September and October microflora observed in the shotgun dataset, in contrast to indistinguishable treatment effects (Fig. 3a, b). All of these findings merit further study as we attempt to elucidate the impact of specific agricultural practices on phyllosphere niche dynamics to better identify critical control points for food safety in the agricultural phyllosphere. Another important contribution from this work is the culture-independent description of the baseline microbial ecology of a Virginia-grown tomato crop. We documented as many as five bacterial phyla and four fungal phyla associated with this tomato phytobiome, providing valuable baseline taxonomic data for future comparisons.
Acknowledgments
We would like to thank the Virginia Tech Agricultural Research Station in Painter, Virginia, for their assistance with this work.
References
- 1.Ottesen AR, Gonzalez Pena A, White JR, Pettengill JB, Li C, Allard S, et al. Baseline survey of the anatomical microbial ecology of an important food plant: Solanum lycopersicum (tomato) BMC Microbiol. 2013;13:114. doi: 10.1186/1471-2180-13-114. [DOI] [PMC free article] [PubMed] [Google Scholar]
- 2.Cole De L. The efficacy of acibenzolar-S-methyl, an inducer of systemic acquired resistance, against bacterial and fungal diseases of tobacco. Crop Prot. 1999;18:267–273. [Google Scholar]
- 3.Allard S, Enurah A, Strain E, Millner P, Rideout SL, Brown EW. In situ evaluation of Paenibacillus alvei in reducing carriage of Salmonella enterica serovar Newport on whole tomato plants. Appl Environ Microbiol. 2014;80:3842–3849. doi: 10.1128/AEM.00835-14. [DOI] [PMC free article] [PubMed] [Google Scholar]
- 4.Ottesen AR, Gonzalez A, Bell R, Arce C, Rideout S, Allard M. Co-enriching microflora associated with culture based methods to detect Salmonella from tomato phyllosphere. PloS One. 2013;8:e73079. doi: 10.1371/journal.pone.0073079. [DOI] [PMC free article] [PubMed] [Google Scholar]
- 5.Pettengill JB, McAvoy E, White JR, Allard M, Brown E, Ottesen A. Using metagenomic analyses to estimate the consequences of enrichment bias for pathogen detection. BMC Res Notes. 2012;5:378. doi: 10.1186/1756-0500-5-378. [DOI] [PMC free article] [PubMed] [Google Scholar]
- 6.Caporaso JG, Lauber CL, Walters WA, Berg-Lyons D, Huntley J, Fierer N. Ultra-high-throughput microbial community analysis on the Illumina HiSeq and MiSeq platforms. ISME J. 2012;6:1621–1624. doi: 10.1038/ismej.2012.8. [DOI] [PMC free article] [PubMed] [Google Scholar]
- 7.Smit E, Leeflang P, Glandorf B. Dirk van Elsas J and Wernars K, Analysis of fungal diversity in the wheat rhizosphere by sequencing of cloned PCR-amplified genes encoding 18S rRNA and temperature gradient gel electrophoresis. Appl Environ Microbiol. 1999;65:2614–2621. doi: 10.1128/aem.65.6.2614-2621.1999. [DOI] [PMC free article] [PubMed] [Google Scholar]
- 8.Magoc T, Salzberg SL. FLASH: fast length adjustment of short reads to improve genome assemblies. Bioinformatics. 2011;27:2957–2963. doi: 10.1093/bioinformatics/btr507. [DOI] [PMC free article] [PubMed] [Google Scholar]
- 9.Meyer F, Paarmann D, D'Souza M, Olson R, Glass EM, Kubal M. The metagenomics RAST server: a public resource for the automatic phylogenetic and functional analysis of metagenomes. BMC Bioinf. 2008;9:386. doi: 10.1186/1471-2105-9-386. [DOI] [PMC free article] [PubMed] [Google Scholar]
- 10.R Development Core Team. R: a language and environment for statistical computing. Vienna: R Foundation for Statistical Computing; 2011. [Google Scholar]
- 11.McSpadden Gardener BB. Ecology of Bacillus and Paenibacillus spp. in agricultural systems. Phytopathology. 2004;94:1252–1258. doi: 10.1094/PHYTO.2004.94.11.1252. [DOI] [PubMed] [Google Scholar]
- 12.Selim S, Negrel J, Govaerts C, Gianinazzi S, van Tuinen D. Isolation and partial characterization of antagonistic peptides produced by Paenibacillus sp. strain B2 isolated from the sorghum mycorrhizosphere. Appl Environ Microbiol. 2005;71:6501–6507. doi: 10.1128/AEM.71.11.6501-6507.2005. [DOI] [PMC free article] [PubMed] [Google Scholar]
- 13.Brown EW, Zheng J, Enurah A. Paenibacillus alvei strain ts-15 and its use in controlling pathogenic organisms. US Patent WO. 2012;2012166392:A1. [Google Scholar]
- 14.Morris CEK, Kinkel LL. Fifty years of phyllosphere microbiology: significant contributions to research in related fields. In: Lindow SE, Hecht-Poinar EI, Elliott VJ, editors. Phyllosphere Microbiology. St Louis, MO: APS Press; 2004. pp. 365–375. [Google Scholar]
- 15.Telias A, White J, Pahl D, Ottesen A, Walsh C. BMC Microbiol11 Bacterial community diversity and variation in spray water sources and the tomato fruit surface: 81. [DOI] [PMC free article] [PubMed]
- 16.Perazzolli M, Antonielli L, Storari M, Puopolo G, Pancher M, Giovannini O. Resilience of the natural phyllosphere microbiota of the grapevine to chemical and biological pesticides. Appl Environ Microbiol. 2014;80:3585–3596. doi: 10.1128/AEM.00415-14. [DOI] [PMC free article] [PubMed] [Google Scholar]


