

Abstract
Background
Studies of the association between IQ and alcohol consumption have shown conflicting results. The aim of this study was to investigate the association between IQ test results and alcohol consumption, measured as both total alcohol intake and pattern of alcohol use.
Methods
The study population consists of 49,321 Swedish males born 1949 to 1951 who were conscripted for Swedish military service 1969 to 1970. IQ test results were available from tests performed at conscription. Questionnaires performed at conscription provided data on total alcohol intake (consumed grams of alcohol/wk) and pattern of drinking. Multinomial and binomial logistic regressions were performed on the cross-sectional data to estimate odds ratios (ORs) with 95% confidence intervals (CIs). Adjustments were made for socioeconomic position as a child, psychiatric symptoms and emotional stability, and father's alcohol habits.
Results
We found an increased OR of 1.20 (1.17 to 1.23) for every step decrease on the stanine scale to be a high consumer versus a light consumer of alcohol. For binge drinking, an increased OR of 1.09 (95% CI = 1.08 to 1.11) was estimated for every step decrease on the stanine scale. Adjustment for confounders attenuated the associations. Also, IQ in adolescence was found to be inversely associated with moderate/high alcohol consumption measured in middle age.
Conclusions
We found that lower results on IQ tests are associated with higher consumption of alcohol measured in terms of both total alcohol intake and binge drinking in Swedish adolescent men.
Keywords: IQ, Alcohol Consumption
Intelligence has been shown to be associated with various health-related outcomes in several studies (Andersson et al., 2008; Calvin et al., 2011; David et al., 1997; Gale et al., 2010; Hart et al., 2004; Hemmingsson et al., 2007; Martin et al., 2004). However, previous findings on cognitive ability and alcohol-related problems have not been consistent, possibly due to differences between the outcomes assessed.
One suggested explanation for the association between intelligence and health is that cognitive skills enhance possibilities to make healthy lifestyle choices. Cognitive ability has been found to be associated with several health-related behaviors, such as smoking, food intake, and physical activity (Batty et al., 2007b,c; Hemmingsson et al., 2008). The scientific literature on intelligence and alcohol consumption in adolescence, measured as total intake and type of drinking, is scarce. A twin study from the United States showed that a high IQ assessed at age 17 was associated with heavier alcohol use as measured by an alcohol use composite, taking into account symptoms of alcohol abuse/dependence, number of intoxications, frequency of use and number of drinks during a year, and maximum number of drinks within 24 hours (Johnson et al., 2009). A study from Switzerland investigated how IQ test results from conscription were associated with frequency of drinking, defined as nondrinking, rare drinking (1 to 5 times/y), occasional drinking (1 to 5 times/month), moderate drinking (1 to 5 times/wk), and daily drinking. It showed that high performance on IQ tests had a positive association with moderate drinking (Muller et al., 2013). In the 1970 British Cohort Study, it was found that higher childhood mental ability was associated with higher alcohol intake as an adult (Batty et al., 2008). Another study from the United States, of a population 14 to 21 years of age, showed, on a measure of verbal intelligence, that lower verbal intelligence was associated with lower alcohol consumption, but also with a higher risk of alcohol-related problems among those who consumed alcohol (Windle and Blane, 1989).
Intelligence is commonly defined as “a very general mental capability that, among other things, involves the ability to reason, plan, solve problems, think abstractly, comprehend complex ideas, learn quickly, and learn from experience” (Gottfredson, 1997). There are several tests of intelligence available, and the main difference between them lies in the recognition, or not, of a general factor, “g,” as introduced by Spearman. The “g” factor theory addresses the positive correlations found between tests designed to capture different suggested areas of intelligence, for example, verbal, logical, and spatial. Instead of 1 “g” factor, Horn and Cattell suggested 5 “general” factors, of which those concerned with “fluid” and “crystallized” abilities are the most influential. The first is a matter of basic ability to reason (gf), while the latter (gc) concerns how well the individual has invested his/her fluid ability in society to gain knowledge of value. These 2 theories are often contrasted with that of Thurstone, in whose model primary mental abilities are expected to explain test results more independently (Carlstedt, 2000; Gustafsson, 1984; Nisbett et al., 2012). However, as concluded by Deary (2012), there are few empirical grounds for considering intelligence without the “g”-factor.
Studies on alcohol consumption should consider both total alcohol intake and pattern of drinking (Rehm et al., 2003). Although few studies have been performed on patterns of drinking, they have been shown to be of importance for certain diagnoses, for example, ischemic heart disease, fetal alcohol syndrome, and injury (Plunk et al., 2014; Rehm et al., 2010). There are different definitions of patterns of drinking in the literature. Normally, binge drinking is contrasted with a moderate or steady type of drinking, but there is a lack of distinct and broadly acknowledged measures of the different patterns of consumption (Field et al., 2008). It is, however, known, that binge drinking is more common among young adults and adolescents (Kuntsche et al., 2004). Further, a systematic review by McCambridge and colleagues (2011) showed that high alcohol consumption in late adolescence is carried into adulthood and as too are the problems associated with alcohol.
The aim of this study was to examine the association between intelligence and total alcohol intake during a specific time period and pattern of drinking. We have, in an earlier study, shown an inverse association between the results of IQ tests in adolescence and alcohol-related disease and death in adulthood (Sjolund et al., 2012). We therefore hypothesize that IQ test results have inverse associations with the 2 measures of alcohol consumption.
Our specific research questions were as follows:
Is there an association between intelligence and total alcohol intake in adolescence?
Is there an association between intelligence and pattern of drinking in adolescence?
Are there differences in the associations between different the cognitive factors measured in an IQ test and total alcohol intake and pattern of drinking in adolescence?
Does any association between IQ test results and total alcohol intake in adolescence persist into adulthood?
Materials and Methods
Data Sources
The study is based on data on men who were conscripted into military service in Sweden during 1969 to 1970. Information about the individuals was collected through questionnaires (with questions about medical, childhood and adolescent conditions, and alcohol and tobacco use), a psychological function capacity assessment, and a medical examination (physical examination, X-rays, ECG, etc.). If asked for by a conscript, or indicated by the psychological and medical examination, a psychiatric consultation took place. The 2 main aims of conscription examination were to (i) assess the individual's capacity for military service and (ii) prepare for appropriate posting within the military. At the time, there were 6 enlistment centers in Sweden, which managed the 2-day long examination of each conscript (Ahlborg et al., 1973; Otto, 1976). The national birth cohorts used in this study are unique among all conscript material in Sweden, as more extensive data were collected at conscription during these years. Several studies using these birth cohorts have previously been published (Andreasson et al., 1988, 1991; Larsson et al., 2002; Sidorchuk et al., 2012).
Through record linkage made possible by use of the personal identification numbers that are assigned to all Swedish citizens at birth, individual information from the National Censuses of 1960 was obtained. Also, record linkage was made to the Swedish Survey of Living Conditions (ULF) to perform a subanalysis of a sample of the population later in life. The annual ULF surveys were started in 1975 in Sweden, with the aim of describing the distribution of welfare within the population. Included in ULF are Swedish residents between the ages 16 and 84 randomly selected from the entire Swedish population. In total, about 7,500 individuals have been included yearly, with a response rate of around 80% (SCB, 2010; Statistics Sweden, 2014). The surveys conducted in the years 1988 to 1989, 1996 to 1997, and 2004 to 2005 were used in this study, as these were the only years with survey questions on alcohol consumption. The probability of being included in ULF for the first time for any 1 conscript in our cohort was about 6 per 10,000 each year. We therefore expected a total of about 180 individuals in our sample, which is a few more than we actually achieved (n = 146). Both the National Censuses and the Swedish Survey of Living Conditions are maintained by Statistics Sweden (SCB).
Study Population
The study population consists of all males conscripted for military service in Sweden during the years 1969 to 1970 and born 1949 to 1951. Excluded from the study were men who were conscripted during 1969 to 1970, but born earlier than 1949, as they had postponed conscription (for unknown reasons). The study population corresponds to 97% of all Swedish men born 1949 to 1951, in total 49,321 individuals. At the time, only 2 to 3% of all Swedish men were exempted from military service, due to severe handicap or congenital disorder. Of the male conscripts born 1949 to 1951, 146 were part of the random selection from the later national Surveys of Living Conditions (ULF) and thus formed the subpopulation in our study. Information from the latest possible occasion was used for each individual. The individuals were then 37 to 40, 45 to 48, or 53 to 56 years of age.
Exposure
Testing of cognitive ability as part of conscription examination has been practiced since 1944 in Sweden. The purpose of the IQ test is to give an overall impression of the conscript's general ability to assimilate military education (Ross, 1988). The IQ test used in our study had 4 different parts: (A) instructions—testing verbal ability to follow instructions, where logical inductive ability is also tested (40 items), (B) concept discrimination—testing both logical inductive and verbal ability by selecting which 1 of 5 words that does not agree with the others conceptually (40 items), (C) paper form board—testing spatial ability by choosing which group of geometric figures make up a presented figure (25 items), and (D) technical comprehension—testing technical ability by selecting 1 of 3 options that to answer a question related to a picture illustrating a basic technical or physical property (52 items) (Carlstedt and Mårdberg, 1993). Optically readable response sheets were used and slight time pressure was applied (Rönnlund et al., 2013). Instructions were given to the conscript prior to each subtest. Scrutiny of the different subtests has shown high intercorrelations, which is why interpretations of differences in results should be made with caution. Test–retest reliability has been estimated at 0.81, with a time interval of 1 to 3 years, and there is acceptable predictive validity for being educable within the military (Ross, 1988).
Results of the IQ tests performed at conscription were summed and ranked into a standard-9 scale, 1 to 9. The stanines correspond approximately to IQ test result intervals of <74, 74 to 81, 82 to 89, 90 to 95, 96 to 104, 105 to 110, 11 to 118, 119 to 126, and >126.
Outcomes
Questionnaires with items regarding type of alcohol consumed (beer, wine, or spirits), amount consumed (number of cans or bottles, or cl.), and frequency of consumption (daily, once a week, less than once a week, never) were completed during the conscription examination. Information on alcohol content at the time of examination for the different kinds of beverages was retrieved from the Swedish alcohol retailing monopoly. From the responses to these questions, grams of 100% alcohol consumed per week were estimated for each individual and distributed into 4 groups: (1) light consumers (1 to 100 g/wk), (2) moderate consumers (101 to 250 g/wk), (3) high consumers (>250 g/wk), and (4) abstainers. The rationale for this grouping is provided in a model of alcohol-consumption risk assessment by Hollstedt and Rydberg (1981), previously used by Andreasson and colleagues (1988), who have also described the calculations in detail.
Pattern of drinking was assessed from 2 questions regarding quantity of wine or spirits consumed on any 1 occasion, where drinking more than 1 bottle of wine or more than 35 cl. of spirits on a single occasion was considered binge drinking.
To obtain comparable alcohol-consumption data in the follow-up from the Swedish Survey of Living Conditions (ULF), we calculated total alcohol intake in grams of 100% alcohol consumed per week, grouped into the same 4 categories as for the conscription data: light, moderate, and high consumption, and also abstention. For the purpose of this study, we combined the groups of moderate and high consumers in the subpopulation into 1 group of high consumers (i.e., >100 g/wk).
Covariates
Childhood socioeconomic position was obtained from the National Population and Housing Census, 1960. Seven socioeconomic categories were constructed on the basis of the occupation of the head of household: (1) unskilled workers, (2) skilled workers, (3) assistant nonmanual employees, (4) nonmanual employees at intermediate level, (5) nonmanual employees at high level, (6) farmers, and (7) unclassified. Childhood socioeconomic position was treated as a categorical variable in the analysis.
From the questionnaires filled in at conscription, information about the father's drinking habits was obtained. To the question: “How often has your father consumed alcoholic beverages?” there were 4 possible responses: (1) never, (2) exceptionally, (3) sometimes, and (4) often. The conscripts were also seen by a psychologist who assessed emotional stability on a scale from 1 (lowest) to 5 (highest). This information was dichotomized with 1 to 2 on the scale being considered as low emotional stability.
Statistical Analysis
All the statistical analyses were conducted in SAS 9.3 (SAS Institute, Cary, NC). Descriptive analysis of both the outcomes and the covariates across the 9 groups based on the IQ testing generated prevalence proportions. Mean IQ test results and standard deviations were calculated. Multinomial regression analysis, univariate and multivariate, was used to investigate the association between IQ test results and reported total alcohol intake during 1 week at conscription. The association between IQ test results and reported pattern of drinking was examined using logistic regression (univariate and multivariate). IQ test result was modeled as a continuous variable for both outcomes. Multinomial regression was also used for the follow-up analyses of the subpopulation, where moderate and high consumers were pooled to increase statistical power. A sensitivity analysis was performed using the continuous measures of total alcohol intake and IQ test results, and also the ranked stanine scale.
To enable comparison of our study with a previous one, which also had male conscripts as its study population, we performed a multinomial logistic regression for IQ test score grouped into stanine 1 to 9 and frequency of consumption (Muller et al., 2013). A composite measure was created from each of the 3 items in the questionnaires completed at conscription examination concerned with frequency of drinking beer, wine, or spirits. For drinking beer and wine, the response options were as follows: (1) almost daily, (2) about once a week, (3) more seldom, and (4) never. For spirits, the options were (1) sometimes each week, (2) once a week, (3) 1 to 2 times per month, (4) more seldom, and (5) never. We collapsed the options 2 and 3 from the spirit-consumption questionnaire into one and further arranged the options to create 1 variable measuring frequency of alcohol consumption as: (1) almost daily/sometimes each week, (2) about once a week or 1 to 2 times per month (3) more seldom, and (4) never. Options 2 and 3 regarding consumption of spirits are found in Group 2, in the revised arrangement.
Results
The total study population consisted of 49,321 individuals. For total alcohol intake, information was available on all variables used in the analysis for 46,213 individuals. For pattern of drinking, the corresponding total was 47,073. The prevalence proportions across the IQ test results grouped in stanines are shown in Table1, together with mean IQ test result in stanine scores and standard deviations. In the subanalysis, 146 men were included.
Table 1.
Prevalences of Outcomes and Covariates by IQ Test Results in Stanine. Mean IQ Test Stanine and Standard Deviations Are Also Provided
| IQ test results in stanines (%) |
||||||||||
|---|---|---|---|---|---|---|---|---|---|---|
| Highest scoring | Lowest scoring | |||||||||
| 9 | 8 | 7 | 6 | 5 | 4 | 3 | 2 | 1 | Mean (SD) | |
| Total alcohol intake/wk | ||||||||||
| Light consumers | 73 | 73 | 71 | 69 | 67 | 65 | 65 | 63 | 60 | 5.49 (±2.05) |
| Moderate consumers | 14 | 16 | 18 | 20 | 21 | 22 | 21 | 20 | 18 | 5.20 (±1.97) |
| High consumer | 2 | 2 | 3 | 3 | 4 | 5 | 5 | 5 | 6 | 4.70 (±2.01) |
| Abstainer | 8 | 6 | 5 | 5 | 5 | 5 | 5 | 7 | 10 | 5.40 (±2.31) |
| Pattern of drinking | ||||||||||
| Binge | 7 | 9 | 11 | 12 | 13 | 15 | 14 | 14 | 13 | 5.06 (±1.97) |
| Nonbinge | 93 | 91 | 89 | 88 | 87 | 85 | 86 | 86 | 87 | 5.44 (±2.06) |
| SEP, head of household | ||||||||||
| Not classified | 1 | 1 | 2 | 2 | 3 | 2 | 3 | 3 | 3 | 4.92 (±2.04) |
| Unskilled worker | 18 | 21 | 26 | 31 | 36 | 39 | 44 | 46 | 48 | 4.85 (±2.01) |
| Skilled worker | 14 | 17 | 19 | 22 | 23 | 25 | 24 | 23 | 21 | 5.17 (±1.97) |
| Farmer | 9 | 9 | 10 | 10 | 11 | 12 | 13 | 13 | 17 | 5.08 (±2.11) |
| Nonmanual, high | 14 | 10 | 7 | 5 | 4 | 3 | 1 | 2 | 1 | 6.66 (±1.81) |
| Assistant nonmanual | 13 | 13 | 13 | 12 | 9 | 8 | 7 | 6 | 4 | 5.91 (±1.91 |
| Nonmanual, intermediate | 30 | 28 | 23 | 18 | 14 | 12 | 8 | 7 | 6 | 6.26 (±1.88) |
| Father's drinking habits | ||||||||||
| Never | 25 | 22 | 20 | 18 | 18 | 18 | 19 | 19 | 25 | 5.46 (±2.17) |
| Exceptionally | 44 | 46 | 44 | 46 | 46 | 44 | 44 | 44 | 41 | 5.41 (±2.04) |
| Sometimes | 26 | 27 | 30 | 29 | 29 | 31 | 29 | 28 | 26 | 5.36 (±2.02) |
| Often | 3 | 3 | 4 | 4 | 4 | 5 | 5 | 5 | 4 | 5.11 (±2.01) |
| Psychiatric symptoms at conscription | ||||||||||
| Present | 7 | 7 | 8 | 10 | 12 | 13 | 17 | 21 | 39 | 4.47 (±2.21) |
| Not present | 93 | 93 | 92 | 90 | 88 | 87 | 83 | 79 | 61 | 5.52 (±2.00) |
| Low emotional control at conscription | ||||||||||
| Present | 21 | 23 | 24 | 26 | 29 | 34 | 38 | 47 | 61 | 4.84 (±2.17) |
| Not present | 79 | 77 | 76 | 74 | 71 | 66 | 62 | 53 | 38 | 5.63 (±1.96) |
SEP, socioeconomic position.
IQ and Total Alcohol Intake
There were 2,781 abstainers, 33,526 light consumers, 9,547 moderate consumers, and 1,724 high consumers in the study population. Data on alcohol consumption were missing for 1,743 individuals. For each step decrease on the stanine scale (9 = high IQ test result, 1 = low IQ test result), the odds ratios (ORs) for being a high consumer versus a light consumer increased by 1.20 (95% confidence interval [CI] = 1.17 to 1.23). There was also a smaller but still significantly increased OR of 1.07 (95% CI = 1.06 to 1.08) per each step decrease on the stanine scale for being a moderate versus a light consumer (Table2).
Table 2.
Odds Ratios (ORs) with 95% Confidence Intervals (95% CI) Versus Being a Light Consumer, for Each Step Decrease on the Stanine Scale for Total Alcohol Intake Per Week in Groups Using Multinomial Logistic Regression Analysis. Results Are Presented Both for the Full Cohort at Time of Conscription (A) and for the Subpopulation at Conscription and at Follow-Up (B)
| Exposure: IQ test results in stanines as a continuous variable | Moderate consumers versus light consumers |
High consumers versus light consumers |
Abstainers versus light consumers |
|||
|---|---|---|---|---|---|---|
| OR | 95% CI | OR | 95% CI | OR | 95% CI | |
| (A) Full cohort (cross-sectional) crude | 1.07 | 1.06–1.08 | 1.20 | 1.17–1.23 | 1.02 | 1.00–1.04 |
| Adjusted | ||||||
| Childhood SEP | 1.08 | 1.07–1.09 | 1.22 | 1.19–1.25 | 1.02 | 1.00–1.04 |
| Psychiatric symptoms | 1.06 | 1.04–1.07 | 1.13 | 1.10–1.16 | 1.01 | 0.99–1.03 |
| Emotional stability | 1.05 | 1.04–1.06 | 1.13 | 1.10–1.06 | 1.01 | 0.99–1.03 |
| Father's alcohol habits | 1.07 | 1.06–1.08 | 1.20 | 1.17–1.23 | 1.03 | 1.01–1.05 |
| Full modela | 1.06 | 1.04–1.07 | 1.12 | 1.09–1.15 | 1.00 | 0.98–1.02 |
| (B) Subpopulation | Moderate and high consumers versus light consumers | Abstainers versus light consumers | ||||
|---|---|---|---|---|---|---|
| At age 18 (cross to sectional) | 1.38 | 1.07–1.77 | 0.99 | 0.73–1.34 | ||
| At middle age (follow to up) | 1.22 | 1.01–1.48 | 1.14 | 0.88–1.47 | ||
Adjusted for childhood socioeconomic position (SEP), psychiatric symptoms, emotional stability, and father's alcohol habits.
In the sensitivity analysis, we found that the continuous measures of total alcohol intake and IQ test result scores were correlated with −0.07, p-value < 0.001. Further, we found that for each step decrease on the stanine scale, there was an increase of 2.6 g of 100% alcohol/wk. Mean alcohol consumption in g/wk by IQ test results in stanines is shown in Fig.1, which indicates how consumption of alcohol decreases with higher IQ.
Figure 1.
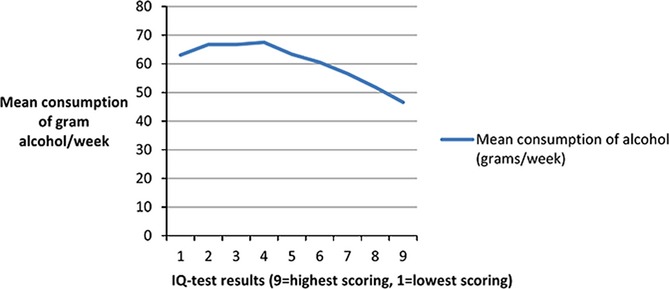
Mean consumption of grams alcohol/wk by IQ test results in stanines.
After adjusting for possible confounders, neither childhood socioeconomic position nor father's alcohol habits had an effect on the association between IQ and high consumption of alcohol. However, both psychiatric symptoms present at conscription and emotional control individually attenuated the association to OR 1.13 (95% CI 1.10 to 1.16/1.06, respectively) per each step decrease on the stanine scale (Table2).
IQ and Pattern of Drinking
There were 5,898 cases of binge drinking in the study. Data were missing on 830 individuals. The crude odds ratio for being a binge drinker increased by 1.09 (95% CI = 1.08 to 1.11) for each step decrease on the stanine scale (Table3). Adjusting individually for childhood socioeconomic position, psychiatric symptoms and emotional stability at conscription and father's alcohol habits did not attenuate this association. However, after including all covariates in the full model, the OR was lowered to 1.04 (95% CI = 1.03 to 1.06) per each step decrease on the stanine scale.
Table 3.
Odds Ratios (ORs) with 95% Confidence Intervals (95% CI) for Each Step Decrease on the Stanine Scale for Binge Drinking, Using Logistic Regression
| Exposure: IQ test results in stanines as a continuous variable | Binge drinking |
|
|---|---|---|
| OR | 95% CI | |
| Crude | 1.09 | 1.08–1.11 |
| Adjusted | ||
| Childhood SEP | 1.08 | 1.07–1.10 |
| Psychiatric symptoms | 1.07 | 1.05–1.08 |
| Emotional stability | 1.06 | 1.05–1.08 |
| Father's alcohol habits | 1.09 | 1.07–1.10 |
| Full model* | 1.04 | 1.03–1.06 |
Adjusted for childhood socioeconomic position (SEP), psychiatric symptoms, emotional stability, and father's alcohol habits.
Different Cognitive Factors and the 2 Outcomes
For the total alcohol intake outcome, the odds ratios for the logic/general intelligence, verbal ability, and technical/mechanical skills subtests did not deviate from the results for the total score of the test. However, for the visuospatial/geometric subtest, the odds ratio was lower, with an OR of 1.12 (95% CI = 1.09 to 1.15) per each step decrease on the stanine scale (Table4). For binge drinking, the odds ratios for all 4 subtests were similar to the results for the total score; for example, verbal ability had an OR of 1.07 (95% CI = 1.06 to 1.09) per each step decrease on the stanine scale (Table4).
Table 4.
Odds Ratios (ORs) with 95% Confidence Intervals (95% CI) for Each Step Decrease on the Stanine Scale for Each of the 4 Different Subtests and the 2 Different Outcomes, Using Both Multinomial and Logistic Regression
| Exposure: IQ test results in stanines as a continuous variable | Total alcohol intake |
Pattern of drinking |
||||||
|---|---|---|---|---|---|---|---|---|
| Moderate consumer versus light consumer |
High consumer versus light consumer |
Abstainers versus light consumer |
Binge drinking |
|||||
| OR | 95% CI | OR | 95% CI | OR | 95% CI | OR | 95% CI | |
| IQ test partsa | ||||||||
| A. Instructions | 1.07 | 1.06–1.08 | 1.22 | 1.19–1.25 | 1.03 | 1.01–1.05 | 1.09 | 1.07–1.10 |
| B. Concept discrimination | 1.05 | 1.04–1.06 | 1.18 | 1.15–1.21 | 1.03 | 1.01–1.05 | 1.07 | 1.06–1.09 |
| C. Paper form board | 1.04 | 1.03–1.05 | 1.12 | 1.09–1.15 | 1.04 | 1.01–1.06 | 1.07 | 1.05–1.09 |
| D. Technical comprehension | 1.09 | 1.08–1.10 | 1.20 | 1.17–1.23 | 1.00 | 0.98–1.02 | 1.10 | 1.08–1.11 |
(A) Instructions (logical inductive/verbal ability—40 items), (B) Concept discrimination (logical inductive/verbal ability—40 items), (C) Paper form board (spatial ability—25 items) and (D) Technical comprehension (technical ability—52 items).
IQ and Alcohol Consumption in Middle Age
In the analysis of the subpopulation consisting of 146 individuals, we found an increased OR of 1.22 (95% CI 1.01 to 1.48) for having a moderate or high alcohol consumption later in life, versus a light consumption, per each step decrease on the stanine scale (Table2). The estimates were marginally lowered by adjustment for previous alcohol consumption. In the subpopulation, the OR was 1.38 (95% CI 1.07 to 1.77) at the time of conscription, which is higher than in the full cohort. For comparison, we aggregated the data from conscription in the same groups as for the ULF follow-up and found an OR of 1.02 (95% CI 1.00 to 1.04) for being an abstainer versus a light consumer and an OR of 1.09 (95% CI 1.08 to 1.10) for being a moderate/high consumer versus a light consumer per each step decrease on the stanine scale.
Comparison with a Previous Study
In the analysis we performed for comparison with the earlier study by Muller and colleagues (2013), investigating the association between IQ and frequency of alcohol consumption, we used drinking-seldom group as reference group, because the never-drinking group in our case consists of both former drinkers and lifetime abstainers. Multinomial logistic regression showed that the odds ratio for drinking alcohol almost daily was 1.06 (95% CI 1.04 to 1.08), for drinking about once a week and 1 to 2 times per month 1.04 (95% CI 1.03 to 1.05), and for never drinking 1.03 (95% CI 1.01 to 1.05) versus drinking seldom per each step decrease on the stanine scale.
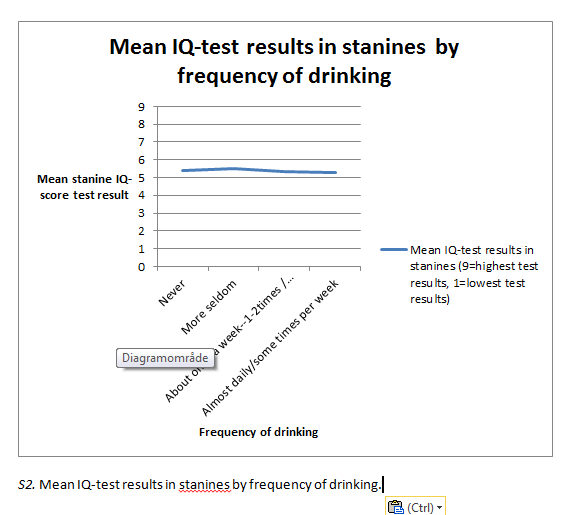
Graphs showing mean IQ test results in stanines by drinking category and frequency of drinking are found as supplementary material (Figs S1 and S2).
Discussion
This study aimed to investigate the associations of IQ test results with total alcohol intake and pattern of drinking. Further, we wanted to examine whether the association between IQ and total alcohol intake persisted into adulthood. We found an increased OR for every step decrease on the stanine scale for IQ test results for both high versus low total alcohol intake per week and, albeit to a much lesser extent, for binge drinking versus not binge drinking. When adjusting for possible confounding factors, the largest attenuations in the associations were seen for emotional stability and psychiatric symptoms present at conscription. In the analysis of a subpopulation at an older age, we found an increased odds ratio for being a moderate or high consumer of alcohol versus being a low consumer per each step decrease on the stanine scale, which indicates that the association between IQ in late adolescence and adult level of alcohol consumption persists into adulthood.
Our hypothesis in this study was that IQ test results have an inverse association with the 2 measures of alcohol consumption. The main part of the study is based on cross-sectional data, from which temporality cannot be determined. As alcohol consumption may lead to cognitive decline, caution has to be taken when interpreting the results of the study in terms of causality (Guerri and Pascual, 2010). Previous research using longitudinal data has indicated that there is an inverse association between IQ test results in adolescence and later alcohol-related morbidity and mortality (Sjolund et al., 2012). Our interpretation of the results is that they support the proposed theory that high cognitive skills augment healthy lifestyle decision making. This is one of several possible mechanisms previously suggested for the association between intelligence and health (Batty et al., 2007a). Studies using questionnaires on alcohol-related problems have, however, found a positive association (Batty et al., 2008; Hatch et al., 2007).
Our results diverge from those of previous studies. In 1 Finnish twin study, it was found that a low assessment of a twin on different measures of verbal ability in childhood in comparison with the other twin was associated with less frequent drinking and intoxication in adolescence (Latvala et al., 2014). There are similar results in an earlier study from the United States, where low cognitive ability was shown to be associated with being a nondrinker among adolescents. However, it was not shown to be associated with average number of drinks consumed per d/last 30 days. It should be noted that the authors report a skewed study population with regard to low socioeconomic position (Windle and Blane, 1989). Another twin study from the United States, found a positive association between IQ test results at age 17 and an alcohol use composite, where, for example, symptoms of alcohol abuse/dependence and average quantity consumed in the past 12 months were considered (Johnson et al., 2009).
Of particular interest to us is the study by Müller and colleagues (2013) of a cohort of Swiss conscripts which investigated the association between IQ measured at conscription and frequency of drinking alcohol, grouped into categories ranging from “nondrinking” to “daily drinking.” They found a J-shaped association between frequency of drinking and IQ test results, where the daily drinkers had the lowest IQ. A higher IQ was associated with being a rare, an occasional, and a moderate drinker, whereas there was a lower IQ for being a former drinker compared with being a lifetime abstainer. For daily drinking versus being a former drinker, a positive association was found on only 1 subscale of the IQ test (performance) (Muller et al., 2013). To compare our findings with those in Müller and colleagues (2013), we created a composite measure taking the frequencies of drinking beer, wine, and spirits into account. The estimates from that analysis were all close to 1, although there seemed to be a slightly higher OR for drinking both more and less often than drinking seldom from a decrease on the IQ test stanine scale. As drinking less often than seldom in our study includes abstinence, which is an attribute of both former drinkers and lifetime abstainers, abstainers need to be considered a special group. Excluding never drinkers from our analyses gives rise to a slightly higher OR for drinking more often per decrease on the IQ test stanine scale. Thus, it seems that the association between IQ and frequency of drinking differs between the 2 studies.
There are at least 2 theoretical explanations for the divergence of our differing results from previous research: (i) Alcohol consumption is a health behavior strongly related to certain factors (e.g., alcohol policy and social determinants) that could vary between countries (Allamani et al., 2011), resulting in differences in the associations between study populations, and (ii) differences in measures of outcome can, at least to some degree, explain differences in results.
Levels of and trends in alcohol consumption vary within the EU. Alcohol policies regarding levels of taxation, availability, and alcohol marketing can be expected to affect alcohol consumption (WHO, 2013). In Sweden, national alcohol policy has had 2 main pillars since the 1950s: high taxation and restricted access, in which a national alcohol monopoly has been instrumental (Andreasson et al., 2006; Rosen, 1989). In an international context, similar models of alcohol monopoly are found mainly in the other Nordic countries. Also, the socioeconomic patterning of alcohol consumption has been shown to differ between countries. In an international comparison by Bloomfield and colleagues (2006), Sweden displayed, in general, a similar consumption pattern as to its neighbors, Norway and Finland, with low socioeconomic differences in alcohol consumption.
Our interpretation is that given varying cultural and social conditions, the association between IQ and alcohol consumption will differ between study populations. Also, a cohort effect can be expected as our study carries information from individuals born earlier than the study populations in previously published research. Historically, in Sweden, after a period of downward sale in alcohol from the late 1970s and onward, the estimated amount of alcohol consumed rose over the years 2000 to 2011. However, further investigations are needed to support our speculative interpretation.
In comparison with previous studies, we can make some specific reflections regarding the outcomes employed. First, a composite measure of alcohol use profiting from data on a diverse set of variables may be supposed to carry more complex information, in which more aspects are taken into account, than in our more precise measures. Second, frequency of consumption does not reflect total alcohol intake or pattern of drinking (as defined by binge drinking or not). Our study is to our knowledge unique in that we were able to investigate the associations of IQ with total alcohol intake and pattern of drinking.
In our over all analysis, abstainers did not differ from light consumers of alcohol in IQ. Abstainers have previously been shown to be a special group regarding factors of sociability (low), emotional stability (low), and psychiatric diagnoses (high) (Leifman et al., 1995). In our data there was a U-form to the distribution over IQ test results regarding the prevalence proportion of abstainers. This finding suggests that the reasons for abstaining may be other than those for drinking less or more.
Further, we found that the odds ratios for the different subtests were by and large similar to the OR for the total IQ test. Only the visuospatial/geometric subtest showed a lower OR for being a high consumer in comparison with being a light consumer than the other subtests. We are not able to explain this finding by reference to any theory known to us.
The finding that emotional stability and psychiatric symptoms attenuated the association between IQ and higher levels of alcohol consumption is in line with what is known both about substance use and psychiatric comorbidity and about cognitive ability and mental health (Gale et al., 2010; Hatch et al., 2007; Marshall and Farrell, 2007).
This study is based on an almost entire national birth cohort of Swedish men, which means that selection bias is limited. Relative achievement on IQ test can be considered a longitudinally stable type of information, as it is known to vary little over time (Neisser et al., 1996). The measures of alcohol consumption carry greater uncertainty from a life-course perspective, but bear information from a time in life when the lifestyle behaviors of many are set. A strength of this study lies in the precise measures we were able to use of both our outcomes. We were also able, to a certain extent, to confirm the association at follow-up.
Our conclusion is that IQ test results completed in adolescence are inversely associated with alcohol consumption, measured as both total alcohol intake/wk and pattern of drinking in a population of Swedish males in late adolescence. We must be very careful in making any attempt to generalize our results to women, as level of consumption and pattern of drinking most probably differ in comparison with men (Wilsnack et al., 2000).
Acknowledgments
This study was supported by the Swedish Research Council for Working Life and Social Research, grant no. 2009–1611.
Supporting Information
Additional Supporting Information may be found in the online version of this article:
Mean IQ test results in stanines by drinking category.
Mean IQ test results in stanines by frequency of drinking.
References
- Ahlborg B, Linroth K, Nordgren B, Schéle R. Ett hälso- och kapacitetsundersökningssystem för personalselektion. Försvarsmedicin. 1973;1:1–17. [Google Scholar]
- Allamani A, Voller F, Decarli A, Casotto V, Pantzer K, Anderson P, Gual A, Matrai S, Elekes Z, Eisenbach-Stangl I, Schmied G, Knibbe RA, Nordlund S, Skjaelaaen O, Olsson B, Cisneros Ornberg J, Osterberg E, Karlsson T, Plant M, Miller P, Coghill N, Swiatkiewicz G, Wieczorek L, Annaheim B, Gmel G. Contextual determinants of alcohol consumption changes and preventive alcohol policies: a 12-country European study in progress. Subst Use Misuse. 2011;46:1288–1303. doi: 10.3109/10826084.2011.572942. [DOI] [PubMed] [Google Scholar]
- Andersson L, Allebeck P, Gustafsson JE, Gunnell D. Association of IQ scores and school achievement with suicide in a 40-year follow-up of a Swedish cohort. Acta Psychiatr Scand. 2008;118:99–105. doi: 10.1111/j.1600-0447.2008.01171.x. [DOI] [PubMed] [Google Scholar]
- Andreasson S, Allebeck P, Romelsjo A. Alcohol and mortality among young men: longitudinal study of Swedish conscripts. Br Med J (Clin Res Ed) 1988;296:1021–1025. doi: 10.1136/bmj.296.6628.1021. [DOI] [PMC free article] [PubMed] [Google Scholar]
- Andreasson S, Holder HD, Norstrom T, Osterberg E, Rossow I. Estimates of harm associated with changes in Swedish alcohol policy: results from past and present estimates. Addiction. 2006;101:1096–1105. doi: 10.1111/j.1360-0443.2006.01485.x. [DOI] [PubMed] [Google Scholar]
- Andreasson S, Romelsjo A, Allebeck P. Alcohol, social factors and mortality among young men. Br J Addict. 1991;86:877–887. doi: 10.1111/j.1360-0443.1991.tb01843.x. [DOI] [PubMed] [Google Scholar]
- Batty GD, Deary IJ, Gottfredson LS. Premorbid (early life) IQ and later mortality risk: systematic review. Ann Epidemiol. 2007a;17:278–288. doi: 10.1016/j.annepidem.2006.07.010. [DOI] [PubMed] [Google Scholar]
- Batty GD, Deary IJ, Macintyre S. Childhood IQ in relation to risk factors for premature mortality in middle-aged persons: the Aberdeen Children of the 1950s study. J Epidemiol Community Health. 2007b;61:241–247. doi: 10.1136/jech.2006.048215. [DOI] [PMC free article] [PubMed] [Google Scholar]
- Batty GD, Deary IJ, Schoon I, Emslie C, Hunt K, Gale CR. Childhood mental ability and adult alcohol intake and alcohol problems: the 1970 British cohort study. Am J Public Health. 2008;98:2237–2243. doi: 10.2105/AJPH.2007.109488. [DOI] [PMC free article] [PubMed] [Google Scholar]
- Batty GD, Deary IJ, Schoon I, Gale CR. Childhood mental ability in relation to food intake and physical activity in adulthood: the 1970 British Cohort Study. Pediatrics. 2007c;119:e38–e45. doi: 10.1542/peds.2006-1831. [DOI] [PubMed] [Google Scholar]
- Bloomfield K, Grittner U, Kramer S, Gmel G. Social inequalities in alcohol consumption and alcohol-related problems in the study countries of the EU concerted action ‘Gender, Culture and Alcohol Problems: a Multi-national Study. Alcohol Alcohol Suppl. 2006;41:i26–i36. doi: 10.1093/alcalc/agl073. ’. [DOI] [PubMed] [Google Scholar]
- Calvin CM, Deary IJ, Fenton C, Roberts BA, Der G, Leckenby N, Batty GD. Intelligence in youth and all-cause-mortality: systematic review with meta-analysis. Int J Epidemiol. 2011;40:626–644. doi: 10.1093/ije/dyq190. [DOI] [PMC free article] [PubMed] [Google Scholar]
- Carlstedt B. Gothenburg, Sweden: Göteborg Acta Universitatis Gothoburgensis; 2000. Cognitive Abilities—Aspects of Structure, Process and Measurement. [Google Scholar]
- Carlstedt B, Mårdberg B. Construct validity of the Swedish Enlistment Battery. Scand J Psychol. 1993;34:353–362. doi: 10.1111/j.1467-9450.2005.00432.x. [DOI] [PubMed] [Google Scholar]
- David AS, Malmberg A, Brandt L, Allebeck P, Lewis G. IQ and risk for schizophrenia: a population-based cohort study. Psychol Med. 1997;27:1311–1323. doi: 10.1017/s0033291797005680. [DOI] [PubMed] [Google Scholar]
- Deary IJ. Intelligence. Annu Rev Psychol. 2012;63:453–482. doi: 10.1146/annurev-psych-120710-100353. [DOI] [PubMed] [Google Scholar]
- Field M, Schoenmakers T, Wiers RW. Cognitive processes in alcohol binges: a review and research agenda. Curr Drug Abuse Rev. 2008;1:263–279. doi: 10.2174/1874473710801030263. [DOI] [PMC free article] [PubMed] [Google Scholar]
- Gale CR, Batty GD, Tynelius P, Deary IJ, Rasmussen F. Intelligence in early adulthood and subsequent hospitalization for mental disorders. Epidemiology. 2010;21:70–77. doi: 10.1097/EDE.0b013e3181c17da8. [DOI] [PMC free article] [PubMed] [Google Scholar]
- Gottfredson LS. An editorial with 52 signatories, history and bibliography. Intelligence. 1997;24:13–23. [Google Scholar]
- Guerri C, Pascual M. Mechanisms involved in the neurotoxic, cognitive, and neurobehavioral effects of alcohol consumption during adolescence. Alcohol. 2010;44:15–26. doi: 10.1016/j.alcohol.2009.10.003. [DOI] [PubMed] [Google Scholar]
- Gustafsson J-E. A unifying model for the structure of intellectual abilities. Intelligence. 1984;8:179–203. [Google Scholar]
- Hart CL, Taylor MD, Smith GD, Whalley LJ, Starr JM, Hole DJ, Wilson V, Deary IJ. Childhood IQ and cardiovascular disease in adulthood: prospective observational study linking the Scottish Mental Survey 1932 and the Midspan studies. Soc Sci Med. 2004;59:2131–2138. doi: 10.1016/j.socscimed.2004.03.016. [DOI] [PubMed] [Google Scholar]
- Hatch SL, Jones PB, Kuh D, Hardy R, Wadsworth ME, Richards M. Childhood cognitive ability and adult mental health in the British 1946 birth cohort. Soc Sci Med. 2007;64:2285–2296. doi: 10.1016/j.socscimed.2007.02.027. [DOI] [PMC free article] [PubMed] [Google Scholar]
- Hemmingsson T, Kriebel D, Melin B, Allebeck P, Lundberg I. How does IQ affect onset of smoking and cessation of smoking—linking the Swedish 1969 conscription cohort to the Swedish survey of living conditions. Psychosom Med. 2008;70:805–810. doi: 10.1097/PSY.0b013e31817b955f. [DOI] [PubMed] [Google Scholar]
- Hemmingsson T, v Essen J, Melin B, Allebeck P, Lundberg I. The association between cognitive ability measured at ages 18–20 and coronary heart disease in middle age among men: a prospective study using the Swedish 1969 conscription cohort. Soc Sci Med. 2007;65:1410–1419. doi: 10.1016/j.socscimed.2007.05.006. [DOI] [PubMed] [Google Scholar]
- Hollstedt C, Rydberg U. Hazardous alcohol consumption and early diagnosis of alcohol linked diseases. Läkartidningen. 1981;78:795–799. [Google Scholar]
- Johnson W, Hicks BM, McGue M, Iacono WG. How intelligence and education contribute to substance use: hints from the Minnesota Twin Family Study. Intelligence. 2009;37:613–624. doi: 10.1016/j.intell.2008.12.003. [DOI] [PMC free article] [PubMed] [Google Scholar]
- Kuntsche E, Rehm J, Gmel G. Characteristics of binge drinkers in Europe. Soc Sci Med. 2004;59:113–127. doi: 10.1016/j.socscimed.2003.10.009. [DOI] [PubMed] [Google Scholar]
- Larsson D, Hemmingsson T, Allebeck P, Lundberg I. Self-rated health and mortality among young men: what is the relation and how may it be explained? Scand J Public Health. 2002;30:259–266. doi: 10.1080/14034940210133997. [DOI] [PubMed] [Google Scholar]
- Latvala A, Rose RJ, Pulkkinen L, Dick DM, Kaprio J. Childhood verbal development and drinking behaviors from adolescence to young adulthood: a discordant twin-pair analysis. Alcohol Clin Exp Res. 2014;38:457–465. doi: 10.1111/acer.12254. [DOI] [PMC free article] [PubMed] [Google Scholar]
- Leifman H, Kuhlhorn E, Allebeck P, Andreasson S, Romelsjo A. Abstinence in late adolescence—antecedents to and covariates of a sober lifestyle and its consequences. Soc Sci Med. 1995;41:113–121. doi: 10.1016/0277-9536(94)00298-8. [DOI] [PubMed] [Google Scholar]
- Marshall EJ, Farrell M. Substance use and psychiatric comorbidity. Medicine. 2007;35:246–249. [Google Scholar]
- Martin LT, Fitzmaurice GM, Kindlon DJ, Buka SL. Cognitive performance in childhood and early adult illness: a prospective cohort study. J Epidemiol Community Health. 2004;58:674–679. doi: 10.1136/jech.2003.016444. [DOI] [PMC free article] [PubMed] [Google Scholar]
- McCambridge J, McAlaney J, Rowe R. Adult consequences of late adolescent alcohol consumption: a systematic review of cohort studies. PLoS Med. 2011;8:e1000413. doi: 10.1371/journal.pmed.1000413. [DOI] [PMC free article] [PubMed] [Google Scholar]
- Müller M, Kowalewski R, Metzler S, Stettbacher A, Rossler W, Vetter S. Associations between IQ and alcohol consumption in a population of young males: a large database analysis. Soc Psychiatry Psychiatr Epidemiol. 2013;48:1993–2005. doi: 10.1007/s00127-013-0666-2. [DOI] [PubMed] [Google Scholar]
- Neisser A, Boodoo G, Bouchard TJJ, Boykin AW, Brody N, Ceci SJ, Halpern DF, Loehlin JC, Perloff R, Sternberg RJ, Urbina S. Intelligence: knowns and unknowns. Am Psychol. 1996;51:77–101. [Google Scholar]
- Nisbett RE, Aronson J, Blair C, Dickens W, Flynn J, Halpern DF, Turkheimer E. Intelligence: new findings and theoretical developments. Am Psychol. 2012;67:130–159. doi: 10.1037/a0026699. [DOI] [PubMed] [Google Scholar]
- Otto U. Male youths. A sociopsychiatric study of a total annual population of Swedish adolescent boys. Acta Psychiatr Scand Suppl. 1976;264:1–312. [PubMed] [Google Scholar]
- Plunk AD, Syed-Mohammed H, Cavazos-Rehg P, Bierut LJ, Grucza RA. Alcohol consumption, heavy drinking, and mortality: rethinking the J-shaped curve. Alcohol Clin Exp Res. 2014;38:471–478. doi: 10.1111/acer.12250. [DOI] [PMC free article] [PubMed] [Google Scholar]
- Rehm J, Baliunas D, Borges GL, Graham K, Irving H, Kehoe T, Parry CD, Patra J, Popova S, Poznyak V, Roerecke M, Room R, Samokhvalov AV, Taylor B. The relation between different dimensions of alcohol consumption and burden of disease: an overview. Addiction. 2010;105:817–843. doi: 10.1111/j.1360-0443.2010.02899.x. [DOI] [PMC free article] [PubMed] [Google Scholar]
- Rehm J, Room R, Graham K, Monteiro M, Gmel G, Sempos CT. The relationship of average volume of alcohol consumption and patterns of drinking to burden of disease: an overview. Addiction. 2003;98:1209–1228. doi: 10.1046/j.1360-0443.2003.00467.x. [DOI] [PubMed] [Google Scholar]
- Rönnlund M, Carlsted B, Blomstedt Y, Nilsson L-G, Weinehall L. Secular trends in cognitive test performance: Swedish conscript data 1970–1993. Intelligence. 2013;40:19–24. [Google Scholar]
- Rosen M. Price and health policy in Sweden—a critical review. Health Policy. 1989;12:263–274. doi: 10.1016/0168-8510(89)90076-6. [DOI] [PubMed] [Google Scholar]
- Ross A. Umeå: Historik och beskrivning av inskrivningsproven; 1988. Den värnpliktigas prestationsförmåga vid inskrivningsprövningar i Sverige 1969–1979. [Google Scholar]
- SCB. Stockholm, Sweden: SCB; 2010. Bakgrundsfakta, Befolknings- och välfärdsstatistik 2010:4, Förändringar i Undersökningarna av levnadsförhållandena 2006–2008. En studie av jämförbarheten över tid för välfärdsindikatorerna. [Google Scholar]
- Sidorchuk A, Hemmingsson T, Romelsjö A, Allebeck P. Alcohol use in adolescence and risk of disability pension: a 39 year follow-up of a population-based conscription survey. PLoS ONE. 2012;7:e42083. doi: 10.1371/journal.pone.0042083. [DOI] [PMC free article] [PubMed] [Google Scholar]
- Sjolund S, Allebeck P, Hemmingsson T. Intelligence quotient (IQ) in adolescence and later risk of alcohol-related hospital admissions and deaths–37-year follow-up of Swedish conscripts. Addiction. 2012;107:89–97. doi: 10.1111/j.1360-0443.2011.03544.x. [DOI] [PubMed] [Google Scholar]
- Statistics Sweden. 2014. SCB (Statistics Sweden)) Available at: http://www.scb.se/sv_/Hitta-statistik/Statistik-efter-amne/Levnadsforhallanden/Levnadsforhallanden/Undersokningarna-av-levnadsforhallanden-ULFSILC/12200/Teknisk-information-om-ULFSILC/ [Online].. Accessed June 13, 2014.
- WHO. Copenhagen, Denmark: WHO; 2013. Status Report on Alcohol and Health in 35 European Countries 2013. [Google Scholar]
- Wilsnack RW, Vogeltanz ND, Wilsnack SC, Harris TR, Ahlstrom S, Bondy S, Csemy L, Ferrence R, Ferris J, Fleming J, Graham K, Greenfield T, Guyon L, Haavio-Mannila E, Kellner F, Knibbe R, Kubicka L, Loukomskaia M, Mustonen H, Nadeau L, Narusk A, Neve R, Rahav G, Spak F, Teichman M, Trocki K, Webster I, Weiss S. Gender differences in alcohol consumption and adverse drinking consequences: cross-cultural patterns. Addiction. 2000;95:251–265. doi: 10.1046/j.1360-0443.2000.95225112.x. [DOI] [PubMed] [Google Scholar]
- Windle M, Blane HT. Cognitive ability and drinking behavior in a national sample of young adults. Alcohol Clin Exp Res. 1989;13:43–48. doi: 10.1111/j.1530-0277.1989.tb00282.x. [DOI] [PubMed] [Google Scholar]
Associated Data
This section collects any data citations, data availability statements, or supplementary materials included in this article.
Supplementary Materials
Mean IQ test results in stanines by drinking category.
Mean IQ test results in stanines by frequency of drinking.