

Abstract
Neuroimaging and the neurosciences have made notable advances in sharing activation results through detailed databases, making meta-analysis of the published research faster and easier. However, the effect of publication bias in these fields has not been previously addressed or accounted for in the developed meta-analytic methods. In this article, we examine publication bias in functional magnetic resonance imaging (fMRI) for tasks involving working memory in the frontal lobes (Brodmann Areas 4, 6, 8, 9, 10, 37, 45, 46, and 47). Seventy-four studies were selected from the literature and the effect of publication bias was examined using a number of regression-based techniques. Pearson’s r correlation coefficient and Cohen’s d effect size estimates were computed for the activation in each study and compared to the study sample size using Egger’s regression, Macaskill’s regression, and the ‘Trim and Fill’ method. Evidence for publication bias was identified in this body of literature (p<0.01 for each test), generally, though was neither task- nor sub-region-dependent. While we focused our analysis on this subgroup of brain mapping studies, we believe our findings generalize to the brain imaging literature as a whole and databases seeking to curate their collective results. While neuroimaging databases of summary effects are of enormous value to the community, the potential publication bias should be considered when performing meta-analyses based on database contents.
Keywords: Brain imaging, fMRI, databases, Meta-analysis, Publication bias
Introduction
In recent years meta-analyses have become increasingly popular in neuroimaging as large databases of structural and functional brain imaging data have been created and employed to aggregate results from across individual studies (Murphy, Nimmo-Smith et al. 2003; Neumann, von Cramon et al. 2008; Fusar-Poli, Placentino et al. 2009). Meta-analytic methods to examine these data have become increasingly refined (Turkeltaub, Eden et al. 2002), and these techniques are rapidly becoming particularly important tools for understanding fundamental questions underlying patterns of cognitively induced activity.
The development of highly detailed neuroimaging databases of published results has made quantitative assessment of the available research much easier (Fox, Laird et al. 2005), and the ability to pool studies and sample sizes to make inferences about functional brain activity has become increasingly valuable in diagnostics (Peyron, Laurent et al. 2000). These resources provide a useful means for combining the results of studies in specific research domains and have offered a unique solution for examining variation in reported activation foci (Nielsen and Hansen 2002).
However, while meta-analyses of functional imaging studies may provide invaluable insights, caution must be taken due to the potential for bias in the current literature, especially, as is common in functional magnetic resonance imaging (fMRI) research, where the published results are primarily small-study effects (Sterne, Gavaghan et al. 2000). Since recruitment of subjects is often demanding and having a large sample can be costly, many individual neuroimaging studies have small sample sizes, particularly in many fMRI studies. This practice has been defended by Friston et al. (1999), who have argued that fixed-effects analyses are adequately serviced through voxel-wise general linear models and conjunction-based analyses based upon samples of at least 6 subjects, whereas only experiments comparing two or more samples require random-effect analyses and necessarily larger cohort sample sizes. While such assertions seek to justify using small samples for cognitive activation studies in light of sufficient sensitivity, they have produced the somewhat unintended consequence of researchers tending to publish statistically significant brain activation findings merely based on low sample sizes. This can result in a particular form of ‘publication bias’ present in the literature which can severely hamper subsequent meta-analytic assessments from neuroimaging summary data archives containing reported statistical effects.
Generally speaking, publication bias is the tendency of researchers, journal editors, and corporate entities to manage the reporting of experimental findings that are positive (i.e. “significant” findings) differently from findings that are negative (i.e. supporting the null hypothesis) or are otherwise inconclusive (Dickersin 1990). This then leads to bias in the overall published literature toward only those effects considered to be statistically significant. Such bias can occur despite the fact that studies with significant results may not appear to be superior to studies having null results with respect to quality of design (Easterbrook PJ, Berlin JA et al. 1991). Statistically significant results are three times more likely to be published than papers affirming a null result (Dickersin, Min et al. 1992; Dickersin 1997). Typical reasons for non-publication of non-findings has been attributed to loss of interest in the study in question by the researcher once a null effect has been observed (Hopewell, Loudon et al. 2009). However, not reporting negative effects can bias true average statistical effect sizes and mask particular trends present across studies over time (Schooler 2011). The reporting of only statistically significant findings can be traced to the pressures due to academic career trajectories, the need to secure research funding, and concerns about being considered a top scientist (Fanelli 2010). Often these pressures may force researchers to publish statistically significant results as soon as they have them, despite their study having a low sample size (Rucker, Carpenter et al. 2011). Journal editors and reviewers may also prefer publishing articles reporting statistically significant results (Matias-Guiu and Garcia-Ramos 2011) while studies reporting null findings may be rejected or deferred to another periodical. Collectively, these influences toward publishing positive effects while demurring on those that are not contributes to publication bias in the literature. Evidence for publication bias has been observed across a range of disciplines (Awad 2010; Saeed, Paulson et al. 2010; Polyzos, Valachis et al. 2011; Zhu, Duijvesz et al. 2011) and the field of neuroimaging is likely no different. Moreover, given the interest in gathering the summary data from neuroimaging studies of cognitive activation task paradigms into various shared databases (Van Horn and Gazzaniga 2002; Van Horn, Grafton et al. 2004), there is a danger that publication bias has been embedded in these archives which may, in turn, affect their subsequent usage in meta-analytic assessments of activation patterns, regional involvement in cognitive systems, comparisons between diagnostic groups, etc. The characterization of publication bias is therefore a necessary and important consideration for the neuroimaging literature and its summary data archives.
In this article, we seek to explore the notion of publication bias, present several analytic means for assessing publication bias from a meta-analytic treatment of study summary information, measure the evidence for publication bias in the neuroimaging literature as contained in a representative archive of study meta-data, and provide a comment on the importance of assessing the potential for publication bias in shared neuroimaging results resources and meta-analyses that use them.
Assessment of Publication Bias in Neuroimaging
Irrespective of sample size, per se, the failure to report non-significant findings in any field of study is typically known as the ‘file-drawer’ effect (Rosenthal 1979). This occurs because authors are less likely to submit, and editors accept, negative results or non-statistically significant findings, causing such studies to go unpublished (‘left in the file drawer’). While this practice might seem reasonable, it can lead to erroneous measures of mean effect sizes when independently combining statistical results from the published literature under meta-analysis (Scargle 2000). In an extreme case the literature may contain only the 5% of studies which obtained a significant p<0.05 result by chance alone, with the remaining 95% of non-significant studies unavailable for meta-analytic consideration.
Conversely, as noted above, ‘publication bias’ is the tendency to publish only significant results despite having a low sample size. While it can be challenging to determine the true number of non-significant studies that might exist which would render those that are published only representative of chance occurrence (Scargle 2000), a number of useful statistical techniques for examining publication bias have been proposed. Each method has its own benefits as well as some limitations (Hayashino, Noguchi et al. 2005; Kromrey 2006) but can be helpful for examining not only a specific meta-analytic set of studies but also of potential use in evaluating entire databases of published results. Several of the most prominent approaches are described here:
The Funnel Plot
Publication bias can be examined by visual inspection of a funnel plot (Light and Pillemer 1984). This graphical technique plots the effect size (in our case, Pearson’s r or Cohen’s d values) by sample size, and allows the observer to determine the existence of publication bias by the symmetry or lack thereof in the generated graph. If publication bias is not present, then the points should form a symmetrical inverted funnel around the overall estimate of the effect, with results from smaller studies scattered more widely about the mean effect at the bottom of the graph (see Deeks, Macaskill et al. 2005 for examples). If, however, publication bias is present then the graph may be asymmetrical or skewed. A ‘classic’ asymmetry involves non-publication of insignificant studies which causes gaps in the bottom left-hand corner of the graph and leaves the plot skewed to the right. Though this method is used frequently in the literature, it is a subjective test and is not always interpreted consistently among different observers (Terrin, Schmid et al. 2005). While it is a useful tool, it is also necessary to use more systematic tests that have been developed for detection of publication bias.
Macaskill’s Regression
A method which draws on the idea of the funnel plot more systematically is Macaskill’s regression method, also known as the funnel plot regression method (Macaskill, Walter et al. 2001). This linear regression model takes the effect size as the dependent variable and sample size as the independent, or predictor, variable. A weighted least squares regression approach is taken and the effect size is weighted by the inverse variance. This method is often employed due to its low false-positive rate and an outcome giving a significant p-value indicates the presence of publication bias.
Trim and Fill
Another metric based on the funnel plot is the trim and fill method (Duval and Tweedie 2000). This is a non-parametric approach which assumes that in addition to the number of published studies (n), there are another k0 studies which have not been reported due to publication bias. This method ranks studies based on the absolute values of their deviations from the mean effect size; ranks of studies with effect sizes smaller than the mean are given a negative sign, and ranks of studies with effect sizes greater than the mean retain a positive sign. Mathematically the ranks are estimated by:
with a negative sign given to the ri where ai <āi
γ*, the length of the rightmost run of ranks associated with positive values of the observed ri, is defined as:
where n= number of studies in the meta-analysis and rh is the largest negative rank in the sample. And k0 is estimated by R0, the “rightmost run” estimator, where:
R0 is the sample estimate of k0, the number of studies which have not been reported due to publication bias. Subsequently, publication bias is evident when R0>3, as outlined by Duval and Tweedie (2000).
Egger Regression
This approach also utilizes a linear regression model to estimate funnel plot asymmetry using a standardized measure of effect (e.g. Cohen’s d). The treatment effect is standardized by dividing by its standard error and regressed against precision, defined as the inverse of the standard error, as the predictor (Egger, Davey Smith et al. 1997). If the resulting value yields a significant p-value, then this test indicates the presence of publication bias in the collection of studies. While the Egger method has been shown to be highly sensitive with strong statistical power (Sterne, Gavaghan et al. 2000), it also tends to have a relatively high false positive rate, although it can be subject to low power when meta-analytically examining results from only small numbers of studies (Peters, Sutton et al. 2006).
Begg’s Rank Correlation
Begg’s method is an adjusted rank correlation test proposed as a technique for identifying publication bias in a meta-analysis of random-effects study results. The test statistic is a direct statistical analogue of the popular “funnel-graph.” The number of component studies in the meta-analysis, the nature of the selection mechanism, the range of variances of the effect size estimates, and the true underlying effect size are all observed to be influential in determining the power of the test. The test has been shown to be fairly powerful for large meta-analyses (n>75 studies), but possesses only moderate power for smaller meta-analyses (n<25 studies) (Begg and Mazumdar 1994). The test must be interpreted with caution in small meta-analyses and bias cannot be ruled out if the test is not significant.
To explore the presence of publication bias in the reported neuroimaging literature, we examined papers described in the BrainMap (http://www.brainmap.org) database which is a leading online database of published functional neuroimaging (fMRI and PET) experiments with coordinate-based (x,y,z) activation locations in Talairach space (Fox and Lancaster 2002; Laird, Lancaster et al. 2005). This resource is particularly valuable for such an examination as each study has been published in peer-reviewed journals and whose articles, in many instances, contain the necessary information concerning the statistical test of interest, its magnitude, and the sample size upon which the statistics were performed. In what follows, we describe our approach to study selection/exclusion from this analysis.
Methods
To select studies for inclusion, we used the Sleuth program (http://www.brainmap.org/sleuth/index.html), the BrainMap application that is used to search for papers of interest and read their corresponding meta-data, to find the appropriate studies for our analysis. To narrow down the range of studies we focused our analysis on studies reporting working memory tasks with activation in the frontal lobe using fMRI; searching on keywords “fMRI”, “working memory”, and “frontal lobe” selected 162 papers from the database. The body of literature on working memory in the frontal lobe is extensive, as it has been a central region of study for many years, yielding a rich collection of published research articles. Though the analysis could have been performed on any and all brain regions of interest, in any cognitive domain, effects of working memory in the frontal lobe are studied extensively by researchers focusing on many different fields, including cognitive neuroscience, psychology, and psychiatry, and are applicable to a wide audience. In addition, focusing the analysis on one extensive brain region, one functional domain, in normal subjects allowed for a less heterogeneous collection of studies. While this sample was not completely homogeneous, it represents well the collection of studies which would be formed when performing any meta-analyses on the published literature.
After examining these papers, 77 were selected that gave both a statistical parametric image (SPI) value and an SPI unit (e.g. Z-statistic or Student’s t-test), so that significance and effect size could be estimated. Of the selected 77, only 74 (Fitzgerald 2008, Kim 2003, & Malhi 2007 were excluded) were included that had a working memory task using fMRI on a normal control population. In studies where there were two or more additional groups being compared to control subjects, we utilized only effects reported for the normal subject sample. Articles listed by BrainMap in which insufficient meta-data information was available about their reported effects these studies were omitted from consideration. The effects reported in the frontal lobe were examined and the highest z or t value reported for frontal lobe activity on Sleuth was recorded. For each study, this peak reported focus of activation was noted to characterize the frontal activity for the given study. Studies will routinely report a list of significant effects, however, it is often this most robust effect which confirms the author’s hypotheses pertaining to cognitively-induced regional activation, forms the motivation for examining subsequent effects, or is the main impetus for the interpretation of the results. From this statistically maximal locus of activity, examining a range of secondary activations and multiple statistical contrasts are then justified by study authors in order to explore ever-more subtle experimental distinctions in activation. In this analysis, secondary effects beyond the maximum test statistic were not considered. Tests of publication bias were examined using these largest reported within study statistical effects alone, under our assumption that this was the generally most appropriate means for the consideration of overall publication bias across studies.
Of 74 papers, 68 showed significant results in frontal lobe regions and 6 recorded working memory tasks with non-significant results in the frontal lobe (Figure 1). We took care not to exclude studies of working memory reported in BrainMap which nevertheless failed tp report significant statistical results in the frontal lobes. In most studies, the z-statistic or student’s t-statistic was typically only given for significant effects, as it is uncommon to report statistically non-significant findings which, in fact, were the motivation for this analysis. Therefore, 6 studies examined a main effect of their working memory task though did not report a test statistic with corresponding MNI or Talairach coordinates. Since these studies were specifically exploring working memory tasks, were reported by BrainMap under those categories, but reported no statistically significant activation in the frontal lobes their effect sizes were set to 0, representing no task associated effect. The true effect sizes could most certainly be higher than this value, but without further details (which were not provided in the published studies and, thus, by BrainMap) there was no way to quantify this except for setting these to null values. We considered this the most conservative approach since all 6 non-significant studies also reported significant secondary tasks in working memory among normal subjects in the frontal lobe, though these were not selected for analysis (Sevostianov et al. 2002; Landau et al. 2004; Malisza et al. 2005; Baumann et al. 2007; Sowell et al. 2007; Shamosh et al. 2008). The z values and t values were converted to a Pearson’s r effect size as well as Cohen’s d effect size (Cohen 1988), and these were used to examine publication bias. A summary of the studies retained for this analysis is given in Table 1.
Figure 1.

Results for studies, plotted on a standard glass brain in Talairach space using BrainMap, showing each reported study local maxima located in the frontal lobes (n=68).
Table 1.
| First Author | Year | Sample Size (n) | Percent Male | Age mean (min, max) | MNI (x, y, z) | Talairach (x, y, z) | SPI value | SPI unit | r | d | g | Brodmann Area |
|---|---|---|---|---|---|---|---|---|---|---|---|---|
| Altamura | 2007 | 18 | 0.61 | 27 | (7, 17, 48) | (4.9, 9.9, 48.5) | 8 | z | 0.99 | 12.43 | 12.08 | 6 |
| Audoin | 2005 | 18 | . | 25 | (−19, 10, 63) | (−19.6, −1.1, 65.9) | 4 | t | 0.70 | 1.94 | 1.89 | 6 |
| Baumann | 2007 | 13 | 0.54 | 25 (20, 28) | . | . | . | . | 0 | 0 | 0 | . |
| Bedwell | 2005 | 14 | 0.57 | 29 (22, 40) | (−55, 4, 37) | (−52.9, −3, 39.5) | 8.03 | t | 0.91 | 4.45 | 4.29 | 6 |
| Beneventi | 2007 | 12 | 0.50 | (21, 29) | (0, 21, 43) | (−1.5, 14.1, 44.3) | 6.53 | z | 0.99 | 13.10 | 12.54 | 6 |
| Braver | 1997 | 8 | 0.75 | (18, 25) | (37, 37, 33) | (37, 37, 33) | 5.24 | z | 0.99 | 13.46 | 12.59 | 9 |
| Breitenstein | 2005 | 14 | 0.57 | (19, 26) | (36, 27, −6) | (32.8, 24.7, 2.2) | 4.31 | z | 0.86 | 3.39 | 3.27 | 47 |
| Bunge | 2001 | 16 | 0.81 | 27 (18, 40) | (−42, −2, 32) | (−40.3, −6.2, 31.8) | 3.76 | z | 0.77 | 2.38 | 2.31 | 6 |
| Cabeza | 2002 | 20 | 0.65 | 23 | (−45, 0, 36) | (−43.6, −6.7, 38.1) | 7.8 | t | 0.87 | 3.58 | 3.49 | 6 |
| Cairo | 2004 | 18 | 0.44 | 28 (18, 35) | (−12, 2, 56) | (−12.8, −4.7, 54.1) | 7.02 | z | 0.97 | 7.92 | 7.70 | 6 |
| Caldwell | 2005 | 8 | 1.00 | 36 (30, 43) | (−48, 20, 0) | (−45.4, 17.1, 5.1) | 19.46 | t | 0.99 | 14.71 | 13.76 | 45 |
| Chang | 2004 | 10 | 1.00 | 14 (10, 17) | (4, 24, 44) | (2.2, 14.9, 49.9) | 4.37 | z | 0.93 | 5.17 | 4.90 | 8 |
| Chen | 2004 | 8 | 1.00 | 28 | (−50, 0, 32) | (−48.1, −3.4, 31.8) | 6 | t | 0.91 | 4.54 | 4.24 | 6 |
| Cohen | 1994 | 12 | 0.58 | (20, 29) | (−36, 33, 13) | (−36, 33, 13) | 7.2 | t | 0.91 | 4.34 | 4.16 | 46 |
| Cohen | 1997 | 10 | 0.50 | (18, 34) | (37, 32, 30) | (37, 32, 30) | 3.82 | z | 0.89 | 3.84 | 3.65 | 9 |
| Cross | 2007 | 27 | 0.59 | 21 | (−10, −2, 56) | (−10.9, −8.5, 53.7) | 4.16 | t | 0.63 | 1.63 | 1.60 | 6 |
| Deckersbach | 2008 | 17 | 0.00 | 26 | (−46, −4, 42) | (−44.1, −8.9, 40.5) | 4.39 | z | 0.82 | 2.91 | 2.82 | 4 |
| Desmond | 2003 | 13 | 1.00 | 56 | (0, 7, 64) | (−1.8, −4.2, 66.8) | 4.07 | z | 0.85 | 3.28 | 3.16 | 6 |
| Dohnel | 2008 | 16 | 0.50 | 61 | (9, 38, 31) | (7, 30.9, 35.3) | 4.61 | z | 0.86 | 3.37 | 3.26 | 6 |
| Dolcos | 2006 | 15 | 0.00 | 22 (18, 31) | (46, 38, 22) | (46, 38, 22) | 9.6 | t | 0.93 | 5.13 | 4.96 | 46 |
| Frangou | 2008 | 7 | 0.29 | 39 | (52, 12, 40) | (46.7, 5.7, 41.6) | 17.52 | t | 0.99 | 14.31 | 13.24 | 6 |
| Grosbras | 2001 | 10 | 0.00 | (22, 30) | (−32, −8, 64) | (−31.4, −14.6, 60) | 10.63 | z | 0.999 | 1014.97 | 962.89 | 6 |
| Gruber | 2010 | 18 | 0.39 | 34 | (−48, −4, 44) | (−46, −9.1, 42.3) | 7 | t | 0.86 | 3.40 | 3.30 | 4 |
| Hamilton | 2009 | 38 | 0.61 | 33 (18, 64) | (50, 28, 28) | (46.3, 23.5, 30.4) | 7.62 | z | 0.88 | 3.77 | 3.72 | 9 |
| Harvey | 2005 | 10 | 0.50 | 29 (18, 42) | (−45, 18, 21) | (−42.9, 13.4, 23.7) | 10.91 | t | 0.96 | 7.27 | 6.90 | 10 |
| Hautzel | 2002 | 17 | 1.00 | 26 | (−48, 8, 28) | (−45.8, 3.5, 29.1) | 17.19 | t | 0.97 | 8.60 | 8.34 | 9 |
| Heide | 2001 | 6 | . | (27, 41) | (−48, −4, 40) | (−45.9, −8.8, 38.7) | 7.39 | z | 0.999 | 455.82 | 416.10 | 6 |
| Jeong | 2005 | 10 | 0.20 | 30 (16, 45) | (−27, −21, 54) | (−25, −29.4, 52.8) | 3.38 | z | 0.84 | 3.06 | 2.90 | 4 |
| Johnson | 2006 | 18 | 0.83 | 37 | (−50, 2, 44) | (−48.3, −5.9, 46) | 4.9 | t | 0.77 | 2.38 | 2.31 | 4 |
| Kanayama | 2004 | 10 | 0.60 | 28 | (54, 20, 32) | (48.6, 13.8, 35.2) | 6.66 | t | 0.91 | 4.44 | 4.21 | 9 |
| Kirschen | 2005 | 16 | 0.44 | 25 | (−63.4, 4.6, 14.5) | (−60.5, 0.9, 17.7) | 4.25 | z | 0.82 | 2.91 | 2.82 | 6 |
| Koch | 2007 | 13 | 0.62 | 27 | (42, 25, 34) | (37.8, 17, 41) | 8.51 | t | 0.93 | 4.91 | 4.72 | 8 |
| Koch | 2007 | 40 | 0.53 | 31.5 | (−6, 30, 56) | (−7.2, 21.3, 56.6) | 6.02 | t | 0.69 | 1.93 | 1.90 | 6 |
| Koppelstaetter | 2008 | 15 | 1.00 | (25, 47) | (−40, 32, 17) | (−38.6, 26.6, 24.3) | 16.61 | t | 0.98 | 8.88 | 8.58 | 46 |
| Koshino | 2008 | 11 | 0.91 | 29 (18, 40) | (−36, 4, 30) | (−34.7, −0.5, 30.7) | 13.44 | t | 0.97 | 8.50 | 8.10 | 6 |
| Kumari | 2006 | 13 | 1.00 | 33 (18, 55) | (36, 8, 46) | (31.8, 1.5, 46.4) | 7.34 | t | 0.90 | 4.24 | 4.07 | 6 |
| Lagopoulos | 2007 | 10 | 0.00 | 32 (20, 54) | (46, 24, −2) | (41.6, 20.6, 5.1) | 6.07 | z | 0.99 | 14.64 | 13.89 | 45 |
| Landau | 2004 | 10 | . | (22, 27) | . | . | . | . | 0 | 0 | 0 | . |
| LoPresti | 2008 | 19 | 0.32 | 23 (20, 26) | (−46, 26, −6) | (−43.5, 23.2, 0.3) | 7.84 | t | 0.88 | 3.70 | 3.60 | 47 |
| Malisza | 2005 | 14 | 0.57 | . | . | . | . | . | 0 | 0 | 0 | . |
| Matsuo | 2007 | 15 | 0.40 | 38 | (−30, 0, 46) | (−29.6, −3.4, 44.5) | 6.23 | z | 0.97 | 7.39 | 7.14 | 6 |
| Meisenzahl | 2006 | 12 | 0.92 | 34 (22, 48) | (48, 11, 23) | (43.6, 5.2, 28.5) | 8.34 | t | 0.93 | 5.03 | 4.82 | 9 |
| Mendrek | 2004 | 8 | 0.75 | 28 | (48, 8, 32) | (34, 2.7, 34.1) | 5.88 | z | 0.99 | 22.52 | 21.06 | 6 |
| Mendrek | 2005 | 12 | 0.75 | 28 | (−44, −4, 36) | (−42.2, −8.4, 35.2) | 5.27 | z | 0.96 | 6.46 | 6.18 | 6 |
| Mu | 2005 | 10 | 1.00 | 28 | (−56, 14, 30) | (−53.2, 8.9, 31.3) | 11.72 | t | 0.97 | 7.81 | 7.41 | 9 |
| Mu | 2005 | 33 | 1.00 | 29 (18, 45) | (−48, 2, 24) | (−45.7, −1.8, 25) | 9.47 | t | 0.86 | 3.35 | 3.30 | 9 |
| Neuner | 2007 | 15 | 1.00 | 33 | (−42, 6, 30) | (−40.2, 1.4, 30.8) | 6.5 | z | 0.97 | 8.42 | 8.13 | 6 |
| Nystrom | 2000 | 8 | 0.75 | 22 (18, 25) | (47, 33, 18) | (47, 33, 18) | 2.65 | z | 0.79 | 2.55 | 2.38 | 46 |
| Petit | 1998 | 5 | 1.00 | (21, 27) | (18, 4, 48) | (18, 4, 48) | 4.3 | z | 0.99 | 19.78 | 17.69 | 6 |
| Pochon | 2001 | 8 | 0.50 | (20, 25) | (27, 3, 51) | (23.4, −3.5, 50.3) | 3.88 | z | 0.94 | 5.28 | 4.94 | 6 |
| Pochon | 2002 | 6 | 0.67 | (18, 30) | (−39, 54, 12) | (−37.1, 47.7, 19) | 6.35 | t | 0.94 | 5.68 | 5.18 | 10 |
| Prado | 2007 | 20 | 0.35 | 21 (19, 26) | (45, 16, 27) | (40.7, 9.4, 33.1) | 5.89 | z | 0.91 | 4.36 | 4.25 | 9 |
| Quintana | 2003 | 8 | 0.75 | 29 | (−50, 14, 0) | (−50, 14, 0) | 7.14 | z | 0.999 | 72.90 | 68.20 | . |
| Ragland | 2002 | 11 | 0.55 | 32 (21, 53) | (36, 18, 28) | (36, 18, 28) | 5.1 | z | 0.96 | 6.73 | 6.42 | 9 |
| Ragland | 2004 | 15 | 0.60 | 28 | (−48, 18, 28) | (−48, 18, 28) | 3.8 | z | 0.79 | 2.56 | 2.47 | 9 |
| Ricciardi | 2006 | 6 | 1.00 | 28 | (0, 4, 52) | (0, 4, 52) | 7 | z | 0.999 | 260.05 | 237.39 | 6 |
| Rowe | 2000 | 6 | 0.83 | (24, 34) | (−22, 8, 60) | (−22.1, 0.6, 58) | 6.42 | t | 0.94 | 5.74 | 5.24 | 6 |
| Rypma | 1999 | 6 | 0.33 | 25 | (−52, 1, 32) | (−52, 1, 32) | 3.28 | z | 0.94 | 5.37 | 4.90 | 6 |
| Rypma | 2001 | 6 | 0.33 | 25 (22, 29) | (25, 53, 1) | (25, 53, 1) | 4.07 | z | 0.98 | 9.98 | 9.11 | 10 |
| Sanchez-Carrion | 2008 | 14 | 0.79 | 24 | (24, 4, 62) | (20.5, −3.6, 60.1) | 16.67 | t | 0.98 | 9.25 | 8.91 | 6 |
| Schmidt | 2009 | 25 | 1.00 | 34 | (26, 12, 54) | (22.4, 4.6, 53.7) | 8.37 | t | 0.86 | 3.42 | 3.35 | 6 |
| Sevostianov | 2002 | 14 | 0.57 | (19, 44) | . | . | . | . | 0 | 0 | 0 | . |
| Shamosh | 2008 | 103 | 0.43 | 23 (18, 40) | . | . | . | . | 0 | 0 | 0 | . |
| Sheridan | 2007 | 10 | 0.00 | 15 (12, 17) | (30, 38, 16) | (26.6, 32.1, 22.2) | 5.97 | t | 0.89 | 3.98 | 3.78 | 9 |
| Shikata | 2003 | 9 | 0.56 | 27 | (−30, −12, 57) | (−29.5, −17.8, 53.4) | 4.14 | z | 0.93 | 5.24 | 4.94 | 6 |
| Simmons | 2005 | 9 | 0.33 | (18, 45) | (−21, 33, −18) | (−20.2, 30.6, −9.4) | 6.6 | t | 0.92 | 4.67 | 4.40 | 47 |
| Smith | 2006 | 10 | 0.00 | 57 (50, 60) | (−5, 14, 47) | (−6.2, 7.2, 47.2) | 5.74 | z | 0.99 | 11.73 | 11.13 | 37 |
| Sowell | 2007 | 16 | 0.4375 | 11 (7, 15) | . | . | . | . | 0 | 0 | 0 | . |
| Tan | 2006 | 26 | 0.69 | 32 | (44, 23, 27) | (39.4, 17.1, 30.9) | 2.81 | z | 0.50 | 1.16 | 1.14 | 9 |
| Veltman | 2003 | 22 | 0.32 | 23 | (−51, 12, 36) | (−48.6, 6.5, 36.5) | 5.7 | z | 0.88 | 3.68 | 3.60 | 9 |
| Vinogradov | 2008 | 8 | 0.50 | 28 (25, 33) | (−10, 48, 18) | (−10.5, 41.5, 28) | 4.5 | z | 0.97 | 7.90 | 7.39 | 9 |
| Volle | 2005 | 11 | 0.64 | 28 (22, 34) | (−33, −3, 60) | (−32.3, −9.6, 56.9) | 3.69 | z | 0.85 | 3.25 | 3.10 | 6 |
| Walter | 2007 | 17 | . | 27 | (−51, 3, 36) | (−48.6, −1.9, 35.7) | 5.04 | z | 0.88 | 3.76 | 3.65 | 6 |
| Yoo | 2005 | 10 | 0.80 | 23 (20, 30) | (30, 14, 53) | (26.2, 6.5, 53.1) | 4.07 | z | 0.91 | 4.39 | 4.17 | 6 |
Descriptive statistics of each study (n=74), the corresponding SPI value, unit, and corresponding Pearson’s r (used for plotting), and Cohen’s d value used to assess publication bias. Hedge’s g estimates are provided for reference.
Results
Pearson’s r
Pearson’s r measure of effect size was computed in addition to Cohen’s d because upon conversion of the z-scores some of the Cohen’s d values were found to be particularly large (e.g., Grosbas et al., d=1014.97), leading to a number of extreme outlier values. Analyses were performed on the Cohen’s d variable, but the results were also examined both with and without the four main extreme effect size values to avoid having them drive the analysis. Additionally, for a visual assessment of publication bias, we plotted the effect sizes (r or d) against the total sample size (n) for each study and examined the resulting funnel plot. Since it was the most easily viewable effect size metric, we present Pearson’s r effect by sample size here for all studies (n=74), noting considerable evidence of publication bias even by mere visual inspection of the funnel plot alone (Figure 2). Even when a true effect is present, it is expected that some small studies will show non-significant results due to lack of power, corresponding to points in the lower left portion of the plot, and the absence of such points lends to the conclusion that publication bias is present here.
Figure 2.
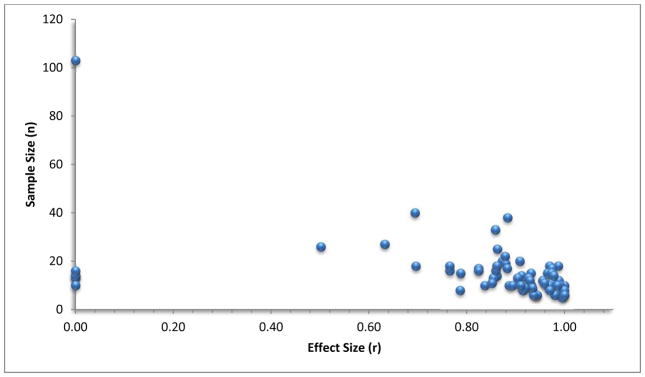
Funnel plot of Pearson’s r by sample size for each study (n=74). This funnel plot shows the ‘classic’ funnel plot asymmetry, with small, non-significant studies absent in the available research.
Cohen’s d
In general, a “small” Cohen’s d effect size is between 0.2 and 0.3, “medium” is around 0.5, and “large” is greater than or equal to 0.8 (Cohen 1988). While these terms are relative, they are used in common convention and supply a rough overview of the findings. Of the studies that showed an effect (n=68), all had a Cohen’s d value of >1, and were therefore “large”. While an arbitrary cut-off, we considered any Cohen’s d value greater than the 95th percentile (values ≥ 72.9) to be an extreme value since the majority of our data (64/68 = 94.1%) fell within a Cohen’s d value where: 1<d <25. While we were able to calculate Cohen’s d effect sizes from the given t-statistic or z-statistic, the effect size variance was not given for each study in the database and was estimated. Methods examining the Cohen’s d effect size with the extreme values included (n=74, evaluating a total of 1106 subjects) found statistically significant publication bias using the Egger regression method (F=6.7, p=0.01), Macaskill’s regression method (F=12.07, p=0.0009), and the Trim and Fill method (both tails, R0>3). Visual inspection of the funnel plot was hindered by the presence of four extreme values, which are plotted here for reference (Figure 3 Inset).
Figure 3.

Funnel plot of Cohen’s d by sample size for studies without extreme values (n= 70). While a ‘large’ Cohen’s d value is usually d >0.8, most of our values are between 1 and 25, with funnel plot asymmetry due to the heavy right-tail evident here. Figure 3 Inset: Funnel plot of Cohen’s d by sample size for each study (n=74), showing the four extreme outlier values.
To further examine possible publication bias, we did a second analysis based on Cohen’s d in which the four extreme values were removed (Grosbas 2001, d=1014.97; Heide 2001, d=455.82; Quintana 2003, d=72.9; Ricciardi 2006, d=260.05), with publication bias analyses performed on the remaining studies. Methods examining the Cohen’s d effect size without extreme values (n=70, evaluating the contributions from a total of 1076 subjects) found evidence of statistically significant publication bias using the Egger regression method (F=8.17, p=0.006), Macaskill’s regression method (F=9.92, p=0.002), the Trim and Fill method (right tail, R0>3), as well as being evident by inspection of the funnel plot (Figure 3). Though we omitted the four extreme observations, the observation that these four points had extreme effect sizes with very small sample sizes (all n≤10) only strengthen the evidence of publication bias noticeable by an obvious right-tailed bias. As Begg’s method is a non-parametric approach specifically designed for assessing random effects tests between distinct groups, it was not employed in our analysis of fixed effects activation studies.
Structural and Behavioral Domains
We also divided the studies and examined publication bias according to Brodmann Area as well as by cognitive/behavioral domain and found that publication bias was present in all sub-groups. Examination of publication bias by Brodmann Area was performed using the same metrics outlined previously to determine if one or more regions specifically studied in fMRI was driving the overall presence of publication bias. Briefly, the most commonly reported areas were BA6 (n=33) and BA9 (n=15). Other areas of activity included BA4 (n=4), BA8 (n=2), BA10 (n=3), BA37 (n=1), BA45 (n=2), BA46 (n=4), BA47 (n=3), and unreported or non-significant BA (n=7) for a total N=26. Analyses were carried out by examining the presence of publication bias in BA6, BA9, and in the ‘other’ regions (due to the low numbers of studies reporting these sub-regions). In the examination of each Brodmann’s Area sub-group of studies, evidence of publication bias was evident by Egger’s method, Macaskill’s method, or both, thus, findings of publication bias did not appear to be regionally dependent. In addition to these independent analyses by BA, a multivariate extension of Macaskill’s regression was performed across the three regions of interest, both with and without outliers. An overall finding of publication bias was found, once again (with and without outliers p<0.0001), and between group differences were examined using pairwise t-tests. No differences were found to be significant between BA6 and BA9 (with outliers p=0.5, without outliers p=0.4), BA9 and BA ‘other’ (with outliers p=0.7, without outliers p=0.6), or BA6 and BA ‘other’ (with and without outliers p=0.3).
The most common cognitive/behavioral domain (as defined by the Sleuth tool in BrainMap) was a strict working memory task (n=55; e.g. the N-back task, etc). Of the remaining 19 studies, there were working memory tasks that focused on perception (n=7), emotion (n=4), attention (n=3), language (n=2), interoception (n=1), reasoning (n=1), and space (n=1). Analyses were performed examining the strict working memory task compared with the ‘other’ tasks (again, due to low sample sizes in each domain). While these domains did not differ with respect to the presence of publication bias when examined individually, it was of interest to note that three out of the four reported extreme Cohen’s d values were from the perception domain. The multivariate Macaskill regression also showed that there was an overall presence of publication bias (p<0.0001 both with and without outliers), but that there were no differences between the two groups with respect to the presence of publication bias (with and without outliers p=0.4). Since these results did not differ from our overall findings, there appeared to be no systematically different bias based on functional domain. It appears that the presence of publication bias is not restricted by sub-region of the brain or cognitive/behavioral paradigm but is likely to be broadly present across the literature.
Discussion
Evidence of publication bias was observed in this body of literature using a number of different statistical techniques and examining two different metrics of effect size. However, in certain instances the bias is so prominent that it is clearly evident when simply graphing data via the funnel plot. While we specifically focused our examination at fMRI activation in the frontal lobe during a working memory task in normal subjects, this region and functional domain were chosen arbitrarily from all available brain regions and cognitive domains. However, the findings reported here are likely to be characteristic of the functional imaging literature as a whole. With such small sample sizes per study, we would expect that there should exist a large number of negative (i.e. supporting the null hypothesis) or non-significant findings due to a lack of power alone. Since we did not restrict our analysis by age (groups ranged from children to seniors, minimum age 7, maximum age >61), one might further expect more studies with inconclusive findings in children since their patterns of activation tend to vary much more widely than adults (Thomason, Burrows et al. 2005; Thomason, Chang et al. 2008). Further work might be done to examine such hypotheses in detail.
Though publication bias appears to exist in the published cognitive activation literature assessed here, the importance of openly accessible data repositories should not be overshadowed by this outcome. With the amount of available results rapidly growing each year, the creation of BrainMap as a universal coordinate database for functional neuroimaging is both necessary and important (Fox, Mikiten et al. 1994; Laird, Lancaster et al. 2005). The ability to store and share meta-data for analysis, especially in the functional imaging field, is invaluable and having a way to then easily access this information is even more essential.
Since there may be inherent publication bias present in archives of neuroimaging study summary data, however, it is important to be aware of this possibility, and apply appropriate consideration to account for this when performing meta-analyses using these resources. Though we used the trim and fill method as a diagnostic to measure the presence or absence of publication bias, this method can be implemented in a way to account and adjust for publication bias in the literature (it “fills in” the missing non-significant studies presumed to be absent from the published literature) (Duval and Tweedie 2000). Other techniques estimate the minimum number of non-significant, unpublished studies (i.e. those with null results). This number of “filed” studies, or the tolerance for future null results, is evaluated to test for whether the effect detected by meta-analysis would be overturned if only a few more non-significant studies were added (Rosenthal 1979). If this estimated number is small, often called the “fail-safe file drawer” estimate, then the findings in the meta-analysis are not robust enough, and not resistant to the file drawer threat.
Publication Bias and Reports of Inflated Correlations between fMRI Activity and Experimental Variables
Important concerns about the reporting of extremely high correlations in fMRI studies have recently been highlighted in the literature. Vul et al. (2009) examined how non-independent region of interest (ROI) analyses (where the correlations are both the selection criteria and the secondary statistics) inflate the correlations presented in functional imaging research, also known as non-independence or circular analysis. While the specific claims of the Vul et al. article have been hotly contested (Lieberman, Berkman et al. 2009), and the claim that many of the reported correlations were “impossibly high” may have been overstated (Poldrack and Mumford 2009), the study highlighted important issues in the functional imaging literature and the need for stringent and robust statistical techniques when analyzing data and reporting results. In particular, multiple comparison corrections should be utilized so that false-positive results based on chance are accounted for. However, tasks in working memory are stimulus-response driven and do not tend to suffer from non-independent ROI analysis, since behavior and survey data are not examined alongside BOLD activation (so are therefore “blinded” to subject performance). Vul et al.’s criticisms were restricted only to studies reporting linear correlations between regional fMRI activity and a behavioral or personality measure. Related to selecting bias, Yarkoni (2009) has described the effects that low sample size and power can have on the inflation of reported correlations, which is closely related to the type of publication bias tested for here. Clearly, the identification and reporting of inflated correlation results with a low sample size is a likely contributor to publication bias. Collectively, these biases are likely part of a family of potential biases that can affect observed statistical results, and testing for the effect of publication bias in meta-analyses provides a further tool to analyze various bias components.
Potential Limitations in Our Analysis
One potential criticism of our approach to assessing publication bias in neuroimaging is that the use of the BrainMap database may have limited the number and type of studies examined in this analysis. The BrainMap database does not index every neuroimaging study appearing in the literature (Derrfuss and Mar 2009) - capturing only about 20% of the studies listed in PubMed in any given year. This might be taken to mean that the results obtained here are not reflective of the entire neuroimaging literature on frontal lobe activity or any other sample of studies drawn from this resource. This might suggest that our assessment of bias is itself biased toward only those studies contained in BrainMap. The entry of information into BrainMap occurs both through voluntary upload using the BrainMap Scribe tool or occurs through the activities of BrainMap curatorial staff. We are unaware that studies are filtered in any way according to task domain, brain region, sample size, level of effect size, etc – the criterion for entry is that they simply appeared in the peer-reviewed published literature. So conversely, if evidence exists for publication bias in this sample of the literature as indexed into this resource, it could be equally argued that perhaps the issue of publication bias is actually much more wide spread than this analysis indicates.
We might have also chosen other archives from which to draw the results data to assess publication more widely in the literature, such as SumsDB (Van Essen 2009) – an activation foci coordinate database similar to BrainMap. Sums DB captures a slightly smaller percentage of published articles than BrainMap and likely contains many of the same studies and accompanying summary data. Still other archives may not contain lists of activation foci but may contain results maps or the raw data itself (e.g. the OpenfMRI Project, http://openfmri.org), may not have sufficient numbers of samples, or may necessitate additional, labor intensive data processing to extract the relevant sets of activation coordinates. In focusing on the BrainMap archive, however, we sought to note what would likely be present in any particular archive of published results available from such archives that others may use to perform other forms of coordinate-driven meta-analytic assessment. BrainMap, in particular, has been used to conduct such meta-analyses previously (Fox, Laird et al. 2005; Laird, Lancaster et al. 2005; Laird, Eickhoff et al. 2009) and can be expected to continue that role in future.
We do not wish to suggest that the BrainMap database, or any similar archive, is itself flawed in any way or that any specific cautions are needed in using the information contained therein beyond the consideration of reported effect sizes relative to sample sizes. On the contrary, the BrainMap database is ideally suited for examining publication bias because it specifically focuses on published activation foci results in the form of Talairach or MNI coordinates. The curators of this archive are to be commended for thoroughly and accurately presenting the types of study summary data that permit meta-analytic examinations such as these.
Indeed, we believe that publication bias may be evident in similar results data contained in many other neuroimaging archives containing the results from peer-reviewed articles. This article, however, focused on the most available and economical resource for testing for the presence of publication bias. We advise that careful examination of other archives by their curators should be undertaken to measure the degree of potential bias in publication across the collection of articles and these results made open for users to take into consideration.
We hope that by illuminating this potential issue future meta-analyses can test and account for publication bias consistently and systematically. While such tests are commonly applied to meta-analyses of epidemiological studies (Bracken 2005) and studies examining cancer causing agents (Vandenbroucke 1988), to our knowledge such methods have not been used consistently in biological studies, especially in neuroimaging and neuroscience, generally. Ours is the first such examination. Further research into the extent of publication bias in neuroimaging is likely necessary on an archive-by-archive basis to determine mitigating factors such as pressure to publish, requirements for funding, year of study effects (Van Horn and McManus 1992), the number of co-authors, among other potential variables that might give rise to such bias.
Acknowledgments
This work was supported by NIH grant RC1MH088194 to JVH. The authors wish to thank the members of the Laboratory of Neuro Imaging (LONI) in the Department of Neurology at the UCLA David Geffen School of Medicine and three anonymous reviewers of a previous version of this article.
Footnotes
INFORMATION SHARING STATEMENT:
The BrainMap database is a publicly available database which can be accessed via the web at http://www.brainmap.org. Matlab (Mathworks, Nattick, MA) was used in our analyses of publication bias, and the program written and used in this research is available from the authors upon request. In addition, many different statistical packages offer programs for diagnosing and correcting for publication bias. A macro (Rendina-Gobioff and Kromrey 2006) has been created in the SAS statistical analysis platform (SAS Institute, Cary, North Carolina) which is useful when comparing two groups, and the ‘rmeta’ package in R (http://www.r-project.org) contains different functions which can be implemented to diagnose and account for the effect of publication bias (Lumley 2009).
Contributor Information
Robin G. Jennings, Email: rgjennings@ucla.edu, Department of Biostatistics and Laboratory of Neuro Imaging (LONI), Department of Neurology, David Geffen School of Medicine, University of California Los Angeles, 635 Charles Young Drive South, Suite 225, Los Angeles, CA 90095, USA
John D. Van Horn, Email: jvanhorn@loni.ucla.edu, Laboratory of Neuro Imaging (LONI), Department of Neurology, David Geffen School of Medicine, University of California Los Angeles, Los Angeles, CA 90095, USA
References
- Awad M. Publication bias in clinical trials. J Can Dent Assoc. 2010;76:a175. [PubMed] [Google Scholar]
- Begg CB, Mazumdar M. Operating characteristics of a rank correlation test for publication bias. Biometrics. 1994;50(4):1088–1101. [PubMed] [Google Scholar]
- Bracken MB. Genomic epidemiology of complex disease: the need for an electronic evidence-based approach to research synthesis. Am J Epidemiol. 2005;162(4):297–301. doi: 10.1093/aje/kwi200. [DOI] [PubMed] [Google Scholar]
- Cohen J. Statistical Power Analysis for the Behavioral sciences. Hillsdale, N.J: Erlbaum Associates; 1988. [Google Scholar]
- Deeks JJ, Macaskill P, Irwig L. The performance of tests of publication bias and other sample size effects in systematic reviews of diagnostic test accuracy was assessed. J Clin Epidemiol. 2005;58(9):882–893. doi: 10.1016/j.jclinepi.2005.01.016. [DOI] [PubMed] [Google Scholar]
- Derrfuss J, Mar RA. Lost in localization: the need for a universal coordinate database. Neuroimage. 2009;48(1):1–7. doi: 10.1016/j.neuroimage.2009.01.053. [DOI] [PubMed] [Google Scholar]
- Dickersin K. The existence of publication bias and risk factors for its occurrence. Jama. 1990;263(10):1385–1389. [PubMed] [Google Scholar]
- Dickersin K. How important is publication bias? A synthesis of available data. AIDS Educ Prev. 1997;9(1 Suppl):15–21. [PubMed] [Google Scholar]
- Dickersin K, Min YI, Meinert CL. Factors influencing publication of research results. Follow-up of applications submitted to two institutional review boards. Jama. 1992;267(3):374–378. [PubMed] [Google Scholar]
- Duval S, Tweedie R. Trim and fill: A simple funnel-plot-based method of testing and adjusting for publication bias in meta-analysis. Biometrics. 2000;56(2):455–463. doi: 10.1111/j.0006-341x.2000.00455.x. [DOI] [PubMed] [Google Scholar]
- Easterbrook PJ, Berlin JA, Gopalan R, DRM Publication bias in clinical research. Lancet. 1991;337:86772. doi: 10.1016/0140-6736(91)90201-y. [DOI] [PubMed] [Google Scholar]
- Egger M, Davey Smith G, Schneider M, Minder C. Bias in meta-analysis detected by a simple, graphical test. BMJ. 1997;315(7109):629–634. doi: 10.1136/bmj.315.7109.629. ‘2127453:’ 2127453. [DOI] [PMC free article] [PubMed] [Google Scholar]
- Fanelli D. Do Pressures to Publish Increase Scientists’ Bias? An Empirical Support from US States Data. PLoS ONE. 2010;5(4):e10271. doi: 10.1371/journal.pone.0010271. [DOI] [PMC free article] [PubMed] [Google Scholar]
- Fox P, Lancaster J. Mapping context and content: the BrainMap model. Nature Reviews Neuroscience. 2002;3 (April):319–321. doi: 10.1038/nrn789. [DOI] [PubMed] [Google Scholar]
- Fox PT, Laird AR, Fox SP, Fox PM, Uecker AM, Crank M, Koenig SF, Lancaster JL. BrainMap taxonomy of experimental design: description and evaluation. Hum Brain Mapp. 2005;25(1):185–198. doi: 10.1002/hbm.20141. [DOI] [PMC free article] [PubMed] [Google Scholar]
- Fox PT, Mikiten S, Davis G, Lancaster J. In: BrainMap: A database of human function brain mapping:. Functional Neuroimaging Technical Foundations. Thatcher RW, Hallett M, Zeffiro T, John ER, Heurta M, editors. San Diego: Academic Press; 1994. pp. 95–105. [Google Scholar]
- Friston KJ, Holmes AP, Worsley KJ. How many subjects constitute a study? Neuroimage. 1999;10(1):1–5. doi: 10.1006/nimg.1999.0439. [DOI] [PubMed] [Google Scholar]
- Fusar-Poli P, Placentino A, Carletti F, Landi P, Allen P, Surguladze S, Benedetti F, Abbamonte M, Gasparotti R, Barale F, Perez J, McGuire P, Politi P. Functional atlas of emotional faces processing: a voxel-based meta-analysis of 105 functional magnetic resonance imaging studies. J Psychiatry Neurosci. 2009;34(6):418–432. [PMC free article] [PubMed] [Google Scholar]
- Hayashino Y, Noguchi Y, Fukui T. Systematic evaluation and comparison of statistical tests for publication bias. J Epidemiol. 2005;15(6):235–243. doi: 10.2188/jea.15.235. [DOI] [PMC free article] [PubMed] [Google Scholar]
- Hopewell S, Loudon K, Clarke MJ, Oxman AD, Dickersin K. Publication bias in clinical trials due to statistical significance or direction of trial results. Cochrane Database Syst Rev. 2009;(1):MR000006. doi: 10.1002/14651858.MR000006.pub3. [DOI] [PMC free article] [PubMed] [Google Scholar]
- Kromrey JD, Redina-Gobioff G. On Knowing What We Do Not Know: An Emperical Comparison of Methods to Detect Publication Bias in Meta-Analysis. Educational and Pyschological Measurement. 2006;66:357–373. [Google Scholar]
- Laird AR, Eickhoff SB, Li K, Robin DA, Glahn DC, Fox PT. Investigating the functional heterogeneity of the default mode network using coordinate-based meta-analytic modeling. J Neurosci. 2009;29(46):14496–14505. doi: 10.1523/JNEUROSCI.4004-09.2009. [DOI] [PMC free article] [PubMed] [Google Scholar]
- Laird AR, Lancaster JL, Fox PT. BrainMap: the social evolution of a human brain mapping database. Neuroinformatics. 2005;3(1):65–78. doi: 10.1385/ni:3:1:065. [DOI] [PubMed] [Google Scholar]
- Lieberman MD, Berkman ET, Wager TD. Correlations in Social Neuroscience Aren’t Voodoo: Commentary on Vul et al. (2009) Perspectives on Psychological Science. 2009;4(3):299–307. doi: 10.1111/j.1745-6924.2009.01128.x. [DOI] [PMC free article] [PubMed] [Google Scholar]
- Light RJ, Pillemer DB. Summing up. The science of reviewing research. Cambridge, MA: Harvard University Press; 1984. [Google Scholar]
- Lumley T. rmeta: Meta-analysis. R package version 2.16. 2009 from http://CRAN.R-project.org/package=rmeta.
- Macaskill P, Walter SD, Irwig L. A comparison of methods to detect publication bias in meta-analysis. Stat Med. 2001;20(4):641–654. doi: 10.1002/sim.698. [DOI] [PubMed] [Google Scholar]
- Matias-Guiu J, Garcia-Ramos R. Editorial bias in scientific publications. Neurologia. 2011;26(1):1–5. doi: 10.1016/j.nrl.2010.11.001. [DOI] [PubMed] [Google Scholar]
- Murphy FC, Nimmo-Smith I, Lawrence AD. Functional neuroanatomy of emotions: a meta-analysis. Cogn Affect Behav Neurosci. 2003;3(3):207–233. doi: 10.3758/cabn.3.3.207. [DOI] [PubMed] [Google Scholar]
- Neumann J, von Cramon DY, Lohmann G. Model-based clustering of meta-analytic functional imaging data. Hum Brain Mapp. 2008;29(2):177–192. doi: 10.1002/hbm.20380. [DOI] [PMC free article] [PubMed] [Google Scholar]
- Nielsen FA, Hansen LK. Modeling of activation data in the BrainMap database: detection of outliers. Hum Brain Mapp. 2002;15(3):146–156. doi: 10.1002/hbm.10012. [DOI] [PMC free article] [PubMed] [Google Scholar]
- Peters JL, Sutton AJ, Jones DR, Abrams KR, Rushton L. Comparison of two methods to detect publication bias in meta-analysis. Jama. 2006;295(6):676–680. doi: 10.1001/jama.295.6.676. [DOI] [PubMed] [Google Scholar]
- Peyron R, Laurent B, Garcia-Larrea L. Functional imaging of brain responses to pain. A review and meta-analysis (2000) Neurophysiol Clin. 2000;30(5):263–288. doi: 10.1016/s0987-7053(00)00227-6. [DOI] [PubMed] [Google Scholar]
- Poldrack RA, Mumford JA. Independence in ROI analysis: where is the voodoo? Soc Cogn Affect Neurosci. 2009;4(2):208–213. doi: 10.1093/scan/nsp011. ‘2686233:’ 2686233. [DOI] [PMC free article] [PubMed] [Google Scholar]
- Polyzos NP, Valachis A, Patavoukas E, Papanikolaou EG, Messinis IE, Tarlatzis BC, Devroey P. Publication bias in reproductive medicine: from the European Society of Human Reproduction and Embryology annual meeting to publication. Hum Reprod. 2011 doi: 10.1093/humrep/der044. [DOI] [PubMed] [Google Scholar]
- Rendina-Gobioff G, Kromrey JD. PUB_BIAS: A SAS Macro for Detecting Publication Bias in Meta-Analysis. 14th Annual SouthEast SAS Users Group (SESUG) Conference; Atlanta, GA: SouthEast SAS Users Group (SESUG); 2006. p. PO05. [Google Scholar]
- Rosenthal R. The “File Drawer Problem” and Tolerance for Null Results. Psychological Bulletin. 1979;86(3):638–641. [Google Scholar]
- Rucker G, Carpenter JR, Schwarzer G. Detecting and adjusting for small-study effects in meta-analysis. Biom J. 2011;53(2):351–368. doi: 10.1002/bimj.201000151. [DOI] [PubMed] [Google Scholar]
- Saeed M, Paulson K, Lambert P, Szwajcer D, Seftel M. Publication Bias in Blood and Marrow Transplantation. Biol Blood Marrow Transplant. 2010 doi: 10.1016/j.bbmt.2010.11.028. [DOI] [PubMed] [Google Scholar]
- Scargle JD. Publication Bias: The “File-Drawer” Problem in Scientific Inference. Journal of Scientific Exploration. 2000;14(1):91–106. [Google Scholar]
- Schooler J. Unpublished results hide the decline effect. Nature. 2011;470(7335):437. doi: 10.1038/470437a. [DOI] [PubMed] [Google Scholar]
- Sterne JA, Gavaghan D, Egger M. Publication and related bias in meta-analysis: power of statistical tests and prevalence in the literature. J Clin Epidemiol. 2000;53(11):1119–1129. doi: 10.1016/s0895-4356(00)00242-0. [DOI] [PubMed] [Google Scholar]
- Terrin N, Schmid CH, Lau J. In an empirical evaluation of the funnel plot, researchers could not visually identify publication bias. J Clin Epidemiol. 2005;58(9):894–901. doi: 10.1016/j.jclinepi.2005.01.006. [DOI] [PubMed] [Google Scholar]
- Thomason ME, Burrows BE, Gabrieli JD, Glover GH. Breath holding reveals differences in fMRI BOLD signal in children and adults. Neuroimage. 2005;25(3):824–837. doi: 10.1016/j.neuroimage.2004.12.026. [DOI] [PubMed] [Google Scholar]
- Thomason ME, Chang CE, Glover GH, Gabrieli JD, Greicius MD, Gotlib IH. Default-mode function and task-induced deactivation have overlapping brain substrates in children. Neuroimage. 2008;41(4):1493–1503. doi: 10.1016/j.neuroimage.2008.03.029. [DOI] [PMC free article] [PubMed] [Google Scholar]
- Turkeltaub PE, Eden GF, Jones KM, Zeffiro TA. Meta-analysis of the functional neuroanatomy of single-word reading: method and validation. Neuroimage. 2002;16(3 Pt 1):765–780. doi: 10.1006/nimg.2002.1131. [DOI] [PubMed] [Google Scholar]
- Van Essen DC. Lost in localization--but found with foci?! Neuroimage. 2009;48(1):14–17. doi: 10.1016/j.neuroimage.2009.05.050. [DOI] [PMC free article] [PubMed] [Google Scholar]
- Van Horn JD, Gazzaniga MS. Databasing fMRI Studies - Toward a ‘Discovery Science’ of Brain Function. Nature Reviews Neuroscience. 2002;3(4):314–318. doi: 10.1038/nrn788. [DOI] [PubMed] [Google Scholar]
- Van Horn JD, Grafton ST, Rockmore D, Gazzaniga MS. Sharing neuroimaging studies of human cognition. Nat Neurosci. 2004;7(5):473–481. doi: 10.1038/nn1231. [DOI] [PubMed] [Google Scholar]
- Van Horn JD, McManus IC. Ventricular enlargement in schizophrenia. A meta-analysis of studies of the ventricle:brain ratio (VBR) Br J Psychiatry. 1992;160:687–697. doi: 10.1192/bjp.160.5.687. [DOI] [PubMed] [Google Scholar]
- Vandenbroucke JP. Passive smoking and lung cancer: a publication bias? Br Med J (Clin Res Ed) 1988;296(6619):391–392. doi: 10.1136/bmj.296.6619.391. ‘2544973:’ 2544973. [DOI] [PMC free article] [PubMed] [Google Scholar]
- Vul E, Harris C, Winkielman P, Pashler H. Puzzlingly High Correlations in fMRI Studies of Emotion, Personality, and Social Cognition. Perspectives on Psychological Science. 2009;4(3):274–290. doi: 10.1111/j.1745-6924.2009.01125.x. [DOI] [PubMed] [Google Scholar]
- Yarkoni T. Big Correlations in Little Studies: Inflated fMRI Correlations Reflect Low Statistical Power—Commentary on Vul et al. (2009) Perspectives on Psychological Science. 2009;4(3):294–298. doi: 10.1111/j.1745-6924.2009.01127.x. [DOI] [PubMed] [Google Scholar]
- Zhu Y, Duijvesz D, Rovers MM, Lock TM. Evidence-based urology in practice: publication bias. BJU Int. 2011;107(2):337. doi: 10.1111/j.1464-410X.2010.10068_1.x. author reply 337–338. [DOI] [PubMed] [Google Scholar]
References to Articles Used in the Analyses of Publication Bias
- Altamura M, Elvevag B, et al. Dissociating the effects of Sternberg working memory demands in prefrontal cortex. Psychiatry Res. 2007;154(2):103–114. doi: 10.1016/j.pscychresns.2006.08.002. [DOI] [PubMed] [Google Scholar]
- Audoin B, Au Duong MV, et al. Magnetic resonance study of the influence of tissue damage and cortical reorganization on PASAT performance at the earliest stage of multiple sclerosis. Hum Brain Mapp. 2005;24(3):216–228. doi: 10.1002/hbm.20083. [DOI] [PMC free article] [PubMed] [Google Scholar]
- Baumann O, Frank G, et al. Cortical activation during sequences of memory-guided saccades: a functional MRI study. NeuroReport. 2007;18(5):451–455. doi: 10.1097/WNR.0b013e32805868ba. [DOI] [PubMed] [Google Scholar]
- Bedwell JS, Horner MD, et al. Functional neuroanatomy of subcomponent cognitive processes involved in verbal working memory. Int J Neurosci. 2005;115(7):1017–1032. doi: 10.1080/00207450590901530. [DOI] [PubMed] [Google Scholar]
- Beneventi H, Barndon R, et al. An fMRI study of working memory for schematic facial expressions. Scand J Psychol. 2007;48(2):81–86. doi: 10.1111/j.1467-9450.2007.00536.x. [DOI] [PubMed] [Google Scholar]
- Braver TS, Cohen JD, et al. A parametric study of prefrontal cortex involvement in human working memory. Neuroimage. 1997;5(1):49–62. doi: 10.1006/nimg.1996.0247. [DOI] [PubMed] [Google Scholar]
- Breitenstein C, Jansen A, et al. Hippocampus activity differentiates good from poor learners of a novel lexicon. Neuroimage. 2005;25(3):958–968. doi: 10.1016/j.neuroimage.2004.12.019. [DOI] [PubMed] [Google Scholar]
- Bunge SA, Ochsner KN, et al. Prefrontal regions involved in keeping information in and out of mind. Brain. 2001;124(Pt 10):2074–2086. doi: 10.1093/brain/124.10.2074. [DOI] [PubMed] [Google Scholar]
- Cabeza R, Dolcos F, et al. Similarities and differences in the neural correlates of episodic memory retrieval and working memory. Neuroimage. 2002;16(2):317–330. doi: 10.1006/nimg.2002.1063. [DOI] [PubMed] [Google Scholar]
- Cairo TA, Liddle PF, et al. The influence of working memory load on phase specific patterns of cortical activity. Brain Res Cogn Brain Res. 2004;21(3):377–387. doi: 10.1016/j.cogbrainres.2004.06.014. [DOI] [PubMed] [Google Scholar]
- Caldwell JA, Mu Q, et al. Are individual differences in fatigue vulnerability related to baseline differences in cortical activation? Behav Neurosci. 2005;119(3):694–707. doi: 10.1037/0735-7044.119.3.694. [DOI] [PubMed] [Google Scholar]
- Chang K, Adleman NE, et al. Anomalous prefrontal-subcortical activation in familial pediatric bipolar disorder: a functional magnetic resonance imaging investigation. Arch Gen Psychiatry. 2004;61(8):781–792. doi: 10.1001/archpsyc.61.8.781. [DOI] [PubMed] [Google Scholar]
- Chen JK, Johnston KM, et al. Functional abnormalities in symptomatic concussed athletes: an fMRI study. Neuroimage. 2004;22(1):68–82. doi: 10.1016/j.neuroimage.2003.12.032. [DOI] [PubMed] [Google Scholar]
- Cohen JD, Forman SD, et al. Activation of the Prefrontal Cortex in a Nonspatial Working Memory Task With Functional MRI. Human Brain Mapping. 1994;1:293–304. doi: 10.1002/hbm.460010407. [DOI] [PubMed] [Google Scholar]
- Cohen JD, Perlstein WM, et al. Temporal dynamics of brain activation during a working memory task. Nature. 1997;386(6625):604–608. doi: 10.1038/386604a0. [DOI] [PubMed] [Google Scholar]
- Cross ES, Schmitt PJ, et al. Neural Substrates of Contextual Interference during Motor Learning Support a Model of Active Preparation. J Cogn Neurosci. 2007;19(11):1854–1871. doi: 10.1162/jocn.2007.19.11.1854. [DOI] [PubMed] [Google Scholar]
- Deckersbach T, Rauch SL, et al. An fMRI investigation of working memory and sadness in females with bipolar disorder: a brief report. Bipolar Disord. 2008;10(8):928–942. doi: 10.1111/j.1399-5618.2008.00633.x. [DOI] [PubMed] [Google Scholar]
- Desmond JE, Chen SH, et al. Increased frontocerebellar activation in alcoholics during verbal working memory: an fMRI study. Neuroimage. 2003;19(4):1510–1520. doi: 10.1016/s1053-8119(03)00102-2. [DOI] [PubMed] [Google Scholar]
- Dohnel K, Sommer M, et al. Neural correlates of emotional working memory in patients with mild cognitive impairment. Neuropsychologia. 2008;46(1):37–48. doi: 10.1016/j.neuropsychologia.2007.08.012. [DOI] [PubMed] [Google Scholar]
- Dolcos F, McCarthy G. Brain systems mediating cognitive interference by emotional distraction. J Neurosci. 2006;26(7):2072–2079. doi: 10.1523/JNEUROSCI.5042-05.2006. [DOI] [PMC free article] [PubMed] [Google Scholar]
- Frangou S, Kington J, et al. Examining ventral and dorsal prefrontal function in bipolar disorder: a functional magnetic resonance imaging study. Eur Psychiatry. 2008;23(4):300–308. doi: 10.1016/j.eurpsy.2007.05.002. [DOI] [PubMed] [Google Scholar]
- Grosbras MH, Leonards U, et al. Human cortical networks for new and familiar sequences of saccades. Cereb Cortex. 2001;11(10):936–945. doi: 10.1093/cercor/11.10.936. [DOI] [PubMed] [Google Scholar]
- Gruber O, Tost H, et al. Pathological amygdala activation during working memory performance: Evidence for a pathophysiological trait marker in bipolar affective disorder. Hum Brain Mapp. 2010;31(1):115–125. doi: 10.1002/hbm.20849. [DOI] [PMC free article] [PubMed] [Google Scholar]
- Hamilton AF, Grafton ST. Repetition suppression for performed hand gestures revealed by fMRI. Hum Brain Mapp. 2009;30(9):2898–2906. doi: 10.1002/hbm.20717. [DOI] [PMC free article] [PubMed] [Google Scholar]
- Harvey PO, Fossati P, et al. Cognitive control and brain resources in major depression: an fMRI study using the n-back task. Neuroimage. 2005;26(3):860–869. doi: 10.1016/j.neuroimage.2005.02.048. [DOI] [PubMed] [Google Scholar]
- Hautzel H, Mottaghy FM, et al. Topographic segregation and convergence of verbal, object, shape and spatial working memory in humans. Neurosci Lett. 2002;323(2):156–160. doi: 10.1016/s0304-3940(02)00125-8. [DOI] [PubMed] [Google Scholar]
- Heide W, Binkofski F, et al. Activation of frontoparietal cortices during memorized triple-step sequences of saccadic eye movements: an fMRI study. Eur J Neurosci. 2001;13(6):1177–1189. doi: 10.1046/j.0953-816x.2001.01472.x. [DOI] [PubMed] [Google Scholar]
- Jeong B, Kwon JS, et al. Functional imaging evidence of the relationship between recurrent psychotic episodes and neurodegenerative course in schizophrenia. Psychiatry Res. 2005;139(3):219–228. doi: 10.1016/j.pscychresns.2004.01.008. [DOI] [PubMed] [Google Scholar]
- Johnson MR, Morris NA, et al. A functional magnetic resonance imaging study of working memory abnormalities in schizophrenia. Biol Psychiatry. 2006;60(1):11–21. doi: 10.1016/j.biopsych.2005.11.012. [DOI] [PubMed] [Google Scholar]
- Kanayama G, Rogowska J, et al. Spatial working memory in heavy cannabis users: a functional magnetic resonance imaging study. Psychopharmacology (Berl) 2004;176(3–4):239–247. doi: 10.1007/s00213-004-1885-8. [DOI] [PubMed] [Google Scholar]
- Kirschen MP, Chen SH, et al. Load- and practice-dependent increases in cerebro-cerebellar activation in verbal working memory: an fMRI study. Neuroimage. 2005;24(2):462–472. doi: 10.1016/j.neuroimage.2004.08.036. [DOI] [PubMed] [Google Scholar]
- Koch K, Pauly K, et al. Gender differences in the cognitive control of emotion: An fMRI study. Neuropsychologia. 2007;45(12):2744–2754. doi: 10.1016/j.neuropsychologia.2007.04.012. [DOI] [PubMed] [Google Scholar]
- Koch K, Wagner G, et al. Temporal modeling demonstrates preserved overlearning processes in schizophrenia: an fMRI study. Neuroscience. 2007;146(4):1474–1483. doi: 10.1016/j.neuroscience.2007.03.021. [DOI] [PubMed] [Google Scholar]
- Koppelstaetter F, Poeppel TD, et al. Does caffeine modulate verbal working memory processes? An fMRI study. Neuroimage. 2008;39(1):492–499. doi: 10.1016/j.neuroimage.2007.08.037. [DOI] [PubMed] [Google Scholar]
- Koshino H, Kana RK, et al. fMRI investigation of working memory for faces in autism: visual coding and underconnectivity with frontal areas. Cereb Cortex. 2008;18(2):289–300. doi: 10.1093/cercor/bhm054. [DOI] [PMC free article] [PubMed] [Google Scholar]
- Kumari V, Aasen I, et al. Neural dysfunction and violence in schizophrenia: an fMRI investigation. Schizophr Res. 2006;84(1):144–164. doi: 10.1016/j.schres.2006.02.017. [DOI] [PubMed] [Google Scholar]
- Lagopoulos J, Ivanovski B, et al. An event-related functional MRI study of working memory in euthymic bipolar disorder. J Psychiatry Neurosci. 2007;32(3):174–184. [PMC free article] [PubMed] [Google Scholar]
- Landau SM, Schumacher EH, et al. A functional MRI study of the influence of practice on component processes of working memory. Neuroimage. 2004;22(1):211–221. doi: 10.1016/j.neuroimage.2004.01.003. [DOI] [PubMed] [Google Scholar]
- LoPresti ML, Schon K, et al. Working memory for social cues recruits orbitofrontal cortex and amygdala: a functional magnetic resonance imaging study of delayed matching to sample for emotional expressions. J Neurosci. 2008;28(14):3718–3728. doi: 10.1523/JNEUROSCI.0464-08.2008. [DOI] [PMC free article] [PubMed] [Google Scholar]
- Malisza KL, Allman AA, et al. Evaluation of spatial working memory function in children and adults with fetal alcohol spectrum disorders: a functional magnetic resonance imaging study. Pediatr Res. 2005;58(6):1150–1157. doi: 10.1203/01.pdr.0000185479.92484.a1. [DOI] [PubMed] [Google Scholar]
- Matsuo K, Glahn DC, et al. Prefrontal hyperactivation during working memory task in untreated individuals with major depressive disorder. Mol Psychiatry. 2007;12(2):158–166. doi: 10.1038/sj.mp.4001894. [DOI] [PubMed] [Google Scholar]
- Meisenzahl EM, Scheuerecker J, et al. Effects of treatment with the atypical neuroleptic quetiapine on working memory function: a functional MRI follow-up investigation. Eur Arch Psychiatry Clin Neurosci. 2006;256(8):522–531. doi: 10.1007/s00406-006-0687-x. [DOI] [PubMed] [Google Scholar]
- Mendrek A, Kiehl KA, et al. Dysfunction of a distributed neural circuitry in schizophrenia patients during a working-memory performance. Psychol Med. 2005;35(2):187–196. doi: 10.1017/s0033291704003228. [DOI] [PubMed] [Google Scholar]
- Mendrek A, Laurens KR, et al. Changes in distributed neural circuitry function in patients with first-episode schizophrenia. Br J Psychiatry. 2004;185:205–214. doi: 10.1192/bjp.185.3.205. [DOI] [PubMed] [Google Scholar]
- Mu Q, Mishory A, et al. Decreased brain activation during a working memory task at rested baseline is associated with vulnerability to sleep deprivation. Sleep. 2005;28(4):433–446. doi: 10.1093/sleep/28.4.433. [DOI] [PubMed] [Google Scholar]
- Mu Q, Nahas Z, et al. Decreased cortical response to verbal working memory following sleep deprivation. Sleep. 2005;28(1):55–67. doi: 10.1093/sleep/28.1.55. [DOI] [PubMed] [Google Scholar]
- Neuner I, Stocker T, et al. Wechsler Memory Scale Revised Edition: Neural correlates of the visual paired associates subtest adapted for fMRI. Brain Res. 2007;1177:66–78. doi: 10.1016/j.brainres.2007.07.096. [DOI] [PubMed] [Google Scholar]
- Nystrom LE, Braver TS, et al. Working memory for letters, shapes, and locations: fMRI evidence against stimulus-based regional organization in human prefrontal cortex. Neuroimage. 2000;11(5 Pt 1):424–446. doi: 10.1006/nimg.2000.0572. [DOI] [PubMed] [Google Scholar]
- Petit L, Courtney SM, et al. Sustained activity in the medial wall during working memory delays. J Neurosci. 1998;18(22):9429–9437. doi: 10.1523/JNEUROSCI.18-22-09429.1998. [DOI] [PMC free article] [PubMed] [Google Scholar]
- Pochon JB, Levy R, et al. The neural system that bridges reward and cognition in humans: an fMRI study. Proc Natl Acad Sci U S A. 2002;99(8):5669–5674. doi: 10.1073/pnas.082111099. [DOI] [PMC free article] [PubMed] [Google Scholar]
- Pochon JB, Levy R, et al. The role of dorsolateral prefrontal cortex in the preparation of forthcoming actions: an fMRI study. Cereb Cortex. 2001;11(3):260–266. doi: 10.1093/cercor/11.3.260. [DOI] [PubMed] [Google Scholar]
- Prado J, Noveck IA. Overcoming perceptual features in logical reasoning: a parametric functional magnetic resonance imaging study. J Cogn Neurosci. 2007;19(4):642–657. doi: 10.1162/jocn.2007.19.4.642. [DOI] [PubMed] [Google Scholar]
- Quintana J, Wong T, et al. Right lateral fusiform gyrus dysfunction during facial information processing in schizophrenia. Biol Psychiatry. 2003;53(12):1099–1112. doi: 10.1016/s0006-3223(02)01784-5. [DOI] [PubMed] [Google Scholar]
- Ragland JD, Gur RC, et al. Event-related fMRI of frontotemporal activity during word encoding and recognition in schizophrenia. Am J Psychiatry. 2004;161(6):1004–1015. doi: 10.1176/appi.ajp.161.6.1004. [DOI] [PMC free article] [PubMed] [Google Scholar]
- Ragland JD, Turetsky BI, et al. Working memory for complex figures: an fMRI comparison of letter and fractal n-back tasks. Neuropsychology. 2002;16(3):370–379. [PMC free article] [PubMed] [Google Scholar]
- Ricciardi E, Bonino D, et al. Neural correlates of spatial working memory in humans: a functional magnetic resonance imaging study comparing visual and tactile processes. Neuroscience. 2006;139(1):339–349. doi: 10.1016/j.neuroscience.2005.08.045. [DOI] [PubMed] [Google Scholar]
- Rowe JB, Toni I, et al. The prefrontal cortex: response selection or maintenance within working memory? Science. 2000;288(5471):1656–1660. doi: 10.1126/science.288.5471.1656. [DOI] [PubMed] [Google Scholar]
- Rypma B, Prabhakaran V, et al. Age differences in prefrontal cortical activity in working memory. Psychol Aging. 2001;16(3):371–384. doi: 10.1037//0882-7974.16.3.371. [DOI] [PubMed] [Google Scholar]
- Rypma B, Prabhakaran V, et al. Load-dependent roles of frontal brain regions in the maintenance of working memory. Neuroimage. 1999;9(2):216–226. doi: 10.1006/nimg.1998.0404. [DOI] [PubMed] [Google Scholar]
- Sanchez-Carrion R, Gomez PV, et al. Frontal hypoactivation on functional magnetic resonance imaging in working memory after severe diffuse traumatic brain injury. J Neurotrauma. 2008;25(5):479–494. doi: 10.1089/neu.2007.0417. [DOI] [PubMed] [Google Scholar]
- Schmidt H, Jogia J, et al. No gender differences in brain activation during the N-back task: an fMRI study in healthy individuals. Hum Brain Mapp. 2009;30(11):3609–3615. doi: 10.1002/hbm.20783. [DOI] [PMC free article] [PubMed] [Google Scholar]
- Sevostianov A, Horwitz B, et al. fMRI study comparing names versus pictures of objects. Hum Brain Mapp. 2002;16(3):168–175. doi: 10.1002/hbm.10037. [DOI] [PMC free article] [PubMed] [Google Scholar]
- Shamosh NA, Deyoung CG, et al. Individual differences in delay discounting: relation to intelligence, working memory, and anterior prefrontal cortex. Psychol Sci. 2008;19(9):904–911. doi: 10.1111/j.1467-9280.2008.02175.x. [DOI] [PubMed] [Google Scholar]
- Sheridan MA, Hinshaw S, et al. Efficiency of the prefrontal cortex during working memory in attention-deficit/hyperactivity disorder. J Am Acad Child Adolesc Psychiatry. 2007;46(10):1357–1366. doi: 10.1097/chi.0b013e31812eecf7. [DOI] [PubMed] [Google Scholar]
- Shikata E, Hamzei F, et al. Functional properties and interaction of the anterior and posterior intraparietal areas in humans. Eur J Neurosci. 2003;17(5):1105–1110. doi: 10.1046/j.1460-9568.2003.02540.x. [DOI] [PubMed] [Google Scholar]
- Simmons WK, Martin A, et al. Pictures of appetizing foods activate gustatory cortices for taste and reward. Cereb Cortex. 2005;15(10):1602–1608. doi: 10.1093/cercor/bhi038. [DOI] [PubMed] [Google Scholar]
- Smith YR, Love T, et al. Impact of combined estradiol and norethindrone therapy on visuospatial working memory assessed by functional magnetic resonance imaging. J Clin Endocrinol Metab. 2006;91(11):4476–4481. doi: 10.1210/jc.2006-0907. [DOI] [PMC free article] [PubMed] [Google Scholar]
- Sowell E, Lu L, et al. Medial Temporal and Frontal Lobe Activation Abnormalities During Verbal Learning in Children with Fetal Alcohol Spectrum Disorders. Neuroreport. 2007;18:635–639. doi: 10.1097/WNR.0b013e3280bad8dc. [DOI] [PubMed] [Google Scholar]
- Tan HY, Sust S, et al. Dysfunctional prefrontal regional specialization and compensation in schizophrenia. Am J Psychiatry. 2006;163(11):1969–1977. doi: 10.1176/ajp.2006.163.11.1969. [DOI] [PubMed] [Google Scholar]
- Veltman DJ, Rombouts SA, et al. Maintenance versus manipulation in verbal working memory revisited: an fMRI study. Neuroimage. 2003;18(2):247–256. doi: 10.1016/s1053-8119(02)00049-6. [DOI] [PubMed] [Google Scholar]
- Vinogradov S, Luks TL, et al. Deficit in a neural correlate of reality monitoring in schizophrenia patients. Cereb Cortex. 2008;18(11):2532–2539. doi: 10.1093/cercor/bhn028. [DOI] [PMC free article] [PubMed] [Google Scholar]
- Volle E, Pochon JB, et al. Specific cerebral networks for maintenance and response organization within working memory as evidenced by the ‘double delay/double response’ paradigm. Cereb Cortex. 2005;15(7):1064–1074. doi: 10.1093/cercor/bhh207. [DOI] [PubMed] [Google Scholar]
- Walter H, Wolf RC, et al. Increased left prefrontal activation in patients with unipolar depression: an event-related, parametric, performance-controlled fMRI study. J Affect Disord. 2007;101(1–3):175–185. doi: 10.1016/j.jad.2006.11.017. [DOI] [PubMed] [Google Scholar]
- Yoo SS, Wei X, et al. Long-term reproducibility analysis of fMRI using hand motor task. Int J Neurosci. 2005;115(1):55–77. doi: 10.1080/00207450490512650. [DOI] [PubMed] [Google Scholar]