

Abstract
Objectives
Social relationships are widely understood to be important for sustaining and improving health and longevity, but it remains unclear how different dimensions of social relationships operate through similar or distinct mechanisms to affect biophysiological markers of aging-related disease over time.
Methods
This study utilized longitudinal data on a nationally representative sample of older adults from the National Social Life, Health, and Aging Project (2005 – 2011) to examine the prospective associations between social integration and social support and change in systolic blood pressure and hypertension risk over time.
Results
While both social relationship dimensions have significant physiological impacts, their relative importance differs by outcome. Low social support was predictive of increase in systolic blood pressure, while low social integration was predictive of increase in risk of hypertension.
Discussion
The different roles of relationship characteristics in predicting change in physiological outcomes suggest specific biophysiological stress response and behavioral mechanisms that have important implications for both scientific understandings and effective prevention and control of a leading chronic condition in late life.
Keywords: social integration, social support, blood pressure, hypertension, stress response, longitudinal analysis
Introduction
Understanding the roles of social connections in shaping health and well-being has been a focus of scientific inquiry since the late 1970s, and a wide body of research from across disciplines now provides overwhelming evidence that social relationships are critical for sustaining and improving health, functioning and longevity in social species (Berkman et al., 2000; Cassel, 1976; Cobb, 1976; McClintock et al., 2005). A growing body of literature has further associated a lack of social integration with specific illness conditions such as cardiovascular disease (Berkman et al., 1993; Orth-Gomér et al., 1993; Eng et al., 2002), cancer (Penwell & Larkin, 2010), depression (George et al., 1989; Heikkienen & Kauppinen, 2004), biomarkers of physiological dysregulation such as inflammation (Kiecolt-Glaser et al., 2010; Yang et al., 2013) and infection (Cohen et al., 1997; Pressman et al., 2005), as well as higher rates of general and cause-specific mortality (Berkman & Syme, 1979; Holt-Lunstad et al., 2010; Thoits, 1995; Yang at al., 2013). Meta-analyses show that mortality risks of social isolation are comparable to that associated with cigarette smoking and obesity (House, Landis, & Umberson, 1988; Holt-Lunstad et al., 2010). Research further suggests that social relationships may be particularly important to health in late life, as individuals transition into different social roles and experience more stressful life events such as loss of spouse or friends (Cornwell, Laumann, & Schumm, 2008; Umberson, Crosnoe, & Reczek, 2010).
While research examining the health effects of social relationships has boomed in recent years, three critical gaps in the literature remain. First, although social relations are generally conceptualized as multidimensional and their links to health thought to be multifaceted, few empirical analyses simultaneously incorporated multiple measures of distinct aspects of social relations in studies of large population based samples. A wide variety of indicators of social relations have been used across studies that go under the broad umbrella of social support. The literature generally distinguishes between the structural and functional dimensions of social relationships. Whereas structural dimensions indicate the patterning and organizing of social ties, the functional dimension of social connections generally refers to social support an individual receives or perceives from his or her social ties (Thoits, 2011; Uchino, 2004). Empirical analyses measure the structural dimension of social relationships as the quantity or number and nature of ties in an individual's social network that define levels of social integration or disconnectedness. Examples of indicators include living arrangements such as living alone (Magaziner et al., 1988; Dean et al., 1992; Hughes & Gove, 1981), marital status (Hu & Goldman, 1990; Litwak et al. 1989), network range or diversity (Haines & Hurlbert, 1992), frequency of contact with network members (Brummett et al., 2001), and the social network size, which encompasses and summarizes all the above domain-specific ties (Berkman & Syme, 1979, Seeman & Berkman, 1988). Measures of the functional dimension of social relations, including emotional, informational, and instrumental functions performed by network members, typically include perceived levels of social support (Wethington & Kessler, 1986) and feelings of loneliness (Hawkley et al., 2006; Cacioppo et al., 2002).
Restriction to single measures of social relationships in studies of health and well-being, therefore, has limitations. For one, it makes it difficult to identify the unique influences of particular network or support characteristics on health (Cornwell & Waite, 2012). While research generally finds the links between social integration and health to be strong, a count of social ties is not informative of the actual function or quality of social ties. Individuals can still perceive isolation despite having many social ties; while conversely, having one or two close social connections may lead to greater perceived support (Kiecolt-Glaser et al., 2010). In some research focused on the functional aspects of social support—that is, the role of networks in providing support—the structural aspects were ignored, so less is known about how an individual's web of social relationships—the number, nature, types, and characteristics of relations—affects health (Smith & Christakis, 2008). There is evidence that multidimensional measures including both structural and functional aspects of social relationships are better predictors of mortality than each alone (Holt-Lunstad et al., 2010). Additionally, the focus on single measures of social relations makes it difficult to discern the interrelations between different dimensions of integration and support in association with specific indicators of health. For example, it remains unknown whether social disconnectedness and perceived isolation are two independent processes that contribute to health risk, or whether perceived isolation simply reflects one's degree of actual isolation (Steptoe et al., 2013). Some recent studies that assessed both structural and functional aspects of social relations show that the number of social network ties is more significantly related to mortality than perceived social support (Stringhini et al., 2012) or loneliness (Steptoe et al., 2013). It merits further investigation whether social integration and social support are two independent or interrelated measures of social relations that jointly contribute to other markers of disease risk.
The second major gap is that, while much research has documented the associations between social connections and self-reported health outcomes, the biobehavioral mechanisms underlying the observed links such as those related to physiological stress response in aging adults are not well specified or tested (Yang et al., 2013). Blood pressure is of particular interest to this study for several reasons. First, hypertension is a potent risk factor for cardiovascular disease, heart attack, stroke, and kidney disease, all of which are strongly predictive of old age mortality (Yang & Kozloski, 2012). With approximately 67% of adults over the age of 60 having elevated blood pressure (Yoon et al., 2012), hypertension plays a substantial role in shaping the health trajectories of older adults (Cornwell & Waite, 2012). Second, blood pressure is an indicator of physiological stress response. Activity of both the sympathetic nervous system (SNS) and hypothalamic-pituitary-adrenocortical (HPA) systems increases in response to environmental or social stressors (Seyle, 1974; Wolfe, Evans, & Seeman, 2012). In addition to releasing stress hormones, the SNS and HPA systems also play a critical role in regulating blood pressure (Christou et al., 2005; Hawkley et al., 2006). While temporary activation of the SNS and HPA in response to acute injuries or pathogens is necessary for maintaining healthy metabolic and immune function, the increased frequency, intensity, or duration of SNS and HPA activity that results from exposure to chronic, low-grade stress has been associated with the development and exacerbation of hypertension (Hawkley et al. 2006; McEwen, 1998; Rozanski, Blumenthal, & Kaplan, 1999; Van Uum, Lender, & Hermus, 2004; Whitworth et al., 1995).
Examining the association between blood pressure and social relationships may, therefore, shed light on the biological mechanisms by which social connections affect health. On the one hand, by boosting self-esteem, improving self-efficacy, and promoting a sense of belonging and companionship, the positive affect and effective coping that come with strong social connections may dampen the physiological arousal brought on by social and environmental stressors (Thoits, 2011; Uchino, 2004). On the other hand, social relationships may also impact disease risk through behavioral mechanisms, whereby individuals receive behavioral guidance through their interaction with their network members (Smith & Christakis, 2008; Marsden & Friedkin, 1993; Merton & Rossi, 1968; Umberson, Crosnoe & Reczek, 2010). Individuals may feel pressured or encouraged by their network members to adopt health-promoting behaviors and derive meaning by conforming to norms and performing socially obligated roles (Thoits, 2011). In all, the mechanisms linking social relationships to health remain to be better understood in objective measures of biophysiological functioning in late life.
Finally, most extant findings regarding the associations between social relationships and biomarkers of physical health are based on cross-sectional studies. The potential problem of reverse causality is difficult to resolve using cross-sectional designs. There is evidence from animal and laboratory studies that elevated stress response indicated by increased chronic inflammation can affect the brain via the vagus nerve and increase such illness behaviors as withdrawal from social interactions and depression (Maier & Watkins, 1998). It is thus possible that stress related illnesses such as hypertension can constrain social activities and result in social isolation or lack of support. The lack of longitudinal research using prospective data on biomarkers limits researchers' ability to draw causal inferences about the impacts of social relationships on physiological regulation and disease risk.
In sum, it remains unclear how different dimensions of social relationships operate through similar or distinct mechanisms to affect biophysiological markers of aging related disease over time. The present study fills these gaps by conducting a longitudinal analysis of the prospective associations between social integration and social support and change in blood pressure and hypertension risk using panel data from a nationally representative sample of older adults in the U.S.
Data and Methods
Data and Sample
The data are from the National Social Life, Health and Aging Project (NSHAP), a nationally-representative longitudinal study of community-dwelling older adults aged 57-85 years in 2005 – 2006 (Wave 1) and followed up in 2010 – 2011 (Wave 2). African-Americans, Latinos, men and the oldest-old (75-84 years at the time of screening) were over-sampled. A full description of the NSHAP study design can be found in O'Muircheartaigh, Eckman, & Smith (2009). The overall response rate for Wave 1 was 75.5%, and the response rate for eligible respondents who were re-interviewed at Wave 2 was 87.8%. The NSHAP collected extensive information on respondents' intimate social relationships, physical and mental health, health behaviors, and medication use, primarily thorough in-home interviews. The NSHAP also includes several biomarkers measured at Waves 1 and 2 for a subset of the sample.
The original Wave 1 sample included 3,005 respondents, and 2,261 of these Wave 1 respondents were re-interviewed at Wave 2. This study includes 1,264 individuals who had available data for all variables used in the analysis. Among the respondents excluded from the study, most lacked complete data on social relationship measures (471 missing) and smoking (318 missing). Compared to respondents included in the final sample, those excluded were more likely to be Black or Hispanic (p < 0.001), had lower levels of education (p < 0.001), lower BMIs (p < 0.001), higher systolic blood pressure (p = 0.003 for Wave 1; p = 0.020 for Wave 2) and higher rates of hypertension (p = 0.030 for Wave 1; p = 0.001 for Wave 2). To the extent that the analytic sample had higher SES and was healthier, the results of our analyses may be conservative given positive associations between high SES and social network support (Stringhini et al., 2012).
Dependent Variables: Systolic Blood Pressure and Hypertension
Blood pressure (BP) is the outcome of interest to this study. As part of the biomarker collection process, respondents completed two or three seated blood pressure measures on their left arms. We used the mean of each respondent's BP readings based on prior studies of this measure in the NSHAP (Cornwell and Waite, 2012). Measures of BP were available for both Wave 1 and Wave 2. We included both systolic blood pressure (SBP) and hypertension as the dependent variables in our analyses. Following prior research on older adults (Kulminski et al. 2013), we used a log transformed SBP measure to adjust for its skewedness. Hypertension is defined as having BP (untransformed) above the clinical cut points (systolic ≥ 140 mmHg or diastolic ≥ 90 mmHg) or ever diagnosed with high BP by a medical doctor.
We included both the continuous and dichotomous measures of BP to test whether different dimensions of social relationships affect physiological functioning (measured by SBP) and disease risk (measured by hypertension) in similar or different ways. Because SBP is a measure of metabolic and cardiovascular functioning, our SBP analyses shed light on the ways in which social integration and support may affect physiological stress response. While younger patients are more prone to high diastolic BP, SBP is affected by increased arterial stiffness contributing to a high prevalence of systolic hypertension after middle-age (Franklin et al., 1997). Unlike diastolic BP, which has been found to remain constant or decline after age 50-60 years, SBP predominates and continues to increase in late life (Franklin et al., 1997; Burt et al., 1995). It has been found that SBP alone correctly classified hypertension status in 99% of individuals at older ages (Lloyd-Jones et al., 1999). Previous epidemiologic research further suggests that SBP is a much stronger predictor of subsequent vascular and other chronic disease events and mortality across the life course (Yang and Kozloski, 2012).
Our other outcome of interest—hypertension—is a measure of disease. Whereas SBP more directly measures physiological response on a continuum, hypertension reflects the status of BP by the clinical threshold. It thus involves both physiological processes and health-care related factors such as diagnosis and management. In this way, using hypertension as an outcome may inform us of factors that encourage individuals to undergo preventative screenings and contribute to disease management (Cornwell & Waite, 2012). The hypertension analyses thus attempt to improve understanding of how social relations affect disease onset, diagnosis, and management.
Social Relationship Measures
We measured social relationships using two composite scales. Social integration reflects the structural dimension of social relationships and indicates the number and nature of one's social ties. We measured social integration as a summary index of six measures of social connectedness: marital status, religious attendance, frequency of socializing with family and friends, frequency of volunteering, frequency of socializing with neighbors, and attendance at organized meetings. Social support measures the functional dimension of social connections and indicates how respondents feel about the quality of their social ties. The social support scale is a summary index of six measures of relationship quality: how often a respondent can open up to their spouse, family and friends; and how often a respondent can rely on their spouse, family, and friends. Both measures are consistent with those used in previous studies of social relationships and health (Berkman & Syme, 1979; Cornwell & Waite, 2009, 2012; Yang et al., 2013, 2014) and are further confirmed by a principle components analysis using oblique models. The social integration index comprised two factors (number of social ties with Eigen value=1.83; interaction with social ties with Eigen value=1.21) that explain 50.75% of the total variance. The social support scale comprised of two factors (spousal support with Eigen value=1.73; family/friend support with Eigen value=1.90) that explain 60.45% of the total variance. Each of the item-rest correlations for the individual measures employed in the scales exceeded the cutoff of 0.20, which is considered satisfactory for reliability (Kline, 1986). The social relationship scales were constructed using social relationship data collected at Wave 1. Detailed information about the construction of these scales can be found in Table 1. In addition to continuous measures, each scale is also included as a three-level categorical measure (1=low, 2=moderate, 3=high) to capture the non-linearity in their effects on the outcome variables.
Table 1. Content and Coding of Social Integration and Support Measures.
| Summary Scale | Item | Item coding | Scale coding |
|---|---|---|---|
| Social integration | Freq. socializing with family or friends | 1= ≥once a week; 0=otherwise | Sum of 6 items (0-6): |
| Marital status | 1=married/cohabitating; 0=otherwise | 1=low (0-1) | |
| Freq. socializing with neighbors | 1= ≥several times a month; 0=otherwise | 2=moderate (2-4) | |
| Freq. religious attendance | 1= ≥every week; 0=otherwise | 3=high (5-6) | |
| Freq. attending organized meetings | 1= ≥once a week; 0=otherwise | ||
| Freq. volunteering | 1= ≥once a month; 0=otherwise | ||
|
| |||
| Social support | How often can open up to spouse | 1=often; 0=some of the time or hardly ever | Sum of 6 items (0-6): |
| How often can rely on spouse | 1=often; 0=some of the time or hardly ever | 1=low (0-1) | |
| How often can open up to family | 1=often; 0=some of the time or hardly ever | 2=moderate (2-4) | |
| How often can rely on family | 1=often; 0=some of the time or hardly ever | 3=high (5-6) | |
| How often can open up to friends | 1=often; 0=some of the time or hardly ever | ||
| How often can rely on friends | 1=often; 0=some of the time or hardly ever | ||
Covariates
We adjusted for factors that have been associated with BP in previous research, including demographic characteristics (age, sex, and race), education, anti-hypertensive medication use, psychosocial stressors (perceived social stress and depressive symptoms), health behaviors (smoking, physical activity, and drinking), and physical conditions (BMI and diabetes). All covariates were assessed at Wave 1. In preliminary cross-sectional analyses using only baseline data, we also experimented with a broader definition of hypertension by including those using anti-hypertensive medication. The results are not sensitive to the choice of alternative definitions. Because information on medication at Wave 2 was not available at the time of analysis, we could not use this definition for the final longitudinal analyses. Controlling for medication at baseline, however, effectively takes into account its effect on change in BP and hypertension later in time. Additional information on the coding and distribution of all above measures can be found in Table 2.
Table 2. Sample Characteristics and Descriptive Statisticsa: NSHAP 2005-2011 (N = 1,264).
| All | Social Integration | Social Support | |||||||
|---|---|---|---|---|---|---|---|---|---|
|
| |||||||||
| Low (N=267) | Moderate (N=585) | High (N=412) | p-value b | Low (N=191 | Moderate (N=541) | High (N=532) | p-value b | ||
| Systolic BP (SBP) (mmHg), Mean(SD) 2005-2006 | 135.68 (20.21) | 138.67 (19.88) | 135.73 (20.91) | 133.77 (19.20) | 0.019 | 135.47 (20.02) | 137.27 (21.06) | 134.22 (19.31) | 0.076 |
| Systolic BP (SBP) (mmHg), Mean(SD) 2010-2011 | 137.19 (21.90) | 136.69 (21.46) | 137.92 (21.60) | 136.49 (22.48) | 0.664 | 139.66 (22.39) | 138.77 (22.91) | 134.83 (20.49) | 0.014 |
| Hypertension, %, 2005-2006 | 69.6 | 81.9 | 69.4 | 62.5 | <0.001 | 75.0 | 71.7 | 65.8 | 0.081 |
| Systolic BP ≥140 mmHg, % | 38.9 | 46.2 | 38.5 | 34.8 | 0.100 | 40.1 | 41.4 | 36.0 | 0.293 |
| Diastolic BP ≥ 90 mmHg, % | 24.0 | 30.8 | 22.9 | 21.2 | 0.060 | 26.4 | 23.8 | 23.3 | 0.839 |
| Ever diagnosed with high BP, % | 53.2 | 65.9 | 52.5 | 46.3 | <0.001 | 54.8 | 55.7 | 50.3 | 0.278 |
| Hypertension, %, 2010-2011 | 72.4 | 82.9 | 72.0 | 66.4 | 0.005 | 78.1 | 75.4 | 67.6 | 0.013 |
| Systolic BP ≥140 mmHg, % | 41.6 | 40.1 | 41.9 | 42.1 | 0.926 | 43.6 | 45.4 | 37.2 | 0.101 |
| Diastolic BP ≥ 90 mmHg, % | 19.7 | 23.1 | 20.3 | 16.7 | 0.210 | 21.8 | 18.5 | 20.2 | 0.730 |
| Ever diagnosed with high BP, % | 55.8 | 73.1 | 52.9 | 48.8 | <0.001 | 60.0 | 59.8 | 50.4 | 0.037 |
| Demographic Characteristics | |||||||||
| Age, Mean(SD) | 67.29 (7.79) | 66.15 (8.02) | 67.72 (7.87) | 67.41 (7.46) | 0.087 | 68.77 (8.82) | 68.00 (7.94) | 66.10 (7.09) | <0.001 |
| Sex (1= female), % | 53.0 | 46.2 | 51.5 | 59.3 | 0.066 | 52.4 | 49.4 | 56.7 | 0.147 |
| Race/Ethnicity, % | |||||||||
| White | 87.0 | 81.6 | 89.1 | 87.5 | 0.032 | 84.5 | 83.7 | 91.0 | 0.001 |
| Black | 7.1 | 10.4 | 4.7 | 8.5 | 7.5 | 8.8 | 5.4 | ||
| Hispanic | 5.9 | 8.0 | 6.2 | 4.1 | 8.0 | 7.5 | 3.6 | ||
| Education (1= BA degree or higher),% | 30.8 | 25.8 | 30.1 | 34.8 | 0.214 | 29.4 | 29.9 | 32.0 | 0.799 |
| Psychosocial Stressors | |||||||||
| Perceived social stress scale (range= 0 – 12), Mean(SD) | 1.53 (2.13) | 2.06 (2.43) | 1.50 (2.08) | 1.24 (1.94) | <0.001 | 2.71 (1.57) | 2.67 (2.07) | 1.09 (1.81) | <0.001 |
| Depressive symptoms (CES-D) (range = 0 – 27), Mean(SD) | 4.26 (4.36) | 5.75 (5.07) | 4.17 (4.38) | 3.46 (3.57) | <0.001 | 6.33 (5.29) | 4.29 (4.25) | 3.53 (3.87) | <0.001 |
| Health Behaviors | |||||||||
| Use of anti-hypertensive medications,% | 57.1 | 65.2 | 55.2 | 54.5 | 0.083 | 58.3 | 59.1 | 54.7 | 0.466 |
| Cigarette use (1=former/current smoker), % | 52.3 | 53.9 | 55.7 | 46.9 | 0.143 | 51.4 | 53.1 | 52.0 | 0.929 |
| Physical activity (1=3+ times/week), % | 67.6 | 56.0 | 64.7 | 78.7 | <0.001 | 62.1 | 68.1 | 69.0 | 0.321 |
| Alcoholic drinks per week, Mean(SD) | 3.18 (6.17) | 3.62 (6.97) | 3.56 (6.56) | 2.40 (4.95) | 0.006 | 3.30 (6.64) | 3.58 (6.83) | 2.75 (5.29) | 0.106 |
| Physical conditions | |||||||||
| Body mass index (BMI), Mean(SD) | 29.65 (6.32) | 30.94 (6.72) | 29.38 (6.62) | 29.22 (5.52) | 0.011 | 29.59 (5.64) | 29.82 (6.71) | 29.51 (6.14) | 0.671 |
| Diabetes (1=diabetic), % | 17.3 | 20.9 | 13.7 | 19.9 | 0.143 | 16.2 | 17.7 | 17.3 | 0.927 |
Survey design adjusted and weighted to account for the probability of selection, with post-stratification adjustments for nonresponse
p-value of t test or chi-squared test of difference in means between individuals with low, moderate, and high levels of social integration and support
Note: BP measures are untransformed; covariates including demographics, psychosocial stressors, health behaviors, and physical conditions were assessed at baseline in 2005-6.
Methods
In descriptive analyses, we compared sample characteristics across levels of social relationship measures using t test and chi-squared test. We conducted both cross-sectional and longitudinal multivariate analyses. First, we examined the associations between the social relationship measures, including social integration and social support, and BP measures at Wave 1. We estimated the OLS regression models for log SBP and logistic regression models for hypertension. Next, we employed longitudinal residual change models, also referred to as lagged dependent variable models (Allison, 1990; Halaby, 2004), to examine the effects of social integration and social support at baseline on changes in BP measures over time. In these models, we regressed BP measures at Wave 2 on BP measures at Wave 1 and social relationship measures at Wave 1.
We estimated models in a stepwise fashion: 1) basic models including BP measures and covariates at baseline; 2) models that added social integration; 3) models that added social support; and 4) final models that included social integration, social support, and all covariates. The presence of both structural and functional dimensions of social relationship allowed us to further assess potential mediating or moderating effect. Social support may mediate the effects of social integration in that greater integration can provide the support that results in health benefits. We tested the hypothesized mediating effect using the Sobel-Goodman mediation test (Sobel 1982, 1986). According to this test, mediation occurs when (1) the independent variable (social integration) significantly affects the mediator (social support), (2) the independent variable (social integration) significantly affects the dependent variable (BP) in the absence of the mediator (social support), (3) the mediator (social support) has a significant unique effect on the dependent variable (BP), and (4) the effect of the independent variable (social integration) on the dependent variable (BP) shrinks upon the addition of the mediator (support) to the model. We further compared goodness-of-fit statistics across models for each outcome. A moderating effect suggests that social support would be more (or less) beneficial for those who lacked (or had sufficient) social integration. We tested this by including interaction terms between social integration and social support. The choice of continuous and categorical measures of social relationship variables was based on test of statistical significance for the coefficient estimates and model fit statistics.
All analyses were conducted in Stata 12 and adjusted for survey design effects and nonresponse using sampling weights.
Results and Findings
Descriptive Statistics
Although elevated BP and hypertension were quite common in this sample of older adults, Table 2 shows a clear gradient in BP measures by social relationship status. Those with the highest levels of integration and support were substantially different from those with low levels of integration and support at baseline in terms of their BP profiles at both baseline and the follow up and other characteristics at baseline such as demographic characteristics, levels of psychosocial stress, health behaviors, and physical conditions. First, there appeared negative bivariate associations between social integration and BP measures, with less integrated individuals having significantly higher SBP in Wave 1 (p = 0.019) and higher rates of hypertension (p < 0.001) in both Waves 1 and 2 than more integrated individuals. The difference in rates of hypertension was particularly large. For instance, 82.9% of those with low social integration had hypertension at Wave 2, compared to 66.4% of those with high social integration. Individuals with lower levels of integration were more likely to be men, (p = 0.066), Black or Hispanic (p = 0.032), reported higher levels of perceived social stress (p < 0.001) and more depressive symptoms (p < 0.001), had less physical activity (p < 0.001), more alcoholic drinks (p = 0.006), and higher BMIs (p = 0.011) than more integrated individuals.
Similar health disparities were present by level of social support. Compared to individuals with higher levels of support, those with low support at baseline had significantly higher SBP and were more likely to have hypertension in both waves. In contrast to the results for social integration, the gradient in SBP by social support was larger and more significant at Wave 2 (p = 0.014) than at Wave 1 (p = 0.081). The gradient in hypertension rates by social support levels was less pronounced in magnitude than that by social integration but nonetheless statistically significant at both waves. Older individuals (p < 0.001) and Blacks and Hispanics (p = 0.001) reported significantly less support than younger respondents and Whites, respectively. Low support was also positively associated with perceived stress (p < 0.001) and depressive symptoms (p < 0.001). No differences in health behaviors or physical conditions were significant across levels of social support.
Cross-sectional Models
The results of cross-sectional analyses show associations between the two social relationship measures with log SBP and hypertension risk at Wave 1 that are largely consistent with those in descriptive analyses. The use of categorical variables of social relationships yielded more statistically significant coefficient estimates as well as better model fit than continuous measures. Figure 1 displays the corresponding results in terms of predicted BP outcomes by three levels of social integration and social support, adjusting for age, sex, race, and anti-hypertensive medication. Higher social integration was associated with significantly lower log SBP (Figure 1A: β = 0.035, p = 0.011), a pattern not replicated for social support in Figure 1B. While both higher social integration and social support were associated with lower risk of hypertension, the association was much greater and more significant for social integration. Compared to the most socially integrated, those with the lowest level of integration were more than twice as likely (Odds Ratio {OR} = 2.72, [95% Confidence Interval {CI}]= [1.75, 4.21], p < 0.001) to be hypertensive (Figure 1C). Social support was less related to hypertension risk as social integration (Figure 1D). The difference between low and moderate support groups was not statistically significant, but between moderate and high support groups the difference was marginally significant (OR [95%CI] = 1.29 [0.96, 1.75], p = 0.094).
Figure 1. Social Integration, Social Support, and Predicted BP Outcomes with 95% Confidence Intervals (CI): Cross-sectional Associations at Wave 1.
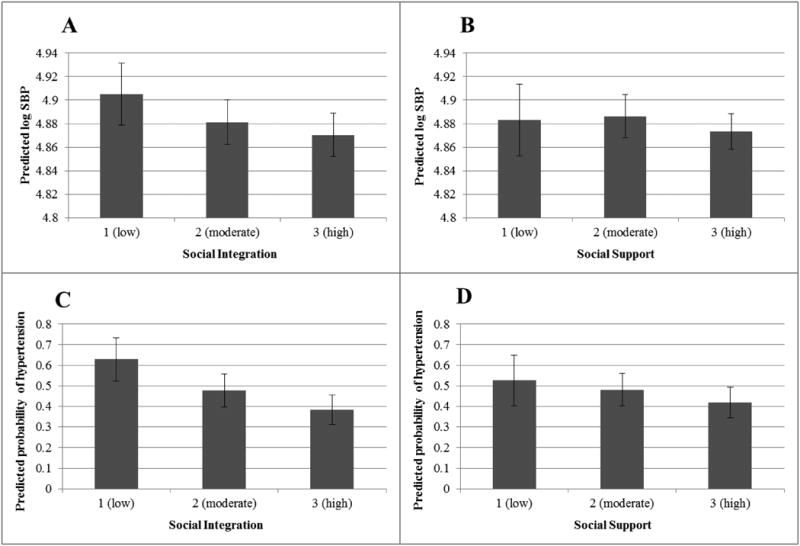
Note: Figures based on Wave 1 models that adjust for age, sex, race, and anti-hypertensive medication use; model estimates survey design adjusted and weighted to account for the probability of selection, with poststratification adjustments for nonresponse.
Longitudinal Models
Compared to cross-sectional associations at baseline, results from the longitudinal analyses provide new findings regarding the nature and specificity of these associations to different BP outcomes.
Table 3 displays the results of the longitudinal models of log SBP. Model 1 adjusting only for covariates at baseline shows the strong effect of SBP at Wave 1 on SBP at Wave 2 that trumped all other risk factors commonly assessed in prior cross-sectional studies. In contrast to the significant cross-sectional association between social integration and log SBP at baseline, Model 2 indicates no significant effect of social integration on change in log SBP from baseline to the follow-up. Model 3 shows that compared to individuals with the highest level of social support, individuals with the lowest level of support at Wave 1 experienced a moderate increase in log SBP from Wave 1 to Wave 2 (β = 0.030, p = 0.051). When social integration and social support were entered jointly into Model 4, the effect of social support on SBP change increased. As shown in Figure 2A, respondents with low and moderate levels of support had greater increases in log SBP than those with the highest level of support, with the increases being the largest for those at the lowest level of support (β = 0.034, p = 0.027). We note that in these models that include social relationship measures, only two covariates (age and BMI) frequently examined in previous cross-sectional studies as risk factors for hypertension show any significant prospective associations with change in log SBP.
Table 3. Associations between Social Relationship Characteristics and Change in Log SBP: NSHAP 2005-2011 (N = 1,264).
| Variable | Model 1 Coefficient (SE) |
Model 2 Coefficient (SE) |
Model 3 Coefficient (SE) |
Model 4 Coefficient (SE) |
|---|---|---|---|---|
| log SBP at Wave 1 | 0.462*** (0.032) | 0.463*** (0.033) | 0.460*** (0.032) | 0.463*** (0.033) |
| Social Integration (reference = 3 (high)) | ||||
| 1 (low) | -0.007 (0.014) | -0.015 (0.014) | ||
| 2 (moderate) | 0.008 (0.013) | 0.006 (0.012) | ||
| Social Support (reference = 3 (high)) | ||||
| 1 (low) | 0.030† (0.015) | 0.034* (0.015) | ||
| 2 (moderate) | 0.017 (0.010) | 0.018† (0.010) | ||
| Age | 0.001** (0.0005) | 0.001* (0.0005) | 0.001* (0.0005) | 0.001† (0.0005) |
| Sex (1=female) | 0.0003 (0.008) | 4.49E-05 (0.008) | 0.001 (0.008) | 0.001 (0.008) |
| Race (reference = White) | ||||
| Black | 0.021 (0.023) | 0.022 (0.022) | 0.019 (0.022) | 0.020 (0.021) |
| Hispanic | 0.025 (0.018) | 0.026 (0.017) | 0.021 (0.018) | 0.022 (0.018) |
| Antihypertensive meds at Wave 1 (1=yes) | -0.016 (0.011) | -0.015 (0.011) | -0.015 (0.011) | -0.014 (0.011) |
| Education (1=BA degree or higher) | 0.015 (0.011) | 0.015 (0.011) | 0.014 (0.011) | 0.014 (0.011) |
| Perceived social stress scale | 0.0008 (0.002) | 0.001 (0.002) | -2.71E-04 (0.002) | -2.81E-04 (0.002) |
| Depressive symptoms (CES-D) | -0.0005 (0.001) | -3.53E-04 (0.001) | -0.001 (0.001) | -0.001 (0.001) |
| Cigarette use (1= former/current smoker) | -0.002 (0.011) | -0.002 (0.011) | -0.002 (0.011) | -0.003 (0.011) |
| Physical activity (1=3+ times per week) | -0.0004 (0.011) | -1.63E-04 (0.011) | -3.61E-04 (0.011) | -0.001 (0.011) |
| Alcoholic drinks per week | -0.0005 (0.0006) | -4.770E-04 (6.22E-04) | -0.001 (6.29E-04) | -0.001 (6.23E-04) |
| Body mass index (BMI) | -0.001† (0.0008) | -0.001† (7.71E-04) | -0.001† (7.65E-04) | -0.001† (7.61E-04) |
| Diabetes (1=diabetic) | 0.010 (0.018) | 0.011 (0.017) | 0.011 (0.017) | 0.012 (0.017) |
| Intercept | 2.593*** (0.160) | 2.587*** (0.162) | 2.613*** (0.160) | 2.605*** (0.161) |
|
| ||||
| Model Fit | ||||
| R2 | 0.197 | 0.199 | 0.202 | 0.205 |
p<0.001,
p<0.01,
p<0.05,
p<0.1 (two-tailed test)
Notes: Unweighted N=1264; model estimates survey design adjusted and weighted to account for the probability of selection, with poststratification adjustments for nonresponse
Figure 2. Social Support, Social Integration, and Predicted Change in BP Outcomes from Wave 1 to Wave 2 with 95% CIs.
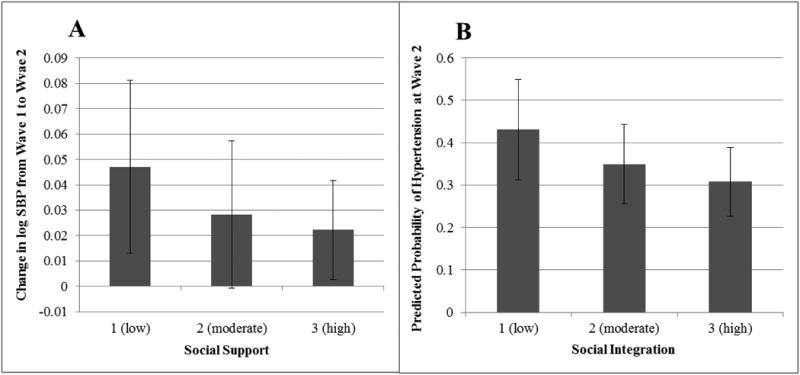
Note: Figures based on longitudinal models that adjust for age, sex, race, anti-hypertensive medication use, education, perceived social stress, depressive symptoms, smoking, physical activity, drinking, BMI, and diabetes; model estimates survey design adjusted and weighted to account for the probability of selection, with poststratification adjustments for nonresponse. Hypertension results reflect the predicted probability of hypertension at Wave 2 for individuals without hypertension at Wave 1.
Table 4 presents the results of the longitudinal hypertension models. We found that while both social integration and social support protected against the increase in hypertension risk individually, social integration had a stronger and more significant effect that may be mediated by social support. Model 2 shows that compared to the most socially integrated, respondents with the lowest level of integration at Wave 1 had a 75.3% increase (95% CI = [1.04, 2.95], p = 0.036) in risk of hypertension from Wave 1 to 2. Note that with an interval of six years for an elderly sample, an effect of change in hypertension risk of this size was fairly large. As illustrated in Figure 2B, among those who were not hypertensive at Wave 1, those with higher levels of social integration were less likely to develop hypertension from baseline to follow-up than those with lower levels of social integration. Model 3 shows that social support also reduced the risk of hypertension, but the effect is nonlinear. While the increase in hypertension risk was not statistically significant for respondents with low support, respondents with moderate support had a 33.6% (95% CI=[ 0.95, 1.87]) increase in risk of hypertension that was marginally significant (p = 0.092) compared to those with high social support. When social integration and social support are simultaneously included in Model 4, the effect of social support no longer holds, whereas low social integration continues to predict a significantly higher hypertension risk. In both Tables 3 and 4, while the vast majority of variances were explained by the lagged dependent variables (BP measures at Wave 1), the additions of social relationship variables slightly increased the model fit. The result from the Sobel-Goodman test further suggests that conditions 1), 2), and 4) were met such that the effect of social integration on hypertension is partially mediated by social support. Specifically, we found that social integration significantly affects social support (p < 0.001); that social integration significantly affects hypertension, in the absence of social support (as indicated in Model 2 of Table 4); and that the effect of social integration on hypertension is reduced with the addition of support into the models (the OR for “low integration” decreases from 1.75 to 1.65 from Model 2 to Model 4 in Table 4). Because social support coefficients were not strongly significant in Model 3, condition 3) failed to achieve statistical significance (p = 0.175). The mediation effect, in this sense, exists in a weak form statistically. The interaction effects between social integration and support variables were not statistically significant in any analyses and thus omitted from the final models. Similar to the SBP models, few other covariates show significant prospective associations with hypertension risk. Aside from taking anti-hypertensive medication, social integration was the only significant factor to affect change in hypertension risk from Wave 1 to Wave 2.
Table 4. Associations between Social Relationship Characteristics and Change in Risk of Hypertension: NSHAP 2005-2011 (N = 1,264).
| Variable | Model 1 OR (95% CI) |
Model 2 OR (95% CI) |
Model 3 OR (95% CI) |
Model 4 OR (95% CI) |
|---|---|---|---|---|
| Hypertension at Wave 1 (1=yes) | 11.16*** (6.85 - 18.17) | 10.72*** (6.51 - 17.65) | 11.11*** (6.86 - 17.98) | 10.74*** (6.57 - 17.58) |
| Social Integration (reference = 3 (high)) | ||||
| 1 (low) | 1.75* (1.04 - 2.95) | 1.65† (0.99 - 2.76) | ||
| 2 (moderate) | 1.23 (0.79 - 1.91) | 1.20 (0.78 - 1.85) | ||
| Social Support (reference = 3 (high)) | ||||
| 1 (low) | 1.46 (0.79 - 2.68) | 1.30 (0.71 - 2.37) | ||
| 2 (moderate) | 1.34† (0.95 - 1.87) | 1.29 (0.92 - 1.81) | ||
| Age | 1.00 (0.98 - 1.02) | 1.00 (0.98 - 1.03) | 1.00 (0.97 - 1.02) | 1.00 (0.98 - 1.03) |
| Sex (1=female) | 1.03 (0.72 - 1.48) | 1.08 (0.77 - 1.52) | 1.06 (0.74 - 1.51) | 1.10 (0.79 - 1.54) |
| Race (reference = White) | ||||
| Black | 1.52 (0.75 - 3.08) | 1.49 (0.76 - 2.93) | 1.46 (0.72 - 2.96) | 1.44 (0.74 - 2.83) |
| Hispanic | 1.25 (0.68 - 2.30) | 1.19 (0.65 - 2.17) | 1.17 (0.63 - 2.18) | 1.13 (0.61 - 2.09) |
| Antihypertensive meds at Wave 1 (1=yes) | 1.64** (1.17 - 2.31) | 1.64** (1.17 - 2.29) | 1.65** (1.16 - 2.33) | 1.64** (1.17 - 2.31) |
| Education (1=BA degree or higher) | 1.00 (0.70 - 1.43) | 1.01 (0.70 - 1.44) | 0.99 (0.69 - 1.41) | 1.00 (0.70 - 1.43) |
| Perceived social stress scale | 1.00 (0.90 - 1.12) | 1.00 (0.90 - 1.12) | 0.99 (0.88 - 1.11) | 0.99 (0.88 - 1.12) |
| Depressive symptoms (CES-D) | 1.02 (0.97 - 1.07) | 1.01 (0.96 - 1.06) | 1.02 (0.97 - 1.07) | 1.01 (0.96 - 1.06) |
| Cigarette use (1= former/current smoker) | 1.22 (0.85 - 1.75) | 1.20 (0.83 - 1.72) | 1.21 (0.85 - 1.74) | 1.19 (0.83 - 1.71) |
| Physical activity (1=3+ times per week) | 1.01 (0.66 - 1.55) | 1.07 (0.70 - 1.64) | 1.02 (0.66 - 1.58) | 1.07 (0.69 - 1.65) |
| Alcoholic drinks per week | 0.98 (0.96 - 1.01) | 0.98 (0.95 - 1.01) | 0.98 (0.95 - 1.01) | 0.98 (0.95 - 1.01) |
| Body mass index (BMI) | 0.97 (0.94 - 1.01) | 0.97 (0.94 - 1.01) | 0.97 (0.94 - 1.01) | 0.97 (0.94 - 1.01) |
| Diabetes (1=diabetic) | 1.37 (0.92 - 2.05) | 1.40 (0.92 - 2.12) | 1.38 (0.93 - 2.05) | 1.40 (0.93 - 2.11) |
| Intercept | 0.76 (0.08 - 7.40) | 0.56 (0.06 - 5.67) | 0.84 (0.08 - 8.19) | 0.63 (0.06 - 6.40) |
|
| ||||
| Model Fit | ||||
| Log-likelihood | -565.49*** | -563.19*** | -565.22*** | -563.03*** |
| Psuedo R-squared | 0.231 | 0.234 | 0.232 | 0.235 |
p<0.001,
p<0.01,
p<0.05,
p<0.1 (two-tailed test)
Notes: Unweighted N=1264; model estimates survey design adjusted and weighted to account for the probability of selection, with poststratification adjustments for nonresponse.
Discussion
Previous research has clearly linked social relationship characteristics with various health outcomes in late life. However, much of the evidence is confined to one dimension of social relations, self-reported instead of objective assessments of physical functioning, and cross-sectional associations due to the lack of repeated longitudinal measures of biomarkers. This study used longitudinal data on a nationally representative sample of older adults in the United States to examine the relationships between social integration and social support and change in blood pressure measures over a six-year period. It reveals new knowledge about the physiological impacts of social relationships over time that elucidates important biological mechanisms underlying the social gradient in health at older ages.
Our study assessed quantitative and qualitative dimensions of social relations individually and simultaneously in connection to BP. Consistent with previous findings on links between social relationships and general health, our study found associations of low social integration and low social support with deleterious BP outcomes. The findings differ, however, by study design, dimension of social relationships, and biomarker outcomes. In cross-sectional analyses it appeared that low social integration was much more strongly associated with both higher SBP and hypertension rates than low social support. These cross-sectional findings suggest an important role of social network size relative to appraisal of relationship quality in shaping health risk as suggested by some recent studies (Stringhini et al., 2012; Yang et al., 2013). It may also suggest that those who were experiencing worsening blood pressure levels had smaller social networks via reverse causation. The longitudinal analysis of change in systolic BP and hypertension risk helped to sort out some of these relationships.
In longitudinal analyses we found that perceived social support is the predominant factor affecting change in SBP, whereas social integration is the predominant factor affecting change in risk of hypertension. In addition, the test of net effects when both dimensions of social relationships are considered shows the interrelatedness of these concepts and illuminates the role of social support. Low social support had a significant impact on elevating SBP independent of low social integration. That is, perception of instrumental and functional social support was more important than the number of social connections in regulating SBP. The larger number of social connections reduced risks of hypertension over time, and its effects may operate partially through increased social support from these connections. The test for mediation effect of social support shows that mediation exists in a weak form statistically. The lack of significant interaction effects between the two indicates no moderation effect, or that their effects are additive rather than conditional.
The different findings in longitudinal analysis of SBP and hypertension change further suggests the specificity of the biological mechanisms through which social relationship variables affect physical health markers. We included both a continuous measure of BP and dichotomous measure of hypertension because they bear different biological meanings. The significant associations between social support and the continuous measure of BP suggest that more positive appraisals or better support from network members, regardless of the size of network ties, may dampen physiological arousal in response to social stressors and improve physiological functioning such as that manifest in decreases in SBP values along a continuum. In fact, Table 2 reveals that those with higher levels of support had lower SBP than those with lower levels of support at both Wave 1 and Wave 2. It is likely that the SBP impact of social support operates through psychosocial processes. Table 2 shows, for example, that those with greater social support reported significantly lower levels of perceived stress and depressive symptoms than those with less social support.
Large social networks or greater social integration, on the other hand, may offer protection against the manifestation of clinically significant, deleterious disease outcomes, such as hypertension. The result in Table 4 that social support mediated the impacts of social integration suggests that people who were more socially integrated were less likely to suffer from hypertension partly because they tended to enjoy higher quality of relations or support that was shown to be effective for lowering SBP. In addition to social support, social integration can operate to reduce hypertension risk further through socially transmittable behavioral mechanisms. Table 2 indicates that those with higher levels of integration engaged in more physical activities, had fewer alcoholic beverages, and had lower BMIs than those less integrated. By contrast, those with varying degrees of perceived support did not differ in these behavioral risk factors for hypertension. There are likely other behaviors not captured by the survey used in this study that could play a role. What the available data did show is that mere embeddedness in larger social networks may confer substantial health benefits. It can provide most effective means of promoting preventative behaviors among network members that directly contribute to lower rates of onset or better treatment and control of the disease condition.
In sum, with both cross-sectional and longitudinal study designs we can begin to understand the interdependent mechanisms involved in structural and functional sources of social support in relation to a physiological health measure and disease risk such as blood pressure. Structural social support through social connectedness and number of social ties is a necessary condition for promoting health, because without social connections, the functional aspects of social support are not possible. Our findings demonstrate this in both cross-sectional and longitudinal analyses. However, over and above the presence of social connections, the functional dimensions of social support are important as well, for our results show that part of the beneficial effect of having social connections operates through how these connections promote physiological functioning and present disease risk. Thus, having social connections is a necessary but not sufficient condition, because what one gets from social connections in terms of health knowledge and behavior matters as well. While both dimensions of social relationships were associated with self-reported general health outcomes in cross-sectional data, our research is the first to test how they may operate independently and jointly to affect change in an objectively measured marker of cardiovascular health over time.
It is noteworthy that although the descriptive analysis show significant bivariate associations between most covariates included in the study and the BP outcomes, the multivariate analyses show few of them to significantly affect BP changes over time. Aside from taking anti-hypertensive medication, social integration and social support at baseline had the greatest effects on BP changes, effects that outweighed common biobehavioral indicators of physical health such as age and BMI and were of considerable sizes in the change models (75% to 65% increases in hypertension risks for the lowest social integration group in Table 4). This is powerful longitudinal evidence that highlights the critical nature of social relationships in protecting against increases in BP and disease onset at older ages, independent of other well-known risk factors. These findings emphasize the essential importance of considering social relationships in future studies of physiological indicators of health as individuals age. That the residual effects of social relationship measures remained significant in the final models that adjust for all covariates, however, also suggests the need for more psychosocial, behavioral, or biological mechanisms to consider in future studies.
There are several other limitations to this study that invite future investigations. First, residual change models, while widely used in longitudinal analyses (e.g., Yang & George, 2005; Umberson et al., 2014), are not without limitations. In particular, the chief threat to causal inference in these models comes from unobserved variables, where the relationship between the individual error term and the outcome measured at Wave 1 remains unknown (Halaby, 2004). To confirm the robustness of the results from the residual change models, we ran supplementary multinomial logistic regression analyses for the outcome of hypertension, where change in hypertension status was modeled as a four category outcome: never hypertensive; no hypertension at Wave 1 to hypertensive at Wave 2; hypertensive at Wave 1 to no hypertension at Wave 2; and always hypertensive. The results of the supplementary analyses were substantively consistent with the residual change models, suggesting that our findings are robust to alternative modeling strategies. Nevertheless, the results of the residual change models presented in Tables 3 and 4 should be interpreted in the context of their potential limitations. Second, while we found evidence for longitudinal associations between social relations and change in BP outcomes over time, the evidence is constrained by the data design that includes a relatively small sample followed up once for only a few years. The older adults in the sample were homogeneous in BP measures at baseline and had lower SBP values and hypertension rates than those with missing data. The slightly truncated range of the outcome variables could have minimized changes or variation over the six-year interval, although we found a remarkably large effect of low social integration on hypertension risk (a 75% increase) even in this context. In addition, the analytic sample had higher SES and was healthier in general. While the use of sample weights still resulted in national estimates, the findings are conservative and need to be corroborated in future studies of other large population based samples assessed at multiple time points spanning a longer follow-up period. Third, the biomarkers included are rather limited due to lack of availability in both waves. It was suggested that a broader spectrum of markers of physiological dysregulation across multiple bodily systems can better characterize biological stress response in aging adults (Seeman et al., 2001) and thus would be more informative of the intertwining of social and biological variations over the life course (Yang and Kozloski, 2011). Finally, because social relationship measures we used include a comprehensive set of variables for which repeated measures are currently not available for Wave 2, we could not assess the extent to which these measures are good indicators of long-term relationship quantity and quality. We are also limited in the ability to model the cumulative effects of long-term relationship characteristics on BP state across time. Future availability of longitudinal data incorporating repeated assessments of both social and biomarker variables is essential to elucidate the complex pathways underlying this and other similar biosocial linkages.
In conclusion, the significance of the problem we have studied and the findings we have reached can be better comprehended in the larger demographic and epidemiologic context. As the population in the U.S. continues to age, the effective prevention, treatment, and control of chronic diseases remain essential to preserving the health and well-being of the nation. Approximately 2 in 3 older adults in the U.S. have high blood pressure, putting a large and growing proportion of the old age population at increased risk for a range of health problems, including cardiovascular disease, heart attack, stroke, kidney disease, and death. This study finds that social relationships may reduce physiological stress response, promote healthy behaviors, and in turn prevent or delay hypertensive disease onset as individuals age. The development and maintenance of robust, supportive networks may thus be critical to promoting healthy aging.
Acknowledgments
This research is supported by National Institute of Aging grant number K01AG036745 and University Cancer Research Funds at the Lineberger Cancer Center (to the first author). We are grateful for the general support from the Carolina Population Center (R24 HD050924), University of North Carolina at Chapel Hill.
References
- Allison PD. Change scores as dependent variables in regression analysis. Sociological Methodology. 1990:93–114. doi: 10.2307/271083. [DOI] [Google Scholar]
- Berkman LF, Glass T, Brissette I, Seeman TE. From social integration to health: Durkheim in the new millennium. Social Science & Medicine. 2000;51(6):843–857. doi: 10.1016/s0277-9536(00)00065-4. [DOI] [PubMed] [Google Scholar]
- Berkman LF, Syme L. Social Networks, Host Resistance, and Mortality: A Nine-year Follow-up Study of Alameda County Residents. American Journal of Epidemiology. 1979;109(2):186–204. doi: 10.1093/oxfordjournals.aje.a112674. [DOI] [PubMed] [Google Scholar]
- Berkman LF, Vaccarino V, Seeman T. Gender Differences in Cardiovascular Morbidity and Mortality: The Contributions of Social Networks and Support. Annals of Behavioral Medicine. 1993;15(2-3):112–118. [Google Scholar]
- Brummett BH, Barefoot JC, Siegler IC, Clapp-Channing NE, Lytle BL, Bosworth HB, Williams Redford B, Mark DB. Characteristics of socially isolated patients with coronary artery disease who are at elevated risk for mortality. Psychosomatic Medicine. 2001;63(2):267–272. doi: 10.1097/00006842-200103000-00010. [DOI] [PubMed] [Google Scholar]
- Burt VL, Whelton P, Roccella EJ, Brown C, Cutler JA, Higgins M, Horan MJ, Labarthe D. Prevalence of hypertension in the US adult population: Results from the Third National Health and Nutrition Examination Survey, 1988-1991. Hypertension. 1995;25(3):305–313. doi: 10.1161/01.HYP.25.3.305. [DOI] [PubMed] [Google Scholar]
- Cacioppo JT, Hawkley LC, Crawford LE, Ernst JM, Burleson MH, Kowalewski RB, Malarkey WB, Van Cauter E, Berntson GG. Loneliness and health: Potential mechanisms. Psychosomatic Medicine. 2002;64(3):407–417. doi: 10.1097/00006842-200205000-00005. [DOI] [PubMed] [Google Scholar]
- Cassel J. The contribution of the social environment to host resistance. American Journal of Epidemiology. 1976;104:107–123. doi: 10.1093/oxfordjournals.aje.a112281. [DOI] [PubMed] [Google Scholar]
- Christou DD, Jones PP, Jordan J, Diedrich A, Robertson D, Seals RD. Women have lower tonic autonomic support of arterial blood pressure and less effective baroreflex buffering than men. Circulation. 2005;111:494–498. doi: 10.1161/01.CIR.0000153864.24034.A6. [DOI] [PubMed] [Google Scholar]
- Cobb S. Social support as a moderator of life stress. Psychosomatic Medicine. 1976;38(5):300. doi: 10.1097/00006842-197609000-00003. [DOI] [PubMed] [Google Scholar]
- Cohen SD, William J, Skoner DP, Rabin BS, Gwaltney JM., Jr Social ties and susceptibility to the common cold. JAMA: the journal of the American Medical Association. 1997;277(24):1940–1944. doi: 10.1001/jama.1997.03540480040036. [DOI] [PubMed] [Google Scholar]
- Cornwell B, Laumann EO, Schumm LP. The social connectedness of older adults: a national profile. American Sociological Review. 2008;73(2):185. doi: 10.1177/000312240807300201. [DOI] [PMC free article] [PubMed] [Google Scholar]
- Cornwell EY, Waite LJ. Disconnectedness, Perceived Isolation, and Health among Older Adults. Journal of Health and Social Behavior. 2009;50(1):31–48. doi: 10.1177/002214650905000103. [DOI] [PMC free article] [PubMed] [Google Scholar]
- Cornwell EY, Waite LJ. Social Network Resources and Management of Hypertension. Journal of Health and Social Behavior. 2012;53:215–231. doi: 10.1177/0022146512446832. [DOI] [PMC free article] [PubMed] [Google Scholar]
- Dean A, Kolody B, Wood P, Matt G. The influence of living alone on depression in elderly persons. Journal of Aging and Health. 1992;4(1):3–18. doi: 10.1177/089826439200400101. [DOI] [Google Scholar]
- Eng PM, Rimm EB, Fitzmaurice G, Kawachi I. Social Ties and Change in Social Ties in Relation to Subsequent Total and Cause-Specific Mortality and Coronary Heart Disease in Men. American Journal of Epidemiology. 2002;155(8):700–709. doi: 10.1093/aje/155.8.700. [DOI] [PubMed] [Google Scholar]
- Franklin SS, Gustin W, Wong ND, Larson MG, Weber MA, Kannel WB, Levy D. Hemodynamic patterns of age-related changes in blood pressure: The Framingham Heart Study. Circulation. 1997;96(1):308–315. doi: 10.1161/01.CIR.96.1.308. [DOI] [PubMed] [Google Scholar]
- George LK, Blazer DG, Hughes DC, Fowler N. Social support and the outcome of major depression. The British Journal of Psychiatry. 1989;154(4):478–485. doi: 10.1192/bjp.154.4.478. [DOI] [PubMed] [Google Scholar]
- Haines Valerie A, Hurlbert Jeanne S. Network range and health. Journal of Health and Social behavior. 1992;33:254–266. doi: 10.2307/2137355. [DOI] [PubMed] [Google Scholar]
- Halaby CN. Panel Models in Sociological Research: Theory into Practice. Annual Review of Sociology. 2004;30:507–544. [Google Scholar]
- Hawkley LC, Masi CM, Berry JD, Cacioppo JT. Loneliness Is a Unique Predictor of Age-Related Differences in Systolic Blood Pressure. Psychology and Aging. 2006;21(1):152–164. doi: 10.1037/0882-7974.21.1.152. [DOI] [PubMed] [Google Scholar]
- Heikkinen RL, Kauppinen M. Depressive symptoms in late life: a 10-year follow-up. Archives of gerontology and geriatrics. 2004;38(3):239–250. doi: 10.1016/j.archger.2003.10.004. [DOI] [PubMed] [Google Scholar]
- Holt-Lunstad J, Smith TB, Layton JB. Social relationships and mortality risk: a meta-analytic review. PLoS medicine. 2010;7(7):e1000316. doi: 10.1371/journal.pmed.1000316. [DOI] [PMC free article] [PubMed] [Google Scholar]
- House JS, Landis KR, Umberson D. Social Relationships and Health. Science. 1988;241(4865):540–545. doi: 10.1126/science.3399889. [DOI] [PubMed] [Google Scholar]
- Hu Y, Goldman N. Mortality differentials by marital status: an international comparison. Demography. 1990;27(2):233–250. doi: 10.2307/2061451. [DOI] [PubMed] [Google Scholar]
- Hughes M, Gove WR. Living alone, social integration, and mental health. American Journal of Sociology. 1981;87(1):48–74. doi: 10.1086/227419. [DOI] [PubMed] [Google Scholar]
- Kiecolt-Glaser JK, Gouin JP, Hantsoo L. Close relationships, inflammation, and health. Neuroscience & Biobehavioral Reviews. 2010;35(1):33–38. doi: 10.1016/j.neubiorev.2009.09.003. [DOI] [PMC free article] [PubMed] [Google Scholar]
- Kline P. A handbook of test construction: Introduction to psychometric design. New York: Methuen; 1986. [Google Scholar]
- Kulminski AM, Arbeev KG, Christensen K, Stallard E, Miljkovic I, Barmada M, Yashin AI. Biogenetic mechanisms predisposing to complex phenotypes in parents may function differently in their children. The Journals of Gerontology Series A: Biological Sciences and Medical Sciences. 2013;68(7):760–768. doi: 10.1093/gerona/gls243. [DOI] [PMC free article] [PubMed] [Google Scholar]
- Litwak E, Messeri P, Wolfe S, Gorman S, Silverstein M, Guilarte M. Organizational theory, social supports, and mortality rates: A theoretical convergence. American Sociological Review. 1989;54:49–66. doi: 10.2307/2095661. [DOI] [Google Scholar]
- Lloyd-Jones DM, Evans JC, Larson MG, O'Donnell CJ, Levy D. Differential impact of systolic and diastolic blood pressure level on JNC-VI staging. Hypertension. 1999;34(3):381–385. doi: 10.1161/01.HYP.34.3.381. [DOI] [PubMed] [Google Scholar]
- Magaziner J, Cadigan DA, Hebel JR, Parry RE. Health and living arrangements among older women: does living alone increase the risk of illness. Journal of gerontology. 1988;43(5):M127–M133. doi: 10.1093/geronj/43.5.M127. [DOI] [PubMed] [Google Scholar]
- Maier SF, Watkins LR. Cytokines for psychologists: implications of bidirectional immune-to-brain communication for understanding behavior, mood, and cognition. Psychological Review. 1998;105(1):83. doi: 10.1037/0033-295X.105.1.83. [DOI] [PubMed] [Google Scholar]
- Marsden PV, Friedkin NE. Network studies of social influence. Sociological Methods Research. 1993;22(1):127–151. doi: 10.1177/0049124193022001006. [DOI] [Google Scholar]
- McClintock MK, Conzen SD, Gehlert S, Masi C, Olopade F. Mammary Cancer and Social Interactions: Identifying Multiple Environments That Regulate Gene Expression Throughout the Life Span. The Journals of Gerontology Series B: Psychological Sciences and Social Sciences. 2005;60(Special Issue 1):32–41. doi: 10.1093/geronb/60.Special_Issue_1.32. [DOI] [PubMed] [Google Scholar]
- McEwen BS. Stress, Adaptation, and Disease - Allostasis and Allostatic Load. Annals of the New York Academy of Sciences. 1998;840(1):33–44. doi: 10.1111/j.1749-6632.1998.tb09546.x. [DOI] [PubMed] [Google Scholar]
- Merton RK, Rossi AS. Contributions to the theory of reference group behavior. In: Merton RK, editor. Social theory and social structure. New York:NY: Free Press; 1968. pp. 279–334. [Google Scholar]
- O'Muircheartaigh C, Eckman S, Smith S. Statistical design and estimation for the national social life, health, and aging project. The Journals of Gerontology Series B: Psychological Sciences and Social Sciences. 2009;64(suppl 1):i12–i19. doi: 10.1093/geronb/gbp045. [DOI] [PMC free article] [PubMed] [Google Scholar]
- Orth-Gomér K, Rosengren A, Wilhelmsen L. Lack of Social Support and Incidence of Coronary Heart Disease in Middle-Aged Swedish Men. Psychosomatic Medicine. 1993;55(1):37–43. doi: 10.1097/00006842-199301000-00007. [DOI] [PubMed] [Google Scholar]
- Penwell LM, Larkin KT. Social Support and Risk for Cardiovascular Disease and Cancer: A Qualitative Review Examining the Role of Inflammatory Processes. Health Psychology Review. 2010;4(1):42–55. doi: 10.1080/17437190903427546. [DOI] [Google Scholar]
- Pressman SD, Cohen S, Miller GE, Barkin A, Rabin BS, Treanor JJ. Loneliness, social network size, and immune response to influenza vaccination in college freshmen. Health Psychology. 2005;24(3):297. doi: 10.1037/0278-6133.24.3.297. [DOI] [PubMed] [Google Scholar]
- Rozanski A, Blumenthal JA, Kaplan J. Impact of psychological factors on the pathogenesis of cardiovascular disease and implications for therapy. Circulation. 1999;99:2192–2217. doi: 10.1161/01.CIR.99.16.2192. [DOI] [PubMed] [Google Scholar]
- Seeman TE, Berkman TE. Structural characteristics of social networks and their relationship with social support in the elderly: who provides support. Social Science & Medicine. 1988;26(7):737–749. doi: 10.1016/0277-9536(88)90065-2. [DOI] [PubMed] [Google Scholar]
- Seeman TE, McEwen BS, Rowe JW, Singer BH. Allstatic Load as a Marker of Cumulative Biological Risk: MacArthur Studies of Successful Aging. Proceedings of the National Academy of Sciences of the United States of America. 2001;98(8):4770–4775. doi: 10.1073/pnas.081072698. [DOI] [PMC free article] [PubMed] [Google Scholar]
- Selye H. Stress Without Distress. Philadelphia: J.B. Lippincott; 1974. [Google Scholar]
- Smith KP, Christakis NA. Social networks and health. Annual Review of Sociology. 2008;34:405–429. doi: 10.1146/annurev.soc.34.040507.134601. [DOI] [Google Scholar]
- Sobel ME. Asymptotic confidence intervals for indirect effects in structural equation models. Sociological Methodology. 1982;13(1982):290–312. doi: 10.2307/270723. [DOI] [Google Scholar]
- Sobel ME. Some new results on indirect effects and their standard errors in covariance structure models. Sociological Methodology. 1986;16:159–186. doi: 10.2307/270922. [DOI] [Google Scholar]
- Steptoe A, Shankar A, Demakakos P, Wardle J. Social isolation, loneliness, and all-cause mortality in older men and women. Proceedings of the National Academy of Sciences. 2013;110(15):5797–5801. doi: 10.1073/pnas.1219686110. [DOI] [PMC free article] [PubMed] [Google Scholar]
- Stringhini S, Berkman L, Dugravot A, Ferrie JE, Marmot M, Kivimaki M, Singh-Manoux A. Socioeconomic Status, Structural and Functional Measures of Social Support, and Mortality: The British Whitehall II Cohort Study, 1985–2009. American Journal of Epidemiology. 2012;175(12):1275–1283. doi: 10.1093/aje/kwr461. [DOI] [PMC free article] [PubMed] [Google Scholar]
- Thoits PA. Stress, coping, and social support processes: Where are we? What next? Journal of health and social behavior. 1995;35:53–79. doi: 10.2307/2626957. [DOI] [PubMed] [Google Scholar]
- Thoits PA. Mechanisms linking social ties and support to physical and mental health. Journal of Health and Social Behavior. 2011;52(2):145–161. doi: 10.1177/0022146510395592. [DOI] [PubMed] [Google Scholar]
- Uchino Bert N. Social support and physical health: Understanding the health consequences of relationships. Yale University Press; 2004. [Google Scholar]
- Umberson D, Crosnoe R, Reczek C. Social relationships and health behavior across life course. Annual Review of Sociology. 2010;36(1):139–157. doi: 10.1146/annurev-soc-070308-120011. [DOI] [PMC free article] [PubMed] [Google Scholar]
- Umberson D, Williams K, Thomas PA, Liu H, Thomeer MB. Race, Gender, and Chains of Disadvantage: Childhood Adversity, Social Relationships, and Health. Journal of Health and Social Behavior. 2014;55(1):20–38. doi: 10.1177/0022146514521426. [DOI] [PMC free article] [PubMed] [Google Scholar]
- Van Uum SHM, Lender JWM, Hermus ARMM. Cortisol, 11β-hydroxysteroid dehydrogenases, and hypertension. Seminars in Vascular Medicine. 2004;4(2):121–128. doi: 10.1055/s-2004-835369. [DOI] [PubMed] [Google Scholar]
- Wethington E, Kessler RC. Perceived support, received support, and adjustment to stressful life events. Journal of Health and Social behavior. 1986;27(1):78–89. doi: 10.2307/2136504. [DOI] [PubMed] [Google Scholar]
- Whitworth JA, Brown MA, Kelly JJ, Williamson PM. Mechanisms of cortisol-induced hypertension in humans. Steroids. 1995;60:76–80. doi: 10.1016/0039-128X(94)00033-9. [DOI] [PubMed] [Google Scholar]
- Wolfe B, Evans WN, Seeman TE, editors. The Biological Consequences of Socioeconomic Inequalities. Russell Sage Foundation; 2012. [Google Scholar]
- Yang Y, George LK. Functional Disability, Disability Transitions, and Depressive Symptoms in Late Life. Journal of Aging and Health. 2005;17(3):263–292. doi: 10.1177/0898264305276295. [DOI] [PubMed] [Google Scholar]
- Yang Y, Kozloski M. Sex Differences in Age Trajectories of Physiological Dysregulation: Inflammation, Metabolic Syndrome, and Allostatic Load. Journal of Gerontology: Biological Sciences. 2011;66A(5):493–500. doi: 10.1093/gerona/glr003. [DOI] [PMC free article] [PubMed] [Google Scholar]
- Yang Y, Kozloski M. Change of Sex Gaps in Total and Cause-Specific Mortality Over the Life Span in the United States. Annals of Epidemiology. 2012;22(2):94–103. doi: 10.1016/j.annepidem.2011.06.006. [DOI] [PMC free article] [PubMed] [Google Scholar]
- Yang YC, McClintock MK, Kozloski M, Li T. Social isolation and adult mortality: the role of chronic inflammation and sex differences. Journal of Health and Social Behavior. 2013;54(2):183–203. doi: 10.1177/0022146513485244. [DOI] [PMC free article] [PubMed] [Google Scholar]
- Yang YC, Schorpp K, Harris KM. Social support, social strain and inflammation: Evidence from a national longitudinal study of US adults. Social Science & Medicine. 2014;107:124–135. doi: 10.1016/j.socscimed.2014.02.013. [DOI] [PMC free article] [PubMed] [Google Scholar]
- Yoon PW, Gillespie CD, George MG, Wall HK. Control of hypertension among adults - national health and nutrition examination survey, United States, 2005-2008. Morbidity and Mortality Weekly Report. 2012;61:19–25. [PubMed] [Google Scholar]