Abstract
Listeria monocytogenes (L. monocytogenes) is a facultative, Gram-positive, food-borne bacterium, which causes serious infections. Although it is known that lipid play important roles in the survival of listeria, the detailed structures of these lipids have not been established. In this contribution, we described linear ion-trap multiple-stage mass spectrometric approaches with high resolution mass spectrometry toward complete structural analysis including the identities of the fatty acid substituents and their position on the glycerol backbone of the polar lipids, mainly phosphatidylglycerol, cardiolipin (CL), and lysyl-CL from L. monocytogenes., The location of the methyl side group along the fatty acid chain in each lipid family was characterized by a charge-switch strategy. This is achieved by first alkaline hydrolysis to release the fatty acid substituents, followed by tandem mass spectrometry on their N-(4-aminomethylphenyl) pyridinium (AMPP) derivatives as the M+ ions. Several findings in this study are unique (1) we confirm the presence of a plasmalogen PG family that has not been previous reported; (2) an ion arising from a rare internal loss of lysyl-glycerol residue was observed in the MS2 spectrum of lysyl-CL, permitting its distinction from other CL subfamilies.
Keywords: HCD, Linear ion-trap, lysylcardiolipin, anteiso- and iso-branched fatty acids, microbial lipids, lipidomics
Introduction
Listeria monocytogenes (L. monocytogenes), a Gram-positive, food-borne bacterium, is one of the most virulent food-borne pathogens that cause Listeriosis. It is a facultative anaerobic bacterium, capable of surviving in the presence or absence of oxygen. L. monocytogenes can be isolated from many foods, including raw and ready-to-eat meat, poultry, egg, seafood and vegetables and can grow vigorously at refrigerator temperatures and in osmotically-stressful environments with high salt concentrations. Listeria is ubiquitous in the environment and is primarily transmitted via the oral route after ingestion of contaminated food products, after which the organism can penetrate the intestinal tract, grow and reproduce inside the host’s cells to cause systemic infections [1–5]. The subject of Listeriosis caused by L. monocytogenes, is beyond the scope of this study. Interested readers refer to the following reviews for detail [6,7].
Lipid plays major role in Listeria survival, which depends on membrane lipid homeostasis and its ability to adjust lipid composition to accommodate to different environments. L. monocytogenes cell exposure to acid stress at low pH, such as in presence of hydrochloric, acetic, lactic, and benzoic acids [8], and to the sanitizer benzalkonium chloride [9] alters the composition of polar and neutral lipids. Acid adaptation in L. monocytogenes was correlated with a decrease in total phospholipids including cardiolipin, phosphatidylglycerol, phosphoaminolipid and phosphatidylinositol, reflecting a higher content of the neutral lipid class [8]. Coordinated regulation of cold-induced changes in fatty acids with cardiolipin and phosphatidylglycerol composition among phospholipid species was also reported [10].
Despite a vast body of literatures on the studies of the pathogens of L. monocytogenes related to the changes of the fatty acid profiles in the membrane after stress has been published [11–13,10,14], very few have been focused on the structural characterization of the lipids in Listeria. Fischer et al used FAB/MS and GC/MS combined with chemical reactions to identify the polar lipid species containing lysylcardiolipin in Listeria [15–17]. However, the methods are not sensitive and inherit the shortcomings of FAB/MS, such as the high background ions from FAB matrix that complicate the analysis. Herein, we describe linear ion-trap multiple-stage mass spectrometric approaches with high resolution mass spectrometry toward structural characterization of the polar membrance lipids, including phosphatidylglycerol, cardiolipins, lysyl cardiolipins and diglucosyldiacylglycerol that were desorbed as the [M – H]− ions by electrospray ionization. We also adopted a charge-reversed strategy that detects the acids in the positive ion mode by conversion of the free fatty acid to the N-(4-aminomethylphenyl) pyridinium (AMPP) derivative [18–21], following alkaline hydrolysis of the lipid extract to release the fatty acid substituents. These mass spectrometric approaches afford a nearly complete structural characterization of these lipid families, including the location of the methyl branches of the fatty acyl chains.
Materials and Methods
Growth and lipid extraction of Listeria monocytogenes
Listeria monocytogenes strain 10403S (a gift from H. Shen, University of Pennsylvania) was inoculated into brain-heart infusion (BHI) broth (BD Biosciences) supplemented with 200 μg/ml streptomycin (Sigma-Aldrich) (BHI-STR) and grown overnight at 37°C. The next day, 4 L flasks each containing 2.5 L of prewarmed BHI-STR broth were inoculated at approximately 1:420 v/v and grown until mid-log phase. Mid-log bacteria were collected by centrifugation, washed in PBS, and then lyophilized for 48 h. After lyophilization, pellets of Listeria were transferred to glass or teflon-coated bottles and crude polar and nonpolar lipids were extracted as previously described [22]. Lipids were then weighed, resuspended in 2:1 CHCl3:CH3OH (v/v), and stored at −20°C until use.
Analytical and preparative thin layer chromatography (TLC)
Lipids were spotted onto aluminum-backed silica TLC plates (EMD Chemicals Inc.) and dried. Once dry, plates were ran in a solvent system with CHCl3:CH3COOH:CH3OH:H2O at a ratio of 40:25:3:6 (v/v/v/v) designed for the optimal separation of phospholipids. Plates were then dried, and sprayed with one of four TLC stains [Dittmer-Lester reagent, α-naphthol, molybdophosphoric acid (MPA), and ninhydrin] [15]. Other than Dittmer-Lester stained plates, plates were then developed by charring. For preparative TLCs, lipids were spotted across the origin of a plastic-backed TLC plate (EMD Chemicals Inc.) and were run in the same manner. After drying, a small segment of the plate was cut off for staining. The stained TLC plate section was then used to mark the lipid bands in the unstained section of the plate. The marked silica regions corresponding to CL, PG and DGDG lipid band were scraped off the plastic, moved to glass tubes, and the lipids were extracted with 3 sequential washes of 2:1 Chloroform:Methanol (C:M). After drying, lipids were resuspended in 2:1 C:M and stored at −20°C until use.
Alkaline hydrolysis and preparation of N-(4-aminomethylphenyl) pyridinium (AMPP) derivative with AMPP reagent
To each fractionated PG and CL (c.a. 20 ug), and synthetic 17:0/15:0-PG, 100 ul methanol and 100 uL tetrabutylammonium hydroxide (40 wt% solution in water) were added. The solution was heated at 100°C for 1 h. This is followed by addition of 1 mL aqueous LiCl (0.63%) and 1 mL hexane at room temperature, vortexed for 1 min, and centrifuged at 1200 x g for 2 min. The top layer containing free fatty acids was transferred to a centrifuge tube, dried under a stream of nitrogen, and AMPP derivative was made with the AMP+ Mass Spectrometry Kit, according to the user’s instruction. Briefly, the dried sample was resuspended in 20 uL ice-cold acetonitrile/DMF (4:1, v/v), and 20 ul of ice-cold 1 M EDCI (3-(dimethylamino)propyl)ethyl carbodiimide hydrochloride) in water was added. The vial was briefly mixed on a vortex mixer and placed on ice. To the sample vial, 10 μl of 5 mM N-hydroxybenzotriazole (HOAt) and 30 ul of 15 mM AMPP (in distilled acetonitrile) were added. After the solution was heated at 65°C for 30 min, cooled to room temperature, 1 ml of water and 1 ml of n-butanol were added. The final solution containing FA-AMPP derivative was vortexed for 1 min, centrifuged for 3 min at 1200 x g. The organic layer was transferred to another vial, dried under a stream of nitrogen, and stored at − 20°C until use.
Mass spectrometry
Both high-resolution (R=100,000 at m/z 400) and low-energy CAD tandem mass spectrometry experiments were conducted on a Thermo Scientific (San Jose, CA) LTQ Orbitrap Velos mass spectrometer (MS) with Xcalibur operating system. Samples in methanol were infused (1.5 μL/min) to the ESI source, where the skimmer was set at ground potential, the electrospray needle was set at 4.0 kV, and temperature of the heated capillary was 300°C. The automatic gain control of the ion trap was set to 5x10⁴, with a maximum injection time of 100 ms. Helium was used as the buffer and collision gas at a pressure of 1x10⁻³ mbar (0.75 mTorr). The MSn experiments were carried out with an optimized relative collision energy ranging from 35–70% and with an activation q value at 0.25, and the activation time at 10 ms to leave a minimal residual abundance of precursor ion (around 20%). The mass selection window for the precursor ions was set at 1 Da wide to admit the monoisotopic ion to the ion-trap for collision-induced dissociation (CID) for unit resolution detection in the ion-trap or high resolution accurate mass detection in the Orbitrap mass analyzer. Mass spectra were accumulated in the profile mode, typically for 3–10 min for MSn spectra (n=2,3,4).
Results and Discussion
Membrane lipids extracted from L. monocytogenes consisted of various lipid families including phosphatidylglycerol (PG) (Table 1), cardiolipin (diphosphatidylglycerol and lysyl-cardiolipin(lysyl diphosphatidylglycerol) (Table 2), which is a subfamily of cardiolipin that is chemotaxonomic marker for the genus Listeria [15], and diglycosyl diacylglycerol (DGDG) (Table 3). Interestingly, all the lipids contained the similar fatty acid substituents, mainly 12-methyltetradecanoic (anteiso-C15:0) and 14-methylhexadecanoic (anteiso-C17:0) fatty acids. The characterization of these lipid families are described below.
Table 1.
Molecular species of PG from L. monocytogenes characterized by LIT MSn
| measured m/z Da | Theo. Mass Da | Deviation mDa | Rel. Intensity % | Elememtal Composition | Structures |
|---|---|---|---|---|---|
| 679.4556 | 679.4556 | 0.04 | 2.29 | C35 H68 O10 P | 14:0/15:0 |
| 693.4710 | 693.4712 | −0.25 | 40.73 | C36 H70 O10 P | 15:0/15:0 |
| 705.5076 | 705.5076 | 0 | 4.68 | C38 H74 O9 P | p17:0/15:0 |
| 707.4867 | 707.4869 | −0.14 | 15.01 | C37 H72 O10 P | 16:0/15:0 |
| 721.5018 | 721.5025 | −0.67 | 100 | C38 H74 O10 P | 17:0/15:0 |
| 733.5388 | 733.5389 | −0.1 | 0.47 | C40 H78 O9 P | p17:0/17:0 |
| 735.5177 | 735.5182 | −0.5 | 1.62 | C39 H76 O10 P | 17:0/16:0 |
| 749.5334 | 749.5338 | −0.43 | 4.81 | C40 H78 O10 P | 17:0/17:0 |
Table 2.
Molecular species of CL and lysyl-CL from L. monocytogenes identified by LIT MSn
| measured m/z Da | Theo. Mass Da | Deviation mDa | Rel. Intensity % | Elememtal Composition | Structures |
|---|---|---|---|---|---|
| 1295.9032 | 1295.9023 | 0.89 | 2.27 | C69 H133 O17 P2 | (15:0/15:0)(15:0/15:0) |
| 1309.9191 | 1309.9180 | 1.05 | 2.05 | C70 H135 O17 P2 | (15:0/15:0)(16:0/15:0) |
| 1323.9345 | 1323.9336 | 0.81 | 15.33 | C71 H137 O17 P2 | (17:0/15:0)(15:0/15:0) |
| 1337.9503 | 1337.9493 | 0.96 | 4.14 | C72 H139 O17 P2 | (17:0/15:0)(16:0/15:0) |
| 1351.9661 | 1351.9649 | 1.2 | 20.93 | C73 H141 O17 P2 | (17:0/15:0)(17:0/15:0) |
| 1379.9977 | 1379.9962 | 1.5 | 0.3 | C75 H145 O17 P2 | (17:0/17:0)(17:0/15:0) |
| 1423.999 | 1423.9973 | 1.73 | 4.37 | C75 H145 O18 N2 P2 | Lysyl-(15:0/15:0)(15:0/15:0) |
| 1438.0151 | 1438.0130 | 2.15 | 4.73 | C76 H147 O18 N2 P2 | Lysyl-(15:0/15:0)(16:0/15:0) |
| 1452.0301 | 1452.0286 | 1.49 | 42.63 | C77 H149 O18 N2 P2 | Lysyl-(17:0/15:0)(15:0/15:0) |
| 1466.0463 | 1466.0443 | 1.99 | 16.05 | C78 H151 O18 N2 P2 | Lysyl-(17:0/15:0)(16:0/15:0) |
| 1480.0613 | 1480.0599 | 1.39 | 100 | C79 H153 O18 N2 P2 | Lysyl-(17:0/15:0)(17:0/15:0) |
| 1508.0930 | 1508.0912 | 1.77 | 4.86 | C81 H157 O18 N2 P2 | Lysyl-(17:0/17:0)(17:0/15:0) |
Table 3.
Molecular species of DGDG from L. monocytogenes characterized by LIT MSn
| measured m/z Da | Theo. Mass Da | Deviation mDa | Rel. Intensity % | Elemental Composition | Structures |
|---|---|---|---|---|---|
| 873.5550 | 873.5546 | 0.37 | 0.85 | C44 H82 O15 Na | 14:0/15:0-DGDG |
| 887.5705 | 887.5702 | 0.24 | 25.96 | C45 H84 O15 Na | 15:0/15:0-DGDG |
| 901.5862 | 901.5859 | 0.28 | 12.52 | C46 H86 O15 Na | 16:0/15:0-DGDG |
| 915.6016 | 915.6015 | 0.03 | 100 | C47 H88 O15 Na | 17:0/15:0-DGDG |
| 929.6174 | 929.6172 | 0.24 | 3.46 | C48 H90 O15 Na | 17:0/16:0-DGDG |
| 943.6328 | 943.6328 | −0.01 | 11.27 | C49 H92 O15 Na | 17:0/17:0-DGDG |
Structural determination of phosphatidylglycerols
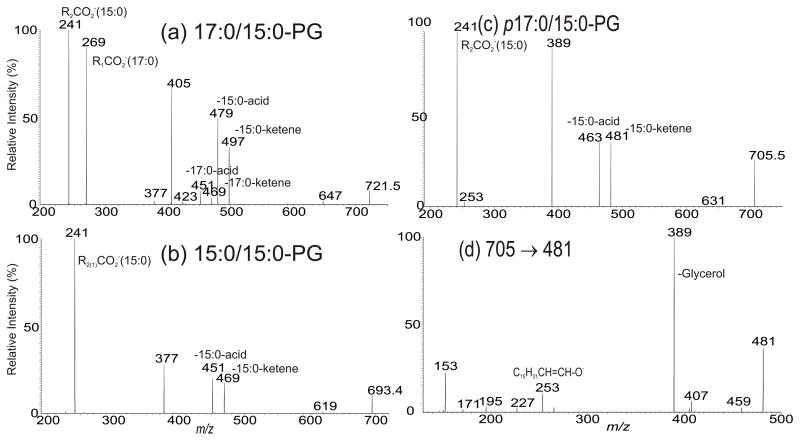
We previously described tandem mass spectrometric approach towards characterization of PG as [M – H]− ions. The structure assignment including the position of the fatty acid substituents on the glycerol backbone is based on the findings that the loss of the fatty acid substituent at sn-2 as an acid or as a ketene is more facile than the similar loss of the fatty acid substituent at sn-1 [23]. As shown in Fig. 1a, the LIT MS2 spectrum of the ion of m/z 721 contained the ions at m/z 497 (loss of 15:0-ketene) and 479 (loss of 15:0-acid) arising from loss of 15:0-fatty acid substituent, and the ions at m/z 469 (loss of 17:0-ketene) and 451 (loss of 17:0-acid) arising from loss of 17:0-fatty acid, indicating the presence of 15:0- and 17:0-fatty acid substituents. The ions at m/z 479 and 497 are respectively more abundant than the ions at m/z 469 and 451, indicating that the 17:0- and 15:0-fatty acid substituents are located at sn-2 and sn-1 of the glycerol backbone, respectively. The results are consistent with the observation of the ion at m/z 241 (15:0-carboxylate anion), which is more abundant than the ion of m/z 269 (17:0-carboxylate anion). The spectrum also contained the ions at m/z 647 (loss of [glycerol – H2O]), 405 (479 - [glycerol – H2O]) and 377 (451 - [glycerol – H2O]), arising from loss of the glycerol head group, giving assignment of a 17:0/15:0-PG structure [23]. Similar results were observed for the [M – H]− ion of m/z 693 (Fig. 1b ), which gave rise to ions of m/z 469 (loss of 15:0-ketene) and 479 (loss of 15:0-acid) arising from losses of the 15:0-fatty acid substituents at sn-1 and at sn-2 as ketene and as acid, respectively. The ions from loss of the glycerol substituent were observed at m/z 619 (693 - [glycerol – H2O]) and 377 (451 - [glycerol – H2O]; 469 - glycerol), pointing to the presence of a 15:0/15:0-PG.
Fig. 1.
The MS2 spectra of the [M – H]− ions of 17:0/15:0-PG at m/z 721.5 (a), of 15:0/15:0-PG at m/z 693.4 (b), of p17:0/15:0-PG at m/z 705.6 (c), and its MS3 spectrum of the ion of m/z 481 (705 → 481) (d).
Interestingly, two minor plasmalogen PG species at m/z 705 and 733 were also observed, as evidenced by high resolution mass measurements (Table 1). The characterization of this lipid subfamily is exemplified by MSn on the ion of m/z 705.5. The MS2 spectrum (Fig. 1c), again, contained ions at m/z 481 and 463, arising from losses of the 15:0-FA acid substituent as a ketene and as an acid, respectively, along with the 15:0 carboxylate anion at m/z 241, indicating the presence of 15:0-fatty acid substituent. The spectrum also contained the ion at m/z 389, resulting from further loss of the glycerol head group. This further loss of glycerol residue is supported by MS3 on the ion of m/z 481(705 → 481; Fig. 1d), which yielded ions at m/z 389, together with ions at m/z 227, 195 and 153 that are characteristic ions seen for PG molecules [23]. The spectrum (Fig. 1d) also contained the ion at m/z 253 (C15H31CH=CHO−), representing a heptadecenoxide anion arising from cleavage of 1-O-alk-1′-enyl residue. The confirmation of this heptadecenoxide ion was further supported high resolution MS3 spectrum of the ion of m/z 389 (705 → 389; supplemental material Table s1), which is dominated by the ion of 253.2538 possessing an elemental composition of C17H33O (calculated: 253.2537) from loss of (glycerol – H2O) along with ion of m/z 134.9859 (elemental composition: C3H4O4P) from loss of a C15H31CH=CHOH residue. The combined structural information led to assignment of a p17:0/15:0-PG structure [24].
Structural determination of cardiolipins (CLs) and lysyl-CLs
Both tandem quadrupole and LIT MSn mass spectrometric approaches have been utilized for characterization of CLs, permitting identification of the fatty acid substituents including the position of double bond and their location on the glycerol backbone [25–28]. In this study, It is noticeable that under the same ionization condition with the presence of 0.1% NH3, only singly-charged ([M – H]−) ion was observed for the lysyl-CL (Electronic Supplementary Material Fig. S1), while doubly-charged ([M – 2H]2−) ions are the major ion species observed for CLs bearing no lysine residue. This is likely attributable to the fact that lysine is basic amino acid that may form a zwitterion with the anionic phosphate group, thus deterring the further deprotonation process that yields the [M – 2H]2− ions. The structural characterization conducted on the [M – H]− ions is described below.
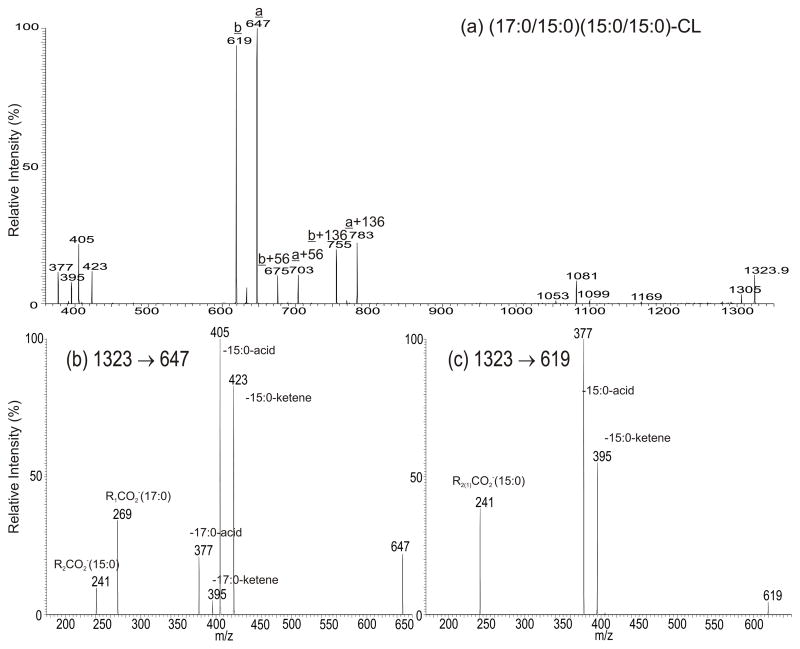
As shown in Fig. 2a, the MS2 spectrum of the [M – H]− ion of m/z 1323 is dominated by the ions at m/z 647 (a ion) and 619 (b), together with the ions at m/z 675 (a+56) and 703 (b+56) and at m/z 755 (a+136) and 783 (b+136), indicating that the molecule consists of both a C32:0- and a C30:0-phosphatidyl moieties [25]. The MS3 spectra of the ions of m/z 647 (1323 → 647; Fig. 2b) and 619 (1323 → 619; Fig. 2c) are identical to those arising from the 17:0/15:0-PA and 15:0/15:0-PA (data not shown), respectively, pointing to the presence of 17:0/15:0- and 15:0/15:0-phosphatidyl moieties attached to the 1′ and 3′ position of the central glycerol of CL, respectively [25]. The results indicate that the ion of m/z 1323.9 represents a (15:0/15:0)(17:0/15:0)-CL, consistent with the observation of the ions of the ions at m/z 423 (a- 15:0-ketene), 405 (a – 15:0-FA), 395 ([b - 15:0-ketene]+[a - 17:0-ketene]), and 377 ([b - 15:0-FA]+[a - 17:0-FA]) in Fig. 2a. The structural assignments are further supported by the accurate mass measurement of the individual ions by high resolution MS2 (ESM Table S2).
Fig. 2.
The MS2 spectrum of the [M – H]− ions of (17:0/15:0)(15:0/15:0)-CL at m/z 1323.9 (a), and its MS3 spectra of the ion of m/z 647 (1323 → 647) (b), of the ion of m/z 619 (c). The ion nomenclature in Fig. 5a is adopted from reference 25.
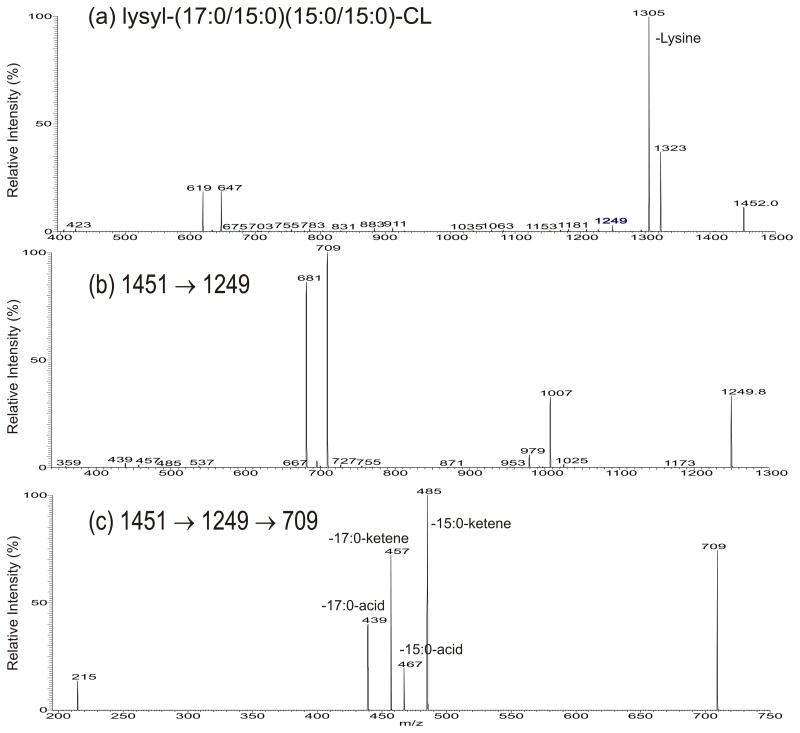
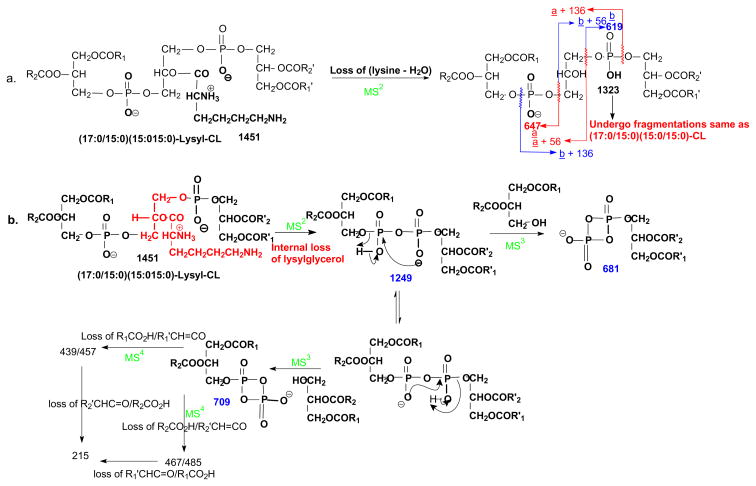
By contrast, the MS2 spectrum of the [M – H]− ion of m/z 1451 (Fig. 3a) (Table 2) is dominated by the ions at m/z 1323 (loss of [lysine – H2O]) and 1305 (loss of lysine), arising from elimination of the lysine residue, along with the ions at 647 (a ion) and 619 (b), respectively representing a C32:0- and a C30:0-phosphatidyl substituents as seen earlier (Scheme 1a). The MS3 spectrum of the ion of m/z 1323 (1451 → 1323; data not shown) is identical to the MS2 spectrum of the [M – H]− ion of m/z 1323 shown in Fig. 2a. The results led to the assignment of lysyl-(15:0/15:0)(17:0/15:0)-CL.
Fig. 3.
The MS2 spectrum of the [M – H]− ions of lysyl-(17:0/15:0)(15:0/15:0)-CL at m/z 1452.0 (a), and its MS3 spectra of the ion of m/z 1249.8 (1452 → 1249) (b), and its MS4 spectrum of the ion of m/z 709 (1452 → 1249 → 709) (c). The ion of m/z 1249 arises from internal loss of a lysylglycerol residue which is unique to lysyl-CL (the proposed fragmentation pathways are shown in Scheme 1).
Scheme 1.
The fragmenation processes proposed for lysyl-CL. The numbers reflect the msses (m/z) of the fragment ions observed for the [M - H]− ion of (17:0/15:0)(15:0/15:0)-lysyl-CL
In Fig. 3a, an ion at m/z 1249 was also observed. High resolution mass measurement gave an elemental composition of C68H131O15P2 (calculated: 1249.8969; measured: 1249.8951) (see supplemental material Table s3) reflecting that the ion may arise from internal expulsion of a lysylglycerol residue (loss of C9H18O3N2), to form a diphosphatidyl anion (Scheme 1b). This speculation is further supported by the MS3 spectrum of the ion of m/z 1249 (1451 → 1249; Fig. 3b), which contained the ions at m/z 1025 (loss of 15:0-ketene) and 1007 (loss of 15:0-acid) arising from loss of 15:0-fatty acid residue, and ions at m/z 979F (loss of 17:0-ketene) and 953 (loss of 17:0-acid) arising from elimination of 17:0-fatty acid residue, consistent with the presence of 15:0- and 17:0-fatty acyl groups in the molecule. The spectrum also contained abundant ions at m/z 709 and 681, arising from losses of the 15:0/15:0- and 17:0/15:0-diacylglycerol residues, respectively (Scheme 1b). Further dissociation of the ion of m/z 709 (1451 → 1249 → 709; Fig. 3c) yielded 485/467 and 457/439 ion pairs arising from cleavages of 15:0-, and 17:0-fatty acid substituents as ketene and as acid, respectively, along with ion at m/z 215 arising from further loss of the remaining fatty acid substituent (Scheme 1b). The results are consistent with the diphosphatidyl structure suggested for the ion of m/z 1249, confirming the fragmentation process of the internal residue loss. In contrast, an internal loss of a corresponding glycerol residue was not observed for the cardiolipins that do not bear the lysine residue (e.g., Fig. 2a).
Characterization of diglycosyldiacylglycerol (DGDG)
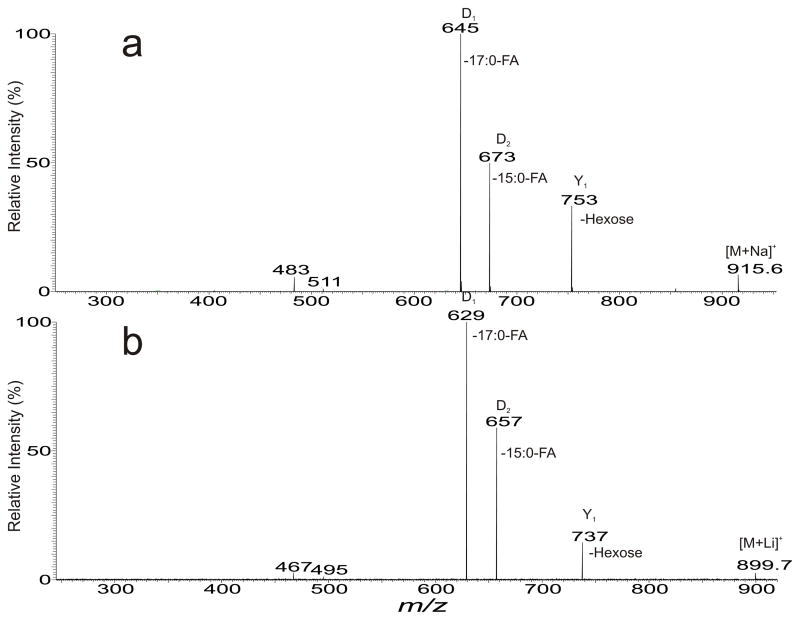
In the positive ion mode, several DGDG species in the [M + Na]+ form were observed and the major constituent was seen at m/z 915 (Table 3). The MS2 spectrum (Fig. 4a) contained ions at m/z 753 arising from loss of a hexose residue, together with abundant ions at m/z 645 and 673 arising from losses of 17:0- and 15:0-fatty acid substituents, respectively. The ion at m/z 645 is more abundant than the ion at m/z 673, indicating the 17:0-fatty acyl group is located at sn-1; while the 15:0-fatty acyl group is located at sn-2 of the glycerol backbone. The spectrum also contained the minor ions at m/z 483 and 511 arising from combined losses of the hexose residue plus the 17:0- and 15:0-fatty acid substituents, respectively. The structural assignments were further confirmed by the MS2 spectrum of the corresponding [M + Li]+ ions at m/z 899 (Fig. 4b), in which a mass shift of 16 Da was observed for all the fragment ions. The results gave assignment of a 17:0/15:0-DGDG structure [29,30].
Fig. 4.
The MS2 spectra of the [M + Na]+ ions of 17:0/15:0-DGDG at m/z 915.6 (a), and of the corresponding [M + Li]+ ions at m/z 899.7 (b). The losses of the fatty acid substituents in (a) are confirmed by the mass shift of the corresponding ions in (b).
Characterization of the anteiso-C15:0 and anteiso-C17:0 fatty acid substituents in PG, DPG and DGDG
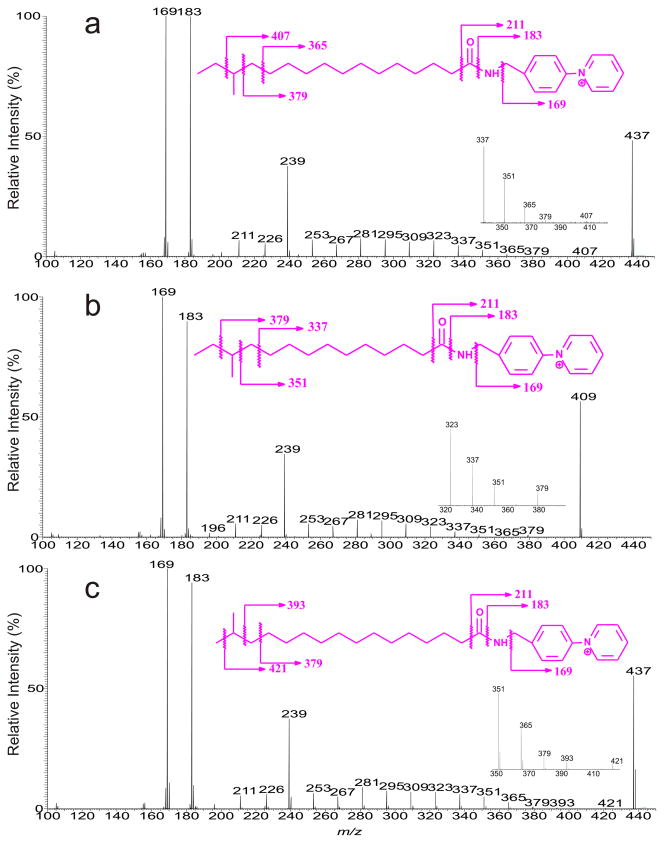
The AMPP derivatives of the FA substituents arising from the fractionated CL, and PG, after alkaline hydrolysis all gave rise to the major M+ at m/z 437 and 409 (data not shown). HCD MS2 spectrum of the ions at m/z 437 (Fig. 5a) is identical to that of the anteiso-C17:0-AMPP standard (not shown). The spectrum contained abundant ions at m/z 169 and 183, along with m/z 211 that are characteristic fragment ions seen for the fatty acid-AMPP derivatives [18–21]. Fig. 5a is featured by the ion series of m/z 239, 253, 267, 281, 295, 309, 323, 337, 351, 365, and 379, arising from cleavages of the straight of C-C bond, along with ion of m/z 407 arising from removal of the terminal ethyl group (loss as CH2=CH2 + H2), supporting that the methyl side chain is located at the n-3 of the hydrocarbon chain and the presence of the anteiso-C17:0 fatty acid structure. The low energy CAD MS2 spectrum of the ion of m/z 437 is similar to that shown in Fig. 5a (data not shown), but the heavier ions of m/z 365, 379, and 407 that are crucial for locating the methyl side chain are less abundant, compromising its utility in the confident assignment of the methyl group, although applicable.
Fig. 5.
The HCD MS2 spectra of the [M + H]+ ions of the anteiso-17:0-AMPP derivative at m/z 437 (a), and of anteiso-15:0-AMPP derivative at m/z 409 (b) from L. monocytogenes, and of the standard iso-17:0-AMPP derivative at m/z 437 (c). The location of the methyl side chain is located by the observation of the 28 Da gap as shown in the fragmentation schemes in the inset of each spectrum.
Similar fragment ions were also observed in Fig. 5b, however, the spectrum is featured by the ion series of m/z 239, 253, 267, 281, 295, 309, 323, 337, and 351 together with 379, indicating that the C15:0 represents a anteiso-C15:0 structure. In contrast, the HCD MS2 spectrum of the M + ion of the standard iso-C17:0-AMPP isomer at m/z 437 contained the ion series of m/z 239, 253, 267, 281, 295, 309, 323, 337, 351, 365, 379 and 393, arising from cleavage of the C-C bond of the straight chain, along with ion of m/z 421 arising from removal of the terminal methyl group as methane, pointing to an iso-C17:0 structure (Fig. 5c).
Conclusions
We applied LIT MSn with high resolution mass spectrometry in combination of chemical reactions toward complete structural identification of polar lipids isolated from membrane of L. monocytogenes. It is interesting to note that anteiso-C15:0 and anteiso-C17:0 fatty acids are the major fatty acid substituents found in all the lipid families analyzed; and the anteiso-C17:0 and anteiso-C15:0 are mainly located at sn-1 and sn-2 of the glycerol backbone, respectively. The structure similarities among PG, CL and DGDG are also consistent with the biosynthetic pathways of CL [31] and DGDG [32–34] in the bacteria. The observation of the rare plasmalogen PGs that have not been previously reported in listeria is interesting; and the biological significance underlying the formation may warrant further studies.
Supplementary Material
Acknowledgments
This research was supported by US Public Health Service Grants P41-GM103422, P60-DK-20579, P30-DK56341 (Washington University Mass spectrometry Resource) 5R01AI063428-09 and 5T32AR007530-30 (Harvard Medical School).
Abbreviations
- ESI-MS
electrospray ionization-MS
- HRMS
high resolution mass spectrometry
- LIT
linear ion-trap
References
- 1.Ryser ET, Marth EH. Listeria, Listeriosis, and Food Safety. Marcel Dekker; 1999. [Google Scholar]
- 2.Cole M, Jones M, Holoak C. The effect of pH, salt concentration and temperature on the survival and growth of Listeria monocytogenes. J Appl Microbiol. 1990;69:63. doi: 10.1111/j.1365-2672.1990.tb02912.x. [DOI] [PubMed] [Google Scholar]
- 3.Walker SJ, Archer P, Banks JG. Growth of Listeria monocytogenes at refrigeration temperatures. J Appl Bacteriol. 1990;68 (2):157–162. doi: 10.1111/j.1365-2672.1990.tb02561.x. [DOI] [PubMed] [Google Scholar]
- 4.Pal A, Labuza TP, Diez-Gonzalez F. Evaluating the Growth of Listeria monocytogenes in Refrigerated Ready-to-Eat Frankfurters: Influence of Strain, Temperature, Packaging, Lactate and Diacetate, and Background Microflora. Journal of Food Protection. 2008;71 (9):1806–1816. doi: 10.4315/0362-028x-71.9.1806. [DOI] [PubMed] [Google Scholar]
- 5.Ramaswamy V, Cresence VM, Rejitha JS, Dharsana KS, Vijila HM. Listeria--review of epidemiology and pathogenesis. J Microbiol Immunol Infect. 2007;40 (1):4–13. [PubMed] [Google Scholar]
- 6.Gellin BG, Broome CV. LIsteriosis. JAMA. 1989;261 (9):1313–1320. doi: 10.1001/jama.1989.03420090077035. [DOI] [PubMed] [Google Scholar]
- 7.Farber JM, Peterkin PI. Listeria monocytogenes, a food-borne pathogen. Microbiological Reviews. 1991;55 (3):476–511. doi: 10.1128/mr.55.3.476-511.1991. [DOI] [PMC free article] [PubMed] [Google Scholar]
- 8.Mastronicolis SK, Berberi A, Diakogiannis I, Petrova E, Kiaki I, Baltzi T, Xenikakis P. Alteration of the phospho- or neutral lipid content and fatty acid composition in Listeria monocytogenes due to acid adaptation mechanisms for hydrochloric, acetic and lactic acids at pH 5.5 or benzoic acid at neutral pH. Antonie Van Leeuwenhoek. 2010;98:307–316. doi: 10.1007/s10482-010-9439-z. [DOI] [PMC free article] [PubMed] [Google Scholar]
- 9.Bisbiroulas P, Psylou M, Iliopoulou I, Diakogiannis I, Berberi A, Mastronicolis SK. Adaptational changes in cellular phospholipids and fatty acid composition of the food pathogen Listeria monocytogenes as a stress response to disinfectant sanitizer benzalkonium chloride. Letters in Applied Microbiology. 2011;52 (3):275–280. doi: 10.1111/j.1472-765X.2010.02995.x. [DOI] [PubMed] [Google Scholar]
- 10.Mastronicolis SK, Arvanitis N, Karaliota A, Magiatis P, Heropoulos G, Litos C, Moustaka H, Tsakirakis A, Paramera E, Papastavrou P. Coordinated Regulation of Cold-Induced Changes in Fatty Acids with Cardiolipin and Phosphatidylglycerol Composition among Phospholipid Species for the Food Pathogen Listeria monocytogenes. Applied and Environmental Microbiology. 2008;74 (14):4543–4549. doi: 10.1128/aem.02041-07. [DOI] [PMC free article] [PubMed] [Google Scholar]
- 11.Zhu K, Bayles DO, Xiong A, Jayaswal RK, Wilkinson BJ. Precursor and temperature modulation of fatty acid composition and growth of Listeria monocytogenes cold-sensitive mutants with transposon-interrupted branched-chain α-keto acid dehydrogenase. Microbiology. 2005;151 (2):615–623. doi: 10.1099/mic.0.27634-0. [DOI] [PubMed] [Google Scholar]
- 12.Püttmann M, Ade N, Hof H. Dependence of fatty acid composition of Listeria spp. on growth temperature. Research in Microbiology. 1993;144 (4):279–283. doi: 10.1016/0923-2508(93)90012-q. http://dx.doi.org/10.1016/0923-2508(93)90012-Q. [DOI] [PubMed] [Google Scholar]
- 13.Mastronicolis SK, Arvanitis N, Karaliota A, Litos C, Stavroulakis G, Moustaka H, Tsakirakis A, Heropoulos G. Cold dependence of fatty acid profile of different lipid structures of Listeria monocytogenes. Food Microbiology. 2005;22 (2–3):213–219. doi: 10.1016/j.fm.2004.08.002. [DOI] [Google Scholar]
- 14.Miladi H, Bakhrouf A, Ammar E. Cellular lipid fatty acid profiles of reference and food isolates listeria monocytogenes as a response to refrigeration and freezing stress. Journal of Food Biochemistry. 2013;37 (2):136–143. doi: 10.1111/j.1745-4514.2011.00607.x. [DOI] [Google Scholar]
- 15.Fischer W, Leopold K. Polar lipids of four listeria species containing L-lysylcardiolipin, a novel lipid structure, and other unique phospholipids. International Journal of Systematic Bacteriology. 1999;49 (2):653–662. doi: 10.1099/00207713-49-2-653. [DOI] [PubMed] [Google Scholar]
- 16.Gutberlet T, Dietrich U, Bradaczek H, Pohlentz G, Leopold K, Fischer W. Cardiolipin, α-d-glucopyranosyl, and l-lysylcardiolipin from Gram-positive bacteria: FAB MS, monofilm and X-ray powder diffraction studies. Biochim Biophys Acta - Biomembranes. 2000;1463 (2):307–322. doi: 10.1016/s0005-2736(99)00214-x. http://dx.doi.org/10.1016/S0005-2736(99)00214-X. [DOI] [PubMed] [Google Scholar]
- 17.Peter-Katalinic J, Fischer W. α-d-Glucopyranosyl-, d-alanyl- and l-lysylcardiolipin from gram-positive bacteria: analysis by fast atom bombardment mass spectrometry. J Lipid Res. 1998;39 (11):2286–2292. [PubMed] [Google Scholar]
- 18.Yang K, Dilthey BG, Gross RW. Identification and Quantitation of Fatty Acid Double Bond Positional Isomers: A Shotgun Lipidomics Approach Using Charge-Switch Derivatization. Analytical Chemistry. 2013 doi: 10.1021/ac402104u. [DOI] [PMC free article] [PubMed] [Google Scholar]
- 19.Bollinger JG, Rohan G, Sadilek M, Gelb MH. Liquid Chromatography/Electrospray Mass Spectrometric Detection of Fatty Acid by Charge Reversal Derivatization with More Than 4-Orders of Magnitude Improvement in Sensitivity. J Lipid Res. 2013:54. doi: 10.1194/jlr.D040782. [DOI] [PMC free article] [PubMed] [Google Scholar]
- 20.Bollinger JG, Thompson W, Lai Y, Oslund RC, Hallstrand TS, Sadilek M, Turecek F, Gelb MH. Improved Sensitivity Mass Spectrometric Detection of Eicosanoids by Charge Reversal Derivatization. Analytical Chemistry. 2010;82 (16):6790–6796. doi: 10.1021/ac100720p. [DOI] [PMC free article] [PubMed] [Google Scholar]
- 21.Wang M, Han RH, Han X. Fatty Acidomics: Global Analysis of Lipid Species Containing a Carboxyl Group with a Charge-Remote Fragmentation-Assisted Approach. Analytical Chemistry. 2013;85 (19):9312–9320. doi: 10.1021/ac402078p. [DOI] [PMC free article] [PubMed] [Google Scholar]
- 22.Cohen Nadia R, Tatituri Raju VV, Rivera A, Watts Gerald FM, Kim Edy Y, Chiba A, Fuchs Beth B, Mylonakis E, Besra Gurdyal S, Levitz Stuart M, Brigl M, Brenner Michael B. Innate Recognition of Cell Wall β-Glucans Drives Invariant Natural Killer T Cell Responses against Fungi. Cell Host & Microbe. 10(5):437–450. doi: 10.1016/j.chom.2011.09.011. [DOI] [PMC free article] [PubMed] [Google Scholar]
- 23.Hsu F-F, Turk J. Studies on phosphatidylglycerol with triple quadrupole tandem mass spectrometry with electrospray ionization: Fragmentation processes and structural characterization. J Am Soc Mass Spectrom. 2001;12 (9):1036–1043. doi: 10.1016/s1044-0305(01)00285-9. [DOI] [Google Scholar]
- 24.Hsu F-F, Turk J. Differentiation of 1-O-alk-1′-enyl-2-acyl and 1-O-alkyl-2-acyl Glycerophospholipids by Multiple-Stage Linear Ion-Trap Mass Spectrometry with Electrospray Ionization. J Am Soc Mass Spectrom. 2007;18 (11):2065–2073. doi: 10.1016/j.jasms.2007.08.019. [DOI] [PMC free article] [PubMed] [Google Scholar]
- 25.Hsu F-F, Turk J, Rhoades E, Russell D, Shi Y, Groisman E. Structural characterization of cardiolipin by tandem quadrupole and multiple-stage quadrupole ion-trap mass spectrometry with electrospray ionization. J Am Soc Mass Spectrom. 2005;16 (4):491–504. doi: 10.1016/j.jasms.2004.12.015. [DOI] [PubMed] [Google Scholar]
- 26.Hsu F-F, Turk J. Characterization of cardiolipin from Escherichia coli by electrospray ionization with multiple stage quadrupole ion-trap mass spectrometric analysis of [M-2H+Na]-ions. J Am Soc Mass Spectrom. 2006;17 (3):420–429. doi: 10.1016/j.jasms.2005.11.019. [DOI] [PMC free article] [PubMed] [Google Scholar]
- 27.Hsu F-F, Turk J. Characterization of cardiolipin as the sodiated ions by positive-ion electrospray ionization with multiple stage quadrupole ion-trap mass spectrometry. J Am Soc Mass Spectrom. 2006;17 (8):1146–1157. doi: 10.1016/j.jasms.2006.04.024. [DOI] [PMC free article] [PubMed] [Google Scholar]
- 28.Hsu F-F, Turk J. Toward total structural analysis of cardiolipins: multiple-stage linear ion-trap mass spectrometry on the [M - 2H + 3Li]+ ions. J Am Soc Mass Spectrom. 2010;21 (11):1863–1869. doi: 10.1016/j.jasms.2010.07.003. [DOI] [PMC free article] [PubMed] [Google Scholar]
- 29.Tatituri RVV, Brenner MB, Turk J, Hsu F-F. Structural elucidation of diglycosyl diacylglycerol and monoglycosyl diacylglycerol from Streptococcus pneumoniae by multiple-stage linear ion-trap mass spectrometry with electrospray ionization. J Mass Spectrom. 2012;47 (1):115–123. doi: 10.1002/jms.2033. [DOI] [PMC free article] [PubMed] [Google Scholar]
- 30.Guella G, Frassanito R, Mancini I. A new solution for an old problem: the regiochemical distribution of the acyl chains in galactolipids can be established by electrospray ionization tandem mass spectrometry. Rapid Commun Mass Spectrom. 2003;17 (17):1982–1994. doi: 10.1002/rcm.1142. [DOI] [PubMed] [Google Scholar]
- 31.Hirschberg CB, Kennedy EP. Mechanism of the enzymatic synthesis of cardiolipin in Escherichia coli. Proc Natl Acad Sci U S A. 1972;69:648–651. doi: 10.1073/pnas.69.3.648. [DOI] [PMC free article] [PubMed] [Google Scholar]
- 32.Botté CY, Deligny M, Roccia A, Bonneau A-L, Saïdani N, Hardré H, Aci S, Yamaryo-Botté Y, Jouhet J, Dubots E, Loizeau K, Bastien O, Bréhélin L, Joyard J, Cintrat J-C, Falconet D, Block MA, Rousseau B, Lopez R, Maréchal E. Chemical inhibitors of monogalactosyldiacylglycerol synthases in Arabidopsis thaliana. Nat Chem Biol. 2011;7 (11):834–842. doi: 10.1038/nchembio.658. http://www.nature.com/nchembio/journal/v7/n11/abs/nchembio.658.html#supplementary-information. [DOI] [PubMed] [Google Scholar]
- 33.Nakamura Y, Shimojima M, Ohta H, Shimojima K. The Chloroplast: Advances in Photosynthesis and Respiration. Vol. 31. Springer Verlag; New York: 2010. Biosynthesis and Function of Monogalactosyldiacylglycerol (MGDG), the Signature Lipid of Chloroplasts; pp. 185–202. [Google Scholar]
- 34.Joyard J, Douce R. Galactolipid Synthesis. In: Stumpf PK, editor. The Biochemistry of Plants. Vol. 9. Academic; New York: 1987. pp. 215–274. [Google Scholar]
Associated Data
This section collects any data citations, data availability statements, or supplementary materials included in this article.


