

Summary
The ventromedial hypothalamus (VMH) was thought to be essential for coping with threat, although its circuit mechanism remains unclear. To investigate this, we optogenetically activated steroidogenic factor 1 (SF1)-expressing neurons in the dorsomedial and central part of VMH (VMHdm/c), and observed a range of context dependent somatomotor and autonomic responses resembling animals' natural defensive behaviors. By activating independent pathways emanating from VMHdm/c, we demonstrated that VMHdm/c projection to the dorsolateral periaqueductal gray (dlPAG) induces inflexible immobility, while the VMHdm/c to anterior hypothalamic nucleus (AHN) pathway promotes avoidance. Furthermore, consistent with the behavior changes induced by VMH to AHN pathway activation, direct activation of the AHN elicited avoidance and escape jumping but not immobility. Finally, retrograde tracing studies revealed that nearly 50% of PAG- projecting VMHdm/c neurons send collateral projection to the AHN and vice versa. Thus, VMHdm/c neurons employ a one-to-many wiring configuration to orchestrate multiple aspects of defensive behaviors.
Introduction
Many species develop coping strategies to avoid danger and to survive. Given that these defensive reactions are innate, the neural mechanism underlying these behaviors is likely hardwired. The hypothalamus plays a critical role in the expression of defense behavior (Bard, 1928). Decorticated cats display a mixed pattern of rage and defense responses, such as hissing and paw striking, only if the caudal hypothalamus is left intact. Conversely, classic electric and chemical stimulation experiments demonstrated that a pattern of somatomotor and autonomic responses that resemble the behavior of animals facing natural threats can be elicited from the medial hypothalamus in many species, including human (Fernandez De Molina and Hunsperger, 1962; Lammers et al., 1988; Lipp and Hunsperger, 1978; Schmitt et al., 1985; Silveira and Graeff, 1988; Wilent et al., 2010). In fact, there appears to be an interconnected hypothalamic defense circuitry, which comprises the AHN, VMHdm, and dorsal part of the premammillary nucleus (PMd), that shows strong immediate-early gene responses in rats and mice exposed to live predators (Canteras et al., 1994; Canteras and Swanson, 1992; Dielenberg et al., 2001; Martinez et al., 2008; Risold et al., 1994). Recently, manipulations focusing on the dorsomedial and central VMH (VMHdm/c) showed that pharmacogenetic inactivation of the area reduces freezing and head-out responses to a natural predator (Silva et al., 2013), while optogenetic activation of VMH cells could elicit immobility especially when the manipulated area involves VMH dorsomedial and central compartments (Lin et al., 2011). This suggests that the VMHdm/c acts as an essential relay in innate defense.
The exact role of the VMHdm/c in defense and its underlying circuit remains unknown. In this study, we found that optogenetic activation of VMHdm/c promotes a variety of context-dependent defense-like somatomotor and autonomic responses. Furthermore, we examined the role of two pathways from the VMHdm/c in mediating these behaviors: the main ascending projection to the AHN (a key component of the hypothalamic defense circuitry) and the main descending projection to the dlPAG (a midbrain structure known for its involvement in defensive responses) (Brandao et al., 2008; Canteras et al., 1994; Martinez et al., 2008). We found that although a substantial portion of VMHdm/c neurons send collateral projections to the AHN and the dlPAG, these two pathways mediate distinct aspects of defensive responses. Whereas activation of the VMH→AHN pathway elicits avoidance, activation of the VMH→PAG pathway elicits immobility but not avoidance. Consistent with the pathway activation result, direct activation of AHN cells elicits avoidance but no immobility. Thus, we conclude that VMHdm/c neurons orchestrate instantaneous stereotyped immobility and flexible escaping, at least in part, through their collateral descending projection to the PAG and ascending projection to the AHN.
Results
VMHdm/c stimulation induces activity and context-dependent defensive behavior
To manipulate VMHdm/c cells, we used a well-characterized transgenic line that expresses CRE recombinase under the regulation of the SF1 promoter (Dhillon et al., 2006). In the central nervous system, SF1 expression is largely limited in the VMH (McClellan et al., 2006). By crossing the SF1:CRE line with a GFP reporter line, we observed that 58.5% of VMHdm/c cells and 47.2% of VMHvl cells are GFP-positive (Figure 1A, N = 3). In combination with precise stereotactic injection of CRE-dependent virus, we limited our exogenous protein expression primarily to the VMHdm/c (Figure 1B and C). We tested whether spiking activity could be induced by light activation of SF1 neurons that express channelrhodopsin (ChR2) (Boyden et al., 2005). Two weeks after injecting adeno-associated virus (AAV)-expressing CRE dependent ChR2-EYFP into the VMHdm/c of SF1:CRE mouse, we delivered pulsed blue light (473 nm, 5 Hz, 1 ms) through an implanted optrode, and observed reliable light-evoked spikes in the VMHdm/c (Figure 1D–F).
Figure 1. Optogenetic stimulation of SF1 neurons in the VMHdm/c induced spiking activity.
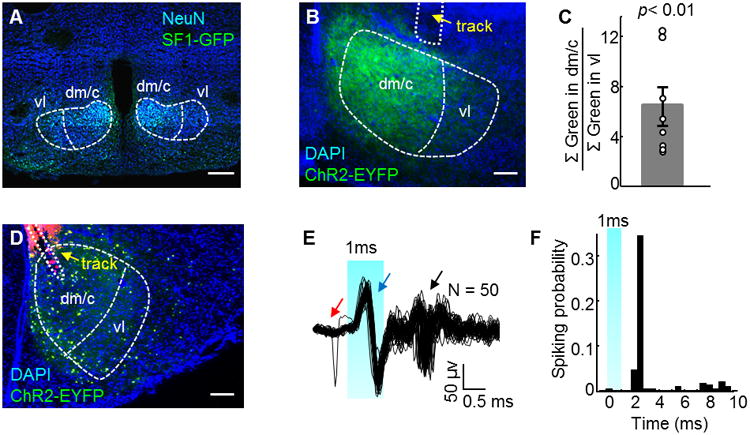
(A) GFP (green) staining reveals SF1 positive cells in the VMH of an SF1:CRE × RCE:loxP mouse. Blue: NeuN. Scale bar: 500 μm. (B) Virally expressed ChR2-EYFP (green) is concentrated in the VMHdm/c. Blue: DAPI. Scale bar: 200 μm. (C) The ratio of accumulated pixel values of EYFP expression (green channel) in the VMHdm/c relative to in the VMHvl (N=8) is significantly more than 1 (Student's t test). Error bar: standard error. Each dot represents data from one animal. (D) Optrode (yellow arrow) track in the VMHdm/c. Green: ChR2-EYFP; blue: DAPI; red: DiI painted on the optrode. Scale bar: 200 μm. (E) 50 overlaid electrophysiological traces aligned to the 1-ms light onset. Red arrow: spontaneous spike; black arrow: evoked spikes; blue arrow: stimulation artifacts. (F) Spiking probability (number of spikes/number of trials) aligned to the light onset. Bin size = 0.5 ms. Blue shading: light on.
We next tested the behavioral changes induced by light activation of VMHdm/c SF1 neurons. In the animal's home cage, blue light delivery (1 mW, 20 Hz, 20 ms) immediately reduced or completely suppressed animals' movement. As the light intensity increased (up to 6 mW), we noticed that some animals started to run along the perimeter of the cage after initial immobility and sometimes showed repeated wall rearing and escape jump (12/31). Figure 2A and B show all 31 animals' behavior induced by high intensity light. Figure 2C shows 8 animals that exhibited jumping under high intensity light and were systematically tested with low intensity light (Movie S1). At the offset of the 60 s stimulation, the animal often appeared agitated for 10-60 s, as indicated by its significantly increased movement velocity (Figure S1A). To quantify these behavioral changes, we tracked animal's body center location (Burgos-Artizzu et al., 2012; Dollar et al., 2010). Then, we calculated the movement velocity at the XY plane with top-view tracking and the vertical movement velocity and elevation with side view tracking (Figure S2A and B). For a given frame, immobility, running, and jumping episodes were then detected based on the combined measures of instantaneous velocity and location of the animal. The performance of our automated behavioral detection program was validated by comparison with human annotation (Figure S2C–F).
Figure 2. Optogenetic stimulation of SF1 neurons in VMHdm/c-induced defensive behaviors.
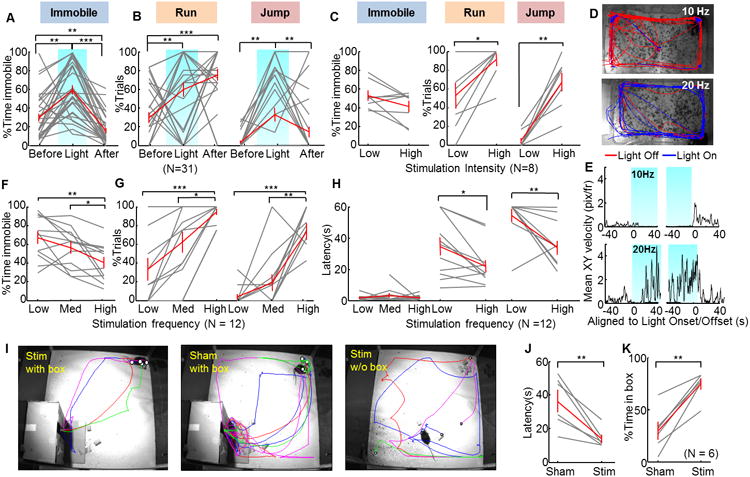
(A and B) The average percentage of time that the animal spent immobile (A) and the average percentage of trials with running and jumping events (B) were significantly higher during light delivery (N=31). (C) Increased light intensity increased the percentage of trials with running and jumping events but did not significantly change the time of immobility (N=8). (D) Examples of tracking traces with 10-Hz (5 trials) and 20-Hz (6 trials) light pulses. Blue and red traces: light on and off periods, respectively. (E) PSTHs of locomotion velocity aligned to the 10-Hz (top) and 20-Hz (bottom) stimulation onset (left blue shading) and offset (right blue shading). (F–H) Increases in light-pulse frequency decreased the time spent immobile (F), increased the percentage of trials with running and jumping events (G), and shortened latency to running and jumping but did not change latency to immobility (H). N=12. (I) Representative tracking traces during the hiding box test. Different colors represent different stimulation trials. The white dot indicates the animal's position at light onset. (J–K) Light stimulation shortened latency to return to the box (J) and increased total percentage of time in the box (K). N=6. Gray and red lines indicate data of individuals and population average, respectively. Error bars: standard errors. Paired t-test: *p<0.05, **p<0.01, ***p<0.001. See also Figure S1-2 and Movie S1-2.
The running and jumping responses increased with stimulation intensity (Figure 2C) and frequency (Figure 2G). In the 12 animals that we observed light induced jumping in at least one trial, low frequency stimulation (5–10 Hz) primarily induced immobility (on average, 67.2% of total stimulation time), some running (33.1% of all trials), and rarely jumping (4.2% of all trials). Increasing the stimulation frequency to high (15–20 Hz) significantly reduced the immobility time (on average, 40.4% of total stimulation time), while it increased both running (94.2% of all trials) and jumping events (73.6% of all trials) (Figure 2D–G). Increased stimulation frequency also decreased the latency to running and jumping significantly but the latency to immobility remained similar and much shorter (Figure 2H). Thus, VMHdm/c SF1 cell optogenetic activation induced a range of behavioral responses that resemble the animals' reaction to an approaching predator (Blanchard et al., 1998). The exact form of response depends on both the frequency and intensity of the light, which presumably affect the spiking rate and the number of activated cells, respectively.
When a prey animal encounters a predator, its defensive reaction depends on the distance from the predator as well as the availability of a shelter. If a shelter is nearby, the most likely adopted defensive strategy is hiding (Blanchard et al., 1995; Eilam, 2005). To test whether activation of SF1 neurons can induce hiding, we examined the behavior response of the animal when the light is delivered in a large arena containing a hiding box (Figure 2I). During the test, animals first freely explored the arena for 10 min. Thereafter, interleaved sham and real stimulations were initiated when the animal reached a designated corner far from the hiding box (Figure 2I). We found that although light stimulation sometimes induced immobility briefly, all animals quickly took a direct route back to the hiding box (Figure 2I, Movie S2). Across animals, the latency to the hiding box during real stimulation is significantly shorter than that during sham stimulation (Figure 2J). Once reaching the hiding box, the animal stayed inside of the box despite continued light stimulation. As a result, the animal spent approximately 75% of time in the hiding box during real stimulation but less than 30% during sham stimulation (Figure 2K). If the stimulation started when the animal was already in the box, the animal remained in the box for the entire stimulation period (8 trials from 3 animals). In contrast, in the absence of a hiding box, the stimulation induced immobility and sometimes running from corner to corner (Figure 2I), both of which are behaviors similar to those observed in the home cage (Figure 2A). Taken together, VMHdm/c SF1 cell activation did not elicit a set of stereotyped motor actions but instead induced defensive behaviors suitable for the environment.
VMHdm/c SF1 cell stimulation induced autonomic responses
The defensive reaction in the face of danger is not only reflected in the motor response but also involves concomitant neuroautonomic adjustment. Thus, we next measured changes in heart rate (HR), breathing rhythm, and pupillary size during VMHdm/c SF1 cell stimulation. In a head-fixed preparation, we recorded the pupil response in awake animal and found that pupil diameter increased by approximately one third during light activation and gradually returned to the baseline over 10–20 s after light offset (Figure 3A, Movie S3). The slow recovery of pupil size after light stimulation might result partly from an increase in post-light locomotion, given that we noticed pupil dilation during spontaneous movement in the absence of stimulation (Figure 3B). However, the sharp increase in pupil size during light exposure is not movement-related, as locomotion is largely suppressed during light. In addition, the breathing rate also increased by approximately one third during stimulation (Figure 3D). Increasing light intensity sometimes increased the response magnitude but never changed the response direction (Figure 3A, C and D). These light-evoked pupillary and respiratory responses are consistent with those observed during natural danger exposure, indicating the activation of sympathetic nervous system (Hofer, 1970; Hofle et al., 2013).
Figure 3. VMH SF1 neuron stimulation induced autonomic responses.
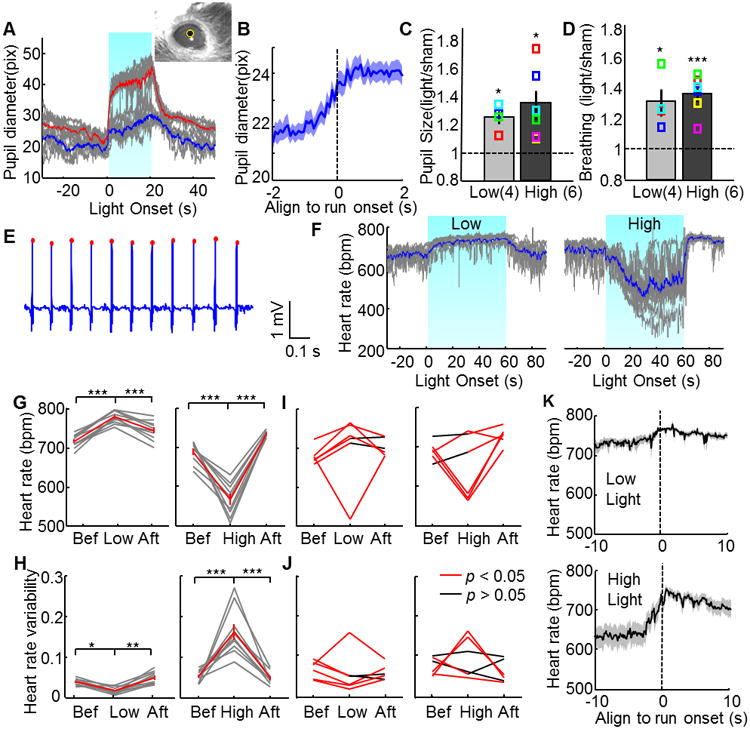
(A) PSTHs of the pupil diameter aligned to light onset. Gray lines indicate individual trials. Blue and red lines indicate the average response curve under low- (blue) and high- (red) intensity light. Upper right corner shows a representative image with computer detected pupil (yellow circle). (B) Pupil diameter aligned to spontaneous running (N=102 trials; 5 animals). (C–D) Significantly increased pupil diameter (C) and breathing rate (D) during low (N=4) or high (N=6) intensity light stimulation. Colored squares show individual animals. (E) Raw ECG trace with computer detected heart beats (red dots). (F) PSTHs of heart rate aligned to light onset. Note opposite HR response during low- (left) and high- (right) intensity light. (G, H) HR (top) and HRV (bottom) changes during low- and high-intensity light stimulation of an example animal. Gray: individual trials. Red: average. (I, J) HR (top) and HRV (bottom) changes of all 6 animals during low- (left) and high- (right) intensity light stimulation. Red line indicates response during light is significantly different from before or after period (FDR adjusted p< 0.05, paired t-test across trials for each animal). (K) PSTHs of HR aligned to the onset of running events during either low (top, N=11) or high (bottom, N=22) intensity light stimulation. See also Movie S3.
We also measured the light-induced cardiovascular response in freely moving animals using chronically implanted electrodes (Figure 3E). At low light intensity (0.8–1.7 mW), stimulation induced a significant increase in HR and decreased heart rate variability (HRV) in all but one animal (5/6) (Figure 3F–J). However, when the light intensity increased (2.5–5 mW), the light-induced HR response changed. For those 5 animals that showed a tachycardia response under low light, the HR remained increased under high intensity light for one animal, decreased in two animals, and changed variably in the remaining two animals (decreased for some but not all trials) (Figure 3F–J). One animal (1/6) showed a bradycardia response under both low and high intensity light (Figure 3I and J). The light-induced tachycardia and bradycardia responses have different kinetics. For the former, the HR increases gradually after light onset, reaching a plateau in approximately 10 s; at light offset, the HR decreases gradually and returns to the pre-stimulation level in 15–20 s. In contrast, the light-induced bradycardia response can take 30–40 s to reach a stable level, sometimes as low as half of the baseline rate and at the light offset the HR returns to the baseline level nearly instantaneously (Figure 3F). This qualitatively different cardiovascular response under low- and high-intensity light cannot be explained by behavioral difference, as animals showed immobility for at least the first 10–30 s during both light conditions. On the other hand, HR always increases to a high level (∼750 bpm) as the animal prepares to run regardless of the stimulation condition (Figure 3K). Thus, SF1 cell activation can induce complex cardiovascular responses depending on the intensity of light stimulation and ongoing behaviors. In general, low level activation of VMHdm/c SF1 cells induces a tachycardia response, whereas high level activation induces a bradycardia response.
VMHdm/c activation promotes behavioral avoidance
The ultimate goal of activating the defense circuit is to survive, and avoidance is a critical strategy. Thus, we next tested whether increased VMHdm/c activity promotes avoidance using a real-time place preference test (RTPP). During the test, the animal first freely explored an arena with two distinct compartments for 5–10 min prior to any light stimulation. Then, the compartment in which the animal spends more time was assigned as the stimulation chamber. During the 30-min stimulation period, the animal received blue light pulses (3-s on and 2-s off, 20 Hz and 20 ms) whenever it entered the stimulation chamber; the stimulation was turned off when the animal entered the safe chamber and when the 3-s light on period ran out (Figure 4A and B). If the animal failed to exit the stimulation chamber within 3 min, the light was turned off for 15 s before resuming the stimulation protocol. The stimulation intensity used in the test is relatively low, eliciting only immobility in the home cage. Consistent with the light-induced behavioral changes in the home cage, during initial rounds of entries into the stimulation chamber, test animals increased immobility during light stimulation and as a result might spend hundreds of seconds in the stimulation chamber before exiting (Figure 4C, red arrow, Movie S4). However, after 1–3 entries, all animals learned that stimulation could be avoided by entering the safe chamber. They significantly decreased the latency to exit the stimulation chamber and increased their time in the safe chamber (Figure 4C–E). Furthermore, while light stimulation increased immobility initially, 13/18 animals showed no immobility under light delivery during later entries; instead they quickly turned around and exited the stimulation chamber (Figure 4H, Movie S4). Consequently, when stimulation periods are considered altogether, most animals spent less time immobile during stimulation compared with the pretest (Figure 4G). This decreased immobility is opposite to the increased immobility observed in the home cage (Figure 2A), supporting that the VMHdm/c induced defensive responses is flexible, depending on whether an escape option is available or not. Finally, despite the initial immobility induced by VMHdm/c stimulation that increased the time spent in the stimulation chamber, the total percentage of time in the stimulation chamber over the 30-min testing was significantly reduced across all the animals (N = 18), suggesting that VMHdm/c stimulation promotes avoidance (Figure 4F).
Figure 4. VMH SF1 neuron activation promoted avoidance.
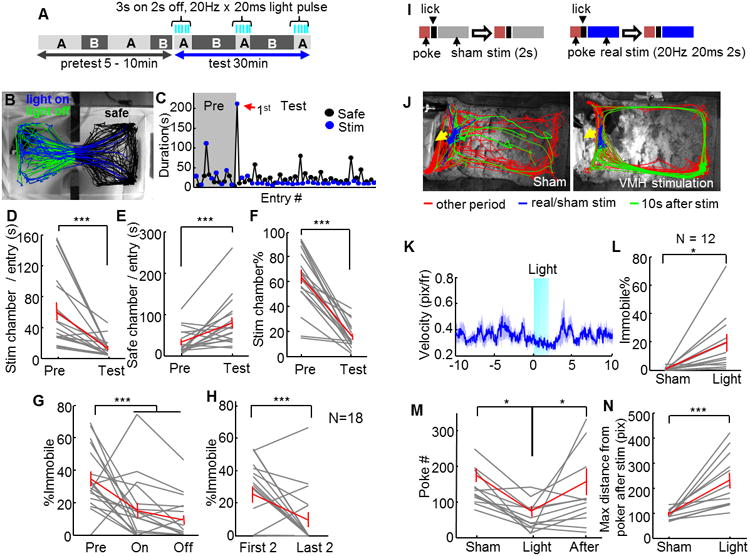
(A) Experimental schematic of real time place preference test. (B) Tracking traces from one test session. (C) Time spent in safe and stimulation chamber during each entry of the session shown in (B). Red arrow indicates the first entry into the stimulation chamber during test. (D–F) Stimulation of the VMHdm/c decreased the duration in the stimulation chamber per entry (D), increased the duration in the safe chamber per entry (E), and decreased the percentage of time in the stimulation chamber (F). (G) The animal spent a smaller percentage of time immobile during and between stimulation compared with the pretest. (G) Percentage of time immobile during the last two entries to the stimulation chamber was much less than that during the first two entries. D–H: N=18. (I) Schematics of punishment operant conditioning. (J) Tracking traces during sham (left) and VMH (right) stimulation. Yellow arrows indicate nose ports. Note the limited movement during light stimulation (blue) and increased movement along the perimeter of the cage (green) after stimulation. (K) Locomotion velocity (mean ± SEM) aligned to the 2-s light stimulation (light blue) onset in the home cage (N=66 trials from one animal). (L) Increased immobility during VMH stimulation in comparison to sham stimulation. (M) The poking number significantly decreased with VMH stimulation but returned to baseline one day after stimulation. (N) Animals moved away from the poker after VMH stimulation. N=12 for K–N. Gray and red lines indicate results from individual animals and population average, respectively. Error bars: standard errors. Paired t-test. *p<0.05, ***p<0.001. See also Movie S4.
Given that prolonged VMHdm/c stimulation could increase locomotion, we tried to decouple the avoidance behavior from changes in movement using a 2-s low-intensity stimulation protocol in a punishment operant conditioning task (Figure 4I–J). When tested in the home cage, the 2-s stimulation slightly reduced animals' movement but caused no significant change in locomotion after stimulation (p = 0.135, paired t test for mean velocity during 10 s before and 10 s after stimulation, a total of 189 trials from 3 animals, Figure 4K). During the punishment operant conditioning task, water-deprived animals first learned to associate nose poking with water reward. Once stable poking performance was achieved (poke number ±10% for two consecutive days), each poke was then followed by a brief light pulse (2 s, 20 Hz and 20 ms) triggered 0.8 s after poking (Figure 4I). If the stimulation was considered negative, this punishment was expected to reduce the number of pokes. Consistent with the results of RTPP test, pairing the poking with VMHdm/c activation significantly decreased the number of pokes during the 30-min testing session, although the decrease was not maintained when the animals were tested the next day with no light pairing (Figure 4M). The decreased poking could not be accounted for by immobility caused by stimulation, given that most animals continued licking the water spout during stimulation, and on average spent only 20% of the time immobile (Figure 4L). However, after several paired stimulations, animals moved away from the poker and sometimes stayed in a far corner for hundreds of seconds before poking again (Figure 4N). Taken together, we concluded that VMHdm/c stimulation could induce complex autonomic changes and defense-like motor responses, including immobility, escape jumping, hiding and avoiding.
Defensive reactions induced by activating the VMH→PAG and VMH→AHN pathways
To understand the pathways underlying the observed behavioral change, we took advantage of the membrane localization of ChR2-EFYP protein and mapped the terminal fields of the VMHdm/c SF1 neurons. Consistent with previous reports, rostrally, VMHdm/c axons innervate the AHN, periventricular nucleus (PVN), medial preoptic nucleus (MPN), and posterolateral part of the bed nucleus of stria terminalis (BNSTpl) (Figure 5C and D) (Canteras et al., 1994; Lindberg et al., 2013). In particular, we noticed that the ventral part of the AHN (sometimes referred to as the lateroanterior hypothalamic nucleus (Franklin and Paxinos, 2008)) contains an especially dense terminal field (Figure 5G). This cluster of axons can also be observed when surveying the online connectivity database (http://connectivity.brain-map.org/ experiment ID: 182337561 using the same SF1:CRE transgenic line (Figure 5A). Dorsally, axons reach the paraventricular thalamic nucleus (PVT) (Figure 5C and D), and laterally, moderate number of fibers can be observed in the central amygdala (CEA), lateral amygdala (LA), medial amygdala (MEA) and posterolateral cortical amygdala (COApl) (Figure 5D, E). Caudally, the PAG represents the major target of VMHdm/c axons. A large portion of fibers course through the dorsomedial hypothalamus (DMH) and posterior hypothalamus (PH), and eventually reach the PAG. The remaining axons project ventrally through the premammillary nucleus and mammillary body, and then take a lateral route through the parvocellular subparafascicular thalamic nucleus (SPFp) to the PAG (Figure 5E and F). At the rostral PAG (rPAG), VMHdm/c axons are concentrated in the dorsal half of the PAG while both the dorsal and ventral caudal PAG (cPAG) are innervated by VMHdm/c fibers (Figure 5E, F and H). Taken together, the PAG is the most important target of the VMHdm/c descending pathway, while the AHN (especially its anterior ventral part) receives dense input from the VMHdm/c ascending axons and represents the first major target in this direction. Consistent with SF1 cell projection pattern, activation of the VMHdm/c SF1 cells induced strong immediate-early gene (Fos) expression in both ventral AHN and PAG (Figure S3). Thus, we decided to investigate the behavioral responses mediated by the VMH→AHN and VMH→PAG connections.
Figure 5. VMH→AHN and VMH→PAG terminal stimulation induced defense-like motor responses and avoidance.
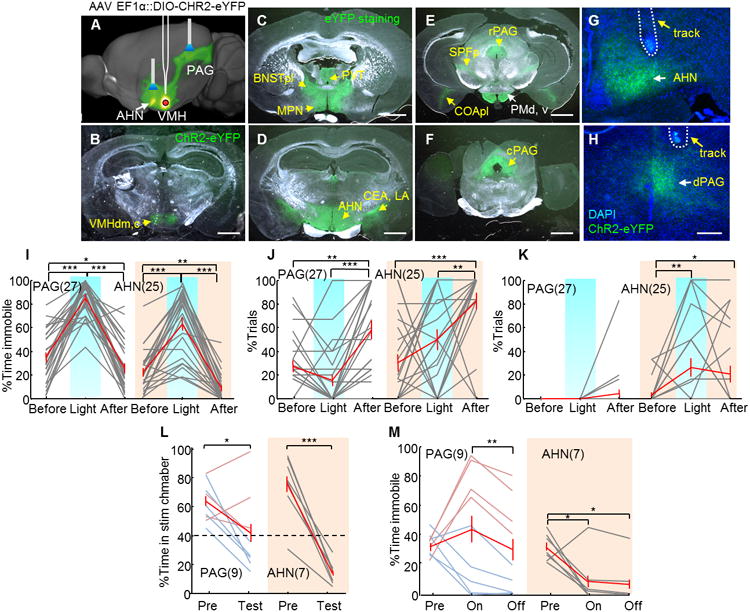
(A) Schematic representation of VMH→AHN and VMH→PAG terminal stimulation. Image adopted from http://connectivity.brain-map.org/ experiment ID: 182337561. (B) Native expression of EYFP in an SF1:CRE mouse bilaterally injected with AAV2 expressing CRE-dependent ChR2-EFYP. (C–F) EYFP staining reveals the terminal fields of VMHdm/c SF1 neurons (green). Scale bars in B–F: 1 mm. (G–H) An example of fiber terminals (green) and cannula/optic fiber tracks (yellow arrows) in the AHN (G) and the PAG (H). Blue: DAPI. Scale bar: 200 μm. (I–K) Stimulating the VMH→PAG pathway significantly increased immobility (I, left) but not running (J, left) or jumping (K, left) whereas VMH→AHN axon terminal stimulation increased immobility (I, right), running (J, right) and jumping (K, right). (L) VMH→AHN terminal stimulation (right) decreased the percentage of time spent in stimulation chamber in all animals, whereas the VMH→PAG terminal stimulation (left) induced avoidance only in 5/9 animals (light blue lines). Dashed line indicates 40% time in stimulation chamber. (M)VMH→AHN stimulation (right) decreased immobility while VMH→PAG stimulation (left) induced heterogeneous changes in immobility. Gray and red lines indicate individual result and population average. (PAG: N=9; AHN: N=7). Error bars: standard errors. Paired t test *p<0.05, **p<0.01, ***p<0.001. See also Figure S3 and 4 and Movie S5.
To manipulate the VMH→AHN and VMH→PAG pathways, we virally expressed ChR2-EYFP in VMHdm/c SF1 neurons and positioned the optic fiber 0.4–0.8 mm above either the AHN or dlPAG (Figure 5A, G and H). Given the close proximity of the VMH and AHN (approximately 1 mm apart), we used a beveled cannula to reduce the spread of light from the AHN to the VMH (Tye et al., 2011). Our in vitro measure showed that light intensity decreased to less than 10% of that of the source at 1 mm away from the protected side of cannula ending point. Given that the minimal light intensity required to induce the behavioral change with VMH→AHN stimulation (0.4 to 3.0 mW) is comparable to that required for the VMHdm/c direct activation (0.8 to 3.5 mW), the spillover light from AHN is unlikely to activate VMHdm/c cell bodies strongly enough to induce behavioral changes directly. Whereas activating the VMH→AHN pathway (N = 25) induced immobility, running and escape jumping similar to VMH cell body activation, VMH→PAG activation (N = 27) only increased immobility even when the stimulation intensity is high (20 ms, 20 Hz, 3.2–6.7 mW) (Figure 5I–K, one example is shown in Figure S4C–D). Immobility induced by VMH→PAG appears to be more solid than VMH stimulation as the animal ceased all the movements, including those of the head and tail (Movie S5). When comparing the movement velocity during VMH, VMH→AHN and VMH→PAG stimulation at high intensity (>3 mW) and high frequency (20 Hz), only VMH→PAG stimulation significantly reduced the locomotion velocity upon light delivery (Figure S1A–C). Similar to VMH cell body activation, stimulating both VMH→PAG and VMH→AHN simultaneously caused a post-stimulation increase in movement velocity (Figure S1 A–C).
In the two chamber preference test, across all animals, the VMH→AHN pathway stimulation significantly reduced the percentage of time animal spent in the stimulation chamber (Figure 5L, an example session is shown in Figure S4E–G) and decreased the percentage of time that the animal was immobile (Figure 5M). In contrast, the effect of VMH→PAG stimulation was less consistent across animals, with 5/9 animals learning to avoid the stimulation chamber (Figure 5L, left, light blue, one example in Figure S4H–J) while the remaining animals did not (Figure 5L, left, light red, one example in Figure S4K–M). The behavioral heterogeneity is also obvious when examining the level of immobility during stimulation. Avoided animals decreased immobility during stimulation, while unavoided animals showed the opposite trend (Figure 5M, left).
VMHdm/c neurons bifurcate to both AHN and PAG
Given that terminal optogenetic activation could cause spiking activity in cell bodies, if VMHdm/c cells bifurcate to both AHN and PAG, the VMH→AHN like response elicited by VMH→PAG stimulation could be caused by the back propagation of action potentials from PAG to VMH cell bodies which in turn recruit AHN (Jennings et al., 2013). This possibility is supported by previous retrograde tracing studies showing that nearly 50% cells in ventrolateral subdivision of VMH send collateral projections to MPN, MEA, and/or PAG (Akesson et al., 1994). However, recent studies focusing on another hypothalamic region, the arcuate nucleus (ARC), revealed that non-overlapping AGRP cells project to each of its downstream regions to form functionally redundant parallel pathways (Betley et al., 2013). Thus, in one scenario, the VMH→PAG and VMH→AHN may represent two independent pathways to mediate largely redundant defensive responses. Alternatively, overlapping cells in the VMHdm/c may send collateral projections to the AHN and PAG to mediate aspects of defensive responses.
To investigate the origin of the VMH→PAG and VMH→AHN projecting neurons, we injected cholera toxin b subunit conjugated with Alex dye 488 (CTB-488) into the PAG, and CTB-555 into the AHN in the same animal (Figure 6A–C). Five of the fourteen injected animals had both injection sites centered in the regions of interest, and were analyzed in detail (Figure S5A–B). On average, 46% of VMHdm/c neurons are retrogradely labeled from the PAG, while 51% of cells are labeled from the AHN (Figure 6F). Among all of the retrogradely labeled cells, 47% of PAG-projecting cells and 44% of AHN-projecting cells are dual-labeled, and 75% of them are SF1 positive (Figure 6D–H, Table S1). Thus, activating SF1-expressing cells will recruit a large percentage of AHN, PAG, and dual projecting VMHdm/c cells. To estimate the upper limit of our efficiency in retrogradely labeling cells, we co-injected CTB-488 and CTB-555 into the PAG (Figure S5C–E). Among the 3 well targeted animals, we found that approximately 75% of the cells were dual labeled (Figure S5G–H, Table S1). Taken together, we estimate that at least two thirds of the VMHdm/c cells project to the PAG or AHN. Among them, over half send collateral projections to both areas.
Figure 6. VMHdm/c neurons sent collateral projections to the AHN and PAG.
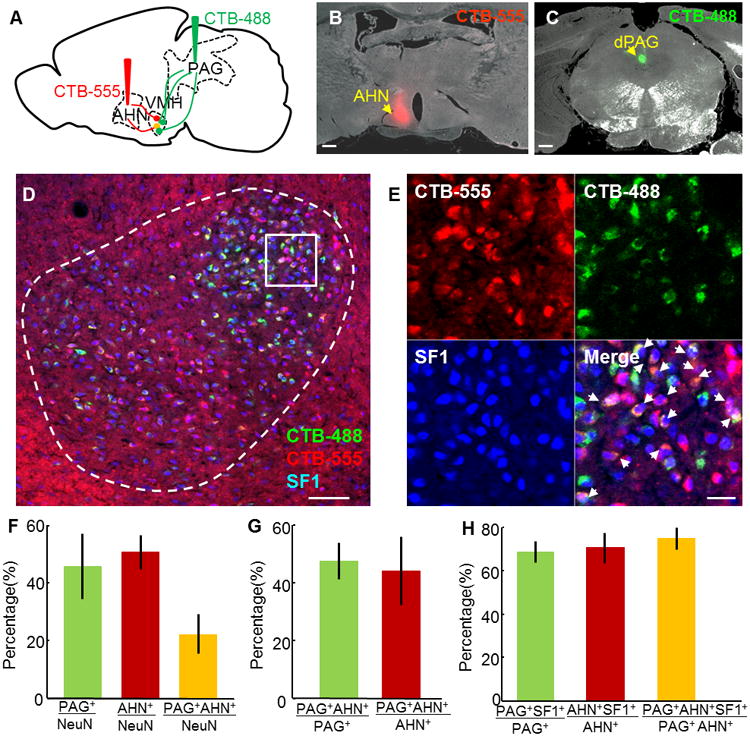
(A) Retrograde tracing experiment. (B–C) Injection sites in the AHN (B) and the dlPAG (C) of one animal. Scale bars: 0.5 mm (D) Retrogradely labeled neurons in the VMH from the PAG (green) and the AHN (red), co-stained with SF1 antibody (blue). Scale bar: 100 μm. (E) Individual channels and merged view of the boxed area in (D). White arrows indicate triply labeled neurons. Scale bar: 20 μm. (F) Percentages of PAG (green), AHN (red), and dual projecting neurons (yellow) among all the VMHdm/c neurons. (G) Percentages of dual projecting neurons in PAG-projecting (green) or AHN-projecting (red) populations. (H) Percentages of SF1-positive neurons in the PAG-, AHN-, or dual-projecting populations. N=5 for F and G. N=3 for H. Error bars: standard errors. See also Figure S5 and Table S1.
Distinct roles of the VMH→PAG and VMH→AHN pathways in mediating defensive response
Given that many VMHdm/c cells send projections to both PAG and AHN, it is likely that activation of the VMH→PAG pathway also activate some AHN neurons indirectly. Consistent with this hypothesis, activation of the PAG fiber terminals induced a weak increase of Fos expression in the AHN and vice versa (Figure S3). To eliminate the indirect recruitment of a collateral projection, we tried to block back propagation of action potentials using several approaches, including halorhodopsin (NpRH3.0), lidocaine, tetrodotoxin (TTX) and bupivacaine (Gradinaru et al., 2010; Pereira and Morrell, 2009). Among the four tested methods, injection of 0.3 μl of 4% bupivacaine completely blocked behavioral changes induced by light stimulation, and lasted for at least 45 min (Figure S6A). Importantly, bupivacaine caused little change in animals' locomotion during the place preference test (Figure S6B, N = 11) and did not change the level of nose poking at the baseline level (Figure S6C, N = 8). Thus, bupivacaine was chosen as the method to suppress VMH activity and prevent back propagation of action potentials.
We attempted to block VMHdm/c cell body activation with bupivacaine in 11 animals that showed clear aversion to the stimulation chamber in the RTPP test (Figure 7B). Among them, blocking was successful in 6 animals, as they no longer showed aversion to the stimulation chamber with VMH stimulation (Figure 7C, red). The blocking was ineffective in the remaining 5 animals (Figure 7C, blue), which could be due to the position of the cannula ending being too medial and thus that the drug likely diffused into the ventricle (Figure S7A, blue dots). After confirming the successful blocking of the VMHdm/c cell bodies with bupivacaine in those six animals, we tested behavioral changes during stimulation of the VMH→PAG and VMH→AHN pathways with simultaneous VMH blocking (Figure 7A). After VMH blocking, VMH→PAG stimulation induced homogenous behavioral changes in the RTPP test: all animals significantly increased immobility during stimulation (Figure 7E, left) and showed no avoidance to the stimulation chamber, even after some had learned to avoid the chamber in the absence of VMH blocking (Figure 7D, left, one example in Figure S6D–I). Four additional animals were tested with VMH blocking and VMH→PAG stimulation but with no confirmed success of VMH blocking. Histological analysis suggested that the drug was likely targeted to the VMHdm/c (Figure S6A, red open circles for unconfirmed animals) and their behavioral change was consistent with the 6 blocking-confirmed animals (Combined data in Figure S6J and K). In contrast to the behavioral change observed with VMH→PAG stimulation, all animals with VMH→AHN stimulation learned to avoid the stimulation chamber even after VMH blocking (Figure 7D, right). VMH→AHN stimulation induced little immobility (Figure 7E, right), especially during later entries, 5/6 animals moved out of the chamber without any pause (Figure 7F, right). In contrast, VMH→PAG stimulation induced a high level of immobility throughout the testing period (Figure 7F, left). Thus, after VMH blocking, VMH→PAG stimulation caused immobility but not avoidance, while VMH→AHN induced little immobility but promoted avoidance.
Figure 7. VMH→PAG and VMH→AHN activation with VMH blocking induced distinctive aspects of defensive behaviors.
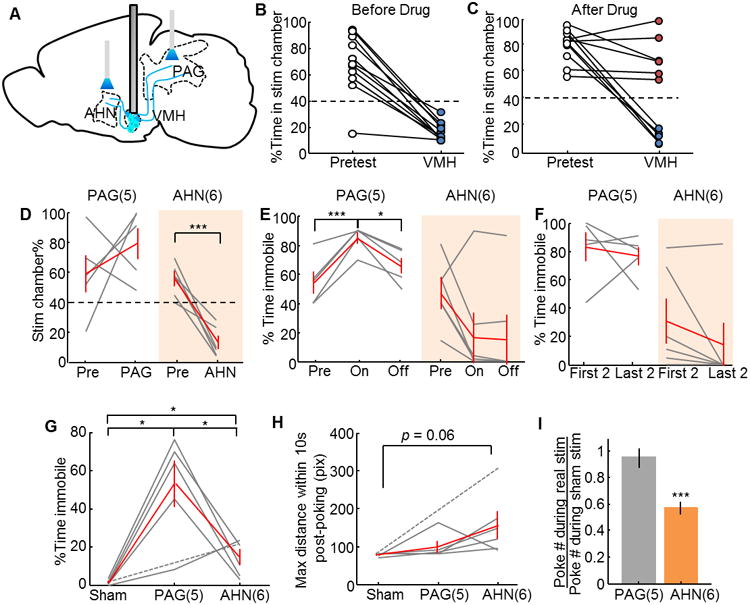
(A) Schematic representation of the experiment. (B) Before blocking, VMH stimulation induced avoidance to the stimulation chamber in all animals (N = 11). (C) Bupivacaine injection blocked VMH stimulation induced avoidance in 6 of 11 animals (red dots) but had no effect on the remaining 5 animals (blue dots). (D) VMH→AHN stimulation (right) but not VMH→PAG stimulation (left) induced avoidance to the stimulation chamber in the RTPP test. (E) VMH→PAG (left) but not VMH→AHN (right) stimulation increased immobility. (F) The immobility induced by VMH→ PAG stimulation (left) is similar and high in the first two and last two entries to the stimulation chamber, whereas 5/6 animals showed low immobility during later VMH→AHN stimulation trials. (G) In the operant punishment test, VMH→PAG stimulation induced higher level of immobility than VMH→AHN or sham stimulation. (H) The animal showed a trend (p = 0.06) to move away from the poker after VMH→AHN stimulation but not after VMH→PAG stimulation. (I) VMH→AHN activation reduced poke number, while VMH→PAG activation did not. Gray and red lines indicate data of individual animals and population average, respectively. Error bars: standard errors. PAG: N = 5; AHN: N = 6; Sham: N = 6. Paired t test in D–F; Unpaired t test in G–I. *p<0.05, ***p<0.001 See also Figure S6-7.
We further tested the potential functional segregation of the VMH→PAG and VMH→AHN pathways with punishment operant conditioning. After stable baseline poking was established, we blocked the VMH and examined poking performance when we paired poking with either VMH→PAG or VMH→AHN stimulation. We found that VMH→PAG stimulation caused a significantly higher level of immobility than VMH→AHN or sham stimulation (Figure 7G). During VMH→PAG stimulation, test animals paused in the middle of licking and resumed normal activity afterwards. During VMH→AHN stimulation, animals continued to lick. However, after several paired stimulations, they moved away from the poker and stayed away for tens to hundreds of seconds (Figure 7H). As a result, VMH→AHN stimulation reduced the total number of pokes significantly (Figure 7I, orange bar). In contrast, despite the short pause of movement elicited by VMH→PAG stimulation, animals showed no avoidance to the poker after VMH→PAG stimulation (Figure 7H) and the overall poke number did not decrease relative to that under the sham condition (Figure 7I). This result is consistent with the functional results from the RTPP test, suggesting distinct roles of the VMH→PAG and VMH→AHN pathways in mediating the stereotyped immobility and flexible avoidance behavior in the face of danger.
Optogenetic activation of AHN induced running, escape jumping and avoidance but not immobility
Although the AHN represents the most prominent anterior target of the VMHdm/c SF1 cells, axons from the VMHdm/c also course through the AHN and reach more anterior and dorsal structures, such as the MPN and the BNST. To investigate whether the behavioral change induced by VMH→AHN activation is solely mediated by fibers of passage, we virally expressed ChR2 in the ventral AHN area and examined the behavioral changes induced by light (Figure 8A). Histological analysis showed that the ChR2 is expressed mainly in the ventral AHN in 5 of the 8 injected animals that were included in the analysis (Figure 8B). Interestingly, although we observed ChR2-EYFP axons in the VMHdm/c, which is consistent with the known afferent pattern of the AHN (Saper et al., 1978), little Fos expression was observed in the VMHdm/c after AHN activation by light, whereas strong Fos expression was observed in the AHN itself (Figure 8C and D). This differential Fos induction pattern also ensured that the virus did not spread to the VMH to cause its direct activation.
Figure 8. AHN stimulation induced jump and avoidance but no immobility.
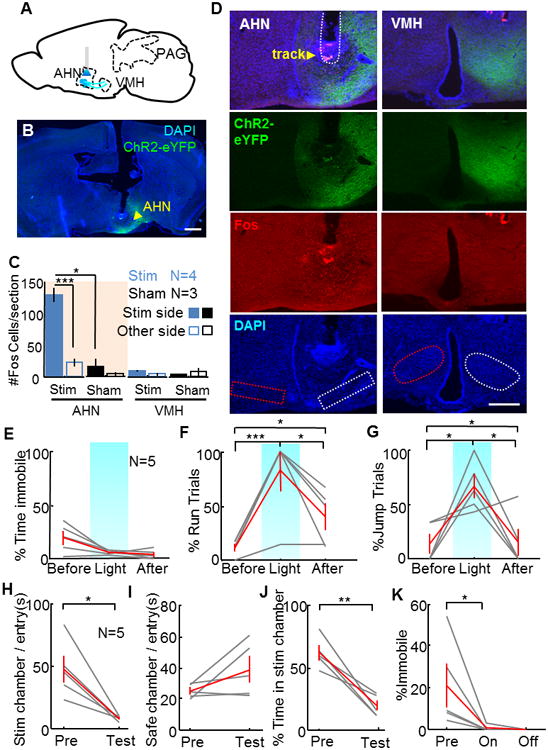
(A) Schematic showing injection and stimulation sites. (B) A coronal section with cannula track and ChR2-EYFP expression (green). Scale bar: 1 mm. (C) Average number of Fos-expressing cells per section at the AHN and VMH after AHN stimulation with light. Two-way ANOVA showed significant difference between stimulation side, stimulation condition and their interaction term for AHN (p<0.01 for all terms) but not VMH (p>0.1 for all terms). Unpaired t-test: *p<0.05, ***p<0.001. (D) Representative images showing the ChR2-EYFP (green) and Fos expression (red) at AHN (left) and VMH (right) after AHN light stimulation. Dashed lines mark the areas for Fos counting. Scale bar: 500 μm. (E–G) AHN light stimulation did not change immobility level (E) but increased the percentage of trials with running (F) and jumping events (G). (H–J) In the RTPP test, AHN stimulation decreased the time in the stimulation chamber per entry (H), did not change the percentage of time in the safe chamber per entry (I), and decreased the total percentage of time in the stimulation chamber (J). (K) AHN stimulation decreased immobility in the RTPP test. N = 5. Paired t test for E–K. *p<0.05, **p<0.01, ***p<0.001.
In contrast to the motor responses induced by VMHdm/c activation, activating the ventral AHN failed to induce immobility. Instead, upon stimulation, animals increased locomotion, reared towards the cage wall, and jumped repeatedly (Figure. 8E, Movie S6). In addition, in the RTPP test, all animals showed strong avoidance to the stimulation chamber. Once the stimulation session started, all animals learned to move out of the stimulation chamber within the first 3 entries (Figure 8H, Movie S7). Across animals, the percentage of time in the stimulation chamber decreased from 62% in the pretest to 19% during test (Figure 8J). Consistent with the home cage results, animals showed no immobility during stimulation (Figure 8K). These results reveal differential roles of VMHdm and AHN in mediating defensive behaviors, and support the notion that escape jumping and avoidance induced by VMHdm/c stimulation is, at least in part, mediated by projection of the VMHdm/c to the AHN.
Discussion
We used optogenetic methods to show that VMHdm/c activation induces complex somatomotor and autonomic responses that resemble animals' natural behaviors in the face of danger. The responses include pupil dilation, an increase in breathing rhythm, changes in HR and HRV, immobility, running, escape jumping, hiding, and avoidance. Combining pathway specific activation and cell body inactivation, we found that VMH→PAG activation elicits immediate stereotyped immobility but not avoidance, while VMH→AHN activation promotes avoidance. Consistent with the pathway activation results, direct activation of ventral AHN cells elicits avoidance but not immobility. Interestingly, many VMHdm/c cells send collateral projections to both the AHN and PAG, suggesting a one-to-many wiring configuration to coordinate multiple aspects of defensive behavior.
The defense like motor and autonomic responses induced from VMHdm/c
In our study, we observed immobility in all 31 experimental animals during VMHdm/c light stimulation despite the fact that the ChR2 expression level and optic fiber position varied among animals. This consistent behavioral change is likely contributed by both the relatively precise and restricted ChR2 expression in the VMHdm/c using SF1:CRE mouse line and the dominance of the defensive behaviors among all innate behaviors. Given that SF1 is also expressed in VMHvl to a small extent, some of the animals showed ChR2 expression in both the VMHdm and VMHvl. However, the VMHvl is unlikely to be responsible for the induced defensive behavior as our previous studies showed that VMHvl activation elicits aggressive behaviors (Lin et al., 2011). Only when the virus spread into the VMHdm/c, defensive-like behaviors were elicited rather than attack (Lin et al., 2011). In this study, we never observed any light-evoked attack, indicating that defensive behavior completely overrides aggressive behavior when neural substrates for both are simultaneously activated.
The light-induced cardiovascular response changed from tachycardia to bradycardia as the stimulation intensity increased despite the fact that immobility was induced under both conditions. This indicates that the cardiovascular response and immobility are dissociable. Consistent with this observation, both the tachycardia and bradycardia responses have been reported to accompany immobility under natural threatening conditions. For example, exposure to an electric shock paired tone induced immobility and a dramatic increase in HR (Stiedl and Spiess, 1997), while HR was strongly suppressed when the animal experiences tonic immobility (“play dead”) during predator exposure (Hofer, 1970). Thus, VMHdm/c neurons may mediate immobility under various contexts that require either an increase or a decrease in HR. Future studies aiming at understanding the response of VMHdm/c cell towards natural threat will help test these hypotheses.
The hypothalamic defense circuit
Based on tracing and immediate early gene studies, the medial hypothalamic defense circuit is proposed to contain three nuclei: the AHN, VMHdm/c, and PMd (Martinez et al., 2008). However, it remains unclear how the danger-associated sensory information is processed by these areas to elicit defensive behaviors. Our studies provide some new insight into the organization of the medial hypothalamic defense circuit.
At the input level, among the three defense nuclei, VMHdm/c receives the most abundant sensory inputs from regions outside of hypothalamus, including olfactory inputs via medial amygdala, auditory, and visual inputs via the posterior part of the basomedial amygdala and somatosensory inputs (especially pain) via the parabrachial nucleus (Canteras et al., 1995; Petrovich et al., 1996; Saper and Loewy, 1980). At the output, although previous studies suggest that the VMH pathway to midbrain involves a synapse in the AHN (Fuchs et al., 1985), our study demonstrated that the VMH to PAG projection is direct and can induce immediate immobility (Figure S8A). This is somewhat surprising as the VMHdm/c mainly projects to dlPAG, which is traditionally believed to be an active emotional coping zone that mediates running and jumping (Bandler and Keay, 1996). Nevertheless, based on the connectivity and our functional manipulation results, VMHdm/c appears to be well positioned to detect predator related sensory cues and to quickly suppress locomotion to minimize the risk of self-exposure.
Classical electrical stimulation studies showed that the AHN and VMH elicit similar behavioral responses, such as flight and escape jumping (Lammers et al., 1988). Tracing studies revealed strong reciprocal connections between these two areas (Canteras et al., 1994; Saper et al., 1978). Thus, it appears that the VMHdm/c and AHN may have redundant roles in mediating defense. However, our studies revealed clear functional distinction between these two areas: while activation of VMHdm/c induced immediate immobility and avoidance, AHN activation induced only avoidance. Furthermore, while VMH stimulation is highly effective in inducing Fos expression in the AHN (Figure S3), AHN stimulation induced little Fos at the VMH (Figure 8C–D). Consistent with our Fos results, an online gene expression database (www.brainmap.org) indicates that VMHdm/c cells are largely glutamatergic, while the AHN contains mostly GABAergic neurons (Figure S8B). Thus, although AHN and VMH are bi-directionally connected, the information transfer between these two areas is likely to be directional.
Surprisingly, although the VMH→AHN and VMH→PAG pathways mediate distinct aspects of the defensive responses, at least 50% of AHN projecting cells are estimated to send a collateral projection to PAG and vice versa, offering an alternative circuit organization scheme from those being proposed recently. In one study, non-overlapping AGRP neurons were shown to target distinct downstream targets, several of which evoke similar feeding responses, forming a one-to-one and redundant output configuration (Betley et al., 2013). In another study, each of the three adBNST downstream areas were shown to receive inputs from separate adBNST subpopulations, and mediates an independent feature of anxiolysis, forming a one-to-one and non-redundant configuration (Kim et al 2013). In contrast, here we show that VMHdm/c neurons employ a one-to-many but non-redundant organization scheme: VMHdm/c neurons send collateral projections to AHN and dlPAG, but each pathway mediates distinct aspect of defensive behaviors. Given that collateral projections exist in many hypothalamic regions and elsewhere, this one-to-many circuit configuration is well-suited to coordinate multiple aspects of a behavior.
Experimental Procedures
Animals
Subjects were SF1:CRE transgenic male and female mice (provided by Dr. Lowell's group at Harvard) (8-24 weeks) and C57BL/6N male and female mice (10-16 weeks, Charles River). Care and experimental manipulations of animals were approved by the IACUC of NYULMC in compliance with the NIH guidelines.
Stereotactic surgery and injection
SF1:Cre mice were injected unilaterally with AAV2/2 ER1α:DIO-ChR2-EYFP into VMH (−4.5 mm AP, +0.4 mm ML, 5.4 mm DV) (Chan et al., 2007). Wild-type mice were injected with a mixture of AAV2/2 CMV:CRE and AAV2/2 ER1α:DIO-ChR2-EYFP into AHN (−3.5 mm AP, 0.4 mm ML, −5.4 mm DV). A double cannula (1-mm center-to-center distance, Plastics One) was implanted 0.4–0.8 mm above AHN and VMH, and an optic fiber with 1.25 mm ferrule was implanted 0.5 mm above dlPAG (−7.7 mm AP, 0.2 mm ML, −1.9 mm DV). For in vivo recording, an optrode attached to a microdriver was implanted in the VMHdm/c. For tracing, 0.12 μl CTB-555 (Life Technologies) was injected into the AHN and 0.12 μl of CTB-488 was injected into dlPAG. For inactivation of the VMHdm/c, 4% bupivacaine (Sigma) dissolved in 0.9% saline was injected through the implanted cannula. Behavioral tests were performed 15 min after injection.
Optrode recording and analysis
Two weeks after injection, the implanted optrode was connected to a 16-channel headstage and a 105-μm multimode optic fiber. In freely moving animals, neural activity was recorded continuously using a commercial system (Tucker-Davis Technologies) as light stimulation (Shanghai dream laser, 473 nm, 1 ms, 5 Hz) was delivered through the optic fiber. The direct activation of ChR2 expressing cell was determined by its latency, jitter as well as its waveform. The placement of the optrode was examined histologically.
Behavioral Tests and analysis
During the home cage test, blue light with low or high intensity and a range of frequency (5, 10, 15, and 20 Hz) was delivered to the VMH, AHN, or PAG. The “low” intensity refers to the minimal intensity required to induce behavioral changes, ranging from 0.8 to 3.5 mW. The “high” intensity refers to three times the minimal intensity, and up to 6 mW. Each stimulation trial lasted for 60 s unless we observed jumping, which would terminate the trial. In the hiding box test, after 10-min habituation, animals were stimulated with low intensity (20 ms, 20 Hz, 1–1.3 mW, 60 s) or sham light pulses whenever they reached one designated corner away from the hiding box. Animals were also tested with the same stimulation condition in the absence of hiding box. For the RTPP test, after 10-min of habituation, the animal was stimulated (3-s on, 2-s off) at the brain site of interest (VMH, AHN, PAG) whenever it entered a designated chamber until it moved out. In the punishment operant conditioning test, animals were deprived of water for 19 h, and then trained to associate nose poking with water delivery for 30 min each day. Once animal reached a steady poking rate (poking number within ±10% for 2 consecutive days), 2-s light pulses were delivered 0.8 s after each poke during test session. Paired t-test was used to compare behavioral parameters with and without light. When multiple pairs of conditions are compared (eg. before, during and after light), the p value was adjusted based on false discovery rate (FDR) 0.05. When shown, error bar means standard error.
Tracking and annotation comparison
Custom tracking software written in MATLAB was used to determine the instantaneous position of the recorded mouse based on side and top-view videos (Dollar et al., 2010). The instantaneous XY and Z velocities of each frame were calculated to determine ‘immobility’, ‘running’, and ‘jumping’ events based on a set criterion. The correlation coefficient between human/human annotations and human/computer annotations were compared to evaluate the performance of our auto annotation program.
Autonomic responses
Pupillary and respiratory responses were measured when animals were head fixed. Low intensity light (0.8–1.7 mW, 20 ms, 20 Hz, 20 s), high intensity light (2.4–5.1 mW), and sham light (0 mW) were interleaved and delivered to VMH (10 times each). Pupillary responses were recorded under infrared lighting. The pupil size of each frame was determined using a custom-written Matlab program. Breathing rate was counted manually, based on the chest movement captured on the video. Cardiovascular responses were measured in free-moving animals using three insulated multi-stranded stainless steel wire leads (A-M system, NO.793200) subcutaneously placed in the animal's left arm, right arm, and right leg. The raw ECG signals were band-pass filtered and the peak of the ECG trace that corresponds to individual heart beat was determined by a custom written Matlab program. The HR was calculated as the inverse of inter-beat-interval. The HRV was calculated as the standard deviation of HR divides the mean of HR.
Histology
Standard immunohistochemistry procedures were followed to obtain and stain the 30 μm brain sections for all mice. 2.5× or 5× fluorescent images were acquired to determine cannula, optic fiber, and optrode placements and tracer injection sites. For Fos cell counting, 10× fluorescent images were used. 20× confocal images were obtained to quantify colocalization of CTB tracers. Cells were manually counted after selecting regions of interest based on DAPI or NeuN staining. To quantify YFP distribution in the VMHdm/c vs. VMHvl, the ratio of the accumulated pixel values in green channel in VMHdm/c and VMHvl was calculated for each section, and then averaged across sections for each animal.
See Extended Experimental Procedures for more details.
Extended Experimental Procedures
Animals
SF1 :CRE transgenic mice were provided by Dr. Lowell group at Harvard University and are currently available from Jackson laboratory (stock No. 012462) (Dhillon et al., 2006). A breeding colony was maintained by mating SF1:CRE mice with C57BL/6N mice (Charles River) at New York University Langone Medical Center (NYULMC). Adult male and female SF1:CRE mice (8–24 weeks) were used for all behavioral and electrophysiological experiments targeting the VMH; wild-type littermates were used for tracing studies. Adult wild-type C57BL/6N male and female animals (10–16 weeks, Charles River) were used for AHN manipulation. To reveal the CRE expression pattern, SF1-CRE mice were mated with GFP reporter mice (RCE:loxP line, provided by Dr. Fishell lab at NYULMC) (Sousa et al., 2009). Mice were maintained on a reversed 12-hour light/dark cycle (noon to midnight as dark cycle) and given food and water ad libitum. All experiments were performed between noon and 7 pm. All procedures were approved by the IACUC of NYULMC in compliance with the NIH guidelines for the care and use of laboratory animals.
Stereotactic surgery and injection
To target the VMH, each animal was injected unilaterally with 0.32 μl AAV2/2 (4.9×10¹³ PFU/ml, UNC Vector Core) coding for Cre dependent ChR2-EYFP under the control of the EF1α promoter (coordinates: −4.5 mm AP, +0.4 mm ML, −5.4 mm DV). To target the ventral AHN, 0.18 μl 1:2 mixed AAV2/2 CMV:CRE (1.9×10¹⁴ PFU/ml, University of Iowa) and AAV2/2 ER1α:DIO-ChR2-EYFP (4.2×10¹³ PFU/ml , UNC Vector Core) was injected (coordinates: −4.5 mm AP, +0.4 mm ML, −5.4 mm DV). Injection was done using a Nanoliter injector (World Precision Instruments) at a speed of 20 nl/min, followed by an additional 10 min before retraction (Chan et al., 2007). For optogenetic stimulation, a double cannula (5.4 mm 26 G thin wall stainless steel tubing, center to center distance is 1.0 mm, Plastics One) was implanted 0.4–0.8 mm above the VMHdm/c (−4.5 mm AP, 0.4 mm ML, −4.6 mm DV) and AHN (−3.5 mm AP, +0.4 mm ML, −4.6 mm DV), and in some cases a 230-μm multimode optic fiber (Thorlabs) with 1.25-mm ferrule was implanted 0.5 mm above dlPAG (−7.7mm AP, 0.2 mm ML, −1.9mm DV). All implanted components were secured to the skull with dental cement (Metabond, Parkell).
For in vivo recording, we modified our chronic in vivo recording electrode to include sixteen 13-μm tungsten microwires and one 105-μm multimode optic fiber (Thorlabs) (Lin et al., 2011). The tip of the optic fiber was etched by dipping into hydrofluoric acid for 10 min (Stark et al., 2012). The optrode was attached to a moveable microdriver and inserted above the putative VMHdm/c (initial implantation position: −4.5 mm AP, +0.35 mm ML, −5.0 mm DV) after virus injection, and secured with bone screws and dental cement.
For tracing, 0.12 μl of 1 mg/ml CTB-555 in PBS (Life Technologies) was injected into the AHN (−3.5 mm AP, +0.35 mm ML, −5.0 mm DV) and 0.12 μl of 1 mg/ml CTB-488 was injected into the dlPAG (−7.7 mm AP, +0.2 mm ML, −2.4 mm DV) of the same animal at a speed of 20 nl/min. After injection, the glass capillary was left in place for 20 min to allow diffusion. For control, both CTB-555 and CTB-488 were injected into the dlPAG at the same coordinates (−7.7 mm AP, +0.2 mm ML, −2.4 mm DV) but with two penetrations. Animals were perfused one week after injection to harvest brains for histological analysis.
For VMHdm/c blocking, 0.3 μl TTX (1 μM, Tocris or R&D Systems), 8% lidocaine (Sigma) or 4% bupivacaine (Sigma) dissolved in 0.9% saline were used. Under light anesthesia, drug was administered into the brain using a 0.5-μl Neuros syringe (Hamilton) mounted on a vertical syringe pump (World Precision Instruments). The beveled 31 G syringe needle was lowered through the guide cannula to 5.4 mm, and 0.15 μl of drug was injected at 0.9 nl/s. The injection was repeated after retracting the needle to −5.3 mm, and followed by 2-min wait before full retraction. Behavioral tests started 15 min after the final injection.
Optrode recording and analysis
Two weeks after injection, we connected the implanted optrode with a sixteen-channel headstage and a 105-μm multimode optic fiber. Neural activity and light stimulation was then recorded from the freely moving animal (Tucker-Davis Technologies) and band-pass filtered between 100 and 5,000 Hz. Blue light pulses (1 ms, 5 Hz) were delivered to activate cells. The final light intensity at the tip of the optrode was between 0.17 to 0.27 mW. Direct activation of a ChR2-expressing cell was determined if (1) the cell can follow a 1-ms light activation with a latency <5 ms and jitter < 1 ms, as suggested by previous recording from other brain regions (Jennings et al., 2013); (2) the light-evoked spike waveform is similar to the spontaneous spike waveform. Spike sorting was performed using OfflineSorter (Plexon Instruments). The placement of the optrode was examined histologically. After the first recording, the implanted optrode was slowly moved down in 70-μm increments until it reached 5.6 mm. The peristimulus histogram (PSTH) for light stimulation was generated by averaging the firing rate of a recorded cell aligned to the light onset.
Behavioral tests
The behavioral tests were done between 2 to 8 weeks after surgery. To deliver light to the VMH and/or AHN, two 230-μm multimode optic fibers were inserted into the cannulas and secured with a matching cap (Plastics One). To deliver light to the PAG, a 230-μm multimode optic fiber with ferrule was connected to the implanted optic fiber ferrule assembly with a matching sleeve. The light transmission efficiency between the ferrule and the implanted optic fiber was above 70%. The other end of the optic fiber was connected to a 100-mW 473 nm blue laser (Shanghai Dream Lasers) controlled by computer programmed TTL pulses.
In the home cage test, for VMH and AHN stimulation, blue light (20 Hz, 20 ms) with a range of intensities (1–6 mW) and frequencies (5, 10, 15 and 20 Hz) was randomized and delivered for at least 5 times per condition. For PAG stimulation, animals were stimulated with 20 Hz, 20 ms, 3–6 mW light. For VMH and its terminal stimulations, each trial lasted for 60 s unless we observed jumping, which would terminate the trial. For direct stimulation of the AHN, each trial lasted 60 s regardless of the behavioral response. Running was defined as fast movement typically along the edges of the cage. Jumping was defined as vertical movement with all paws leaving the ground. One to two minutes were allowed between adjacent stimulations. To test the effect of brief stimulation on locomotion, 2 s, 20 Hz, 20 ms stimulation (1–2 mW) was delivered every 30 s for 30 min. To examine light-induced Fos expression, animals were stimulated with 20 s, 20 Hz, 20 ms light at 2–4 mW for 20 times in the home cage and perfused with 4% paraformaldehyde 1 hour later. For sham stimulation controls, optic fiber was connected but no light was delivered.
For the hiding box test, the animal was placed in an arena (L×W×H = 60×60×30 cm) with a cardboard box in one corner (L×W×H = 9×18×20 cm with closed top). Five to ten food pellets were scattered on the floor away from the hiding box to encourage continuous exploration. After the animal was habituated to the arena for 10 min, interleaved real (1-×.3 mW, 20 ms, 20 Hz, 60 s) and sham stimulation trials (0 mW, 60 s) were initiated whenever the animal reached one designated corner far away from the hiding box. After 6–8 pairs of stimulation trials were completed, the hiding box was removed and the animal was stimulated with the same stimulation protocol for 6 more times.
For the RTPP test, the arena contains two chambers (L×W×H = 13×19×30 cm) connected with a 6-cm wide opening. Each chamber has different contextual cues on the wall. During the test, when four paws of the test animal were in the stimulation chamber, the stimulation was manually initiated. Once triggered, it interleaved between 3-s on and 2-s off until animal exited from the stimulation chamber (all four paws out). The apparatus was cleaned with 70% ethanol thoroughly after each test. For a given animal, if multiple brain sites (VMH, AHN, PAG) were tested with the paradigm, each brain site was tested on separated days.
In the punishment operant conditioning, animals were deprived of water for 19 hours and a nose poking panel (Med Associates) and a TTL pulse triggered water delivery device were inserted into animal's home cage right before the test. When an animal successfully held its nose snout in the poker for more than 50 ms, it dimmed the backlit indicator in the poker for 1s, triggered the water valve to immediately open for 50 ms and turned on light stimulation for 2 s after 0.8 s delay. Water was delivered through a 24-G syringe needle positioned 2 cm away from the poker. In the 1 s period when the indicator light was off, further poking did not trigger additional water delivery. All stimulation and behavioral events were recorded synchronously (Streampix, Norpix).
Behavioral analysis
We used the paired Student's t-test to examine the effect of stimulation on several parameters of home cage behavior: (1) the percentage of time each animal spent immobile during light delivery (light), 30 s before light (before) and 30 s after light (after); (2) the percentage of before, light and after trials during which running or jumping was observed; (3) the mean velocity during accumulated before, light and after periods; and (4) mean latency to immobility, running and jumping under different stimulation conditions. The “low” intensity refers to the minimal intensity required to induce behavioral changes, ranging from 0.8 mW to 3.5 mW. The “high” intensity refers to three times of the minimal intensity up to 6 mW. For each animal, we varied stimulation frequency from 5 to 20 Hz in 5 Hz increments. If a clear behavioral change was observed at 5 Hz stimulation, low, medium and high frequency refer to 5, 10 and 15 Hz. Otherwise, they refer to 10, 15 and 20 Hz. Latency to immobility, running or jumping refers to the average time interval from the light onset to the behavior onset across stimulation trials. If no running or jumping was observed at a given frequency for an individual, 60 s was used for calculation. Only trials not annotated as “immobile” at the onset of the trial were used to calculate the latency to immobility.
For the RTPP test analysis, we calculated the following parameters for each animal and used the paired t-test to examine the effect of stimulation: (1) the mean duration in the stimulation and safe chambers per entry during the pretest and testing periods; (2) the percentage of total time spent in the stimulation chamber during the pretest and test periods; (3) the percentage of total time spent immobile during the pretest, stimulation-on and stimulation-off periods.
We examined the effect of light activation on the nose poking test with the paired t-test using following parameters: (1) number of successful poking events with real or sham stimulation; (2) the percentage of total time an animal spent immobile during accumulated real or sham stimulation period; (3) the maximum distance to the poker within 10 s after sham or real stimulation averaged across trials. To examine the immobility during stimulation, we manually annotated “immobility” during the 2-s stimulation based on both side and top views. For a frame to be considered “immobile” with manual annotation, the animal has to show no clear movement of any body parts, including limbs, head and tongue. Error bars indicate standard errors in all figures. When the paired t-test was performed for parameters involving three groups (e.g., before, light and after), the p value was adjusted with a false discovery rate of 0.05.
Recording of pupillary, respiratory and cardiovascular responses and analysis
To monitor the pupillary response, a brass head plate (3.4 mm × 5.5 mm × 2 mm with two threaded holes) was cemented on an animal's skull and a holding rod was attached to the plate using two 00-90 screws during the experiment. The head-fixed animal was placed onto a single axis rotating styrofoam ball (20 cm in diameter) to permit locomotion. An infrared-sensitive camera was used to capture the pupil image under infrared lighting. After acquiring the video, we detected the pupil in each frame using a custom written Matlab script based on the Hough transform circle recognition algorithm. The ratio of the circle diameter during stimulation and baseline (time matched period prior to each stimulation trial) was calculated to quantify the light induced pupillary response. To determine pupil response during running, we manually annotated the running events and calculated the average PSTH of pupil diameter aligned to running onset using an 80-ms time bin (2 video frames).
Breathing was manually counted based on chest movement using videos recorded from head-fixed animals. Only periods when individual chest movement could be clearly discerned were used for analysis. Breathing rate was calculated as the accumulated number of breathings divided by the accumulated stimulation or baseline period. Baseline is the time-matched period prior to each stimulation trial. The ratio between breathing rate during stimulation period and baseline was then calculated as the response during light.
To monitor the cardiovascular response in freely moving animal, we placed three insulated multi-stranded stainless steel wire leads (A-M system, NO. 793200) subcutaneously under general anesthesia (Ho et al., 2011). Briefly, the three wires were connected to an omnetics connector cemented onto the mouse back and tunneled underneath the skin to reach each of three recording positions (left arm, right arm and right leg). Each tip of the wire was made bare by removing 3 mm insulation from the wire to create the contact surface. The end of the wire was brought out from a small skin incision and multiple knots were tied to prevent the wire from retraction. During recording, the ECG signal passed through a commutator and collected using a commercial recording system (Tucker-Davis Technologies) at 3000 Hz. Then, the raw ECG signal was band-pass filtered (10-1000 Hz) and a custom written Matlab program was used to detect the peaks of the ECG trace (Figure 3E, red dots). The instantaneous HR was calculated as the inverse of the inter-beat-interval. The HRV for a given period was calculated as standard deviation of HR/mean of HR. To determine light induced HR response in each animal, we calculated the average HR and HRV during light-on, −30 to 0 s before light and 0–30 s after light for each stimulation trial. Then, we used the paired t-test to determine any significant changes in HR and HRV during the light-on period compared with the before- or after-light period. To determine the HR change during running, we used our computer-based auto-annotation program to determine all the running events and calculated the PSTHs of HR aligned to running onset using 100-ms time bins.
Histology and immediate early gene expression analysis
Standard immunohistochemistry procedures were followed to obtain and stain the 30-μm brain sections for all mice. Rabbit anti-SF1 (1:100, TransGenic), goat anti-Fos (1:300, Santa Cruz Biotechnology), mouse anti-NeuN (1:300, Millipore), rabbit anti-GFP (1:300, Life Technologies), donkey anti-mouse Dylight 405 (1:300), donkey anti-rabbit Dylight 488 (1:300, Jackson Immunoresearch) and donkey anti-goat Dylight 555 antibodies (1:300, Jackson Immunoresearch) and DAPI (1:20,000, Life Technologies) were used. For determination of cannula, optic fiber and optrode placements and tracer injection sites, 2.5× or 5× fluorescent images were acquired. For Fos cell counting, 10× fluorescent images were used. For tracing studies, 20× confocal images were obtained.
To count cells, we first selected regions of interest based on counterstaining and then manually counted cells in the red and/or green channels by using a custom-written Matlab program. To quantify YFP distribution in the VMHdm/c vs. VMHvl, the ratio of the accumulated pixel values in the green channel in the VMHdm/c and VMHvl was calculated for each section and then averaged across sections for each animal. The Student's t-test was used to determine whether the ratio is significantly different from 1 across the animals.
To compare the Fos expression under various stimulation condition, two-way ANOVA was used for each stimulation condition to reveal the main factors contributing to the Fos number variability (stimulation side vs. non stimulation, real stimulation vs. sham stimulation and their interaction term), followed by the paired t-test.
Tracking and annotation comparison
Custom tracking software written in MATLAB was used to determine the instantaneous position of the recorded mouse based on side- and top-view videos (Burgos-Artizzu et al., 2012; Dollar et al., 2010). The instantaneous XY and Z velocities of each frame were calculated as the difference in center location of the animal in current and previous frame. We defined “immobility” as when the animal moves for less than 0.5 pixel/frame at the XY plane and the movement lasts for at least 2 s. “Running” was defined as when locomotion is above 8 pixel/frame with a maximum speed above 20 pixel/frame and lasts for minimally 0.2 s. “Jumping” was defined as events that lead to the animal's center location elevated for at least 120 pixels above the ground and with maximum vertical movement speed above 20 pixel/frame. In our video, each pixel represents approximately 0.5 mm and the videos were taken at 25 frame/sec. A total of 269 hours of videos were analyzed to determine the behaviors using these parameters.
To evaluate the performance of computer annotation, 3.8 hours of behavioral videos were annotated manually by two experienced human annotators frame by frame (sample period shown in Figure S2C). Then, we compared the computer and human annotated immobility, running and jumping events during the 79 light-stimulation trials (approximately 60 s per trial). We found that consistency between the human-computer annotations is comparable to the human-human annotations. For immobility, we calculated the percentage of time animal spent immobile for each light stimulation period and found that the Pearson correlation coefficient (r) between two human annotators is 0.827, whereas the correlation coefficients of computer and two human annotators are 0.781 and 0.802, respectively (Figure S2D). For running, we calculated the number of running events during each light stimulation period and found correlation coefficient of human-human annotation is 0.864 whereas correlation coefficients of human-computer annotation are 0.850 and 0.944 (Figure S2E). For jumping, we calculated the number of jumps within 30 s after the light stimulation, given that most jumping events occurred after light stimulation instead of during light stimulation in these three randomly selected videos (Figure S2C). The correlation coefficient for human annotators is high (r = 0.9611), given that jumping events are distinct and hard to miss. Although the computer missed about 20% of jumping events, its overall performance still correlated well with human performance (r = 0.9093 and 0.9192) (Figure S2F). Thus, we determined that the performance of the automated annotation program is sufficiently reliable to identify the behaviors of interest.
Supplementary Material
Movie S1 (Related to Figure 2): Light activation of VMH SF1 neurons induced defensive-like behavior in home cage. The behavioral changes of an animal in its home cage during light stimulation (20 Hz, 20 ms, 2.03 mW) of VMHdm/c SF1 neurons. Animals decreased movement first, then ran around the cage and eventually jumped repeatedly. LED light indicates the light-on period. The movie is played at twice the normal speed.
Movie S2 (Related to Figure 2) Activation of VMH SF1 neurons induced hiding. In the open arena with a hiding box, the test mouse was stimulated with either real light (20 Hz, 20 ms,1.3 mW) or with sham light (20 Hz, 20 ms, 0 mW) delivered to the VMH for 60 s. Both stimulations started when the animal visited the corner far from the hiding box. During the real stimulation, the mouse quickly ran back to the hiding box and stayed inside for the remaining stimulation period, whereas during the sham trial, the animal continued to eat and to explore the arena. In the absence of a hiding box, with the same VMH stimulation condition, the mouse moved around the arena and eventually stayed immobile in one corner. The movie is played at twice the normal speed.
Movie S3 (Related to Figure 3) Light activation of VMH SF1 neurons induced pupil dilation. The animal was stimulated at the VMH with low intensity (20 Hz, 20 ms, 1 mW) and high intensity (20 Hz, 20 ms, 3 mW) light pulses (20 s each). Both stimulation conditions induced pupil dilation. The movie is played at twice the normal speed.
Movie S4 (Related to Figure 4): Light activation of VMH SF1 neurons induced avoidance to the stimulation chamber in a real-time place preference test. During the first entry into the stimulation chamber, the animal increased immobility during light stimulation (20 Hz, 20 ms, 2.85 mW, 3 s light-on interleaved with 2 s light-off) and stayed in the chamber for more than 200 seconds. By the forth trial, the mobility of the animal decreased during light stimulation. Instead, it quickly moved back into the safe chamber. LED indicates the light-on period. The movie is played at twice the normal speed.
Movie S5 (Related to Figure 5): Light stimulation of VMH→ PAG and VMH → AHN induced behavioral changes in home cage. Whereas VMH→ PAG stimulation (20 Hz, 20 ms, 4.08 mW) induced only immobility, VMH→AHN stimulation (20 Hz, 20 ms, 1.49 mW) induced immobility, running and jumping in the same animal. LED indicates the light on period. The movie is played at twice the normal speed.
Movie S6 (Related to Figure 8): Light stimulation of the AHN induced running and escape jumping but no immobility. The ventral AHN of a wild-type C57BL/6 animal was injected with AAV2 that expressed both CRE and CRE-dependent ChR2. Three weeks later, the animal was stimulated at the AHN (20 Hz, 20 ms, 2.3 mw) for 1 min in its home cage. Stimulation induced running, repeated wall rearing and jumping. LED indicates the light-on period. The movie is played at twice the normal speed.
Movie S7 (Related to Figure 8): Light activation of AHN neurons induced avoidance to the stimulated chamber in a real-time place preference test. The ventral AHN of a wild-type C57BL/6 animal was injected with AAV2 expressing both CRE and CRE dependent ChR2. During the pretest, the animal showed a slight preference for the left chamber. During the test, the animal was stimulated at the AHN (20 Hz, 20 ms, 3.3 mW, 3 s light-on interleaved with 2 s light-off) whenever it entered the left chamber. Upon stimulation, the animal showed no immobility and quickly moved out of the stimulation chamber. Also, the animal spent longer time in the safe chamber before it re-entered the stimulation chamber. The movie is played at twice the normal speed.
Figure S1 (related to Figure 2). VMH, VMH→PAG, VMH→AHN and AHN stimulations induced velocity changes in the home cage. Plots show the mean velocity before, during and after VMH (A, N =31), VMH→PAG (B, N =27), VMH→AHN (C, N=25) and AHN (D, N=5) stimulations. Gray lines represent individual animals. Red lines show population averages. Error bars: standard errors. Paired t-test with FDR adjustment. *p < 0.05, **p < 0.01, ***p < 0.001.
Figure S2 (related to Figure 2). Comparisons between computer annotations and human annotations. (A) XY-plane velocity based on top view video. Computer annotated immobility period (blue) and running events (orange dots) are indicated. (B) Vertical velocity and distance above the cage floor based on side-view video. Jump events are indicated by red dots. (C) Example raster plots show human- and computer-annotated immobility, running and jumping events. Blue: Light on; red and green: human annotations; black: computer annotation. (D–F) Correlation between human and computer annotations. Each dot represents one light stimulation trial. The correlation coefficient for each plot is shown at the upper left corner.
Figure S3 (related to Figure 5): Fos expression induced by light stimulation of the VMHdm/c and its terminals. (A) Representative pictures showing Fos expression (red) at the VMH after VMH stimulation (top panel), at the AHN after VMH→AHN stimulation (middle panel) and at the PAG after VMH→PAG stimulation (bottom panel). Areas of Fos counted are indicated by white (stimulation side) and red (non-stimulation side) dashed lines in DAPI (blue) counterstaining pictures. Green: endogenous ChR2-EYFP. Scale bars: 500 μm. Dashed yellow lines mark optic fiber tracks. (B) Average number of Fos positive cells per section in the AHN, VMH and PAG after VMH, VMH→ AHN, VMH→PAG and sham (with fiber insertion) stimulations. In general, after stimulation, Fos increased in all three regions bilaterally, more in the stimulation side and less in the non-stimulation side, except the VMH, which showed increase only in the stimulation side. VMH→AHN stimulation induced fos most strongly in the AHN but also in the VMH and PAG to a lesser extent. Similarly, VMH→PAG stimulation induced Fos most strongly in the PAG but also in the VMH and AHN to a lesser extent. Black bars: stimulation side; Grey bars: non-stimulation side. Two-way ANOVA for each stimulation condition revealed the main factors contributing to the variability in the number of Fos-expressing cells (stimulation side vs. non stimulation, real stimulation vs. sham stimulation and their interaction term). If a significant contributor to the variability is identified (p < 0.05), the t-test was performed either between the stimulation side and non-stimulation side or between real and sham stimulation groups (side matched). Black * indicates t-test result comparing real stimulation and sham stimulation groups. Blue * indicates t-test result comparing stimulation side and non-stimulation side. *p < 0.05, **p < 0.01, ***p < 0.001. All p values below 0.1 are indicated. Error bars: standard errors.
Figure S4 (related to Figure 5). Examples of behavioral changes induced by VMH→AHN or VMH→PAG stimulation in the home cage and real-time place preference test. (A and C) Examples of tracking traces with 20-Hz VMH→PAG (A) and VMH→AHN (C) stimulations in home cage. Blue: light on; red: light off. Each trace contains six stimulation trials. (B and D) The average velocity over time aligned to stimulation onset (left) and stimulation offset (right). Blue shading indicates the light-on period. (E–G) VMH→AHN stimulation caused avoidance of the stimulation chamber. (H–J) VMH→PAG stimulation caused avoidance of the stimulation chamber. (K–M) VMH→PAG stimulation did not elicit avoidance to the stimulation chamber. (E, H, and K) tracking traces. Blue: light on; green: light off in stimulation chamber; black: safe chamber. (F, I, and L) The time spent in stimulation chamber (blue dots) and safe chamber (black dots) per entry over entry number. Red arrows indicate first entry into the stimulation chamber during test. (G, J, and M) The percentage of time animal spent in each chamber during pretest (gray) and test.
Figure S5 (related to Figure 6). Retrograde labeling to reveal VMH→AHN and VMH→PAG projecting cells. (A) Representative coronal sections at the level of the anterior VMH (Left, Bregma level: −1.22 mm), middle VMH (middle, Bregma level: −1.46 mm) and posterior VMH (right, Bregma level: −1.70 mm). Dashed lines mark the areas used for cell counting. Scale bar: 100 μm. (B) Diagrams illustrate the extent of spread of CTB tracers in AHN and PAG dual-injection (top panels) and PAG co-injection groups (bottom panels). (C) Schematic representation of retrograde tracers co-injected into the PAG. (D) Representative histological pictures showing CTB-555 (D) and CTB-488 (E) injected into dlPAG. Scale bar: 500 μm. (E) VMH neurons labeled with CTB-488 (green) and CTB-555 (red). Blue: NeuN. Scale bar: 100 μm. (F) Individual channels and merged view of the box area in (E). Scale bar: 20 μm. White arrows indicate triple-labeled cells. (G) Percentage of CTB-488 labeled (green), CTB-555 labeled (red) or double-labeled (yellow) neurons among all VMHdm/c neurons. (H) Percentage of double-labeled neurons in CTB-488 or CTB-555 positive population. N = 3 animals.
Figure S6 (related to Figure 7). VMH→AHN and VMH→PAG stimulation induces distinct behavioral changes after VMH blocking. (A) An example plot showing the ratio of velocity during the light-off and light-on periods, with (gray dots) or without (white dots) injection of the VMH with bupivacaine. Bupivacaine eliminates post-stimulation velocity increase and lasts for at least 45 min. (B) The velocity in the safe chamber during the test is not affected by bupivacaine injection (N =11). (C) Poke number during punishment operant conditioning is not affected by bupivacaine injection (N =8). (D–F) An example session of RTPP test with VMH→PAG stimulation without VMH blocking. (G– I) The performance of the same animal as shown in (D–F) with VMH blocking. (D, G) Tracking trace; (E, H) Duration in each chamber over trials; (F, I) Accumulated time in safe (black) and stimulation (blue) chamber during pretest and test. (J–K) During VMH→PAG simulation with VMH blocking, all animals increased immobility (J) and showed no avoidance to the stimulation chamber (K). ***p < 0.001. N = 9 including 5 animals with confirmed success of VMH blocking and 4 animals with putative VMH blocking based on histology. Gray and red lines indicate data of individuals and population average. (L) Representative tracking traces during the nose poking test during sham, VMH→ANH and VMH→PAG stimulations, all with VMH inactivation, Blue: trace during light on period; green: trace 0–10 s after light; red: other period. Yellow arrows indicate nose ports. Note increased movement towards the corner far away from the poker after VMH→AHN stimulation but not VMH→PAG stimulation. (M, N) In the same session as in (L), VMH→PAG simulation induced higher immobility (M) whereas VMH→AHN simulation caused animal to move away from the nose port (N). Orange: VMH→AHN; black: VMH→PAG; gray: sham stimulation.
Figure S7 (related to Figure 7). Summary of optic fiber ending positions. (A) Optic fiber ending positions in VMH (N = 29). Red dots: effective blocking of the VMH by bupivacaine injection; blue dots: ineffective blocking of the VMH by bupivacaine injection; red circle: effect of bupivacaine on the VMH was not tested; green dots: other animals. (B) Optic fiber ending positions in the AHN in VMH→AHN stimulation experiment (green dots, N =24, top panel). (C) Optic fiber ending positions in the PAG in VMH→PAG stimulation experiment (N = 26). Histological data from two of the SF1 animals is not available due to technical reasons. (D) Optic fiber ending positions in the AHN (black dots) in the AHN direct-stimulation experiment (N = 5).
Figure S8 (related to figure 8) A model of the hypothalamic defense circuit. (A) Threatening signals activate the VMHdm/c which mediates immediate immobility through its direct excitatory projection to the PAG. Simultaneously, an excitatory projection from the VMHdm/c to the AHN mediates flexible escaping response. Upon activation, the AHN may provide negative feedback to the VMHdm/c. (B) In situ hybridization patterns of vesicular GABA transporter (VGAT) and vesicular glutamate transporter 2 (VGLUT2) at the AHN and VMH reveal that whereas VMH cells are mainly glutamatergic, AHN cells are mainly GABAergic. Dashed lines mark the AHN and VMHdm/c. Images adopted from www.brain-map.org, experiment ID 72081554 and 73818754.
Table S1 (related to Figure 6): Summary of retrograde labeling results from PAG and AHN dual injection group (left) and PAG co-injection group (right). The left side of the table shows the total number and percentage of SF1 positive cells and retrogradely labeled cells in the VMHdm/c from individual animals (A1–A5) that were successfully injected with CTB-555 into the AHN and CTB-488 into the dlPAG. The right side of the table shows the total number and percentage of retrogradely labeled cells in the VMHdm/c of individual animals (B1–B3) that were successfully injected with both CTB-488 and CTB-555 into the dlPAG.
Acknowledgments
We would like to thank B. Lowell for providing the SF1-CRE mice; G. Fishell for providing RCE:loxP mice. K. Deisseroth for ChR2-EYFP viral constructs; K. Ferguson for assistance with the behavioral tests; P. Dollar for advice on optimizing the tracking program, NS. Canteras, JE. LeDoux, AL. Falkner, K. Hashikawa and LC. Wong for helpful conversations, and P. Hare and S. Tranguch for editorial comments. This work was supported by Esther A. & Joseph Klingenstein Fund (D. L.), Whitehall Foundation (D. L.), Sloan Foundation (D. L.), McKnight Foundation (D. L.), and National Institute of Health Grant (1R01MH101377-01) (D. L.).
Footnotes
Author Contributions: D.L. designed research; L.W. performed research; I.Z.C and D.L. performed unpublished pilot experiments; D.L. and L.W. analyzed data and wrote the paper.
The authors declare no conflict-of-interest.
Publisher's Disclaimer: This is a PDF file of an unedited manuscript that has been accepted for publication. As a service to our customers we are providing this early version of the manuscript. The manuscript will undergo copyediting, typesetting, and review of the resulting proof before it is published in its final citable form. Please note that during the production process errors may be discovered which could affect the content, and all legal disclaimers that apply to the journal pertain.
References
- Akesson TR, Ulibarri C, Truitt S. Divergent axon collaterals originate in the estrogen receptive ventromedial nucleus of hypothalamus in the rat. J Neurobiol. 1994;25:406–414. doi: 10.1002/neu.480250406. [DOI] [PubMed] [Google Scholar]
- Bandler R, Keay KA. Columnar organization in the midbrain periaqueductal gray and the integration of emotional expression. Prog Brain Res. 1996;107:285–300. doi: 10.1016/s0079-6123(08)61871-3. [DOI] [PubMed] [Google Scholar]
- Bard P. A diencephalic mechanism for the expression of rage with special reference to the sympathetic nervous system. Am J Physiol. 1928;84:490–515. [Google Scholar]
- Betley JN, Cao ZF, Ritola KD, Sternson SM. Parallel, redundant circuit organization for homeostatic control of feeding behavior. Cell. 2013;155:1337–1350. doi: 10.1016/j.cell.2013.11.002. [DOI] [PMC free article] [PubMed] [Google Scholar]
- Blanchard RJ, Hebert MA, Ferrari PF, Palanza P, Figueira R, Blanchard DC, Parmigiani S. Defensive behaviors in wild and laboratory (Swiss) mice: the mouse defense test battery. Physiol Behav. 1998;65:201–209. doi: 10.1016/s0031-9384(98)00012-2. [DOI] [PubMed] [Google Scholar]
- Blanchard RJ, Parmigiani S, Bjornson C, Masuda C, Weiss SM, Blanchard DC. Antipredator Behavior of Swiss-Webster Mice in a Visible Burrow System. Aggressive Behavior. 1995;21:123–136. [Google Scholar]
- Boyden ES, Zhang F, Bamberg E, Nagel G, Deisseroth K. Millisecond-timescale, genetically targeted optical control of neural activity. Nat Neurosci. 2005;8:1263–1268. doi: 10.1038/nn1525. [DOI] [PubMed] [Google Scholar]
- Brandao ML, Zanoveli JM, Ruiz-Martinez RC, Oliveira LC, Landeira-Fernandez J. Different patterns of freezing behavior organized in the periaqueductal gray of rats: association with different types of anxiety. Behav Brain Res. 2008;188:1–13. doi: 10.1016/j.bbr.2007.10.018. [DOI] [PubMed] [Google Scholar]
- Burgos-Artizzu XP, Dollár P, Lin D, Anderson DJ, Perona P. Social Behavior Recognition in continuous videos. Paper presented at: IEEE Conference on Computer Vision and Pattern Recognition; Providence, Rhode Island. 2012. [Google Scholar]
- Canteras NS, Simerly RB, Swanson LW. Organization of projections from the ventromedial nucleus of the hypothalamus: a Phaseolus vulgaris-leucoagglutinin study in the rat. J Comp Neurol. 1994;348:41–79. doi: 10.1002/cne.903480103. [DOI] [PubMed] [Google Scholar]
- Canteras NS, Simerly RB, Swanson LW. Organization of projections from the medial nucleus of the amygdala: a PHAL study in the rat. J Comp Neurol. 1995;360:213–245. doi: 10.1002/cne.903600203. [DOI] [PubMed] [Google Scholar]
- Canteras NS, Swanson LW. The dorsal premammillary nucleus: an unusual component of the mammillary body. Proc Natl Acad Sci U S A. 1992;89:10089–10093. doi: 10.1073/pnas.89.21.10089. [DOI] [PMC free article] [PubMed] [Google Scholar]
- Chan E, Kovacevic N, Ho SK, Henkelman RM, Henderson JT. Development of a high resolution three-dimensional surgical atlas of the murine head for strains 129S1/SvImJ and C57BI/6J using magnetic resonance imaging and micro-computed tomography. Neuroscience. 2007;144:604–615. doi: 10.1016/j.neuroscience.2006.08.080. [DOI] [PubMed] [Google Scholar]
- Dhillon H, Zigman JM, Ye C, Lee CE, McGovern RA, Tang V, Kenny CD, Christiansen LM, White RD, Edelstein EA, et al. Leptin directly activates SF1 neurons in the VMH, and this action by leptin is required for normal body-weight homeostasis. Neuron. 2006;49:191–203. doi: 10.1016/j.neuron.2005.12.021. [DOI] [PubMed] [Google Scholar]
- Dielenberg RA, Hunt GE, McGregor IS. “When a rat smells a cat”: the distribution of Fos immunoreactivity in rat brain following exposure to a predatory odor. Neuroscience. 2001;104:1085–1097. doi: 10.1016/s0306-4522(01)00150-6. [DOI] [PubMed] [Google Scholar]
- Dollar P, Welinder P, Perona P. Cascaded Pose Regression. Paper presented at: IEEE Conference on Computer Vision and Pattern Recognition 2010 [Google Scholar]
- Eilam D. Die hard: a blend of freezing and fleeing as a dynamic defense--implications for the control of defensive behavior. Neurosci Biobehav Rev. 2005;29:1181–1191. doi: 10.1016/j.neubiorev.2005.03.027. [DOI] [PubMed] [Google Scholar]
- Fernandez De Molina A, Hunsperger RW. Organization of the subcortical system governing defence and flight reactions in the cat. J Physiol. 1962;160:200–213. doi: 10.1113/jphysiol.1962.sp006841. [DOI] [PMC free article] [PubMed] [Google Scholar]
- Franklin KBJ, Paxinos G. The mouse brain in stereotaxic coordinates. Amsterdam, Boston: Academic Press; 2008. [Google Scholar]
- Fuchs SA, Edinger HM, Siegel A. The role of the anterior hypothalamus in affective defense behavior elicited from the ventromedial hypothalamus of the cat. Brain Res. 1985;330:93–107. doi: 10.1016/0006-8993(85)90010-1. [DOI] [PubMed] [Google Scholar]
- Gradinaru V, Zhang F, Ramakrishnan C, Mattis J, Prakash R, Diester I, Goshen I, Thompson KR, Deisseroth K. Molecular and Cellular Approaches for Diversifying and Extending Optogenetics. Cell. 2010;141:154–165. doi: 10.1016/j.cell.2010.02.037. [DOI] [PMC free article] [PubMed] [Google Scholar]
- Hofer MA. Cardiac and respiratory function during sudden prolonged immobility in wild rodents. Psychosomatic medicine. 1970;32:633–647. doi: 10.1097/00006842-197011000-00008. [DOI] [PubMed] [Google Scholar]
- Hofle M, Pomper U, Hauck M, Engel AK, Senkowski D. Spectral signatures of viewing a needle approaching one's body when anticipating pain. Eur J Neurosci. 2013 doi: 10.1111/ejn.12304. [DOI] [PubMed] [Google Scholar]
- Jennings JH, Sparta DR, Stamatakis AM, Ung RL, Pleil KE, Kash TL, Stuber GD. Distinct extended amygdala circuits for divergent motivational states. Nature. 2013;496:224–228. doi: 10.1038/nature12041. [DOI] [PMC free article] [PubMed] [Google Scholar]
- Kim SY, Adhikari A, Lee SY, Marshel JH, Kim CK, Mallory CS, Lo M, Pak S, Mattis J, Lim BK, et al. Diverging neural pathways assemble a behavioural state from separable features in anxiety. Nature. 2013;496:219–223. doi: 10.1038/nature12018. [DOI] [PMC free article] [PubMed] [Google Scholar]
- Lammers JH, Kruk MR, Meelis W, van der Poel AM. Hypothalamic substrates for brain stimulation-induced patterns of locomotion and escape jumps in the rat. Brain Res. 1988;449:294–310. doi: 10.1016/0006-8993(88)91045-1. [DOI] [PubMed] [Google Scholar]
- Lin D, Boyle MP, Dollar P, Lee H, Lein ES, Perona P, Anderson DJ. Functional identification of an aggression locus in the mouse hypothalamus. Nature. 2011;470:221–226. doi: 10.1038/nature09736. [DOI] [PMC free article] [PubMed] [Google Scholar]
- Lindberg D, Chen P, Li C. Conditional viral tracing reveals that steroidogenic factor 1-positive neurons of the dorsomedial subdivision of the ventromedial hypothalamus project to autonomic centers of the hypothalamus and hindbrain. J Comp Neurol. 2013;521:3167–3190. doi: 10.1002/cne.23338. [DOI] [PubMed] [Google Scholar]
- Lipp HP, Hunsperger RW. Threat, attack and flight elicited by electrical stimulation of the ventromedial hypothalamus of the marmoset monkey Callithrix jacchus. Brain Behav Evol. 1978;15:260–293. doi: 10.1159/000123782. [DOI] [PubMed] [Google Scholar]
- Martinez RC, Carvalho-Netto EF, Amaral VC, Nunes-de-Souza RL, Canteras NS. Investigation of the hypothalamic defensive system in the mouse. Behav Brain Res. 2008;192:185–190. doi: 10.1016/j.bbr.2008.03.042. [DOI] [PubMed] [Google Scholar]
- McClellan KM, Parker KL, Tobet S. Development of the ventromedial nucleus of the hypothalamus. Frontiers in neuroendocrinology. 2006;27:193–209. doi: 10.1016/j.yfrne.2006.02.002. [DOI] [PubMed] [Google Scholar]
- Pereira M, Morrell JI. The changing role of the medial preoptic area in the regulation of maternal behavior across the postpartum period: facilitation followed by inhibition. Behavioural brain research. 2009;205:238–248. doi: 10.1016/j.bbr.2009.06.026. [DOI] [PMC free article] [PubMed] [Google Scholar]
- Petrovich GD, Risold PY, Swanson LW. Organization of projections from the basomedial nucleus of the amygdala: a PHAL study in the rat. J Comp Neurol. 1996;374:387–420. doi: 10.1002/(SICI)1096-9861(19961021)374:3<387::AID-CNE6>3.0.CO;2-Y. [DOI] [PubMed] [Google Scholar]
- Risold PY, Canteras NS, Swanson LW. Organization of projections from the anterior hypothalamic nucleus: a Phaseolus vulgaris-leucoagglutinin study in the rat. The Journal of comparative neurology. 1994;348:1–40. doi: 10.1002/cne.903480102. [DOI] [PubMed] [Google Scholar]
- Saper CB, Loewy AD. Efferent connections of the parabrachial nucleus in the rat. Brain Res. 1980;197:291–317. doi: 10.1016/0006-8993(80)91117-8. [DOI] [PubMed] [Google Scholar]
- Saper CB, Swanson LW, Cowan WM. The efferent connections of the anterior hypothalamic area of the rat, cat and monkey. J Comp Neurol. 1978;182:575–599. doi: 10.1002/cne.901820402. [DOI] [PubMed] [Google Scholar]
- Schmitt P, Di Scala G, Brandao ML, Karli P. Behavioral effects of microinjections of SR 95103, a new GABA-A antagonist, into the medial hypothalamus or the mesencephalic central gray. European journal of pharmacology. 1985;117:149–158. doi: 10.1016/0014-2999(85)90599-0. [DOI] [PubMed] [Google Scholar]
- Silva BA, Mattucci C, Krzywkowski P, Murana E, Illarionova A, Grinevich V, Canteras NS, Ragozzino D, Gross CT. Independent hypothalamic circuits for social and predator fear. Nat Neurosci. 2013;16:1731–1733. doi: 10.1038/nn.3573. [DOI] [PMC free article] [PubMed] [Google Scholar]
- Silveira MC, Graeff FG. Defense reaction elicited by microinjection of kainic acid in the medial hypothalamus of the rat. Brazilian journal of medical and biological research = Revista brasileira de pesquisas medicas e biologicas/Sociedade Brasileira de Biofisica [et al] 1988;21:569–571. [PubMed] [Google Scholar]
- Stiedl O, Spiess J. Effect of tone-dependent fear conditioning on heart rate and behavior of C57BL/6N mice. Behav Neurosci. 1997;111:703–711. doi: 10.1037//0735-7044.111.4.703. [DOI] [PubMed] [Google Scholar]
- Tye KM, Prakash R, Kim SY, Fenno LE, Grosenick L, Zarabi H, Thompson KR, Gradinaru V, Ramakrishnan C, Deisseroth K. Amygdala circuitry mediating reversible and bidirectional control of anxiety. Nature. 2011;471:358–362. doi: 10.1038/nature09820. [DOI] [PMC free article] [PubMed] [Google Scholar]
- Wilent WB, Oh MY, Buetefisch CM, Bailes JE, Cantella D, Angle C, Whiting DM. Induction of panic attack by stimulation of the ventromedial hypothalamus. Journal of neurosurgery. 2010;112:1295–1298. doi: 10.3171/2009.9.JNS09577. [DOI] [PubMed] [Google Scholar]
- Burgos-Artizzu XP, Dollár P, Lin D, Anderson DJ, Perona P. Social Behavior Recognition in continuous videos. Paper presented at: IEEE Conference on Computer Vision and Pattern Recognition; Providence, Rhode Island. 2012. [Google Scholar]
- Chan E, Kovacevic N, Ho SK, Henkelman RM, Henderson JT. Development of a high resolution three-dimensional surgical atlas of the murine head for strains 129S1/SvImJ and C57Bl/6J using magnetic resonance imaging and micro-computed tomography. Neuroscience. 2007;144:604–615. doi: 10.1016/j.neuroscience.2006.08.080. [DOI] [PubMed] [Google Scholar]
- Dhillon H, Zigman JM, Ye C, Lee CE, McGovern RA, Tang V, Kenny CD, Christiansen LM, White RD, Edelstein EA, et al. Leptin directly activates SF1 neurons in the VMH, and this action by leptin is required for normal body-weight homeostasis. Neuron. 2006;49:191–203. doi: 10.1016/j.neuron.2005.12.021. [DOI] [PubMed] [Google Scholar]
- Dollar P, Welinder P, Perona P. Cascaded Pose Regression. Paper presented at: IEEE Conference on Computer Vision and Pattern Recognition 2010 [Google Scholar]
- Ho D, Zhao X, Gao S, Hong C, Vatner DE, Vatner SF. Heart Rate and Electrocardiography Monitoring in Mice. Current protocols in mouse biology. 2011;1:123–139. doi: 10.1002/9780470942390.mo100159. [DOI] [PMC free article] [PubMed] [Google Scholar]
- Jennings JH, Sparta DR, Stamatakis AM, Ung RL, Pleil KE, Kash TL, Stuber GD. Distinct extended amygdala circuits for divergent motivational states. Nature. 2013;496:224–228. doi: 10.1038/nature12041. [DOI] [PMC free article] [PubMed] [Google Scholar]
- Lin D, Boyle MP, Dollar P, Lee H, Lein ES, Perona P, Anderson DJ. Functional identification of an aggression locus in the mouse hypothalamus. Nature. 2011;470:221–226. doi: 10.1038/nature09736. [DOI] [PMC free article] [PubMed] [Google Scholar]
- Sousa VH, Miyoshi G, Hjerling-Leffler J, Karayannis T, Fishell G. Characterization of Nkx6-2-derived neocortical interneuron lineages. Cereb Cortex. 2009;19 Suppl 1:i1–10. doi: 10.1093/cercor/bhp038. [DOI] [PMC free article] [PubMed] [Google Scholar]
- Stark E, Koos T, Buzsaki G. Diode probes for spatiotemporal optical control of multiple neurons in freely moving animals. Journal of Neurophysiology. 2012;108:349–363. doi: 10.1152/jn.00153.2012. [DOI] [PMC free article] [PubMed] [Google Scholar]
Associated Data
This section collects any data citations, data availability statements, or supplementary materials included in this article.
Supplementary Materials
Movie S1 (Related to Figure 2): Light activation of VMH SF1 neurons induced defensive-like behavior in home cage. The behavioral changes of an animal in its home cage during light stimulation (20 Hz, 20 ms, 2.03 mW) of VMHdm/c SF1 neurons. Animals decreased movement first, then ran around the cage and eventually jumped repeatedly. LED light indicates the light-on period. The movie is played at twice the normal speed.
Movie S2 (Related to Figure 2) Activation of VMH SF1 neurons induced hiding. In the open arena with a hiding box, the test mouse was stimulated with either real light (20 Hz, 20 ms,1.3 mW) or with sham light (20 Hz, 20 ms, 0 mW) delivered to the VMH for 60 s. Both stimulations started when the animal visited the corner far from the hiding box. During the real stimulation, the mouse quickly ran back to the hiding box and stayed inside for the remaining stimulation period, whereas during the sham trial, the animal continued to eat and to explore the arena. In the absence of a hiding box, with the same VMH stimulation condition, the mouse moved around the arena and eventually stayed immobile in one corner. The movie is played at twice the normal speed.
Movie S3 (Related to Figure 3) Light activation of VMH SF1 neurons induced pupil dilation. The animal was stimulated at the VMH with low intensity (20 Hz, 20 ms, 1 mW) and high intensity (20 Hz, 20 ms, 3 mW) light pulses (20 s each). Both stimulation conditions induced pupil dilation. The movie is played at twice the normal speed.
Movie S4 (Related to Figure 4): Light activation of VMH SF1 neurons induced avoidance to the stimulation chamber in a real-time place preference test. During the first entry into the stimulation chamber, the animal increased immobility during light stimulation (20 Hz, 20 ms, 2.85 mW, 3 s light-on interleaved with 2 s light-off) and stayed in the chamber for more than 200 seconds. By the forth trial, the mobility of the animal decreased during light stimulation. Instead, it quickly moved back into the safe chamber. LED indicates the light-on period. The movie is played at twice the normal speed.
Movie S5 (Related to Figure 5): Light stimulation of VMH→ PAG and VMH → AHN induced behavioral changes in home cage. Whereas VMH→ PAG stimulation (20 Hz, 20 ms, 4.08 mW) induced only immobility, VMH→AHN stimulation (20 Hz, 20 ms, 1.49 mW) induced immobility, running and jumping in the same animal. LED indicates the light on period. The movie is played at twice the normal speed.
Movie S6 (Related to Figure 8): Light stimulation of the AHN induced running and escape jumping but no immobility. The ventral AHN of a wild-type C57BL/6 animal was injected with AAV2 that expressed both CRE and CRE-dependent ChR2. Three weeks later, the animal was stimulated at the AHN (20 Hz, 20 ms, 2.3 mw) for 1 min in its home cage. Stimulation induced running, repeated wall rearing and jumping. LED indicates the light-on period. The movie is played at twice the normal speed.
Movie S7 (Related to Figure 8): Light activation of AHN neurons induced avoidance to the stimulated chamber in a real-time place preference test. The ventral AHN of a wild-type C57BL/6 animal was injected with AAV2 expressing both CRE and CRE dependent ChR2. During the pretest, the animal showed a slight preference for the left chamber. During the test, the animal was stimulated at the AHN (20 Hz, 20 ms, 3.3 mW, 3 s light-on interleaved with 2 s light-off) whenever it entered the left chamber. Upon stimulation, the animal showed no immobility and quickly moved out of the stimulation chamber. Also, the animal spent longer time in the safe chamber before it re-entered the stimulation chamber. The movie is played at twice the normal speed.
Figure S1 (related to Figure 2). VMH, VMH→PAG, VMH→AHN and AHN stimulations induced velocity changes in the home cage. Plots show the mean velocity before, during and after VMH (A, N =31), VMH→PAG (B, N =27), VMH→AHN (C, N=25) and AHN (D, N=5) stimulations. Gray lines represent individual animals. Red lines show population averages. Error bars: standard errors. Paired t-test with FDR adjustment. *p < 0.05, **p < 0.01, ***p < 0.001.
Figure S2 (related to Figure 2). Comparisons between computer annotations and human annotations. (A) XY-plane velocity based on top view video. Computer annotated immobility period (blue) and running events (orange dots) are indicated. (B) Vertical velocity and distance above the cage floor based on side-view video. Jump events are indicated by red dots. (C) Example raster plots show human- and computer-annotated immobility, running and jumping events. Blue: Light on; red and green: human annotations; black: computer annotation. (D–F) Correlation between human and computer annotations. Each dot represents one light stimulation trial. The correlation coefficient for each plot is shown at the upper left corner.
Figure S3 (related to Figure 5): Fos expression induced by light stimulation of the VMHdm/c and its terminals. (A) Representative pictures showing Fos expression (red) at the VMH after VMH stimulation (top panel), at the AHN after VMH→AHN stimulation (middle panel) and at the PAG after VMH→PAG stimulation (bottom panel). Areas of Fos counted are indicated by white (stimulation side) and red (non-stimulation side) dashed lines in DAPI (blue) counterstaining pictures. Green: endogenous ChR2-EYFP. Scale bars: 500 μm. Dashed yellow lines mark optic fiber tracks. (B) Average number of Fos positive cells per section in the AHN, VMH and PAG after VMH, VMH→ AHN, VMH→PAG and sham (with fiber insertion) stimulations. In general, after stimulation, Fos increased in all three regions bilaterally, more in the stimulation side and less in the non-stimulation side, except the VMH, which showed increase only in the stimulation side. VMH→AHN stimulation induced fos most strongly in the AHN but also in the VMH and PAG to a lesser extent. Similarly, VMH→PAG stimulation induced Fos most strongly in the PAG but also in the VMH and AHN to a lesser extent. Black bars: stimulation side; Grey bars: non-stimulation side. Two-way ANOVA for each stimulation condition revealed the main factors contributing to the variability in the number of Fos-expressing cells (stimulation side vs. non stimulation, real stimulation vs. sham stimulation and their interaction term). If a significant contributor to the variability is identified (p < 0.05), the t-test was performed either between the stimulation side and non-stimulation side or between real and sham stimulation groups (side matched). Black * indicates t-test result comparing real stimulation and sham stimulation groups. Blue * indicates t-test result comparing stimulation side and non-stimulation side. *p < 0.05, **p < 0.01, ***p < 0.001. All p values below 0.1 are indicated. Error bars: standard errors.
Figure S4 (related to Figure 5). Examples of behavioral changes induced by VMH→AHN or VMH→PAG stimulation in the home cage and real-time place preference test. (A and C) Examples of tracking traces with 20-Hz VMH→PAG (A) and VMH→AHN (C) stimulations in home cage. Blue: light on; red: light off. Each trace contains six stimulation trials. (B and D) The average velocity over time aligned to stimulation onset (left) and stimulation offset (right). Blue shading indicates the light-on period. (E–G) VMH→AHN stimulation caused avoidance of the stimulation chamber. (H–J) VMH→PAG stimulation caused avoidance of the stimulation chamber. (K–M) VMH→PAG stimulation did not elicit avoidance to the stimulation chamber. (E, H, and K) tracking traces. Blue: light on; green: light off in stimulation chamber; black: safe chamber. (F, I, and L) The time spent in stimulation chamber (blue dots) and safe chamber (black dots) per entry over entry number. Red arrows indicate first entry into the stimulation chamber during test. (G, J, and M) The percentage of time animal spent in each chamber during pretest (gray) and test.
Figure S5 (related to Figure 6). Retrograde labeling to reveal VMH→AHN and VMH→PAG projecting cells. (A) Representative coronal sections at the level of the anterior VMH (Left, Bregma level: −1.22 mm), middle VMH (middle, Bregma level: −1.46 mm) and posterior VMH (right, Bregma level: −1.70 mm). Dashed lines mark the areas used for cell counting. Scale bar: 100 μm. (B) Diagrams illustrate the extent of spread of CTB tracers in AHN and PAG dual-injection (top panels) and PAG co-injection groups (bottom panels). (C) Schematic representation of retrograde tracers co-injected into the PAG. (D) Representative histological pictures showing CTB-555 (D) and CTB-488 (E) injected into dlPAG. Scale bar: 500 μm. (E) VMH neurons labeled with CTB-488 (green) and CTB-555 (red). Blue: NeuN. Scale bar: 100 μm. (F) Individual channels and merged view of the box area in (E). Scale bar: 20 μm. White arrows indicate triple-labeled cells. (G) Percentage of CTB-488 labeled (green), CTB-555 labeled (red) or double-labeled (yellow) neurons among all VMHdm/c neurons. (H) Percentage of double-labeled neurons in CTB-488 or CTB-555 positive population. N = 3 animals.
Figure S6 (related to Figure 7). VMH→AHN and VMH→PAG stimulation induces distinct behavioral changes after VMH blocking. (A) An example plot showing the ratio of velocity during the light-off and light-on periods, with (gray dots) or without (white dots) injection of the VMH with bupivacaine. Bupivacaine eliminates post-stimulation velocity increase and lasts for at least 45 min. (B) The velocity in the safe chamber during the test is not affected by bupivacaine injection (N =11). (C) Poke number during punishment operant conditioning is not affected by bupivacaine injection (N =8). (D–F) An example session of RTPP test with VMH→PAG stimulation without VMH blocking. (G– I) The performance of the same animal as shown in (D–F) with VMH blocking. (D, G) Tracking trace; (E, H) Duration in each chamber over trials; (F, I) Accumulated time in safe (black) and stimulation (blue) chamber during pretest and test. (J–K) During VMH→PAG simulation with VMH blocking, all animals increased immobility (J) and showed no avoidance to the stimulation chamber (K). ***p < 0.001. N = 9 including 5 animals with confirmed success of VMH blocking and 4 animals with putative VMH blocking based on histology. Gray and red lines indicate data of individuals and population average. (L) Representative tracking traces during the nose poking test during sham, VMH→ANH and VMH→PAG stimulations, all with VMH inactivation, Blue: trace during light on period; green: trace 0–10 s after light; red: other period. Yellow arrows indicate nose ports. Note increased movement towards the corner far away from the poker after VMH→AHN stimulation but not VMH→PAG stimulation. (M, N) In the same session as in (L), VMH→PAG simulation induced higher immobility (M) whereas VMH→AHN simulation caused animal to move away from the nose port (N). Orange: VMH→AHN; black: VMH→PAG; gray: sham stimulation.
Figure S7 (related to Figure 7). Summary of optic fiber ending positions. (A) Optic fiber ending positions in VMH (N = 29). Red dots: effective blocking of the VMH by bupivacaine injection; blue dots: ineffective blocking of the VMH by bupivacaine injection; red circle: effect of bupivacaine on the VMH was not tested; green dots: other animals. (B) Optic fiber ending positions in the AHN in VMH→AHN stimulation experiment (green dots, N =24, top panel). (C) Optic fiber ending positions in the PAG in VMH→PAG stimulation experiment (N = 26). Histological data from two of the SF1 animals is not available due to technical reasons. (D) Optic fiber ending positions in the AHN (black dots) in the AHN direct-stimulation experiment (N = 5).
Figure S8 (related to figure 8) A model of the hypothalamic defense circuit. (A) Threatening signals activate the VMHdm/c which mediates immediate immobility through its direct excitatory projection to the PAG. Simultaneously, an excitatory projection from the VMHdm/c to the AHN mediates flexible escaping response. Upon activation, the AHN may provide negative feedback to the VMHdm/c. (B) In situ hybridization patterns of vesicular GABA transporter (VGAT) and vesicular glutamate transporter 2 (VGLUT2) at the AHN and VMH reveal that whereas VMH cells are mainly glutamatergic, AHN cells are mainly GABAergic. Dashed lines mark the AHN and VMHdm/c. Images adopted from www.brain-map.org, experiment ID 72081554 and 73818754.
Table S1 (related to Figure 6): Summary of retrograde labeling results from PAG and AHN dual injection group (left) and PAG co-injection group (right). The left side of the table shows the total number and percentage of SF1 positive cells and retrogradely labeled cells in the VMHdm/c from individual animals (A1–A5) that were successfully injected with CTB-555 into the AHN and CTB-488 into the dlPAG. The right side of the table shows the total number and percentage of retrogradely labeled cells in the VMHdm/c of individual animals (B1–B3) that were successfully injected with both CTB-488 and CTB-555 into the dlPAG.