Abstract
Quantitative ultrasound techniques are generally applied to characterize media whose scattering sites are considered to be small compared to a wavelength. In this study, the backscattered response of single weakly scattering spheres and cylinders with diameters comparable to the beam width of a 2.25 MHz single-element transducer were simulated and measured in the transducer focal plane to investigate the impact of physically large scatterers. The responses from large single spherical scatterers at the focus were found to closely match the plane-wave response. The responses from large cylindrical scatterers at the focus were found to differ from the plane-wave response by a factor of f−1. Normalized spectra from simulations and measurements were in close agreement: the fall-off of the responses as a function of lateral position agreed to within 2 dB for spherical scatterers and to within 3.5 dB for cylindrical scatterers. In both measurement and simulation, single scatterer diameter estimates were biased by less than 3% for a more highly focused transducer compared to estimates for a more weakly focused transducer. The results suggest that quantitative ultrasound techniques may produce physically meaningful size estimates for media whose response is dominated by scatterers comparable in size to the transducer beam.
I. INTRODUCTION
Quantitative imaging techniques are being developed to improve the specificity of diagnostic imaging1,2 by quantifying tissue properties based on the ultrasonic backscattered signal. Several of these techniques use models of scattering for characterization of tissue disease or response to therapy.3–11 The choice of scattering models is influenced by certain a priori assumptions about the sources of scattering in tissues, such as the assumptions of weak scattering and scattering sites that are physically small compared to a wavelength and, consequently, small compared to the transducer beam width for a weakly focused transducer. This later assumption allows the spatial autocorrelation function of a random medium to be decoupled from the transducer beam. Since the candidate scattering sites in tissue such as blood vessels or regions of necrosis do not necessarily satisfy this assumption, models incorporating physically large scatterers may produce improved contrast and better signal interpretation for tissues in which large scatterers are present.
The modeling of ultrasonic scattering typically assumes plane-wave insonification and follows two approaches: (1) calculating the field scattered from a discrete object with a simple geometry imbedded in a homogeneous background or (2) calculating the scattered field from a random weakly scattering inhomogeneous medium. The first approach utilizes a homogeneous wave equation and boundary conditions at the scatterer surface to predict the scattered field. Using this method, Anderson12 provided solutions for scattering from isolated fluid spheres when insonified by a plane wave. Faran expanded this work to incorporate shear waves in scattering from isolated spheres and isolated cylinders.13 The strength of the first approach is that exact solutions to scattering can be calculated. However, the first approach is also limited in that analytical expressions only exist for simple geometrical shapes such as spheres and cylinders.
In the second approach, the inhomogeneous wave equation is used to predict scattered fields. To arrive at a solution for the scattered field, the Born approximation has been widely used,14–16 where total field at the scatterer location (made up of the incident field plus the scattered field) is replaced by the incident field. This assumption has been justified in soft tissues because of the small impedance mismatch between tissue components. Using a Green's function approach and the Born approximation, the scattered field for plane-wave incidence can then be predicted on the basis of intensity form factors.17,18 In acoustics, the intensity form factor relates the spatial distribution of the characteristic impedance to the frequency-dependent response of the scattered field. Analytical solutions exist for collections of simple shapes but also can be calculated for scatterers with more complex impedance structure.17,19
Several approaches can be found in the literature to predict the backscattered response from media with complex structure. Manry et al.20 studied ultrasound propagation in a two-dimensional (2D) model of the breast using the finite difference time domain approach and a line source located outside the scattering region. Mast et al.21 studied a 2D model of ultrasound propagation of plane waves through the abdominal wall using a finite difference method. Doyle et al.22 proposed a three-dimensional (3D) modeling approach to include the effects of multiple scattering and shear waves using an iterative multipole approach. Mamou et al.23,24 proposed a 3D impedance map approach to predict the plane-wave response from 3D computational phantoms constructed from aligned microscope slides. These approaches do not include transducer beam diffraction effects and are limited to either a 2D implementation or small spatial regions with respect to wavelength. Several works have also examined the effects of the beam shape when considering scattering.25–33 These approaches require the use of simple beam models or simple geometric shapes for the scattering object.
An approach which incorporates diffraction effects for an arbitrary transducer as well as the capability to predict the response from complex media was described by Jensen et al.34 and later expanded by Mari et al.35 and Zemp et al.36 In this approach, weak scattering conditions were invoked using the Born approximation, and the scattered field was expressed in terms of the convolution of several terms; the spatial impulse response of the transducer, the impulse response of the source, and a function of the spatially varying scattering coefficient. Although the method is well suited to computational approaches, no implementation details with respect to direct simulation of 3D structures are provided in the reference works.37,38 One recent extension of the Mari approach developed simulations to generate ultrasound images from histology-based maps of bulk modulus.39 However, the method used single histology slices and was inherently a 2D approach, reinforcing the need for further work that models diffraction and scattering in 3D space.
In this manuscript, the transducer responses for single spheres and cylinders, which are comparable in diameter to a wavelength and the transducer beam width, are predicted and compared to the known plane-wave response for these geometries under weak scattering conditions. Predictions are generated in simulation through a novel implementation of the method of Jensen34 and corroborated with measurement scans of spherical (fish eggs in agar) and cylindrical (water cylinders in agar) weak scatterers. Since most techniques to model scattering in weakly scattering random media such as tissue assume that scatterers in the field are much smaller than the wavelength, the simulations and experiments are used to evaluate this assumption.
II. THEORY
A. Simulation method formulation
The basis of our simulation method is an acoustical imaging method derived in the work of Jensen.34 We assume negligible attenuation and particle velocities small enough that non-linear propagation can be neglected. Scattering is considered to arise from spatially continuous fluctuations in speed of sound and density. These fluctuations are assumed to be small enough that only the incident longitudinal wave is scattered (Born approximation) and the propagation of both the incident and scattered waves is at a constant sound speed . A fluid medium without shear waves is also assumed. These assumptions are common in the analysis of scattering from soft tissue, although attenuation in the frequency domain is needed to yield realistic signals for such media.
Using the approximations stated above, the voltage received by a transducer at time can be expressed as a convolution between the pulse-echo wavelet , the transducer pulse-echo spatial impulse response [together forming an imaging response ] (Ref. 25) and a scattering coefficient function :
| (1) |
| (2) |
where are spatial coordinates. Likewise,
| (3) |
| (4) |
| (5) |
where is a function of the scatterer density and sound speed, is a function of the background density and sound speed and .
The scattering from any object or group of objects can be simulated by correctly assigning the scattering coefficient and performing the convolution in Eq. (1). Assuming an ideal pulse such that , the expression for the received voltage in integral form becomes a weighted integral of the spatial impulse response
| (6) |
where denotes a volume of interest outside of which the scattering function is zero.
It should be noted that a double temporal derivative appears in Eq. (1). Differentiation in the time domain causes a multiplication by in the Fourier domain; therefore, the effect of this double derivative is to cause an dependence in backscattered pressure (and hence dependence in backscattered intensity). This dependence can be implicitly removed by defining a normalized received voltage as
| (7) |
In the current work, we define a frequency-domain normalized frequency response for comparison with plane-wave theory (intensity form factors) for weak scatterers. For spheres, this amounts to excluding this frequency dependence from the received voltage. For cylinders, an dependence is removed, corresponding to the plane-wave small scattering frequency dependence for cylinders. The normalized frequency responses for spheres () and for cylinders (), assuming an ideal pulse, are then
| (8) |
| (9) |
These responses can be directly compared to the form factor for a fluid sphere () or a fluid cylinder ():
| (10) |
| (11) |
III. METHODS
A. Simulation methods
Simulated ultrasound scans were generated using the Field II software package37,38 in matlab (R2013a, The Mathworks, Natick, MA). Field II computes a discrete time-domain spatial impulse response for a specified transducer geometry. This response corresponds to the term in Eq. (2), and represents the response of a point scatterer at a particular location in the transducer beam. The integral term in Eq. (7) was approximated by a sum, whereby the values of and normalized bulk modulus s were evaluated on a spatial grid:
| (12) |
are the set of grid points, is the grid spacing, is the scattering coefficient at grid point i, and the discrete time signal is indexed by n. Simulation transducer properties appear in Table I. Simulation and measurements transducers had the same nominal properties. More sophisticated approaches, such as quadrature, were eschewed in favor of this simple approach.
TABLE I.
Simulation transducer properties.
| Transducer | Diameter (cm) | Focal depth (cm) | Patch size (mm) | Center frequency (MHz) | Sampling frequency (MHz) | Grid size (μm) (unless specified) |
|---|---|---|---|---|---|---|
| 1 | 1.91 | 2.54 | 1 | 2.25 | 200 | 25 |
| 2 | 1.91 | 5.72 | 1 | 2.25 | 200 | 25 |
The simulated normalized frequency response was computed for spheres and cylinders as the power spectrum of using the fast Fourier transform (FFT) algorithm in matlab. Simulation sampling frequency and transducer patch size (Table I) were chosen based on recommendations in the reference papers.37,38 Transducer diameters and focus lengths were chosen to agree with nominal values for measurement transducers (Table II). Grid size was determined by comparing the responses for progressively decreasing grid sizes for several sphere diameters (Fig. 1). The grid size was established for each diameter based on convergence over a specified bandwidth [root-mean-square error (RMSE) < 2.5 dB, 0–5 MHz]. Table III shows the grid size for each sphere diameter. Based on these findings, a grid size of 25 μm was chosen for simulating the fish eggs that were 500 μm in size. An identical analysis appears in Table IV for cylinders (Fig. 2).
TABLE II.
Measurement transducer properties.
| Transducer | Center frequency (MHz) | Diameter (cm) | Focal depth (cm) | Beam width (−12 dB, mm) |
|---|---|---|---|---|
| 1 | 2.25 | 1.91 | 2.54 | 0.80 |
| 2 | 2.25 | 1.91 | 5.72 | 1.80 |
FIG. 1.
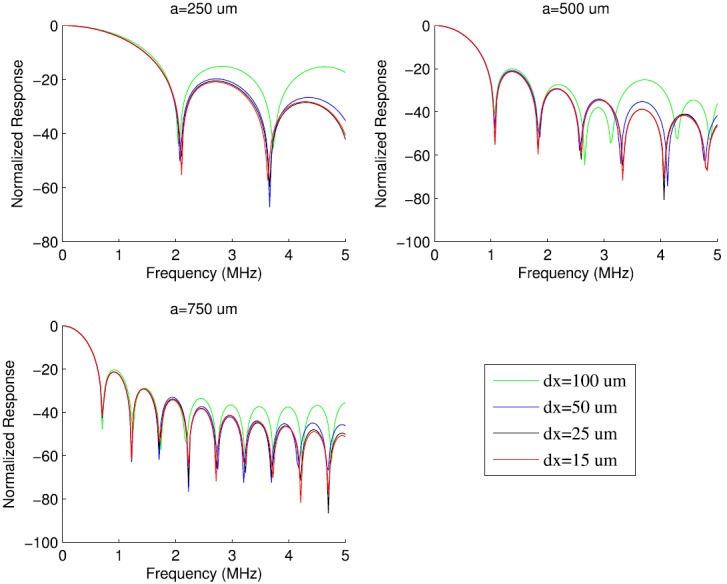
(Color online) Simulated normalized frequency responses for spheres of three different radii. Each sphere was simulated using transducer 2 at four different grid sizes (dx).
TABLE III.
Simulation grid size for several sphere radii (transducer 2).
| Sphere radius (μm) | Fraction of radius | Grid size (μm) |
|---|---|---|
| 5 | 1/5 | 1 |
| 25 | 1/5 | 5 |
| 100 | 1/5 | 20 |
| 250 | 1/10 | 25 |
| 500 | 1/20 | 25 |
| 750 | 1/20 | 37.5 |
TABLE IV.
Simulation grid size for several cylinder radii (transducer 2).
| Cylinder radius (μm) | Fraction of radius | Grid size (μm) |
|---|---|---|
| 50 | 1/5 | 10 |
| 100 | 1/5 | 20 |
| 500 | 1/20 | 25 |
| 1500 | 1/25 | 60 |
FIG. 2.
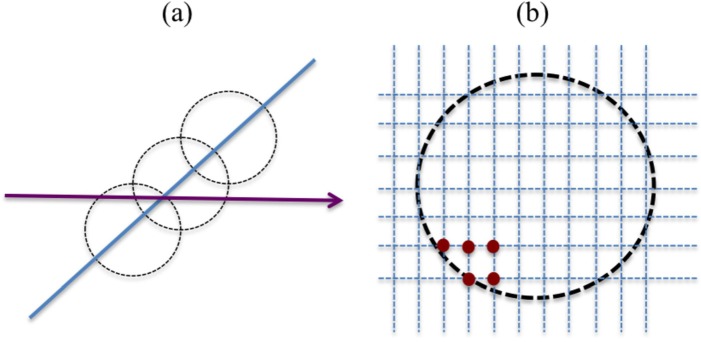
(Color online) Orientation (a) and lateral grid arrangement (b) for single simulated cylinders. All cylinders were oriented such that their axis was perpendicular to the transducer beam axis (arrow).
B. Phantom preparation and scanning
Capelin fish eggs (Fig. 3) were purchased frozen from a grocery store and used as an acoustic model for a sphere. These eggs were roughly spherical and measured approximately 1 mm in diameter. During phantom construction, the eggs were thawed on the low setting in a microwave for approximately 20 s. Next, 2.25 g of noble agar powder (Sigma-Aldrich, St. Louis, MO) was added to 100 ml of degassed water and mixed with a magnetic stirrer. Once dissolved, the mixture was placed in the microwave and heated to 90 °C, stirring occasionally. The heated agar solution cooled while mixing with the magnetic stirrer. Once the agar cooled to 45 °C it was placed in one of several plastic cylindrical wells containing individual eggs using a pipette. Each egg was then positioned near the center of the well using the pipette while the agar was still fluid. Once the agar congealed slightly the well container was placed in a refrigerator for at least four hours prior to scanning.
FIG. 3.
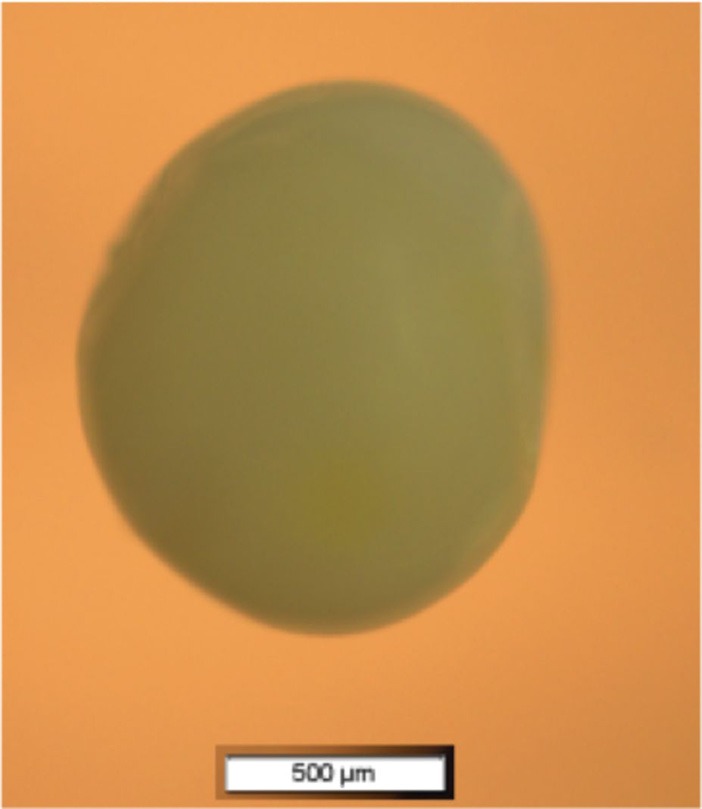
(Color online) Microscope image of a Capelin fish egg (4 × magnification). Scale bar indicates 500 μm.
Each fish egg phantom was individually placed in room temperature degassed water for scanning. The reflection from the egg was located and placed in the focal plane of the transducer (Fig. 4), and a 2D lateral scan was conducted to find the maximum position, as well as record the response at various lateral offsets from the focus. This scanning procedure was repeated for two transducers (Table II) for each fish egg.
FIG. 4.
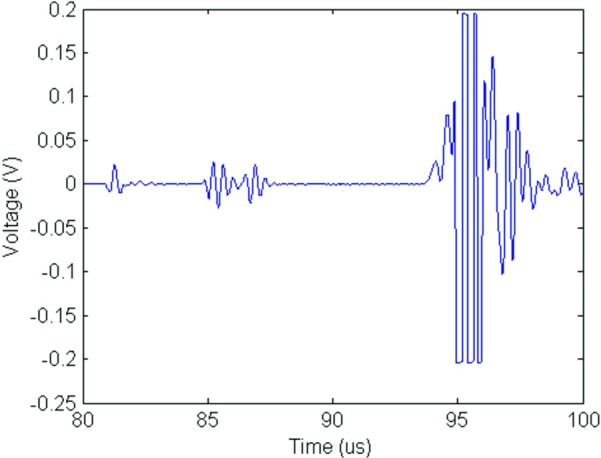
(Color online) Received voltage for a single fish egg in a cylindrical agar phantom. Reflections are (from left to right): water/agar interface, fish egg, and agar/reflector interface. Focus of the transducer is centered on the fish egg reflection.
Fluid cylinders were constructed by pouring liquid agar into a container with a single plastic cylinder oriented parallel to the top surface of the phantom. The agar was produced in the same manner described for the fish egg phantoms, and allowed to cool and harden in the refrigerator for several hours. The plastic cylinder was then carefully removed, and the agar phantom was placed into a degassed water bath for measurement. The bath water was allowed to fill the cylindrical cavity, producing a fluid cylindrical scatterer in an agar background. A one-dimensional lateral scan was conducted perpendicular to the length of the cylinder.
Transducer scans were conducted using a Panametrics 5800 pulser-receiver (Olympus NDT, Waltham, MA) connected to a UF3 A/D card (Strategic Test, Boston, MA) with 250 MHz sampling. The data were displayed and acquired using custom LabVIEW (National Instruments, Austin, TX) software running on a PC. Reference scans were taken throughout the transducer depth of field using a flat reflector plate with a known reflection coefficient in water.
C. Estimation of the normalized frequency response
The measured normalized frequency response from each fish egg was estimated from the power spectrum of the time-domain gated response (see Fig. 4 for the time domain response). From this power spectrum, the frequency dependence of the transducer pulse was removed using a planar reflector reference measurement. This normalized frequency response was then compared to simulation using an ideal pulse. The normalized frequency responses for spheres and cylinders, respectively, were computed as
| (13) |
| (14) |
where is the Fourier transform of the measured voltage computed using the FFT algorithm, is the Fourier transform of the reference scan measured voltage. Insana et al. showed that the “normalized power spectrum” resulting from dividing sample and planar reference power spectra results in an f6 dependence.17 We removed this dependence for direct comparison with intensity form factors.
IV. RESULTS
Two different scattering configurations were simulated and compared to experimental measurements for both spherical and cylindrical scatterers. In the first configuration, simulations and measurements of physically large single scatterers located at several positions throughout the focal plane were compared to ensure that the simulations captured realistic beam effects. In the second configuration, a single scatterer was simulated or measured at the focus of two transducers having different beam dimensions. The responses for the two transducers were compared to the plane-wave response to investigate the impact of the transducer beam, and a scatterer size was estimated in each case. The investigations conducted were (A) simulation of spheres and spheroids and comparison of their responses, (B) simulations of physically large (diameter approximately equal to a wavelength) spherical scatterers compared to the measured response for fish eggs and to intensity form factors, (C) simulations of thin cylinders in the focal plane of a transducer compared to intensity form factors, and (D) simulations of physically large (diameter approximately equal to a wavelength) cylindrical scatterers compared to the measured response for a fluid cylinder and to intensity form factors.
A. Comparison of the predicted response for spheres and spheroids
Fish eggs were used to model a weakly scattering spherical target, but were slightly spheroidal in shape. The impact of the fish egg shape was first studied in simulation. Figure 5 shows the simulated responses for a spheroid with a single long axis oriented in both axial and lateral directions with respect to the transducer. The responses agreed closely with the response for a sphere with a diameter equal to the axial support of the spheroid (RMSE between spheroid and corresponding sphere was 0.66 and 0.98 dB, respectively, for 1000 and 800 μm diameter spheres). Thus, the simulated response for a single spheroid with similar dimensions to the fish eggs matches the simulated response for a properly chosen sphere. This finding suggests that, though they are spheroidal, the single fish eggs are a good acoustic model for a single sphere.
FIG. 5.
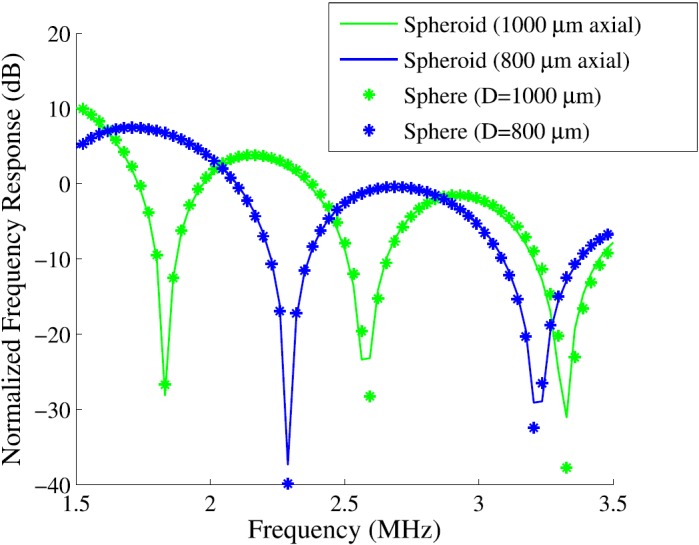
(Color online) Simulations of a spheroid in two orientations with respect to the transducer beam compared to simulations of spheres with diameter equal to the axial extent of the spheroid for each orientation.
B. Comparison of measurement, simulation, and theory for a physically large spherical scatterer
The normalized frequency response was estimated [Eq. (13)] from radio frequency (RF) data measured from three fish eggs at the focus of transducer 2. The fish eggs were slightly spheroidal, and two of the three dimensions of each fish egg were estimated from optical microscope images. The dimensions estimated from the optical microscope are listed in Table V. For each fish egg, a normalized frequency response was generated from a simulated sphere for comparison. Figure 6 depicts the response from three fish eggs and three best-fit simulated spheres each located at three lateral positions with respect to the focus (0, 500, and 1000 μm from the focus). The simulation spheres sizes were chosen to give the best alignment of the nulls of the response as determined by visual assessment. The response for each fish egg is normalized by a single constant chosen to normalize the 0 μm response to 0 dB at 3 MHz [3.25 MHz for Fig. 6(b)]. The decrease of the response as a function of sphere lateral position at the peak frequency is quantified in Table VI, where the differences between the 0 μm position response and the 500 and 1000 μm positions are computed at the last peak in the bandwidth. Simulation and experiment were in agreement to within 1 dB for two of the three fish eggs (Fig. 6).
TABLE V.
Fish egg diameter estimates from optical microscopy and best-fit diameters for simulation comparison with the experimental data.
| Fig. 7 subplot | Axis 1 (μm) | Axis 2 (μm) | Best-fit (μm) |
|---|---|---|---|
| a | 818 | 1020 | 710 |
| b | 1260 | 1230 | 1330 |
| c | 1200 | 1050 | 950 |
FIG. 6.
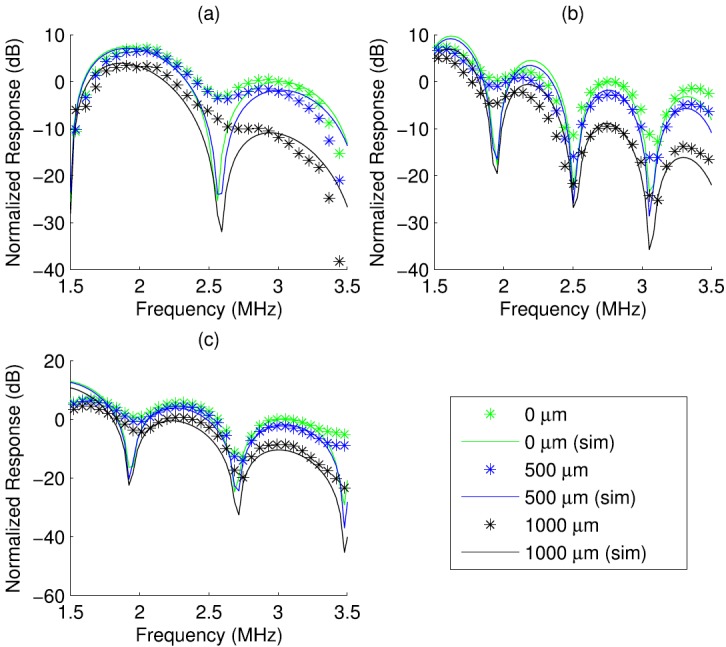
(Color online) Simulated (solid) and measured (marker) normalized frequency responses for three fish eggs at three lateral positions.
TABLE VI.
Decrease of the response from focus response (sphere), measurement (M), and simulation (S).
| Drop (dB) at 500 μm lateral position | Drop (dB) at 1000 μm lateral position | ||||||
|---|---|---|---|---|---|---|---|
| Fig. 7 subplot | Frequency (MHz) | M | S | M - S | M | S | M - S |
| a | 3 | 2.18 | 1.81 | 0.37 | 11.87 | 11.01 | 0.86 |
| b | 3.25 | 2.82 | 1.81 | 1.01 | 9.55 | 8.85 | 0.7 |
| c | 3 | 2.26 | 2.06 | 0.20 | 8.62 | 10.40 | −1.78 |
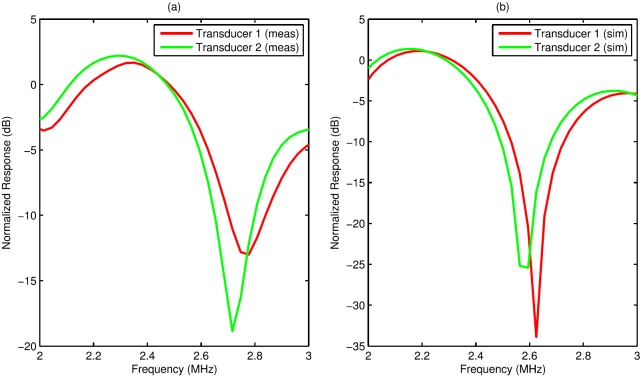
To examine the impact of increasing sphere size compared to the width of the beam, a comparison was conducted by simulating the response for a single 1000 μm diameter scatterer for two transducers with the same diameter and center frequency but different focal lengths and hence beam widths (Table I). The beam widths of transducer 1 and transducer 2 were approximately 875 and 2000 μm at 2.25 MHz, respectively, compared to a scatterer diameter of 1000 μm. Simulated responses for both transducers appear in Fig. 7(b). The response for transducer 2 corresponded to a best-fit intensity form factor for a 498 μm radius sphere (RMSE = 2.46 dB, 2–3 MHz), while the best-fit intensity form factor to the response for transducer 1 corresponded to a sphere radius of 490 μm (RMSE = 2.46 dB, 2–3 MHz). These estimates correspond to a 0.4% and 2.0% difference with the true scatterer size, respectively, and to a 1.6% difference between each other.
FIG. 7.
(Color online) Measured (a) and simulated (b) normalized frequency responses of a single fish egg for two transducers. Transducer 1 was more highly focused and had a smaller beam width.
To corroborate the simulation findings, a single fish egg was scanned consecutively with transducers 1 and 2. The measured responses at the focus appear in Fig. 7(a). The measured response for transducer 1 was shifted slightly toward the response for a smaller scatterer compared to the corresponding response for transducer 2. The best-fit form factors for the measured responses were 465 μm (RMSE = 3.2 dB, 2–3 MHz) for transducer 1 and 470 μm (RMSE = 2.0 dB, 2–3 MHz) for transducer 2, corresponding to a 1.1% difference. Thus, the measured and simulated responses for transducer 1 were both shifted slightly toward the plane-wave response for a 1%–2% smaller scatterer compared to the response for transducer 2.
C. Simulation of a thin cylinder in the focal plane
A thin cylinder (ka ≪ 1, 0–5 MHz) was simulated using as a single spatial sample in cross section and several samples along the cylinder length, which was parallel to the beam lateral direction (Fig. 2). Several lateral grid sizes were examined and the response for each grid size was compared to the smallest grid size. Convergence was established if the RMSE between the response for a given grid size and the response for the smallest grid size was below 0.1 dB. For transducer 1, convergence was found at a lateral grid size of 250 μm microns, while convergence was found at 500 μm for transducer 2. Figure 8 displays the response for each grid size for transducer 1 (a) and transducer 2 (b). The normalized frequency response converged to an dependence in both cases.
FIG. 8.
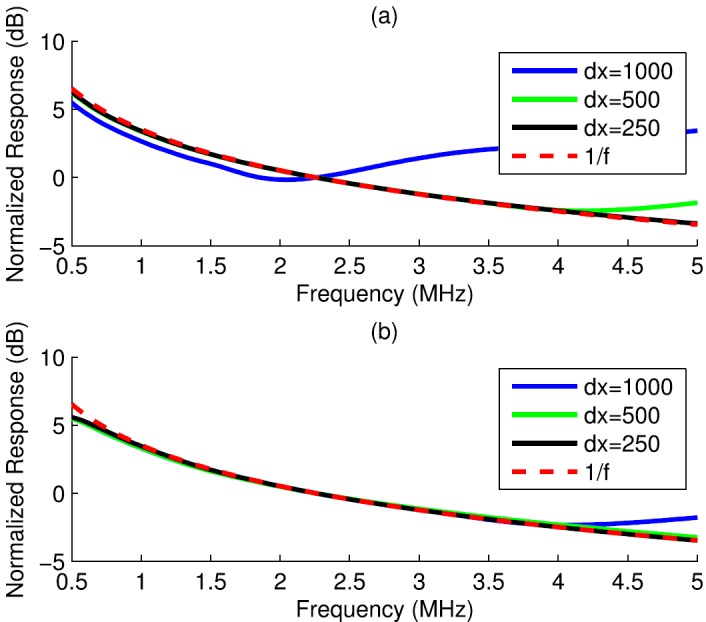
(Color online) Normalized frequency response for a thin (one spatial sample in cross-section) cylinder for several lateral grid sizes (dx, μm): transducer 1 (a) and transducer 2 (b).
D. Comparison of measurement, simulation, and theory for a physically large cylindrical scatterer
Normalized frequency responses were estimated [Eq. (14)] from scan data for three cylinders with different diameters individually scanned in the focal plane of transducer 2. The diameter for each cylinder was estimated using calipers (Table VII). The measured response was compared to the simulated response for a cylinder producing the best visual alignment of the peaks and nulls of the response. The estimated and measured sizes agreed to within 3.5%.
TABLE VII.
Cylinder diameter estimates for simulation and form factor comparison and corresponding diameter measurements.
| Cylinder | Measured diameter (mm) | Sim. best-fit diameter (mm) |
|---|---|---|
| a | 0.90 | 0.93 |
| b | 1.50 | 1.55 |
| c | 3.00 | 3.02 |
Figure 9 depicts normalized frequency responses for the measured and simulated cylinders centered at 0, 500, and 1000 μm from the beam axis. The simulated cylinder size was chosen to produce the best alignment of the nulls of the response as determined by visual assessment. The three responses for each measured or simulated cylinder were normalized by a single constant such that the 0 μm responses were scaled to 0 dB at a peak in the response. The decrease in the responses at 500 and 1000 μm positions with respect to the response at the focus was quantified in Table VIII. Simulation and experiment were in agreement to within 2.6 dB for two of the three cylinders (Table VIII).
FIG. 9.
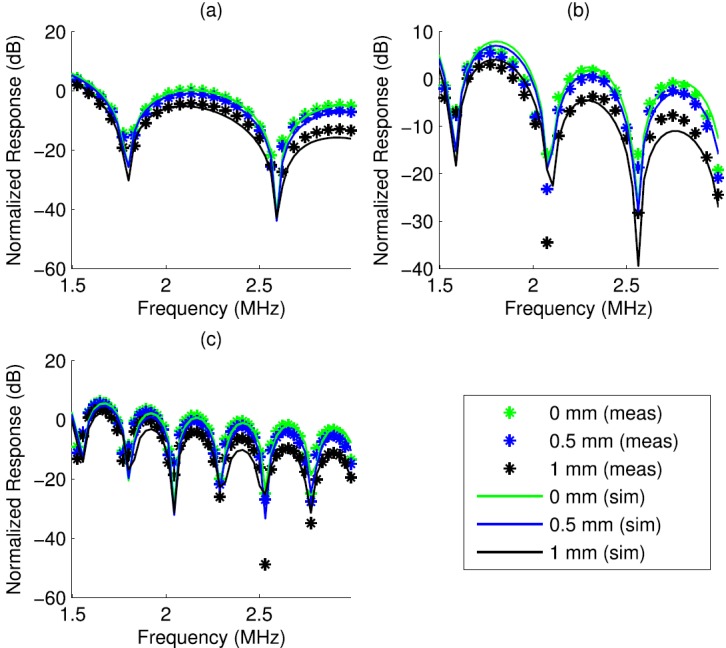
(Color online) Simulated (solid) and measured (marker) normalized frequency responses for three cylinders at three lateral positions. The cylinders had nominal diameters of 0.90 mm (a), 1.50 mm (b), and 3.00 mm (c).
TABLE VIII.
Decrease of the response from focus response (cylinder), measurement (M), and simulation (S).
| Decrease (dB) at 500 μm lateral position | Decrease (dB) at 1000 μm lateral position | ||||||
|---|---|---|---|---|---|---|---|
| Fig. 9 subplot | Frequency (MHz) | M | S | M - S | M | S | M - S |
| a | 2.93 | 2.44 | 2.38 | 0.06 | 8.12 | 10.7 | −2.58 |
| b | 2.75 | 2.22 | 2.28 | −0.06 | 6.86 | 10.4 | −3.54 |
| c | 2.9 | 2.02 | 2.02 | 0 | 8.72 | 8.72 | 0 |
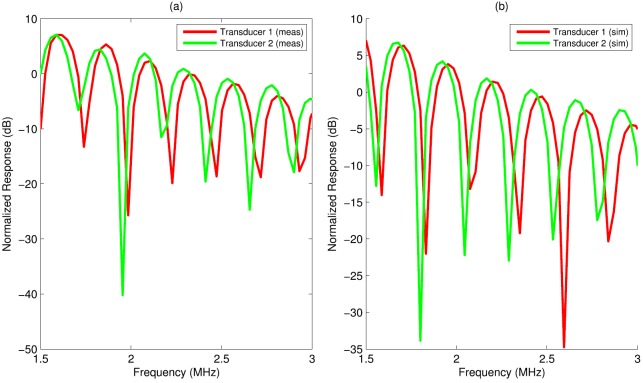
A single cylinder with a radius of 1500 μm was simulated at the focus of transducer 1 and transducer 2. Normalized frequency responses for both transducers appear in Fig. 10(b). For transducer 1, the best-fit form factor corresponded to a radius of 1460 μm (RMSE = 1.67 dB, 1.5–3 MHz), and for transducer 2, the best-fit form factor corresponded to a radius of 1490 μm (RMSE = 1.58 dB, 1.5–3 MHz). These best-fit sizes correspond to differences with the true size of 2.7% and 0.6%, respectively, and to a difference of 2% between each other.
FIG. 10.
(Color online) Measured (a) and simulated (b) normalized frequency responses of a single cylinder for two transducers. Transducer 1 was more highly focused and had a smaller beam width.
These findings were next corroborated with experimental measurements. A water cylinder with a nominal radius of 1500 μm was measured at the foci of two transducers having the same diameter but different focal numbers. Normalized frequency responses for the same fluid cylinder appear in Fig. 10(a) for both transducers. A best-fit form factor was found for both responses. For transducer 1, the best-fit form factor corresponded to a radius of 1539 μm (RMSE = 2.61 dB, 1.5–3 MHz), and for transducer 2, the best-fit form factor corresponded to a radius of 1561 μm (RMSE = 3.54 dB, 1.5–3 MHz), corresponding to a 1.4% difference between the two size estimates, which is consistent with simulation predictions.
V. DISCUSSION
Predictions for spheres and spheroids with the same axial support were found to be identical in simulation (Fig. 5), supporting the choice of a spheroidal fish egg as an acoustic model for a sphere. The response for a thin cylinder at the focus is low-pass filtered by the beam, producing a different response from the plane-wave response. To examine this effect, a thin (one sample in cross-section) cylinder was simulated. The resulting normalized frequency response was found to fall off as (Fig. 8) compared to the plane-wave response. Thus, the effect of transducer beam diffraction is to modify the plane-wave frequency dependence for the response of a thin cylinder located in the focal plane and at the focus by a factor of .
The simulation results were corroborated with experimental measurements. For spheres positioned in the focal plane of the transducer, the simulated normalized frequency responses were compared to the normalized frequency responses from scans of fish eggs at the same lateral displacement. The simulations captured the measured decrease in frequency response as the scatterers were displaced laterally from the focus (Fig. 6), and the magnitude of the fall-off at the last peak in the normalized frequency response agreed to within 2 dB between measurement and simulation (Table VI). Similarly, the difference between simulated and measured normalized frequency responses for cylinders (Table VIII) was less than 3.5 dB. These results confirm that the simulations captured realistic beam effects. Likewise, comparison of single scatterer measurements at the focus using two transducers having different focal properties was both qualitatively (shifting of the response toward a smaller scatterer for the more highly focused transducer) and quantitatively (1.1% decrease in estimated sizes for spheres, 1.4% decrease for cylinders) consistent with the simulation comparison (1.6% decrease for spheres, 2% decrease for cylinders).
The transducer response for a physically small sphere at the focus should be equal to the plane-wave response for that sphere under an ideal pulse excitation because the spatial impulse response at the focus of a single-element transducer is a delta function. On the other hand, simulation predictions for physically large spheres and cylinders of a specified size revealed that the response was altered somewhat from the plane wave response by the beam for physically large scatterers. The simulated normalized frequency response for a 500 μm radius sphere at the focus of transducer 2 corresponded to a best-fit form factor with a 498 μm radius, while the more highly focused transducer resulted in a response (Fig. 7) which agreed with the form factor for an even smaller sphere (a = 490 μm). Similarly, for a 1500 μm radius fluid cylinder (Fig. 10) the simulated responses for these two transducers corresponded to the form factor for cylinders with diameters of 1490 and 1460 μm, respectively. From the standpoint of estimating a scatterer size, the impact of a large weak scatterer in the beam of a transducer was to bias the best-fit size estimate for the scatterer from the true scatterer size by a few percent. The most likely explanation for this phenomenon was the reduced depth of field of the more highly focused transducer, which can be expected to produce a frequency-dependent windowing of the scatterer in the axial direction, making it to appear slightly smaller.
The results have important implications for size estimates of collections of scatterers, and hence for tissues. The fact that the transducer beam did not appreciably alter the single-scatterer responses suggests that spectral quantitative ultrasound techniques can be applied to media containing dominant spherical scatterers which are comparable in size to a wavelength or the transducer beam if normalization to account scatterer positions is applied. If the beam contains a scatterer that is on the order of the beam size, then the scattering may be dominated by a few scatterers in the beam. The same may be true for parallel cylinders. Good correspondence was noted by Wear40 between backscatter coefficient estimates for single nylon wires oriented perpendicular to the beam axis and Faran's theory for a cylindrical scatterer under plane-wave insonification. Wear's approach used a reference phantom technique and applied a frequency-dependent scaling factor to the experimental data to mimic the effects of multiple parallel cylinders. Thus, estimation of the plane-wave response for collections of identical parallel cylinders may be feasible. If so, the single cylinder results suggest that size estimates should not be significantly biased compared to the true physical size for cylinders with diameter comparable to a beam width. Finally, transducer 1 results illustrate limiting behavior as single scatterers grow to be slightly larger than the transducer beam width. Interestingly, the resulting response corresponds closely to the plane-wave response for a scatterer with physical dimensions 2%–3% smaller than the scatterer being interrogated. Thus, size estimates can be expected to be biased by only a small fraction of the true scatterer size as the scatterers grow to be as large as the transducer beam width assuming small impedance mismatches between the scatterers and background.
VI. CONCLUSION
The method of Jensen34 was implemented to study the response of weak spherical or cylindrical scatterers that are comparable in diameter to the beam width of a single-element transducer. Several important findings resulted from this implementation and the corresponding measurements: (1) The simulated response for a spheroidal scatterer was equal to the response for a sphere with the same axial extent. (2) As the sphere diameter grew to be comparable to a beam width, the predicted response for a spherical scatterer corresponded closely to the form factor for a sphere with a 2% smaller radius. (3) The response for a single cylindrical scatterer in the focal plane was found to differ from the plane-wave response for a cylinder by a factor of . (4) As cylinder radii grew large compared to a beam width, the predicted response for a cylindrical scatterer corresponded closely to the form factor for a cylinder with a 2.7% smaller radius.
In the simulations, the need for specific values of the impedance was avoided by frequency-independent normalization of simulated and measured power spectra. Thus, only the frequency dependence, and not the amplitude of the response, was considered here. Future work will examine simulating the magnitude of the response from known values of sound speed and density, which will be important for simulating the response for a medium that has more than two acoustic phases.
In addition to the above observations regarding the behavior of physically large scatterers, this work provides crucial implementation details for using the method of Jensen to generate responses from structured random media. Single scatterers were placed at different lateral positions in the focal plane, and good correspondence was found between simulated and measured results, suggesting that the simulated response accurately captures transducer behavior throughout the focal plane, and hence simulation of collections of scatterers should be possible. These results further suggest that the plane-wave response may be estimated from collections of scatterers which are not small compared to the beam of a transducer. Future work will focus on the simulation of collections of objects (i.e., collections of spheres or parallel cylinders), the simulation of arbitrary spatial maps of acoustic properties (i.e., acoustic maps not composed a collection of simple shapes), and validating techniques for code speed-up in order to rapidly generate simulated RF data and B-mode images from 3D maps of tissue morphology.
ACKNOWLEDGMENTS
The work was supported by NIH Grant R01 EB008992 (National Institutes of Health, Bethesda, MD), by NIH F31 CA174308-01, by the Fulbright Scholars Program (M.L.O.), and by the János Bolyai Scholarship of the Hungarian Academy of Sciences (M.Gy.).
References
- 1.Buckler A. J., Bresolin L., Dunnick N. R., and Sullivan D. C., “ Quantitative imaging test approval and biomarker qualification: Interrelated but distinct activities,” Radiology 259, 875–884 (2011). 10.1148/radiol.10100800 [DOI] [PMC free article] [PubMed] [Google Scholar]
- 2.Buckler A. J., Bresolin L., Dunnick N. R., and Sullivan D. C., “ A collaborative enterprise for multi-stakeholder participation in the advancement of quantitative imaging,” Radiology 258, 906–914 (2011). 10.1148/radiol.10100799 [DOI] [PubMed] [Google Scholar]
- 3.Insana M. F., Hall T. J., Wood J. G., and Yan Z. Y., “ Renal ultrasound using parametric imaging techniques to detect changes in microstructure and function,” Invest. Radiol. 28, 720–725 (1993). 10.1097/00004424-199308000-00013 [DOI] [PubMed] [Google Scholar]
- 4.Feleppa E. J., Liu T., Shao M. C., Fleshner N., Reuter V., and Fair W. R., “ Ultrasonic spectral-parameter imaging of the prostrate,” Int. J. Imag. Syst. Technol. 8, 11–25 (1997). [DOI] [Google Scholar]
- 5.Lizzi F. L., Astor M., Liu T., Deng C., Coleman D. J., and Silverman R. H., “ Ultrasonic spectrum analysis for tissue assays and therapy evaluation,” Int. J. Imag. Syst. Technol. 8, 3–10 (1997). [DOI] [Google Scholar]
- 6.Vlad R. M., Brand S., Giles A., Kolios M. C., and Czarnota G. J., “ Quantitative ultrasound characterization of responses to radiotherapy in cancer mouse models,” Clin. Cancer Res. 15, 2067–2075 (2009). 10.1158/1078-0432.CCR-08-1970 [DOI] [PubMed] [Google Scholar]
- 7.Oelze M. L., W. D. O'Brien, Jr. , Blue J. P., and Zachary J. F., “ Differentiation and characterization of rat mammary fiboradenomas and 4T1 mouse carcinomas using quantitative ultrasound imaging,” IEEE Trans. Med. Imag. 23, 764–771 (2004). 10.1109/TMI.2004.826953 [DOI] [PubMed] [Google Scholar]
- 8.Mamou J., Coron A., Oelze M. L., Saegusa-Beecroft E., Hata M., Lee P., Machi E. J., Yanagihara E., Laugier P., and Feleppa E. J., “ Three-dimensional high-frequency backscatter and envelope quantification of cancerous human lymph nodes,” Ultrasound Med. Biol. 37, 345–357 (2011). 10.1016/j.ultrasmedbio.2010.11.020 [DOI] [PMC free article] [PubMed] [Google Scholar]
- 9.Kemmerer J. P. and Oelze M. L., “ Ultrasonic assessment of thermal therapy in rat liver,” Ultrasound Med. Biol. 38, 2130–2137 (2012). 10.1016/j.ultrasmedbio.2012.07.024 [DOI] [PMC free article] [PubMed] [Google Scholar]
- 10.Ghoshal G., Lavarello R. J., Kemmerer J. P., Miller R. J., and Oelze M. L., “ Ex vivo study of quantitative ultrasound parameters in fatty rabbit livers,” Ultrasound Med. Biol. 38, 2238–2248 (2012). 10.1016/j.ultrasmedbio.2012.08.010 [DOI] [PMC free article] [PubMed] [Google Scholar]
- 11.Kemmerer J. P., Ghoshal G., Karunakaran C., and Oelze M. L., “ Assessment of high-intensity focused ultrasound treatment of rodent mammary tumors using ultrasound backscatter coefficients,” J. Acoust. Soc. Am. 134, 1559–1568 (2013). 10.1121/1.4812877 [DOI] [PMC free article] [PubMed] [Google Scholar]
- 12.Anderson V. C., “ Sound scattering from a fluid sphere,” J. Acoust. Soc. Am. 22, 426–431 (1950). 10.1121/1.1906621 [DOI] [Google Scholar]
- 13. J. J. Faran, Jr. , “ Sound scattering by solid cylinders and spheres,” J. Acoust. Soc. Am. 23, 405–418 (1951). 10.1121/1.1906780 [DOI] [Google Scholar]
- 14.Born M. and Wolf E., Principles of Optics: Electromagnetic Theory of Propagation, Interference and Diffraction of Light ( Pergamon, New York, 1975), pp. 1–986. [Google Scholar]
- 15.Ishimaru A., Wave Propagation and Scattering in Random Media ( Academic, New York, 1978), pp. 1–504. [Google Scholar]
- 16.Shung K. P. K. and Thieme G. A., Ultrasonic Scattering in Biological Tissues ( CRC Press, Boca Raton, FL, 1993), pp. 1–486. [Google Scholar]
- 17.Insana M. F., Wagner R. F., Brown D. G., and Hall T. J., “ Describing small-scale structure in random media using pulse-echo ultrasound,” J. Acoust. Soc. Am. 87, 179–192 (1990). 10.1121/1.399283 [DOI] [PMC free article] [PubMed] [Google Scholar]
- 18.Debye P. and Bueche A. M., “ Scattering by an inhomogeneous solid,” J. Appl. Phys. 20, 518–525 (1949). 10.1063/1.1698419 [DOI] [Google Scholar]
- 19.Oelze M. L. and W. D. O'Brien, Jr. , “ Application of three scattering models to the characterization of solid tumors in mice,” Ultrason. Imag. 28, 83–96 (2006). 10.1177/016173460602800202 [DOI] [PubMed] [Google Scholar]
- 20.Manry C. W. and Broschat S. L., “ FDTD simulations for ultrasound propagation in a 2-D breast model,” Ultrason. Imag. 18, 25–34 (1996). 10.1177/016173469601800103 [DOI] [PubMed] [Google Scholar]
- 21.Mast T. D., Hinkleman L. M., Orr M. J., Sparrow V. W., and Waag R. C., “ Simulation of ultrasonic pulse propagation through the abdominal wall,” J. Acoust. Soc. Am. 102, 1177–1190 (1997). 10.1121/1.421015 [DOI] [PubMed] [Google Scholar]
- 22.Doyle T. E., Tew A. T., Warnick K. H., and Carruth B. L., “ Simulation of elastic wave scattering in cells and tissues at the microscopic level,” J. Acoust. Soc. Am. 125, 1751–1767 (2009). 10.1121/1.3075569 [DOI] [PubMed] [Google Scholar]
- 23.Mamou J., Oelze M. L., W. D. O'Brien, Jr. , and Zachary J. F., “ Identifying ultrasonic scattering sites from three-dimensional impedance maps,” J. Acoust. Soc. Am. 117, 413–423 (2005). 10.1121/1.1810191 [DOI] [PubMed] [Google Scholar]
- 24.Mamou J., Oelze M. L., W. D. O'Brien, Jr. , and Zachary J. F., “ Extended three-dimensional impedance map methods for identifying ultrasonic scattering sites,” J. Acoust. Soc. Am. 123, 1195–1208 (2008). 10.1121/1.2822658 [DOI] [PMC free article] [PubMed] [Google Scholar]
- 25.Marston P. L., “ Scattering of a Bessel beam by a sphere,” J. Acoust. Soc. Am. 121, 753–758 (2007). 10.1121/1.2404931 [DOI] [PubMed] [Google Scholar]
- 26.Marston P. L., “ Scattering of a Bessel beam by a sphere: II. Helicoidal case and spherical shell example,” J. Acoust. Soc. Am. 124, 2905–2910 (2008). 10.1121/1.2973230 [DOI] [PubMed] [Google Scholar]
- 27.Mitri F. G., “ Equivalence of expressions for the acoustic scattering of a progressive high-order Bessel beam by an elastic sphere,” IEEE. Trans. Ultrason., Ferroelectr., Freq. Control 56, 1100–1103 (2009). 10.1109/TUFFC.2009.1143 [DOI] [PubMed] [Google Scholar]
- 28.Mitri F. G., “ Generalized theory of resonance excitation by sound scattering from an elastic spherical shell in a nonviscous fluid,” IEEE. Trans. Ultrason., Ferroelectr., Freq. Control 59, 1781–1790 (2012). 10.1109/TUFFC.2012.2382 [DOI] [PubMed] [Google Scholar]
- 29.Mitri F. G., “ Interaction of an acoustical quasi-Gaussian beam with a rigid sphere: Linear axial scattering, instantaneous force, and time-averaged radiation force [Correspondence],” IEEE Trans. Ultrason., Ferroelectr., Freq. Control 59, 2347–2351 (2012). 10.1109/TUFFC.2012.2460 [DOI] [PubMed] [Google Scholar]
- 30.Mitri F. G., “ Arbitrary scattering of an acoustical high-order Bessel trigonometric (non-vortex) beam by a compressible soft fluid sphere,” Ultrasonics 53, 956–961 (2013). 10.1016/j.ultras.2012.12.008 [DOI] [PubMed] [Google Scholar]
- 31.Hesford A. J., Astheimer J. P., and Waag R. C., “ Acoustic scattering by arbitrary distributions of disjoint, homogeneous cylinders or spheres,” J. Acoust. Soc. Am. 127, 2883–2893 (2010). 10.1121/1.3372641 [DOI] [PMC free article] [PubMed] [Google Scholar]
- 32.Stanton T. K., “ Simple approximate formulas for backscattering of sound by spherical and elongated objects,” J. Acoust. Soc. Am. 86, 1499–1510 (1989). 10.1121/1.398711 [DOI] [Google Scholar]
- 33.Stanton T. K., “ Sound scattering by spherical and elongated shelled bodies,” J. Acoust. Soc. Am. 88, 1619–1633 (1990). 10.1121/1.400321 [DOI] [Google Scholar]
- 34.Jensen J. A., “ A model for the propagation and scattering of ultrasound in tissue,” J. Acoust. Soc. Am. 89, 182–190 (1991). 10.1121/1.400497 [DOI] [PubMed] [Google Scholar]
- 35.Mari J. M., Blu R., Matar O. B., Unser M., and Cachard C., “ A bulk modulus dependent linear model for acoustical imaging,” J. Acoust. Soc. Am. 125, 2413–2419 (2009). 10.1121/1.3087427 [DOI] [PubMed] [Google Scholar]
- 36.Zemp R. J., Abbey C. K., and Insana M. F., “ Linear systems models for ultrasonic imaging: Application to signal statistics,” IEEE Trans. Ultrason., Ferroelectr., Freq. Control 50, 642–654 (2003). 10.1109/TUFFC.2003.1209551 [DOI] [PMC free article] [PubMed] [Google Scholar]
- 37.Jensen J. A., “ Field: A program for simulated ultrasound system,” Med. Biol. Eng. Comput. 34, 351–353 (1996).8945858 [Google Scholar]
- 38.Jensen J. A. and Svendsen N. B., “ Calculation of pressure fields from arbitrarily shaped, apodized, and excited ultrasound transducers,” IEEE Trans. Ultrason., Ferroelectr., Freq. Control 39, 262–267 (1992). 10.1109/58.139123 [DOI] [PubMed] [Google Scholar]
- 39.Gyöngy M., Balogh L., Szalai K., and Kalló I., “ Histology-based simulations of ultrasonic imaging,” Ultrasound Med. Biol. 39, 1925–1929 (2013). 10.1016/j.ultrasmedbio.2013.05.005 [DOI] [PubMed] [Google Scholar]
- 40.Wear K. A., “ Measurement of dependence of backscatter coefficient from cylinders on frequency and diameter using focused transducers—with application to trabecular bone,” J. Acoust. Soc. Am. 115, 66–72 (2004). 10.1121/1.1631943 [DOI] [PMC free article] [PubMed] [Google Scholar]


