Abstract
Recent work shows that acoustic overexposures causing only transient threshold elevation, and no hair cell loss, nevertheless can cause irreversible loss of the synapses between inner hair cells and cochlear nerve fibers (Kujawa and Liberman 2009). This cochlear synaptopathy, which is selective for the subset of sensory fibers with high thresholds and low spontaneous rates (Furman et al. 2013), appeared fully developed at 24-h post-exposure and showed no recovery by 8 weeks. However, prior studies of this synaptopathy counted only pre-synaptic ribbons, did not examine post-exposure times less than 24 h, and did not analyze the spatial patterns of degeneration around the hair cell circumference. Here, we immunostained for pre-synaptic ribbons, post-synaptic terminals and glutamate receptor patches, as well as the hair cell cytoplasm in noise-exposed and control mice to address the dynamics and spatial organization of the synaptopathic process as a function of post-exposure time from 0 h to 2 weeks. Our analysis showed that the loss of synaptic elements is nearly complete immediately after the 2-h exposure, that there is a reversible downregulation of gluR expression in the peripheral terminals which may be part of a protective mechanism, that there may be reversible reorganization of synaptic locations immediately after exposure, and that the spatial patterns are consistent with the idea that low-SR fibers are mainly found on the modiolar face of the hair cell and are the most vulnerable to noise-induced degeneration.
Electronic supplementary material
The online version of this article (doi:10.1007/s10162-015-0510-3) contains supplementary material, which is available to authorized users.
Keywords: auditory nerve, inner ear, synaptic ribbon, glutamate receptor
INTRODUCTION
Classically, noise-induced or age-related “hearing loss” is defined by the pattern and degree of threshold elevation. These threshold shifts are caused by damage to the hair cells, especially the outer hair cells that power the cochlear amplifier, and/or the stria vascularis that powers the cochlear battery (Liberman and Kiang 1978; Schmiedt and Schulte 1992). Recent work has suggested that the most vulnerable elements in the auditory periphery are actually the cochlear nerve terminals, rather than the hair cells or the stria vascularis (Kujawa and Liberman 2009; Furman et al. 2013; Sergeyenko et al. 2013). Even after noise exposures causing only transient threshold elevation, there can be significant loss of the synaptic connections between inner hair cells (IHCs) and the peripheral terminals of cochlear nerve fibers, despite no loss of hair cells or persistent threshold elevation (Kujawa and Liberman 2009). Similarly, in cochlear aging, loss of cochlear nerve synapses accumulates steadily in the post-natal ear, reaching 25 % at middle age, long before there is any significant loss of hair cells (Sergeyenko et al. 2013).
Although threshold shift is a sensitive metric of hair cell damage, diffuse loss of IHC synapses, or the cochlear nerve fibers they drive, has to exceed 80–90 % before behavioral thresholds rise significantly (Schuknecht and Woellner 1955; Lobarinas et al. 2013) and can reach 40–50 % without elevating thresholds of compound neural potentials such as the auditory brainstem response (ABR) recorded from the scalp or the compound action potential (CAP) recorded from the cochlear round window (Bourien et al. 2014). Part of the explanation for this seeming paradox is that the synaptic loss is selective for, or at least biased towards, the subgroup of cochlear nerve fibers with high thresholds and low spontaneous discharge rates (SRs) (Furman et al. 2013).
Prior work, using confocal analysis of cochlear epithelial whole mounts immunostained to reveal the pre-synaptic ribbons present at each IHC synapse, has shown that noise-induced synaptopathy is visible within 24 h after exposure (Kujawa and Liberman 2009). The reduction in ribbon counts is stable from 1 day to 8-week post-exposure, suggesting there is little if any regeneration of these connections. Correspondingly, when survival time is extended beyond 6 months, loss of the neuronal cell bodies in the spiral ganglion slowly appears, and by 2-year post-exposure, the magnitude of ganglion cell loss essentially matches the acute loss of pre-synaptic ribbons (Kujawa and Liberman 2009).
Since those initial confocal observations on noise-induced synaptopathy, we have enhanced our immunostaining protocols to allow us to assess the post-synaptic elements, including the glutamate receptors (gluRs) and post-synaptic terminals (Liberman et al. 2011; Yin et al. 2014). We have also demonstrated complementary gradients in the sizes of ribbons and gluR patches on opposing sides of the IHC: large ribbons and small receptor patches on the modiolar side compared to small ribbons and large receptor patches on the pillar side (Yin et al. 2014). These gradients appear to be the morphological substrate for the low-SR/high-SR gradient in cochlear nerve response (Liberman 1978).
Armed with these enhanced tools for assessing the condition and spatial organization of cochlear nerve synapses, we set out to revisit the post-exposure dynamics of the noise-induced changes in synaptic connections in hopes of shedding light on the underlying mechanisms. Questions to address included whether pre- or post-synaptic elements disappear first, at what post-exposure time the synapses or peripheral terminals first disappear, and whether the spatial pattern of the early changes is consistent with the view that high-threshold, low-SR fibers are most vulnerable. Our analysis showed that the loss of synaptic elements is already essentially complete immediately after our standard 2-h exposure, that there appears to be reversible downregulation of gluR expression in the peripheral terminals which may be part of a protective mechanism, that there may be reversible reorganization of the synaptic locations immediately after exposure, and that the spatial pattern is indeed consistent with the idea that low-SR fibers are the most vulnerable.
MATERIALS AND METHODS
Animals and Groups
CBA/CaJ male mice, aged 8–9 weeks, were used for these studies. Animals were exposed to noise (8–16 kHz octave-band noise at 98 dB SPL for 2 h) and sacrificed at either 0 and 24-h and 1 or 2-week post-exposure. Age- and gender-matched control ears were not exposed to the noise. Noise exposure was carried out as described elsewhere (Kujawa and Liberman 2006): animals were awake and unrestrained throughout the exposure.
Experiments were performed in two separate rounds, separated by more than 1 year. In each round, control groups as well as each of the post-exposure survival groups were processed. Between the two experimental rounds, immunostaining protocols were improved to produce cleaner staining of post-synaptic glutamate receptors and brighter staining of cochlear nerve terminals and to allow quadruple stains to simultaneously visualize pre-synaptic ribbons, post-synaptic glutamate receptors, cochlear nerve dendrites, and inner hair cell bodies. Pre-synaptic ribbons were well stained in material from both rounds.
Unless otherwise indicated, statistical analysis was carried out in Kaleidagraph® using ANOVA with Bonferroni post hoc correction: p values <0.01 for any pairwise comparison within each multigroup ANOVA analysis were considered significant. Precise values for F and p are given in the Supplementary Table for all significant differences shown in the figures, as stipulated in the guidelines for JARO publications.
Cochlear Function Testing
ABRs and distortion product otoacoustic emissions (DPOAEs) were recorded as described previously (Kujawa and Liberman 2006). Mice were anesthetized with ketamine and xylazine. ABR stimuli were 5 ms tone pips with a 0.5-ms rise-fall time delivered at 30/s. Sound level was incremented in 5 dB steps, from 10 dB below threshold to 90 dB SPL. Threshold for ABR was defined as the lowest stimulus level at which a repeatable waveform morphology could be identified in the response. DPOAEs were recorded for primary tones with a frequency ratio of 1.2 and with the level of the f2 primary 10 dB less than f1 level, incremented together in 5 dB steps. The 2f1-f2 DPOAE amplitude and surrounding noise floor were extracted. Threshold for DPOAEs is defined as the f1 level required to produce a response amplitude of 0 dB SPL.
Cochlear Processing and Immunostaining
After intravascular perfusion with 4 % paraformaldehyde in phosphate-buffered saline at pH 7.3, cochleas were dissected and immediately perfused through the cochlear scalae, post-fixed for 2 h at room temperature, decalcified in EDTA for 2–3 days, and then dissected into six pieces (roughly half turns of the cochlear spiral) for whole-mount processing of the cochlear epithelium. Immunostaining began with a blocking buffer (PBS with 5 % normal horse serum and 0.3–1 % Triton X-100) for 1 h at room temperature and followed by overnight incubation at 37 °C with some combination of the following primary antibodies: (1) mouse (IgG1) anti-CtBP2 (C-terminal Binding Protein) from BD Biosciences at 1:200, to quantify pre-synaptic ribbons; (2) mouse (IgG2a) anti-GluA2 (Glutamate receptor subunit A2) from Millipore at 1:2000, to quantify post-synaptic receptor patches; (3) goat anti-Na-K ATPase α3 from Santa Cruz at 1:100 to label dendrites of cochlear nerve fibers; and (4) rabbit anti-Myosin VIIa from Proteus Biosciences at 1:200 to delineate the inner hair cell cytoplasm. Primary incubations were followed by two sequential 60-min incubations at 37 °C in species-appropriate secondary antibodies (coupled to Alexafluor dyes) with 0.3–1 % Triton X-100.
Image Acquisition and Morphometric Analysis
For cochlear whole mounts, lengths of the dissected pieces of the spiral were measured in each case and converted to cochlear frequency (Muller et al. 2005). Confocal z-stacks from each ear were obtained from the IHC area using a high-resolution glycerin-immersion objective (63×, 1.3 N.A.) and 3.18× digital zoom with a 0.25-μm z-spacing on a Leica SP5 confocal microscope. For each stack, the z-planes imaged included all synaptic elements in the x-y field of view, which encompassed ~10 IHCs. In each ear, two adjacent z-stacks were imaged at each of 8 log-spaced cochlear frequency regions: 5.6, 8.0, 11.3, 16.0, 22.6, 32.0, 45.2, and 64 kHz. For each post-exposure time in the round 2 analysis, a set of control ears (n = 2) and exposed ears (n = 4) was batch-processed using the same reagent solutions. Each batch-processed set was then imaged together using the same confocal acquisition parameters and analyzed using the same iso-intensity criteria to assess the synaptic elements.
To identify and measure pre-synaptic ribbons and post-synaptic glutamate receptor patches, confocal z-stacks were ported to image-processing software (Amira, Visage Imaging). Synaptic puncta were identified using the “connected components” feature, which records the volume and x,y,z position of each synaptic element, defined as discrete volumes of at least 10 contiguous voxels in which intensity values in the selected channel are greater than an arbitrary criterion (usually set at 40 on a 0–255 8-bit scale). Juxtaposition of ribbons, receptor patches, and post-synaptic terminals were assessed by high-magnification re-imaging of all the synaptic puncta in each z-stack. For each identified punctum, custom software accessed the z-stack, extracted a voxel cube (1 μm on a side) centered on its x,y,z, coordinate, computed the maximum projection of this cube, and displayed it as a thumbnail image. The resultant thumbnail array, containing miniature projections of the space directly around each synaptic element was then scanned visually to count the number of orphan ribbons, for example, that lack a closely apposed glutamate receptor patch (Liberman et al. 2011).
To assess the position of each synaptic element with respect to the IHC basolateral membrane, the final step of the analysis was to define the modiolar-pillar and habenular-cuticular axes in each z-stack. This was accomplished with custom software that displayed the maximum projection of each z-stack in the y-z plane and allowed the user to translate and rotate a set of orthogonal axes to best capture (1) a modiolar-pillar axis representing a best-fit to the cloud of synaptic elements at the base of the IHC and (2) an orthogonal habenular-cuticular axis that bisected the IHCs’ long axes. After the user set the rotation and approximate translation of the axes, the software placed the origin at the midpoint of transformed y (modiolar-pillar) and z (habenular-cuticular) values.
RESULTS
A. Temporary Threshold Shift and Permanent Suprathreshold Response Decrements
Prior work in mouse has shown that noise exposures causing only reversible threshold elevations can, nonetheless, produce rapid (within 24 h) loss of cochlear nerve peripheral synapses without any loss of the inner hair cells (IHCs) that they contact (Kujawa and Liberman 2009). When post-exposure survival was increased to 2 years, a corresponding death of the cell bodies of cochlear nerve fibers in the spiral ganglion was noted (Kujawa and Liberman 2009). Prior work was on mice that were 16 weeks old at the time of exposure, with exposure level to an 8–16 kHz noise band set to 100 dB SPL for 2 h.
For the present study, we sought to decrease the age-at-exposure to 8 weeks, to avoid the extra delay and cost of aging animals to 16 weeks before beginning a study. However, CBA/CaJ mice show decreased noise vulnerability as they mature from 8 to 16 weeks (Kujawa and Liberman 2006), when vulnerability is measured as the permanent elevation of cochlear thresholds. Thus, to produce the same noise-induced synaptopathy with the same noise band and duration, we assumed that the sound pressure level had to be reduced. Indeed, exposure at 98 dB SPL in 8-week mice produced physiological changes similar to those seen in 16-week mice at 100 dB SPL. When measured 24-h post-exposure, threshold elevation, as seen in DPOAEs, was minimal at 11.3 kHz and below and rose to maximum of 26 dB at 22.6 kHz (Fig. 1A). However, by 1–2-week post-exposure, thresholds recovered, by both ABRs and DPOAEs, at all frequencies except 45.2 kHz, where the permanent shift was 15 or 20 dB depending on whether measured via DPOAEs (Fig. 1A) or ABRs (Fig. 1B), respectively. Suprathreshold amplitudes of ABR wave 1, the summed activity of cochlear nerve fibers, showed significant reduction at frequencies >16 kHz (Fig. 1C), despite no changes in the suprathreshold amplitudes of the DPOAEs, except at 45.2 kHz (not shown). Such a pattern is consistent with significant loss of cochlear synapses in basal cochlear regions.
FIG. 1.
Cochlear thresholds return to normal at all but the highest frequency in mice exposed to 8–16 kHz noise at 98 dB for 2 h. A, B Mean thresholds (±SEMs) for DPOAEs (A) and ABRs (B) seen in control unexposed ears (black; n = 7) and in separate groups of age-matched ears, either 24 h (lavender, n = 14, DPOAE only) or 1 week (blue; n = 7) after exposure. C Mean suprathreshold amplitudes of ABR wave 1 in the same groups of animals shown in A and B: amplitudes were averaged for each ear and each frequency for sound levels from 60 to 80 dB SPL. Asterisks indicate frequencies at which differences from control were significant (p < 0.01). Error bars on some points are hidden by the symbols.
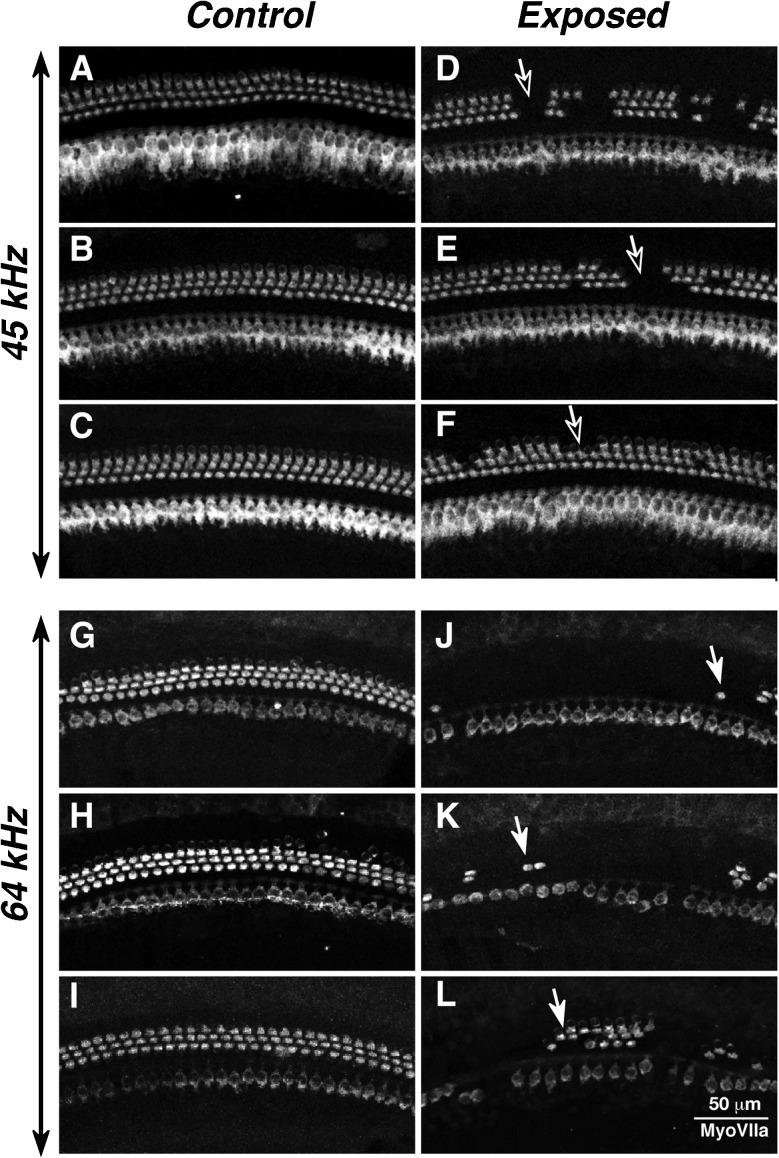
Consistent with the permanent elevation of cochlear thresholds at the highest test frequency, there was scattered loss of OHCs beginning at the 45 kHz region (Fig. 2D–F), growing to near total loss of OHCs in the 64 kHz region (Fig. 2J–L), a frequency above the limits of our cochlear function test equipment. OHC loss was virtually never seen at any cochlear region in control ears (Fig. 2A–I).
FIG. 2.
Hair cell loss in exposed ears was confined to OHCs and was seen only at and basal to the 45 Hz location. Each image is centered on either the 45-kHz location (A–F) or the 64-kHz location (G–L) in a different ear: A–C and G–I in control ears and D–F and J–L in exposed ears with 1-week post-exposure survival.
B. Time Course of Ribbon Loss and Recovery
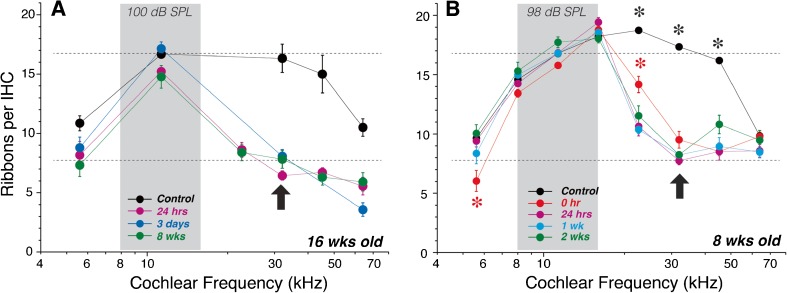
In prior work on 16-week animals, immunostaining of cochlear whole mounts with anti-CtBP2 showed loss of IHC ribbons throughout the base of the cochlea at 24 h after the 100-dB exposure (Fig. 3A), with little evidence for recovery between 24-h and 8-week post-exposure (Kujawa and Liberman 2009). Here, we show a similar degree of damage in 8-week animals following the 98-dB exposure (Fig. 3B). Indeed at 32 kHz, the frequency region of maximal ribbon loss, the results are almost identical at the two ages (bold arrows). As seen in the 16-week data, the synaptopathy in the 8-week animals shows no significant recovery between 24 h and 2-week post-exposure. Paradoxically, the most prominent difference between the two ages is the greater synaptopathy in the 16-week animals at the 64 kHz region, where the older animals show more than a 50 % loss of synapses, while the younger animals show no significant synaptopathy.
FIG. 3.
Recapitulating the pattern of synaptopathy in 8-week mice (B) previously reported in 16-week mice (A). A Mean ribbon counts (±SEMs) reproduced from Figure 1 of a prior report (Kujawa and Liberman 2009), showing the effects of a 2-h exposure to the 8–16 kHz noise at 10 dB in 16-week-old mice. B Mean ribbon counts (±SEMs) for 8-week ears exposed to the 8–16 kHz noise and then evaluated immediately (0 h), 24 h and 1- or 2-week post-exposure, as compared to age-matched controls. Data are based on ears from rounds 1 and 2 (see “MATERIALS AND METHODS”): control—n = 16, 0 h—n = 8, 24 h—n = 6, 1 week—n = 6, and 2 weeks—n = 5. Dashed lines are positioned at the same y-axis values in both plots to facilitate comparison. Asterisks indicate statistically significant differences at the p < 0.01 level, i.e., (1) control means at 22.6, 32, and 45.2 kHz are significantly different from each of the experimental groups and (2) 0-h means are significantly different from controls at 5.6 and from other exposed groups at 22.6 kHz. No other pairwise differences reach significance. Error bars on some points are hidden by the symbols.
To probe the dynamics of noise-induced synaptopathy, we added an experimental group with cochleas fixed immediately at the termination of exposure. As seen in Figure 3B, the “0-h” survival data show that most of the ribbon loss is actually taking place during the 2-h exposure. At the 32 kHz place, the synaptopathy is statistically indistinguishable between 0 h and any of the other post-exposure survivals. At other cochlear locations, the 0-h ribbon loss is different from later post-exposure times in two subtle but significant ways (p < 0.01): (1) there is less ribbon loss at 22.6 kHz than at all the later survivals and (2) there is more ribbon loss at 5.6 kHz than at the longer post-exposure survivals, when mean ribbon counts are similar to unexposed controls (Fig. 3B).
C. Time Course of Synaptic Loss and Recovery
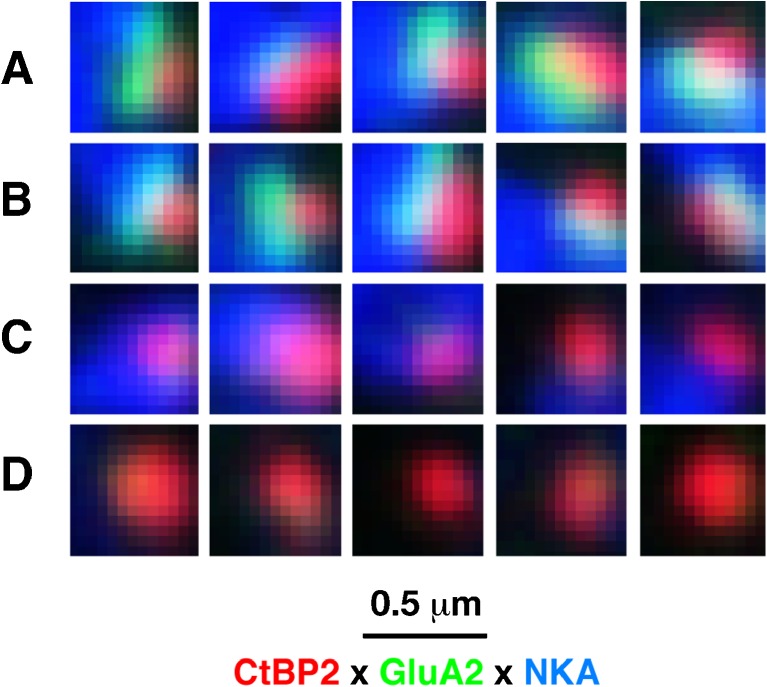
To gain further insight into the interactions between pre- and post-synaptic elements in the development of noise-induced synaptopathy, we added immunostaining for post-synaptic glutamate receptor patches and cochlear nerve terminals. For receptor patches, we used antibodies to the AMPA receptor subunit most prominently expressed by cochlear nerve terminals (GluA2; (Matsubara et al. 1996)). For the unmyelinated terminals of cochlear nerve fibers contacting IHCs, we used antibodies to a Na-K ATPase expressed in their membranes (McLean et al. 2009). To help understand the positions of the synapses with respect to the IHC surface, we added anti-myosin VIIa in the fourth channel. As shown in Figure 4, the resultant confocal z-stacks show the basolateral membrane of the IHCs studded with closely apposed CtBP2- and GluA2-positive puncta. Where the fiber density is not too great, it is possible to see the association of these paired puncta with the terminal swellings of cochlear nerve fibers (e.g., red arrows in Fig. 4A). The pairings of pre- and post-synaptic elements are better seen by re-projecting the voxel space immediately around each ribbon, thereby eliminating confusion from more distant z-planes in the image stack (Fig. 5A, B). In mouse, each cochlear nerve fiber contacts a single IHC via a single active zone, comprising a pre-synaptic ribbon within the IHC directly apposed to a post-synaptic glutamate receptor gluR patch on the cochlear nerve’s terminal swelling (Stamataki et al. 2006).
FIG. 4.
Visualizing IHC synapses in confocal z-stacks from immunostained cochlear whole mounts, acquired in the x-y plane (A) and re-projected into y-z (B) plane. A Pre- and post-synaptic elements in the IHC area are counted in cochlear whole mounts quadruple-immunostained for CtBP2 (red), GluA2 (green), Na-K ATPase (blue), and myosin VIIa (white). White arrows indicate several synapses, i.e., closely juxtaposed red and green puncta; red-filled arrows indicate several terminal swellings of cochlear nerve fibers. B The size gradients in pre- and post-synaptic elements are quantified by defining a new set of axes in the y-z plane designed to (1) minimize the habenular-cuticular spread of synaptic distances from new modiolar-pillar axis while (2) keeping the new origin as close to the IHC midline as possible. This maximum projection in the y-z plane is from the same z-stack shown in the acquisition (x-y) plane in panel A.
FIG. 5.
High-power thumbnails of selected ribbons showing synapses with all pre- and post-synaptic elements (A, B), orphan ribbons lacking post-synaptic glutamate receptor patches (C) and orphan ribbons lacking post-synaptic terminals (D). Images are selected from the 16- and 22-kHz regions of ears from the 1-week survival group.
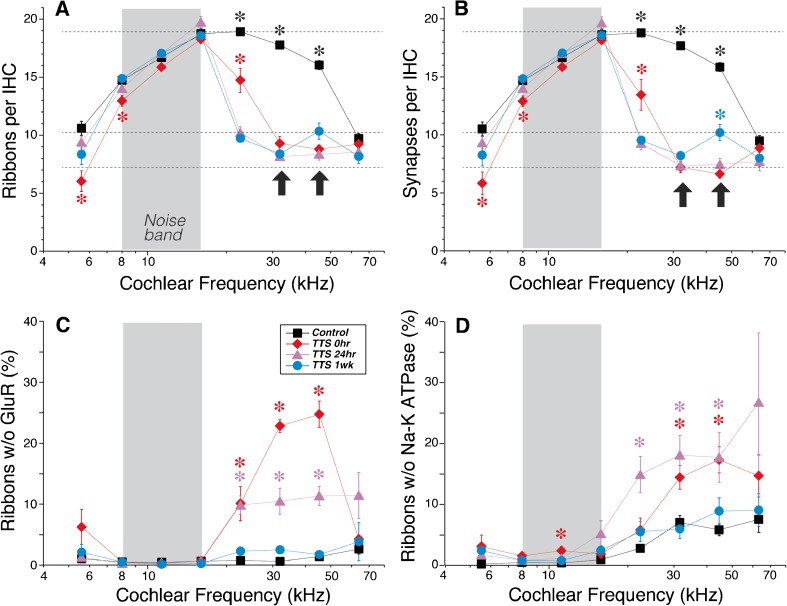
In normal cochleas, our confocal images show a one-for-one association between pre-synaptic ribbons and post-synaptic receptor patches, as expected from ultrastructural analyses (Liberman 1980; Stamataki et al. 2006), i.e., virtually every ribbon is closely apposed to a receptor patch and virtually every receptor patch is closely apposed to a ribbon. Thus, the number of “orphan” ribbons is close to zero at all cochlear locations in control ears (Fig. 6C). In the 0-h post-exposure group, there is a significant increase in the number of orphan ribbons in the damage region, i.e., from 22.6 to 45.2 kHz (Figs. 5C, D and 6C). The number of orphans decreases by 24-h post-exposure, and by 1-week post-exposure, virtually all remaining ribbons are once again paired with gluR patches, as in the control ears. Correspondingly, the ribbon counts at the early post-exposure times tend to underestimate the synaptopathy; thus, at 32 and 45 kHz, the synaptic losses are slightly larger than the ribbon losses (compare Fig. 6A, B, bold arrows).
FIG. 6.
Orphan ribbons are common immediately after exposure but disappear by 1-week post-exposure. A, B Ribbon counts and synaptic counts, respectively, at 0 and 24 h and 1 week after exposure to 8–16 kHz noise (gray boxes) compared to control (unexposed) ears. Values are mean counts per IHC (±SEMs). Synaptic counts are slightly lower than ribbon counts because some ribbons are orphans, lacking apposed glutamate receptor patches. Dashed lines are placed at arbitrary y-axis values to facilitate comparison between ribbon and synaptic counts. C Prevalence of ribbons without apposed gluR patches in the same groups as A and B, expressed as the percentage of total ribbon counts. D Prevalence of ribbons without apposed terminals, seen via Na-K ATPase immunostaining, and expressed as the percentage of total ribbon counts. Data are from two z-stacks at each frequency region in each ear, where each z-stack contains 9–12 IHCs, as shown in Fig. 4A. Ears included here (n = 6 for controls and n = 4 for each exposure group) are from round 2 (see “MATERIALS AND METHODS”), i.e., those that were batch-processed and imaged at the same confocal settings. Asterisks indicate significant intergroup differences (p < 0.01): see text for further details. Error bars on some points are hidden by the symbols. Arrows in A and B indicate regions of maximum synaptic loss, i.e., 32.0 and 45.2 kHz.
Examination of the unmyelinated dendrites of cochlear nerve fibers also shows nearly a one-to-one association with pre-synaptic ribbons: as shown in Figure 6D, in the normal cochlea, and again by 1-week post-exposure, more than 90 % of ribbons are closely apposed to a nerve terminal immunopositive for Na-K ATPase (see also Fig. 5A, B). At 0- and 24-h post-exposure, a higher percentage of ribbons lack post-synaptic terminals (e.g., Fig. 5D), with significant differences at both survivals in the 32.0 and 45.2 kHz regions (Fig. 6D). At 0 h, the number of ribbons lacking apposed gluR patches is higher than the number of ribbons lacking apposed terminals (Fig. 6C vs. D). This suggests that some terminals in the damage region have downregulated expression of gluRs.
D. Spatial Locations of Synaptic Loss
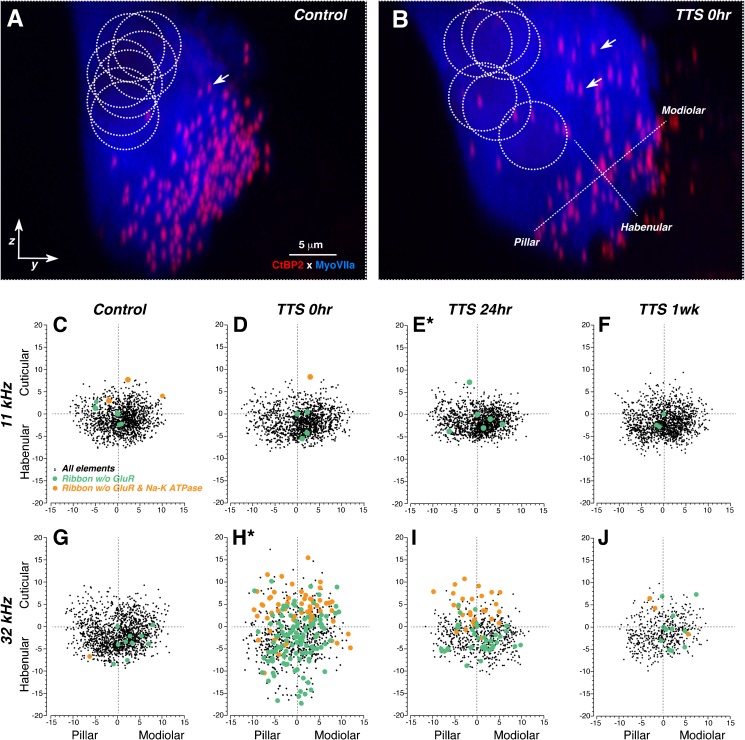
Prior work has shown a spatial segregation of synapses around the IHC such that fibers with high spontaneous discharge rates (SRs) and low thresholds tend to synapse on the side closer to the pillar cells, whereas those with low-SRs and high-threshold synapse on the side closer the modiolus (Liberman 1980, 1982). In immunostained cochlear whole mounts, this distinction is visible in normal ears as complementary gradients in the sizes of ribbons and receptor patches across the modiolar-pillar axis, seen when the z-stacks are re-projected as if viewing the organ of Corti in cross section (e.g., Figs. 4B and 7A): large ribbons apposed to small gluR patches on the modiolar side, and small ribbons apposed to large gluR patches on the pillar side (Liberman et al. 2011; Yin et al. 2014). Normal ears also tend to show a higher concentration of synapses on modiolar vs. the pillar side of the IHCs (Figs. 4 and 7).
FIG. 7.
Spatial reorganization of IHC synaptic elements after neuropathic noise exposure. A, B Maximum y-z projections of confocal z-stacks from a control (A) and a 0-h post-exposure ear (B), showing the transient dispersion of synaptic elements around the IHC immediately after exposure. Positions of IHC nuclei, shown by the dashed circles, are visible after adjusting the gamma in the red channel (not shown). Positioning of modiolar-pillar and habenular-cuticular axes (used to transform the synaptic locations for superposition across z-stacks, as shown in panels C–J) is shown by the orthogonal dashed lines. Several synaptic ribbons are indicated by white arrows. For the sake of clarity, only the IHC (Myosin VIIa) and ribbon (CtBP2) staining are shown. C–J Scatterplots showing the spatial organization of synaptic elements in control ears (C, G) and in each of the three post-exposure survival groups, as indicated in the column header. The two rows of panels allow comparison of data from cochlear regions tuned to 11 kHz (C–F) vs. 32 kHz (G–J). The new pillar-modiolar and habenular-cuticular axes are defined as illustrated in B. The numerical values are given in microns. As indicated by the key in panel C, each ribbon location is coded according to whether it was paired or unpaired with a gluR patch, or both a gluR patch and a post-synaptic terminal, i.e., Na-K ATPase immunostaining. Plots are derived from the same dataset as that shown in Fig. 6, except that only four control ears are shown, so that the synaptic density can be directly compared to the post-exposure survival groups, each of which also contains four ears. Asterisks next to the panel letters indicate that two distributions (E and H) were significantly different from all the others by an Ansari-Bradley test (Matlab tool box: p = 0.001 and p < 0.00001, respectively).
Qualitative assessment of the re-projected z-stacks from noise-exposed ears suggested a tendency for ribbon positions to become more widely dispersed along a habenular-cuticular axis, parallel to the IHC’s long axis, and for their positions to be more evenly dispersed along the modiolar-pillar axis. In order to quantify these trends, we defined, in each z-stack, modiolar-pillar and orthogonal habenular-cuticular axes (Yin et al. 2014) with which to transform the x,y,z locations of the synaptic elements (see Figs. 4B and 7B and “MATERIALS AND METHODS”). When results are superimposed across multiple ears from the same exposure groups, several trends are clear (Fig. 7).
The first trend is that, at the 0-h post-exposure survival, synapses indeed are significantly dispersed along the IHC’s long axis in the 32-kHz region: the distance between the habenular-most and the cuticular-most elements increases from ~18 μm to about ~34 μm (Fig. 7G vs. H), and the distribution of habenular-cuticular positions is significantly different from all others by an Ansari-Bradley test (p < 0.00001). This noise-induced dispersion of synapses happens at 32 kHz, the center of the synaptopathic region, and not at 11 kHz, where there will be no permanent synaptopathy (Fig. 7C vs. D). The dispersion disappears with time, such that at 1-week post-exposure, the long-axis extent of the synaptic locations has returned to values of ~18 μm, and the distribution of habenular-cutiuclar positions is once again statistically indistinguishable from controls. These spatial data suggest either (1) that synaptic position is fluid on the IHC basolateral membrane or (2) that IHCs transiently elongate after noise. Comparing the images in Figure 7A and B, as well as the total modiolar-pillar spread of synaptic loci in control (Fig. 7G) vs. exposed (Fig. 7H) cases, suggest that the former interpretation is correct.
The second trend is that orphan ribbons lacking an apposed gluR patch, but still apposed to a cochlear nerve terminal, tend to be located near the habenular end, whereas orphan ribbons lacking both an apposed gluR patch and an apposed cochlear nerve terminal tend to be located at the cuticular extent of the synaptic cloud (orange symbols in Fig. 7C–J). There does not appear to be any modiolar-pillar predilection for the appearance of orphans, thus we infer that there are no differences between the SR groups either. As discussed above, the similarity in 32-kHz ribbon counts at 0 h and 1 week (Fig. 6A) and the low percentage of orphan ribbons at 1 week (Figs. 6C and 7J) suggest that the 0-h orphan ribbons eventually recover rather than degenerate. This recovery could reflect either (1) retraction and regeneration of cochlear nerve terminals or (2) downregulation followed by upregulation of glutamate receptors and the Na/K ATPase.
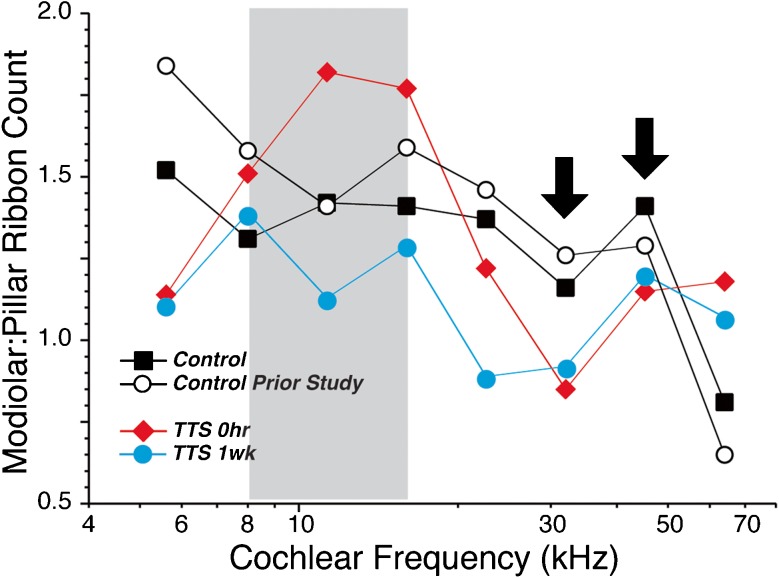
The third trend is that the loss of synapses is greater on the modiolar side than the pillar side of the IHC. In the scatter plots of Figure 7, the synaptic cloud, in normal ears and normal regions of exposed ears, is densest in the lower right quadrant of the transformed axes, i.e., towards the modiolar side and the habenular pole of the IHC. At 32 kHz, in all post-exposure groups, the point cloud is more evenly distributed across the pillar-modiolar axis. The data is replotted in Figure 8 as the ratio of modiolar to pillar synaptic locations at each cochlear frequency region in each experimental group. At the three frequency regions where there is significant permanent loss of synapses (22.6, 32, and 45.2 kHz; bold arrows in Fig. 8), the noise-induced decrease in modiolar: pillar ratios is consistent with a preferential loss of modiolar-side synapses and, therefore, with a preferential loss of fibers with high thresholds and low SRs.
FIG. 8.
Neuropathic noise exposure decreases the number of synapses on the modiolar side of the IHC. Each graph is derived from the same dataset shown in Figure 3B by counting the number of synapses on the modiolar vs. the pillar sides of the IHC, as shown in Figures 4 and 7, and then expressing the difference as a ratio. Each point represents a single ensemble average across all the z-stacks at a given frequency region from all the ears in a given group. In control ears, there are always more synapses on the modiolar than the pillar side, except at the basal extreme of the cochlea (64 kHz). In the region of the noise-exposed ears, where the synaptic counts are maximally reduced, i.e., 32.0 and 45.2 kHz (arrows), there are slightly more synapses on the pillar than the modiolar side. To increase the robustness of the comparison, we include data from a separate set of control ears (group 2; n = 6) that was analyzed as part of a prior study of synaptic organization in mouse (Yin et al. 2014).
E. Spatial Gradients in Synaptic Size
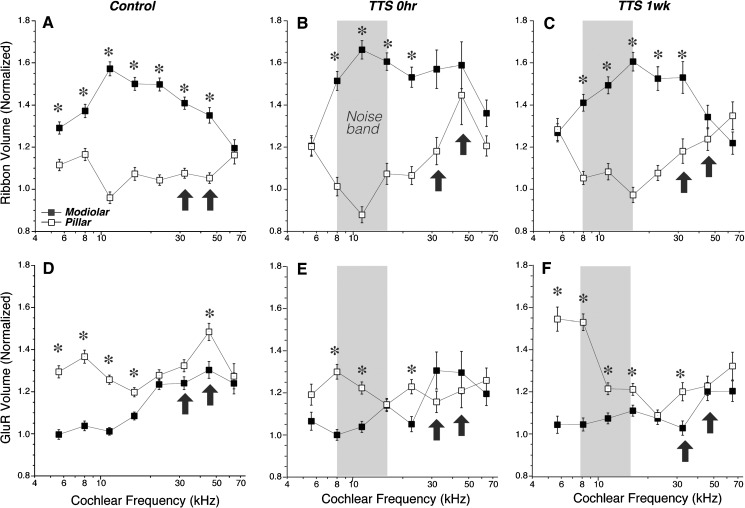
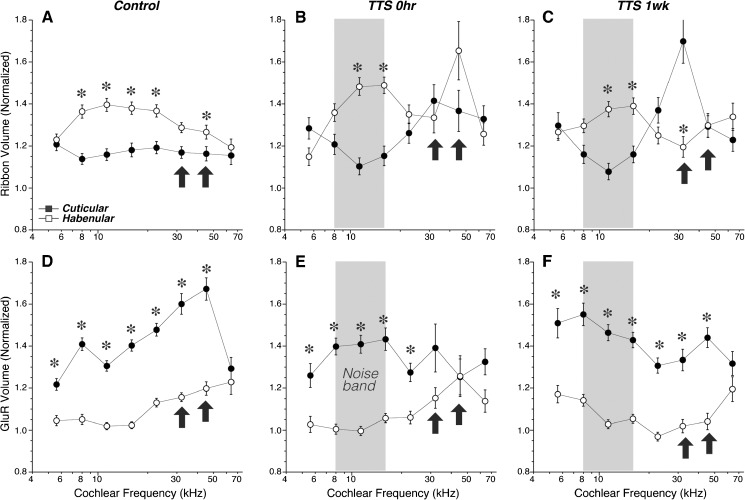
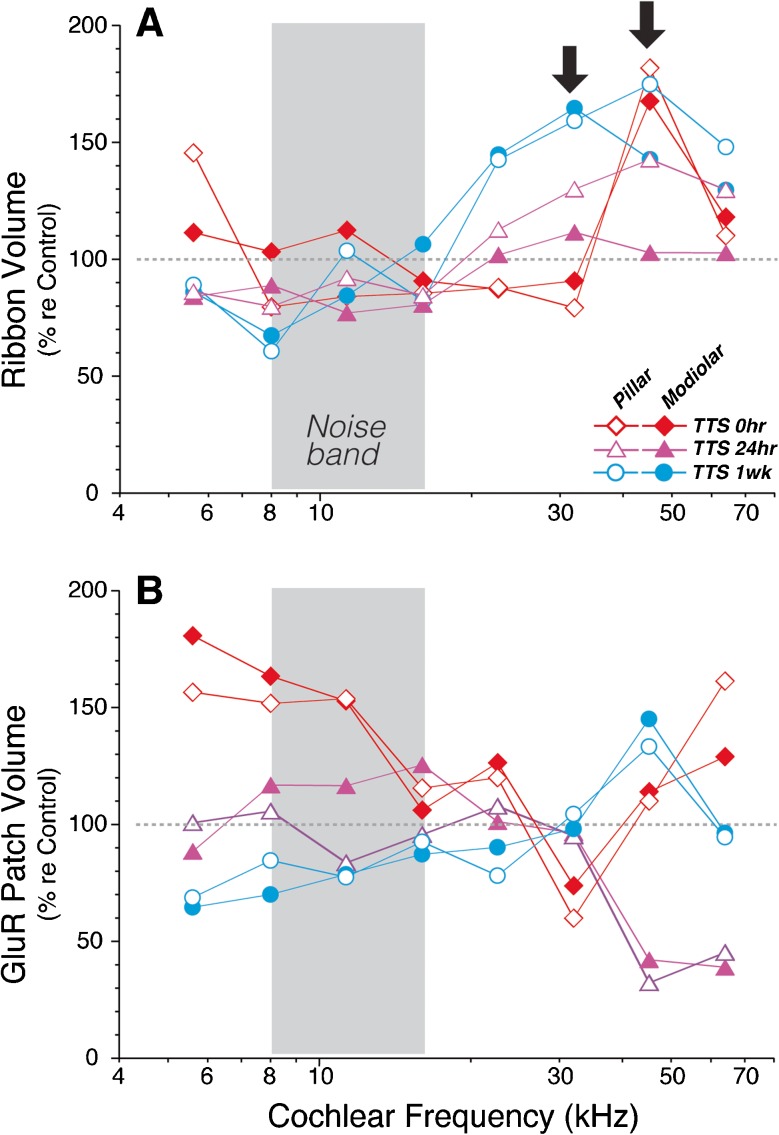
The spatial gradients in the sizes of pre- and post-synaptic puncta can be quantified by (1) transforming the coordinate system of each z-stack as shown in Figure 4B and described in “MATERIALS AND METHODS,” (2) determining the position of each synaptic element along these transformed modiolar-pillar and habenular-cuticular axes, and then (3) averaging the volumes of the elements on each side of the origin. The data in Figure 9 show the normal complementary gradients for ribbons and gluR patches along the modiolar-pillar axis in control ears: in all frequency regions except 64 kHz, the ribbons are significantly larger on the modiolar side (Fig. 9A), while the gluR patches tend to be larger on the pillar side (Fig. 9D). There are analogous complementary gradients along the habenular-cuticular axis (Fig. 10): in most frequency regions, the ribbons are significantly larger on the habenular side, while the gluR patches are larger on the cuticular side.
FIG. 9.
The complementary modiolar-pillar gradients in size of ribbons (A–C) and glutamate receptor patches (D–F) are attenuated after acoustic overexposure. In each panel, the mean volume (±SEM) of ribbons or gluR patches is computed after dividing the synapses according to their position re the origin of the transformed modiolar-pillar and habenular-cuticular axes, defined as illustrated in Figure 4B. Volumes in each z-stack are normalized re the median value for that stack. Asterisks indicate that the volume differences are significant at the p < 0.01 level. The bandwidth of the noise exposure is shown by the gray boxes, and the arrows are positioned at the frequency regions with the greatest noise-induced loss of synapses: 32 and 45 kHz. Key in A applies to all panels. Data are derived from the same ears shown in Figure 6.
FIG. 10.
The complementary habenular-cuticular gradients in size of ribbons (A–C) and glutamate receptor patches (D–F) are attenuated after acoustic overexposure. See Figure 9 for further explanation.
After noise exposure, these gradients collapse in the synaptopathic region (bold arrows in Figs. 9 and 10). The collapse is especially striking at 0-h post-exposure. While there are signs of recovery in the gluR patch gradients by 1-week post-exposure, in contrast, the changes in ribbon size gradients appear to be less reversible, especially with respect to the habenular-cuticular gradient (Fig. 10C).
In assessing the size gradients of synaptic elements, we have attempted to control for variability in immunostaining by batch-processing and batch-imaging mixed groups of control ears and exposed ears. In such matched sets, we can compare the sizes of ribbons and gluR patches in matched frequency regions to assess whether there are any noise-induced changes. In regions of maximum synaptopathy (bold arrows in Fig. 11A), there are signs of increased ribbon size at all post-exposure survivals and on both the pillar and modiolar sides of the IHCs; the changes are most robust at the 1-week post-exposure time. The changes in gluR patch size are more complex (Fig. 11B): they appear to be transiently larger in the apical half of the cochlea, where there were transient decreases in ribbon counts (Fig. 3B) and delayed (by 24 h) decreases in the basal most regions, but little systematic change from control at the 1-week survival. These patterns may mirror the apparent recovery of gluR size gradients and the apparent lack of recovery of ribbon size gradients shown in Figures 9 and 10. Although we show only data on punctum size, we also measured mean immunostaining intensity within each punctum and found a very close correlation between size and mean brightness of both pre- and post-synaptic puncta (data now shown).
FIG. 11.
Ribbons are larger immediately after acoustic overexposure and remain enlarged for at least 1 week. The volumes of ribbons (A) and gluR patches (B) were compared after vs. before acoustic overexposure. Each point represents a single ensemble average across all the z-stacks at a given frequency region from all the ears in a given group. Data are from round 2 only (same as in Fig. 6): four ears from each exposure group along with the two control ears batch-processed with them. Mean volumes in exposed ears are compared to the means in the matched controls. The frequency region of the noise band is indicated by the gray box, and the region of maximum noise-induced synaptic loss is indicated by the arrows (32 and 45 kHz).
DISCUSSION
A. Degeneration Dynamics and the Design of Post-Exposure Treatments
In the 1970s and 1980s, electron microscopic studies of noise-exposed cochleas fixed within 24 h after acoustic overexposure clearly showed widespread swelling and vacuolization in the neuropil underneath the IHCs (Spoendlin 1971; Liberman and Mulroy 1982; Robertson 1983). These grossly swollen and highly vacuolated structures were identified as cochlear nerve terminals by virtue of their apposition to recognizable pre-synaptic ribbons. When similarly exposed ears were examined at longer post-exposure survival times, no swollen neurons were seen in the neuropil, and since thresholds might have returned to normal, and there was no obvious loss of cochlear nerve axons or spiral ganglion cells, it was assumed that these noise-damaged terminals recovered or regenerated. However, synaptic structures were never counted in these electron microscopic studies of noise damage. We now know that many injured neurons do not recover and, in fact, will slowly degenerate over the ensuing weeks and months, with loss of spiral ganglion cells matching the loss of synapses after close to 2 years in the mouse (Kujawa and Liberman 2009). Present quantitative data on CtBP2- and GluA2-positive puncta suggest that most of the synaptic degeneration actually occurs during the 2-h exposure. Thus, it appears that post-exposure interventions to treat this condition should focus on promoting neural regeneration rather than preventing neural degeneration.
Signs of ongoing post-exposure loss of synapses were only seen at 22 kHz between 0- and 24-h post-exposure, i.e., at the apical edge of the main damage zone (Fig. 6A, B). Hints of post-exposure synaptic recovery were seen only at 45 kHz (between 1- and 2-week post-exposure; Fig. 6B) and at the apical extreme (5.6 kHz, between 0- and 24-h post-exposure; Fig. 6B). With light microscopy, it is difficult to determine whether the small increases in numbers of immunostained puncta reflect neural regeneration or reversible changes in protein expression or membrane localization. For example, prior studies have suggested that hair cells internalize post-synaptic AMPA receptors as a protective response to acoustic overexposure (Chen et al. 2009). The observation at early post-exposure times that some ribbons were apposed to post-synaptic terminals without an obvious GluA2-positive patch, whereas such orphan ribbons were never seen in control ears, is consistent with receptor internalization in response to noise.
To assess whether receptor downregulation or internalization is more widespread than simply among the orphan ribbons, we compared absolute sizes of receptor patches in batch-processed control vs. exposed ears (Fig. 11). We saw no systematic changes. Although GluA2 patch size was lower at 32 kHz immediately post-exposure, sizes were increased re controls at 22.6 and 45 kHz. With respect to pre-synaptic structures, we observed signs of a persistent decrease in ribbon size in the apex of the cochlea and a persistent increase in ribbon size in the damaged region of the base (Fig. 11). Thus, some of the slight recovery of ribbon counts at 45 kHz between 24 h and 1–2 weeks (Figs. 3B and 6B) could reflect enhanced expression of CtBP2 and a resultant increase in the number of puncta exceeding the detection criterion.
Taken together, present results suggest that most of immediate post-exposure decrease in synaptic puncta reflects a true degeneration of the synaptic elements. Not only is there no significant post-exposure regeneration, seen here only out to 2 weeks, but when post-exposure survival is extended beyond 8 weeks, the synaptopathy begins to grow in both magnitude and spiral extent, exceeding that seen in age-matched unexposed control ears (Kujawa et al. 2011).
B. Synaptic Spatial Gradients and Selective Loss of Low- vs High-SR Fibers
Post-exposure thresholds can recover, despite the loss of so many cochlear nerve synapses, because the synaptic degeneration is biased towards fibers with high thresholds and low spontaneous discharge rates (SRs) (Furman et al. 2013). In the normal cochlear nerve, there is a strict relation between threshold sensitivity and spontaneous rate (Liberman 1978), and single-fiber labeling studies have shown that the low-threshold high-SR fibers tend to synapse on the pillar side of the IHC, whereas the high-threshold low-SR fibers tend to synapse on the modiolar side (Liberman 1982). This physiological gradient appears in the confocal data from immunostained cochlear whole mounts as the complementary gradients in ribbon and gluR-patch size on the pillar vs. modiolar sides of the IHC (Figs. 9 and 10). Given that the sizes of these puncta are really measures of staining intensity (which should be proportional to numbers of clustered molecules), it makes sense that fibers with high thresholds (modiolar side) should have smaller gluR patches. The reason for the larger ribbons is less obvious; however, prior study in zebrafish lateral line suggests that ribbon size is dynamically regulated by negative feedback from calcium entry at the synapse (Sheets et al. 2012). Thus, a less active (low-SR) synapse would be expected to have a larger ribbon in the normal ear, as appears to the case (Fig. 9).
Here, we assessed the synaptic spatial organization pre- vs. post-exposure to assess whether the morphological data were consistent with prior physiological reports of selective loss of low-SR fibers in this noise-damage model (Furman et al. 2013). In the normal ear, present results showed a slight preponderance of modiolar to pillar synapses, as expected from prior ultrastructural data (Liberman 1980; Liberman et al. 1990) and consistent with the observations from the single-fiber labeling studies showing that, although pillar-side fibers are exclusively those with high SR, synapses on the modiolar side include some fibers from all SR groups (Liberman 1982). After noise exposure, the present results showed a shift in the modiolar-pillar ratio towards the pillar side, and the biggest shifts were seen in the cochlear frequency region of maximum synaptopathy (Fig. 8).
Although the modiolar-pillar trends were in the direction appropriate for a selective loss of low-SR fibers, the morphological data, per se, are not compelling. Interpreting synaptic position post-exposure is complicated because synapses appear to move around the basolateral membrane of the IHC in the hours immediately after trauma. Certainly, the dispersion of synapses immediately after exposure was unambiguous (Fig. 7H). Although the synaptic cloud appears to reform a more normal appearance by 1-week post-exposure, the idea that synaptic position is plastic, even in the adult, may explain why “gaps” in the IHC synaptic map are not more obvious in these de-afferented ears. Further evidence for the plasticity of synaptic position, even in the adult cochlea, can be seen in the reorganization of synaptic architecture in the ouabain-de-afferented mouse ear (Yuan et al. 2014).
C. Mature vs. Juvenile Ears, Hook Lesions, and a Protective Effect of Hair Cell Loss
Prior work on noise exposure in mouse has shown that noise vulnerability, assessed by measuring cochlear threshold shifts following a 100-dB exposure to the same octave band noise used here, is roughly constant from 4 to 8 weeks of age, then dramatically decreases from 8 to 16 weeks, with little further change out to 100 weeks, which is more than two thirds of the way through the mouse’s lifespan (Kujawa and Liberman 2006). Prior reports of noise-induced cochlear synaptopathy in mouse were carried out in mature animals, 16 weeks old at the time of noise exposure. Here, we showed that a similar pattern of dramatic synaptopathy is also achievable in the more vulnerable 8-week-old mouse: to keep the threshold shifts largely reversible, we had to decrease the exposure level by 2 dB. It is not surprising that only a small adjustment of the SPL was required because the growth of permanent threshold shift with exposure level can be very steep, on the order of 8–10 dB/dB (Yoshida et al. 2000). It is sobering, from a public health perspective, that juvenile ears may be more vulnerable to cochlear synaptopathy, as they are to noise-induced cochlear threshold shifts. The massive noise-induced loss of neuronal connectivity documented here likely contributes to the problems hearing in a noisy environment seen in aging human populations.
Although the post-exposure thresholds in our 8-week mice recover in most frequency regions, they do not fully recover at the highest frequency (Fig. 1) and there is a corresponding (permanent) loss of OHCs in the basal tip of the cochlear spiral (Fig. 2). These so-called “hook” lesions are a common result of acoustic overexposure, as documented in several mammalian species (Fried et al. 1976; Liberman and Kiang 1978). They are not explicable based on the spectrum of the input stimulus, or by cochlear mechanics (Narayan and Ruggero 2000), which suggests that basilar membrane vibration should only decrease with increasing distance from the tonotopically appropriate region of the spiral. Rather they appear to reflect an inherent increase in vulnerability of basal most hair cells, perhaps due to increasing calcium influx through transduction currents in increasingly basal OHCs, coupled with a progressive decrease in calcium extrusion capacity via plasma-membrane pumps in the stereocilia, which progressively shorten towards the base (Chen et al. 2012).
Regardless of the mechanisms generating these tonotopically inappropriate “hook OHC lesions,” they were present in our 8-week animals, but absent in a prior study of cochlear synaptopathy in 16-week animals. The corresponding absence of cochlear synaptic loss in the hook region of young ears (Fig. 3A vs. B) suggests the idea that OHC damage may protect the IHC synapses. Accumulating damage to the cochlear amplifier, during the noise exposure, could progressively decrease the drive to the IHC area in the hook in the younger animals, thereby reducing the synaptopathy. Prior work on the dynamics of tissue injury and repair in mouse (Wang et al. 2002) has suggested that other “non-monotonicities” in the relation between exposure level and damage can be explained when destruction of one structure (e.g., the integrity of the reticular lamina) appears to protect another structure (e.g., the fibrocytes in the spiral ligament). Thus, the question of how much synaptopathy is present on IHCs remaining in badly damaged cochlear regions, where there is significant threshold elevation, remains an open one.
Electronic supplementary material
F and p values from the ANOVA analyses used to assess statistical significance. Only those pairwise comparisons found to be significant at the p < 0.01 level, as indicated by asterisks in the Figures, are listed here (GIF 184 kb)
Acknowledgments
This research was supported by grants from the NIDCD: R01 DC 0188 and P30 DC 05209.
Conflict of Interest
The authors have no financial conflicts of interest to declare.
References
- Bourien J, Tang Y, Batrel C, Huet A, Lenoir M, Ladrech S, Desmadryl G, Nouvian R, Puel JL, Wang J. Contribution of auditory nerve fibers to compound action potential of the auditory nerve. J Neurophysiol. 2014;112:1025–1039. doi: 10.1152/jn.00738.2013. [DOI] [PubMed] [Google Scholar]
- Chen Z, Peppi M, Kujawa SG, Sewell WF. Regulated expression of surface AMPA receptors reduces excitotoxicity in auditory neurons. J Neurophysiol. 2009;102:1152–1159. doi: 10.1152/jn.00288.2009. [DOI] [PMC free article] [PubMed] [Google Scholar]
- Chen Q, Mahendrasingam S, Tickle JA, Hackney CM, Furness DN, Fettiplace R. The development, distribution and density of the plasma membrane calcium ATPase 2 calcium pump in rat cochlear hair cells. Eur J Neurosci. 2012;36:2302–2310. doi: 10.1111/j.1460-9568.2012.08159.x. [DOI] [PMC free article] [PubMed] [Google Scholar]
- Fried MP, Dudek SE, Bohne BA. Basal turn cochlear lesions following exposure to low-frequency noise. Trans Am Acad Ophthalmol Tolaryngol. 1976;82:285–298. [PubMed] [Google Scholar]
- Furman AC, Kujawa SG, Liberman MC. Noise-induced cochlear neuropathy is selective for fibers with low spontaneous rates. J Neurophys. 2013;110:577–586. doi: 10.1152/jn.00164.2013. [DOI] [PMC free article] [PubMed] [Google Scholar]
- Kujawa SG, Liberman MC. Acceleration of age-related hearing loss by early noise exposure: evidence of a misspent youth. J Neurosci. 2006;26:2115–2123. doi: 10.1523/JNEUROSCI.4985-05.2006. [DOI] [PMC free article] [PubMed] [Google Scholar]
- Kujawa SG, Liberman MC. Adding insult to injury: cochlear nerve degeneration after “temporary” noise-induced hearing loss. J Neurosci. 2009;29:14077–14085. doi: 10.1523/JNEUROSCI.2845-09.2009. [DOI] [PMC free article] [PubMed] [Google Scholar]
- Kujawa SG, Micucci S, Liberman MC (2011) Noise-induced primary neural degeneration: effects of spectrum, duration, intensity and survival. In: Midwinter Meeting of the Association for Research in Otolaryngology, p 56 [DOI] [PMC free article] [PubMed]
- Liberman MC. Auditory-nerve response from cats raised in a low-noise chamber. J Acoust Soc Am. 1978;63:442–455. doi: 10.1121/1.381736. [DOI] [PubMed] [Google Scholar]
- Liberman MC. Morphological differences among radial afferent fibers in the cat cochlea: an electron-microscopic study of serial sections. Hear Res. 1980;3:45–63. doi: 10.1016/0378-5955(80)90007-6. [DOI] [PubMed] [Google Scholar]
- Liberman MC. Single-neuron labeling in the cat auditory nerve. Science. 1982;216:1239–1241. doi: 10.1126/science.7079757. [DOI] [PubMed] [Google Scholar]
- Liberman MC, Kiang NY. Acoustic trauma in cats. Cochlear pathology and auditory-nerve activity. Acta Otolaryngol. 1978;358:1–63. [PubMed] [Google Scholar]
- Liberman MC, Mulroy MJ (1982) Acute and chronic effects of acoustic trauma: cochlear pathology and auditory nerve pathophysiology. In: New perspectives on noise-induced hearing loss (Hamernik RP, Henderson D, Salvi R, eds), pp 105–136.
- Liberman MC, Dodds LW, Pierce S. Afferent and efferent innervation of the cat cochlea: quantitative analysis with light and electron microscopy. J Comp Neurol. 1990;301:443–460. doi: 10.1002/cne.903010309. [DOI] [PubMed] [Google Scholar]
- Liberman LD, Wang H, Liberman MC. Opposing gradients of ribbon size and AMPA receptor expression underlie sensitivity differences among cochlear-nerve/hair-cell synapses. J Neurosci : Off J Soc Neurosci. 2011;31:801–808. doi: 10.1523/JNEUROSCI.3389-10.2011. [DOI] [PMC free article] [PubMed] [Google Scholar]
- Lobarinas E, Salvi R, Ding D. Insensitivity of the audiogram to carboplatin induced inner hair cell loss in chinchillas. Hear Res. 2013;302:113–120. doi: 10.1016/j.heares.2013.03.012. [DOI] [PMC free article] [PubMed] [Google Scholar]
- Matsubara A, Laake JH, Davanger S, Usami S, Ottersen OP. Organization of AMPA receptor subunits at a glutamate synapse: a quantitative immunogold analysis of hair cell synapses in the rat organ of Corti. J Neurosci : Off J Soc Neurosci. 1996;16:4457–4467. doi: 10.1523/JNEUROSCI.16-14-04457.1996. [DOI] [PMC free article] [PubMed] [Google Scholar]
- McLean WJ, Smith KA, Glowatzki E, Pyott SJ. Distribution of the Na, K-ATPase alpha subunit in the rat spiral ganglion and organ of corti. J Assoc Res Otolaryngol. 2009;10:37–49. doi: 10.1007/s10162-008-0152-9. [DOI] [PMC free article] [PubMed] [Google Scholar]
- Muller M, von Hunerbein K, Hoidis S, Smolders JW. A physiological place-frequency map of the cochlea in the CBA/J mouse. Hear Res. 2005;202:63–73. doi: 10.1016/j.heares.2004.08.011. [DOI] [PubMed] [Google Scholar]
- Narayan SS, Ruggero MA (2000) Basilar membrane mechanics at the hook region of the chinchilla cochlea. In: Recent developments in auditory mechanics (Wada H, Takasaka T, Ikeda K, Ohyama K, Koike T, eds), pp 95–101: World Scientific Press.
- Robertson D. Functional significance of dendritic swelling after loud sounds in the guinea pig cochlea. Hear Res. 1983;9:263–278. doi: 10.1016/0378-5955(83)90031-X. [DOI] [PubMed] [Google Scholar]
- Schmiedt RA, Schulte BA. Physiologic and histopathologic changes in quiet- and noise-aged gerbil cochleas. In: Dancer AL, Henderson D, Salvi RJ, Hamernik RP, editors. Noise induced hearing loss. St. Louis: Mosby; 1992. pp. 246–258. [Google Scholar]
- Schuknecht HF, Woellner RC. An experimental and clinical study of deafness from lesions of the cochlear nerve. J Laryngology Otology. 1955;69:75–97. doi: 10.1017/S0022215100050465. [DOI] [PubMed] [Google Scholar]
- Sergeyenko Y, Lall K, Liberman MC, Kujawa SG. Age-related cochlear synaptopathy: an early-onset contributor to auditory functional decline. J Neurosci : Off J Soc Neurosci. 2013;33:13686–13694. doi: 10.1523/JNEUROSCI.1783-13.2013. [DOI] [PMC free article] [PubMed] [Google Scholar]
- Sheets L, Kindt KS, Nicolson T. Presynaptic CaV1.3 channels regulate synaptic ribbon size and are required for synaptic maintenance in sensory hair cells. J Neurosci. 2012;32:17273–17286. doi: 10.1523/JNEUROSCI.3005-12.2012. [DOI] [PMC free article] [PubMed] [Google Scholar]
- Spoendlin H. Primary structural changes in the organ of Corti after acoustic overstimulation. Acta Otolaryngol. 1971;71:166–176. doi: 10.3109/00016487109125346. [DOI] [PubMed] [Google Scholar]
- Stamataki S, Francis HW, Lehar M, May BJ, Ryugo DK. Synaptic alterations at inner hair cells precede spiral ganglion cell loss in aging C57BL/6J mice. Hear Res. 2006;221:104–118. doi: 10.1016/j.heares.2006.07.014. [DOI] [PubMed] [Google Scholar]
- Wang Y, Hirose K, Liberman MC. Dynamics of noise-induced cellular injury and repair in the mouse cochlea. J Assoc Res Otolaryngol. 2002;3:248–268. doi: 10.1007/s101620020028. [DOI] [PMC free article] [PubMed] [Google Scholar]
- Yin Y, Liberman LD, Maison SF, Liberman MC. Olivocochlear innervation maintains the normal modiolar-pillar and habenular-cuticular gradients in cochlear synaptic morphology. J Assoc Res Otolaryngol. 2014;15:571–583. doi: 10.1007/s10162-014-0462-z. [DOI] [PMC free article] [PubMed] [Google Scholar]
- Yoshida N, Hequembourg SJ, Atencio CA, Rosowski JJ, Liberman MC. Acoustic injury in mice: 129/SvEv is exceptionally resistant to noise-induced hearing loss. Hear Res. 2000;141:97–106. doi: 10.1016/S0378-5955(99)00210-5. [DOI] [PubMed] [Google Scholar]
- Yuan Y, Shi F, Yin Y, Tong M, Lang H, Polley DB, Liberman MC, Edge AS. Ouabain-induced cochlear nerve degeneration: synaptic loss and plasticity in a mouse model of auditory neuropathy. J Assoc Res Otolaryngol. 2014;15:31–43. doi: 10.1007/s10162-013-0419-7. [DOI] [PMC free article] [PubMed] [Google Scholar]
Associated Data
This section collects any data citations, data availability statements, or supplementary materials included in this article.
Supplementary Materials
F and p values from the ANOVA analyses used to assess statistical significance. Only those pairwise comparisons found to be significant at the p < 0.01 level, as indicated by asterisks in the Figures, are listed here (GIF 184 kb)


