Abstract
MIR233 is genetically or epigenetically silenced in a subset of acute myeloid leukemia (AML). MIR223 is normally expressed throughout myeloid differentiation and highly expressed in hematopoietic stem cells (HSCs). However, the contribution of MIR223 loss to leukemic transformation and HSC function is largely unknown. Herein, we characterize HSC function and myeloid differentiation in Mir223 deficient mice. We show that Mir223 loss results in a modest expansion of myeloid progenitors, but is not sufficient to induce a myeloproliferative disorder. Loss of Mir223 had no discernible effect on HSC quiescence, long-term repopulating activity, or self-renewal capacity. These results suggest that MIR223 loss is likely not an initiating event in AML but may cooperate with other AML associated oncogenes to induce leukemogenesis.
Introduction
MiRNAs regulate gene expression by targeting semi-complimentary messenger RNAs for post-transcriptional silencing [1]. While somatic point mutations [2] and copy number alterations [3] involving miRNA genes are uncommon in AML, we recently reported the hemizygous loss of the MIR223 gene in a male patient with therapy-related AML [3]. Additionally, MIR223 has been shown to be epigenetically silenced by AML-ETO [4] and down-regulated in several blood cancers [5]. Although these studies collectively show that MIR223 is commonly silenced in leukemia, the contribution of MIR223 loss to disease pathogenesis is unclear. A previous study of Mir223 deficient mice suggested that miRNA-223 negatively regulates myeloid progenitor proliferation [6]. However, miRNA-223 is highly expressed in HSCs [7,8] and its contribution to HSC function has not been rigorously assessed. As HSCs and their properties are fundamentally linked to leukemogenesis [9,10], we characterized the effect of Mir223 deletion on HSC function to investigate how loss of this gene may contribute to normal and malignant hematopoiesis.
Methods
Mice
Sex- and age-matched wild-type, Mir223 -/Y and female Mir223 -/- mice on a C57BL/6 background were obtained form The Jackson Laboratory and maintained under standard pathogen free conditions. Mice were euthanized using carbon dioxide in a chamber using compressed gas. All mouse experiments were approved by the Washington University Animal Care and Use Committee (number 20122012).
Blood and bone barrow analysis
Peripheral blood and bone marrow were collected as described previously [11]. Complete blood counts (CBCs) were obtained using a Hemavet 950 FS automated cell counter (Drew Scientific). Bone marrow nucleated cells were quantified using a Cellometer Auto 2000 Cell Viablity Counter (Nexcelom).
Flow Cytometry
Bone marrow and peripheral blood was processed for flow cytometry as previously described. [12]. The following antibodies were used (all from eBiosciences unless otherwise indicated): Gr-1 (RB6–8C5), B220 (RA3–6B2), CD3e (145–2C11), Ter119 (TER-119), Sca-1 (D7), c-kit (2B8), CD34 (RAM34), FcγR (93), CD150 (Biolegend, TC15–12F12.2), CD41 (MWReg30), and Flt3 (A2F10).
Cell cycle analysis was performed as previously described [13]. In brief, bone marrow cells were stained for the indicated surface markers, fixed using the BD cytofix/cytoperm kit (BD), blocked with 5% goat serum and stained with mouse anti-human Ki-67 (clone B56; BD Pharmingen). After washing, cells were resuspended in DAPI-containing FACS buffer. All cells were analyzed on a Gallios flow cytometer (Beckman Coulter).
5-Fluorouracil Stress Response
Mice were given a single 150 mg/kg dose of 5-fluorouracil (5-FU) by intraperitoneal injection. Peripheral blood was analyzed prior to treatment and 7, 9, 11, 14, 17, and 35 days after 5-FU administration.
Bone Marrow Transplantation
Bone marrow transplantation was performed as previously described [13]. In brief, bone marrow from Ly5.2 wild-type or Mir223 deficient mice was mixed at a 1:1 ratio with competitor bone marrow from Ly5.1 wild-type mice. Cells were retro-orbitally injected at 4x10⁶ cells/recipient into congenic Ly5.1/Ly5.2 mice conditioned with 1,000 cGy from a 137Cesium source. For serial transplantation studies, bone marrow from primary recipients was harvested at least 6 weeks after transplantation, pooled, and transplanted into lethally irradiated Ly5.1 secondary recipients.
Statistical Analysis
Unpaired student's t-test was used for cell cycle analysis and all lineage, precursor, progenitor, and stem cell population data; student's t-test with Welch's correction was used as necessary when variances were significant between groups. 5-FU, competitive repopulation, and serial transplantation studies were analyzed using 2-way ANOVA with Bonferroni post-test analysis.
Results and Discussion
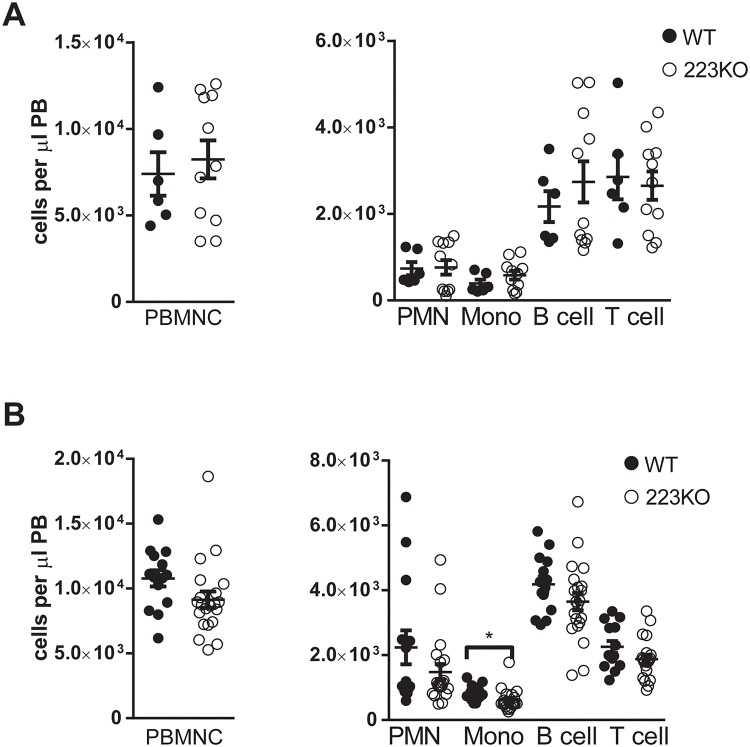
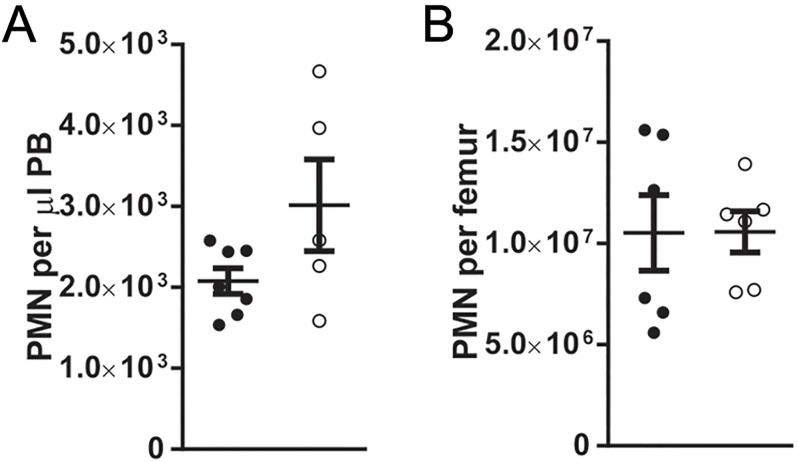
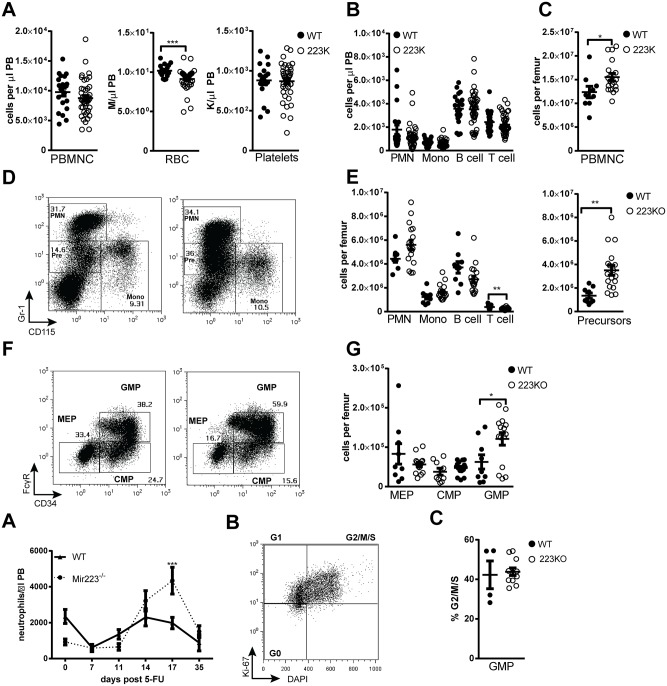
We utilized an established mouse model of constitutive Mir223 deletion to investigate the effects of miRNA-223 loss on hematopoiesis. These mice were originally characterized on a mixed strain C57BL/6 x 129Sv/Jae background and developed a myeloproliferative syndrome characterized by neutrophilia and pulmonary inflammation [6]. To eliminate the potential confounding impact of strain differences on HSC function, we analyzed mice back-crossed onto a C57BL/6 background. Peripheral blood and bone marrow counts were similar between male and female Mir223 deficient mice (Fig. 1 and data not shown); thus, data were pooled with respect to gender. Peripheral blood counts were normal except for a modest reduction in red blood cells in Mir223 deficient mice (Fig. 2A). Surprisingly, neutrophil counts were similar between Mir223 deficient and control mice (Fig. 2B). Bone marrow cellularity was modestly increased in Mir223 deficient mice (Fig. 2C). Whereas the number of mature neutrophils in the bone marrow was comparable to wild-type mice, a significant increase in Gr-1INTCD115- granulocytic precursors was observed in Mir223 deficient mice (Figs. 2D and 2E). A bimodal distribution of granulocyte-macrophage progenitors (GMPs) number in the bone marrow was observed in Mir223 deficient mice (Figs. 2F and 2G). Whereas, consistent with a prior study [6], most Mir223 deficient mice had an elevated number of GMP, in a subset it was normal. No association between gender, age, or clinical infection and GMP number was observed. Similar to young mice, no increase in neutrophils in the blood or bone marrow was observed in aged (greater than 6 month old) mice (Fig. 3). The lack of neutrophilia in our cohort contrasts with original observations of Mir223 deficient mice on a mixed genetic background. The discrepancy is most likely due to strain differences, but it also is possible that differences in the microbiome between mouse facilities may contribute. Overall, these data suggest that loss of miRNA-223 results in a subtle increase in basal granulopoiesis in mice.
Fig 1. No gender specific alterations in hematopoiesis are present in Mir223 deficient mice.
(A and B) Peripheral blood from 8–12 week old wild-type and (A) female Mir223 -/Y or (B) male Mir223 -/- mice was analyzed at 8–12 weeks of age. The absolute number of peripheral blood mononuclear cells (PBMNC), neutrophils (PMN, Gr-1HiCD115-), monocytes (Mono, Gr-1INTCD115+), B cells (B220+), and T cells (CD3e+) are shown. All data represent the mean ± SEM. *p<0.05.
Fig 2. Loss of Mir223 is associated with minimal perturbations of basal granulopoiesis.
(A) Peripheral blood from male and female wild-type and Mir223 deficient mice (223KO) was analyzed at 8–12 weeks of age. (B) Absolute number of neutrophils (PMN, Gr-1HiCD115-), monocytes (Mono, Gr-1INTCD115+), B cells (B220+), and T cells (CD3e+) in peripheral blood. (C) Bone marrow mononuclear cell count (BMMNC). (D) Representative plots showing the gating strategy to identify mature neutrophils, granulocyte precursors (Pre, Gr-1INTCD115-) and monocytes. (E) Bone marrow lineage and granulocyte precursor data. (F) Representative plots showing the gating strategy to identify megakaryocyte-erythroid progenitors (MEP, CD34-FcγR-), common myeloid progenitors (CMP, CD34+FcγR-) or granulocyte-macrophage progenitors (GMP, CD34+FcγR+); data are gated on lineage-c-kit+sca-1- cells. (G) Progenitor data.
Fig 3. Neutrophils counts are normal in aged Mir223 deficient mice.
(A and B) Wild-type and Mir223 deficient (223KO) mice at least 6 months old were analyzed for (A) peripheral blood or (B) bone marrow neutrophil counts. The absolute number of neutrophils (PMN, Gr-1HiCD115-) is shown. All data represent the mean ± SEM.
To evaluate stress granulopoiesis, neutrophil response to the myelosuppressive agent 5-FU was assessed (Fig. 4A). As expected, 5-FU induced a transient neutropenia that was followed by a rebound neutrophilia in wild-type mice. A similar degree of neutropenia was induced by 5-FU in Mir223 deficient mice. However, Mir223 deficient mice displayed exaggerated rebound neutrophil production. Since 5-FU primarily affects dividing cells, we assessed the cell cycle status of granulocyte progenitors. However, no significant difference in cycling cells was observed (Figs. 4B and 4C). Given the kinetics of the neutrophil recovery (peak 17 days after 5-FU), it is likely that the expanded pool of GMP is responsible for the exaggerated neutrophil response.
Fig 4. Loss of Mir223 is associated with an increased stress granulopoiesis response.
(A) Wild-type and Mir223 deficient mice (223KO) were treated with 150 mg/kg of 5-FU and neutrophil counts were followed for 35 days (n = 8–10 mice per cohort from two independent experiments). (B) Representative plots showing Ki-67 and DAPI staining of GMPs. Harvested on day 14 following 5-FU. (C) Shown is the percentage of GMPs in the G2/M/S phase of the cell cycle. All data represent the mean ± SEM. *p<0.05, **p<0.005, ***p<0.001.
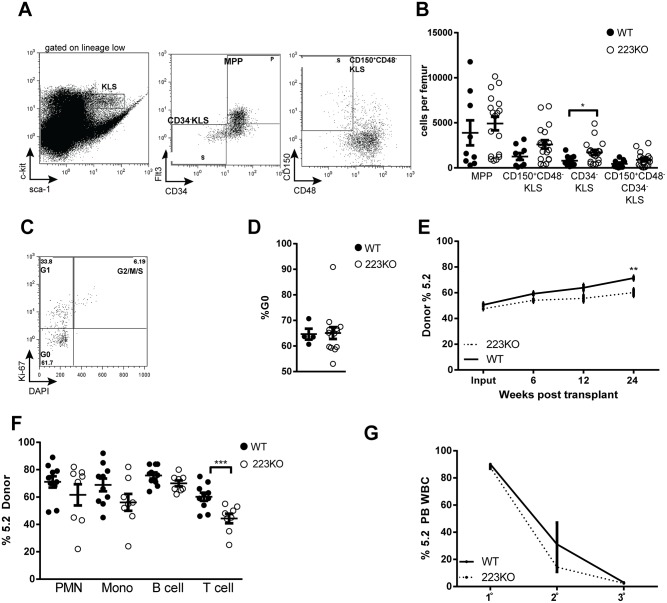
We next quantified hematopoietic progenitors in the bone marrow by flow cytometry; phenotypic HSCs were identified either as CD34- c-kit+ lineage- Sca- (KLS) cells or as CD150+CD48- KLS cells (Figs. 5A and 5B) [14]. Although there was a modest increase in CD150+ CD48- KLS cells, no difference in multipotent-progenitors (MPP), CD34- KLS cells or dormant HSCs (Flt3- CD34- CD150+ CD48- KLS cells) was observed (Fig. 5B). Moreover, the percentage of CD150+ KSL cells in the G0 phase of the cell cycle was similar to controls (Figs. 5C and 5D), suggesting that miR-223 is not required to maintain HSC quiescence. Competitive repopulation assays showed that Mir223 deficient HSCs had similar long-term repopulating activity as control HSCs (Fig. 5E). Likewise, analysis of the contribution of Mir223 deficient cells to the different lineages revealed no myeloid bias, although a modest reduction to T cells was observed (Fig. 5F). Finally, serial transplantation assays showed that self-renewal capacity is normal in Mir223 deficient HSCs (Fig. 5G). Thus, Mir223 deficient HSCs have normal long-term repopulating activity, self-renewal capacity, and quiescence, showing that miR-223 is not required for HSC maintenance.
Fig 5. Loss of Mir223 is not associated with alterations in HSC number or function.
(A) Representative plots showing the gating strategy to identify multipotent progenitors (MPP, CD34+Flt3+), CD34-KLS (CD34-Flt3-KLS), or CD150+CD48-KLS cells. (B) Progenitor data for 8–12 week old wild-type (WT) or pooled male and female Mir223 deficient mice (223KO). (C) Representative plots showing cell cycle analysis of CD150+CD48-KLS cells. (D) CD150+CD48-KLS cell cycle data. (E) Wild-type or Mir223 deficient bone marrow (Ly5.2) was mixed at a 1:1 ratio with wild-type (Ly5.1) competitor bone marrow and transplanted into irradiated recipients (Ly5.1/5.2). Shown is the percentage of Ly5.2 donor cells (n = 9–10 mice from two independent experiments). (F) Lineage distribution in the bone marrow 24 weeks after transplantation. (G) Serial transplants were performed with either Ly5.2 wild-type or Mir223 deficient donor marrow. The percentage of donor Ly5.2 cells in the blood 6–8 weeks after transplantation is shown. (n = 4–5 mice per cohort at each time point). All data represent the mean ± SEM. *p<0.05, **p<0.005, ***p<0.001.
Collectively, these data show that miR-223 loss results in a modest expansion of myeloid progenitors without significant effects on HSCs. This contrasts with the HSC exhaustion that is observed in mice with a myeloproliferative disorder caused by expression of activating mutations of JAK2 or FLT3 [15,16]. The pathways leading to myeloid expansion associated with activating mutations of tyrosine kinases genes and miR-223 loss are likely to be distinct. However, it also is possible that the severity of myeloid expansion determines whether HSCs are affected. In support of the latter possibility, mice carrying a D835Y FLT3 mutation have a less aggressive myeloproliferative phenotype compared with FLT3-ITD, and HSC loss is only seen in the FLT3-ITD mice [17]. Our data show that deletion of Mir223 is not sufficient to induce a myeloproliferative disorder in mice, suggesting that loss of this gene is likely not an initiating event in AML. MiR-223 silencing is often seen in association with specific mutations, such as AML-ETO. Whether miR-223 loss cooperates with AML-ETO or other oncogenes to induce AML will require further study.
Acknowledgments
We thank Jill Woloszynek for technical assistance and Jackie Tucker-Davis for animal care.
Data Availability
All relevant data are within the paper.
Funding Statement
This work was supported by a Translational Research Program Award from the Leukemia & Lymphoma Society (DCL) and by the National Institute of Health grants PO1-CA101937 (DCL) and T32-HL7088-37 (MCT).
References
- 1. Bartel DP (2009) MicroRNAs: target recognition and regulatory functions. Cell 136: 215–233. 10.1016/j.cell.2009.01.002 [DOI] [PMC free article] [PubMed] [Google Scholar]
- 2. Cancer Genome Atlas Research N (2013) Genomic and epigenomic landscapes of adult de novo acute myeloid leukemia. N Engl J Med 368: 2059–2074. 10.1056/NEJMoa1301689 [DOI] [PMC free article] [PubMed] [Google Scholar]
- 3. Ramsingh G, Jacoby MA, Shao J, De Jesus Pizzaro RE, Shen D, Trissal M, et al. (2013) Acquired copy number alterations of miRNA genes in acute myeloid leukemia are uncommon. Blood 122: e44–51. 10.1182/blood-2013-03-488007 [DOI] [PMC free article] [PubMed] [Google Scholar]
- 4. Fazi F, Racanicchi S, Zardo G, Starnes LM, Mancini M, Travaglini L, et al. (2007) Epigenetic silencing of the myelopoiesis regulator microRNA-223 by the AML1/ETO oncoprotein. Cancer Cell 12: 457–466. [DOI] [PubMed] [Google Scholar]
- 5. Zhou K, Yi S, Yu Z, Li Z, Wang Y, Zou D, et al. (2012) MicroRNA-223 expression is uniformly down-regulated in B cell lymphoproliferative disorders and is associated with poor survival in patients with chronic lymphocytic leukemia. Leuk Lymphoma 53: 1155–1161. 10.3109/10428194.2011.642303 [DOI] [PubMed] [Google Scholar]
- 6. Johnnidis JB, Harris MH, Wheeler RT, Stehling-Sun S, Lam MH, Kirak O, et al. (2008) Regulation of progenitor cell proliferation and granulocyte function by microRNA-223. Nature 451: 1125–1129. 10.1038/nature06607 [DOI] [PubMed] [Google Scholar]
- 7. Landgraf P, Rusu M, Sheridan R, Sewer A, Iovino N, Aravin A, et al. (2007) A mammalian microRNA expression atlas based on small RNA library sequencing. Cell 129: 1401–1414. [DOI] [PMC free article] [PubMed] [Google Scholar]
- 8. Petriv OI, Kuchenbauer F, Delaney AD, Lecault V, White A, Kent D, et al. (2010) Comprehensive microRNA expression profiling of the hematopoietic hierarchy. Proc Natl Acad Sci U S A 107: 15443–15448. 10.1073/pnas.1009320107 [DOI] [PMC free article] [PubMed] [Google Scholar]
- 9. Eppert K, Takenaka K, Lechman ER, Waldron L, Nilsson B, van Galen P, et al. (2011) Stem cell gene expression programs influence clinical outcome in human leukemia. Nat Med 17: 1086–1093. 10.1038/nm.2415 [DOI] [PubMed] [Google Scholar]
- 10. Hope KJ, Jin L, Dick JE (2004) Acute myeloid leukemia originates from a hierarchy of leukemic stem cell classes that differ in self-renewal capacity. Nat Immunol 5: 738–743. [DOI] [PubMed] [Google Scholar]
- 11. Schuettpelz LG, Gopalan PK, Giuste FO, Romine MP, van Os R, Link DC (2012) Kruppel-like factor 7 overexpression suppresses hematopoietic stem and progenitor cell function. Blood 120: 2981–2989. 10.1182/blood-2012-02-409839 [DOI] [PMC free article] [PubMed] [Google Scholar]
- 12. Richards MK, Liu F, Iwasaki H, Akashi K, Link DC (2003) Pivotal role of granulocyte colony-stimulating factor in the development of progenitors in the common myeloid pathway. Blood 102: 3562–3568. [DOI] [PubMed] [Google Scholar]
- 13. Schuettpelz LG, Borgerding JN, Christopher MJ, Gopalan PK, Romine MP, Herman AC, et al. (2014) G-CSF regulates hematopoietic stem cell activity, in part, through activation of Toll-like receptor signaling. Leukemia 28: 1851–1860. 10.1038/leu.2014.68 [DOI] [PMC free article] [PubMed] [Google Scholar]
- 14. Wilson A, Laurenti E, Oser G, van der Wath RC, Blanco-Bose W, Jaworski M, et al. (2008) Hematopoietic stem cells reversibly switch from dormancy to self-renewal during homeostasis and repair. Cell 135: 1118–1129. 10.1016/j.cell.2008.10.048 [DOI] [PubMed] [Google Scholar]
- 15. Chu SH, Heiser D, Li L, Kaplan I, Collector M, Huso D, et al. (2012) FLT3-ITD knockin impairs hematopoietic stem cell quiescence/homeostasis, leading to myeloproliferative neoplasm. Cell Stem Cell 11: 346–358. 10.1016/j.stem.2012.05.027 [DOI] [PMC free article] [PubMed] [Google Scholar]
- 16. Kent DG, Li J, Tanna H, Fink J, Kirschner K, Pask DC, et al. (2013) Self-renewal of single mouse hematopoietic stem cells is reduced by JAK2V617F without compromising progenitor cell expansion. PLoS Biol 11: e1001576 10.1371/journal.pbio.1001576 [DOI] [PMC free article] [PubMed] [Google Scholar]
- 17. Bailey E, Li L, Duffield AS, Ma HS, Huso DL, Small D (2013) FLT3/D835Y mutation knock-in mice display less aggressive disease compared with FLT3/internal tandem duplication (ITD) mice. Proc Natl Acad Sci U S A 110: 21113–21118. 10.1073/pnas.1310559110 [DOI] [PMC free article] [PubMed] [Google Scholar]
Associated Data
This section collects any data citations, data availability statements, or supplementary materials included in this article.
Data Availability Statement
All relevant data are within the paper.


