

Abstract
Background:
Central substance P receptors, termed NK-1 receptors, have been considered as therapeutic targets in the development of drugs against diverse conditions, including emesis, overactive bladder, and depression.
Methods:
Here, we applied small animal positron emission tomography (PET) and a radioligand for NK-1 receptors ([18F]FE-SPA-RQ) for measuring occupancies of these receptors by a selective antagonist (aprepitant) in order to examine the validity of this in vivo imaging system for preclinical characterization of candidate agents acting on NK-1 receptors, and as a tool for predicting optimal doses in humans.
Results:
PET in gerbils depicted high uptake in the striatum and dose-dependent displacement with increasing doses of aprepitant. Occupancies increased as a function of aprepitant plasma concentrations according to a one-site competition model, which agrees with reported occupancy-concentration relationships in clinical studies after correction for species differences in plasma protein-unbound aprepitant fractions. These occupancy data were further supported by ex vivo autoradiography of brain samples from aprepitant-treated gerbils. In a pilot study of a marmoset, we obtained more accurate determinations of NK-1 receptor occupancy, less affected by spillover of signals from extracranial tissues than in gerbil experiments.
Conclusions:
These findings support the utility of small animals and quantitative PET in the development of drugs targeting NK-1 receptors.
Keywords: NK-1 receptor, receptor occupancy, small-animal PET, substance P
Introduction
Tachykinins are a family of neuropeptides carrying C-terminal Phe-X-Gly-Leu-Met-NH2. Substance P, neurokinin A, and neurokinin B are mammalian tachykinins that bind to NK-1, NK-2, and NK-3 receptors, respectively, with high affinity. The NK-1 receptor is a seven-transmembrane G protein-coupled receptor that is widely expressed in the central nervous system (Nakanishi, 1991; Otsuka and Yoshioka, 1993). A previous assay of human brain sections documented that high-level expression of NK-1 receptors is localized in brain areas involved in the regulation of affective behaviors, including the locus coeruleus, periaqueductal gray area, caudate, putamen, nucleus accumbens, nucleus of the diagonal band, and septum (Rigby et al., 2005). It was also reported that NK-1 receptors were expressed in the areas of the postrema and nucleus tractus solitaries, which are involved in emetic reflex (McRitchie et al., 1994; Rigby et al., 2005), and immunohistochemical analyses of the monkey brain demonstrated the presence of NK-1 receptors in the substantia nigra (Lévesque et al., 2007), which is known to be involved in Parkinson’s disease. Substance P is distributed in the amygdala, hypothalamus, hippocampus, and striatum of rodent and primate brains (Hayashi, 1992; Jakab et al., 1996; Ribeiro & Hökfelt, 2000). In the striatum, substance P is primarily contained in a significant population of medium spiny neurons, which are major striatal projection neurons (Aosaki and Kawaguchi, 1996); substance P–containing medium spiny neurons are considered to receive corticostriatal inputs (Reiner et al., 2010) and to form synapses with other medium spiny neurons (Blomeley et al., 2009). This implies that substance P and NK-1 receptors modulate corticostriatal processing, which may be responsible for corticostriatal dysfunction in schizophrenia (Zandbelt et al., 2011).
The characteristic regional and cellular localizations of substance P and NK-1 receptors are indeed associated with reported pathophysiological roles of these neurotransmission components in pain (Snider and McMahon, 1998), vomiting (Sanger, 2004), inflammation (Kincy-Cain et al., 1996; Metwali et al., 2004), overactive bladder (Lecci and Maggi, 2001), depression (Kramer et al., 1998, 2004), schizophrenia (Tooney et al., 2001, 2006), Parkinson’s disease (Rioux and Joyce, 1993), and alcoholism (George et al., 2008). Thus, NK-1 receptor antagonists are of potential importance for treating these conditions. Aprepitant (EMEND®), a selective and potent brain-permeable non-peptide NK-1 receptor antagonist with an IC50 of 100 pM (Tattersall et al., 2000; Bergström et al., 2004), is used to prevent vomiting and retching induced by anticancer agents. The therapeutic efficacy of aprepitant against overactive bladder has also been reported in a clinical trial for postmenopausal women (Green et al., 2006). Although exploratory clinical studies indicated antidepressant activity of aprepitant (Kramer et al., 1998, 2004), a Phase III clinical trial failed to prove its efficacy for major depression (Keller et al., 2006).
As a non-peptide positron emission tomography (PET) ligand with brain permeability, [18F]2-fluoromethoxy-5-(5-trifluoromethyl-tetrazol-1-yl)-benzyl([2S,3S]2-phenylpiperidin-3-yl)-amine ([18F]SPA-RQ) has been used in humans to evaluate the occupancy of the NK-1 receptor by a drug in clinical studies (Bergström et al., 2004; Hietala et al., 2005; Yasuno et al., 2007). Analyses of human studies with this tracer were compromised by high uptake of radioactivity in the skull, presumably due to metabolic liberation of 18F-fluoride, which is trapped in osseous tissue (Hietala et al., 2005).
In order to minimize the problems arising from de-fluorination in vivo, a new PET ligand, [18F]fluoroethoxy-SPA-RQ ([18F]-FE-SPA-RQ), was developed for visualization of central NK-1 receptors, and its use in both non-clinical and clinical studies (Haneda et al., 2007; Okumura et al., 2008) has been reported. [18F]-FE-SPA-RQ has a higher affinity for the human-type NK-1 receptor than [18F]SPA-RQ, and it yields only low-level accumulation of radioactivity in the skull (Haneda et al., 2007). Here, we measured central NK-1 receptor occupancy by aprepitant using small animal PET with [18F]FE-SPA-RQ, based on an analytical model assuming one-site competition between aprepitant and [18F]FE-SPA-RQ. The translatability of relationships between the plasma concentration of aprepitant and its NK-1 receptor occupancy from animals to humans was then assessed by comparing the present data to reported clinical values. We employed gerbils and a common marmoset for the current assays because these animals express NK-1 receptors that are pharmacologically similar to those in humans (Fong et al., 1992; Haneda et al., 2007).
Materials and Methods
Animals
The present research protocols were approved by the Animal Ethics Committees of the National Institute of Radiological Sciences and Mitsubishi Tanabe Pharma Corporation, and were performed in accordance with the Principles of Laboratory Animal Care (NIH publication no. 85-23, revised 1985).
Male Mongolian gerbils weighing 60–85g were purchased from Japan SLC and kept in animal rooms maintained at 24°C, with a 12-h light/dark cycle and food and water ad libitum. A 6-year-old male marmoset weighing 430g was obtained from CLEA Japan and used for in vivo PET experiments.
Generation of Template Anatomical Images
Prior to PET measurements, neuroanatomical template images of the gerbil brain were generated using a high-resolution magnetic resonance imaging (MRI) system, as previously described (Haneda et al., 2007). In brief, a gerbil was anesthetized with sodium pentobarbital and scanned with a 400 mm–bore, 7-Tesla horizontal magnet (NIRS/KOBELCO; Bruker BioSpin GmbH) equipped with 120-mm diameter gradients (Bruker BioSpin). Coronal T2-weighted MR images were obtained by fast spin-echo sequences with the following imaging parameters: repetition time = 4000ms, effective echo time = 48ms, field of view = 25mm × 16mm, nominal resolution = 117 μm × 117 μm, slice thickness = 600 μm, and number of averages = 32.
An anatomical template of the marmoset brain was also previously obtained from the embedded head using a 7-Tesla MRI system (National Institute of Radiological Sciences/KOBELCO/Bruker; Haneda et al., 2007). Coronal T2-weighted MR images were obtained by fast spin-echo sequences with the following imaging parameters: repetition time = 7000ms, effective echo time = 45.8ms, field of view = 40mm × 40mm, nominal resolution = 156 μm × 208 μm, slice thickness = 1000 μm, and number of averages = 24.
Radioligand Synthesis
The NK-1 receptor antagonist FE-SPA-RQ (molecular weight = 464) was labeled with positron emitter fluorine-18 (18F). Details of the precursor compound (Merck) and radiosynthesis were described elsewhere (Hamill et al., 2003; Zhang et al., 2003). In brief, [18F]FCH2CH2Br was prepared from [18F]F- and 2-bromoethyl triflate, and was purified by distillation. Subsequently, 18F-fluoroalkylation of the deprotonated phenolic hydroxyl group in the precursor with FCH2CH2Br in dimethyl formamide was performed at 120°C for 10min. The resultant [18F]FE-SPA-RQ was purified using preparative HPLC. The final product was formulated in saline solution (10mL) containing Tween 80 (75 μL). The specific radioactivity of this radiotracer was 640±79 GBq/μmol (n = 18) at the end of synthesis.
PET Scans
A series of 6 dynamic PET scans was performed for each gerbil approximately 4h after oral pretreatment with aprepitant (prepared by Mitsubishi Tanabe Pharma Corp.) at graded doses of 0.03, 0.1, 0.3, 3, and 30mg/kg dissolved in 10% Gelucire. Individual PET scans for these gerbils (n = 6) were conducted at least 1 week apart. Complete recovery of [18F]FE-SPA-RQ binding to a baseline level was confirmed after a 1-week washout of aprepitant in our initial pilot study. PET scans of the marmoset were carried out at baseline and 3h after treatment with 20mg/kg aprepitant delivered in dimethyl sulfoxide carrier by intravenous injection to the femoral vein.
PET for the marmoset and gerbils was performed using a small animal-dedicated microPET FOCUS220 system (Siemens Medical Solutions), which yields a 25.8cm (transaxial) × 7.6cm (axial) field of view and a spatial full-width resolution of 1.3mm at half maximum in the center of the field of view (Tai et al., 2005). Anesthesia during the experiment was induced and maintained with 1.5–2% isoflurane in air (flow rate, 2mL/min). Gerbils were kept warm using a small-animal warmer/thermometer system (BWT-100; Bio Research Center).
Prior to the PET scans of the gerbils, femoral veins were cannulated for injection of [18F]FE-SPA-RQ and blood sampling. Dynamic scans were initiated at the time of a slow bolus [18F]FE-SPA-RQ injection, and continued for 360min. The injected dose of [18F]FE-SPA-RQ was 35–55 MBq. All list-mode data were sorted into 3D sinograms, which were then Fourier-rebinned into 2D sinograms (frames: 4×1, 8×2, 14×5, and 27×10min).
Prior to the PET scans of the marmoset, the cephalic vein was cannulated for radioligand injection. Dynamic scans were initiated at the time of a slow bolus [18F]FE-SPA-RQ injection, and lasted for 180min. The injected dose of [18F]FE-SPA-RQ was 90–100 MBq. All list-mode data were sorted into 3D sinograms, which were then Fourier-rebinned into 2D sinograms (frames: 4×1, 8×2, 14×5, and 9×10min).
Images were reconstructed from sonograms using 2D-filtered back projection with a 0.5-mm Hanning filter. Regions of interests (ROIs) were placed on the striatum and cerebellum on the anatomical MRI template. PET images of each animal were coregistered to the MRI template, and radioactivity in each ROI defined on the template was quantified using PMOD® software (PMOD Group).
In Vivo Quantification of [18F]FE-SPA-RQ Binding and NK-1 Receptor Occupancy by Aprepitant
Specific binding of [18F]FE-SPA-RQ was determined by estimating binding potential relative to nondisplaceable uptake (BPND) using a simplified reference tissue model (SRTM; Lammertsma et al., 1996) with PMOD® software (PMOD Group). We used the cerebellum as the reference brain region because of its negligible NK-1 receptor density. Assuming that target and reference regions have the same levels of nondisplaceable binding, SRTM describes time–activity data in the target region as follows:
where R1 is the ratio of K1/K1′ (K1, influx rate constant for the target region; K1′, influx rate constant for the reference region), CR(t) is the radioactivity concentration in the reference region, and ⊗ denotes the convolution integral. Using this method, 3 parameters (R1, k2, and BPND) were estimated by the use of a nonlinear curve-fitting procedure. Scan data of 60, 120, 180, 240, 300, and 360min were used.
NK-1 receptor occupancy (Occ) by aprepitant in each gerbil was determined according to the following equation:
where BPND,untreated and BPND,drug are BPND values obtained by PET at baseline and after aprepitant administration, respectively.
In the marmoset, full occupancy of NK-1 receptors by 20mg/kg of aprepitant was examined on the basis of radioligand retention at the end of PET as follows:
where IDuntreated and IDdrug are specific radioligand bindings in the striatum 180min after [18F]FE-SPA-RQ administration at baseline and after aprepitant administration, respectively. Specific radioligand bindings were calculated by subtracting cerebellar radioactivity from striatal radioactivity and were expressed as a percentage of the injected radioligand dose per unit tissue volume (%dose/mL).
Ex Vivo Autoradiographic Measurement of NK-1 Receptor Occupancies
A group of gerbils distinct from those used for in vivo PET were prepared for ex vivo autoradiographic estimation of NK-1 receptor occupancies. After oral treatment with 3 different doses (0.3, 3, and 30mg/kg) of aprepitant in 10% Gelucire solution, gerbils were sacrificed at various time points (0.5, 1, 2, 4, 8, and 24h) by collecting whole blood from the postcaval vein under ether anesthesia. Each brain was rapidly removed, frozen with powdered dry ice, and sliced into 20-µm sections at −20°C using an HM560 cryostat microtome (Carl Zeiss). Sections were stored at −80°C until analysis. Autoradiography with [18F]FE-SPA-RQ was conducted as described elsewhere (Haneda et al., 2007) except that we used 10 µM aprepitant instead of 1 µM SDZ NKT343 to abolish specific radioligand binding. Signal intensities in an ROI on the striatum were calculated using Multi Gauge software (Fuji Film), and specific radioligand binding was determined as the difference between signal intensities in the absence and presence of 10 µM aprepitant. NK-1 receptor occupancy by aprepitant was estimated according to the following equation:
where RDdrug and RDuntreated are specific binding levels expressed as photo-stimulated luminescence per unit area (PSL/mm2) in samples from gerbils treated with aprepitant and vehicle, respectively.
Analysis of Plasma Aprepitant Concentrations and their Correlation with NK-1 Receptor Occupancy
Acetonitrile was added to 50 μL of plasma samples from gerbils to remove proteins. In the in vivo PET study, plasma samples were collected just after the injection of [18F]FE-SPA-RQ. In the ex vivo autoradiographic analyses, plasma aprepitant concentrations were determined using solid phase extraction by OASIS HLB (Waters) as an additional pretreatment analysis. The purified sample was then injected into a liquid chromatography–tandem mass spectrometry (LC/MS/MS) system. HPLC analysis was performed on an Xbridge C18 column (3.5 µm, 2.1×50mm, Waters) at 40°C. The mobile phase comprised acetonitrile/water/formic acid (50/50/0.1, v/v/v), and was used at a flow rate of 0.5mL/min. Eluted aprepitant was ionized using an electrospray interface and detected by multiple reaction monitoring of the transitions from 535 to 277. Samples from ex vivo autoradiographic studies were applied to an LC/MS/MS system comprising an LC-20AD pump (Shimadzu) controlled by an SCL-10Avp system controller (Shimadzu) and an API-4000 mass spectrometer (Applied Biosystems/MDS SCIEX). Plasma samples from the in vivo PET experiments were processed using Agilent 1100 (Agilent) and 4000QTRAP (Applied Biosystems/MDS SCIEX) systems.
The relationship between receptor occupancy and plasma drug concentrations at equilibrium between free drug compartments in the brain and plasma can be described using the following equation:
where Occmax and Cp are the maximal receptor occupancy and plasma drug concentrations, respectively, and EC50 is the plasma drug concentration required for 50% Occmax.
Plasma protein binding
Fractions of protein-bound aprepitant in human and gerbil plasma collected immediately after the injection of radioligand were measured by ultracentrifugation. Three hundred microliters of plasma samples were spiked into a standard solution containing 10 µg/mL aprepitant, with the final concentration then adjusted to 0.1 µg/mL at 4°C. Plasma samples were transferred in micro-tubes and centrifuged at 50 000rpm at 4°C for 4h. Plasma proteins were removed by adding 100 µL of acetonitrile to 10 and 20 µL of samples before ultracentrifugation to measure the total concentration of aprepitant. These samples were centrifuged at 13 000rpm for 3min at 4°C. To determine plasma aprepitant concentrations before and after ultracentrifugation, the supernatant was injected into the LC/MS/MS system and then assayed as described above. Plasma protein binding of aprepitant was calculated as follows:
where Cp and Cu were the plasma aprepitant concentration before and after ultracentrifugation, respectively.
Results
[18F]FE-SPA-RQ-PET of Gerbil Striatal NK-1 Receptor Occupancy by Aprepitant
Dynamic PET experiments of gerbils were conducted for 6h after intravenous injection of [18F]FE-SPA-RQ to ensure achievement of a pseudo-equilibrium state of radioligand binding within this imaging time. In agreement with our previous study (Haneda et al., 2007), the highest and lowest radioligand retention was observed in the striatum and cerebellum, respectively, of gerbil brains, reflecting the distribution of central NK-1 receptors (Figure 1). Pretreatment of gerbils with aprepitant 4h before initiation of PET attenuated striatal radioligand binding in a dose-dependent manner, whereas radioligand uptake and retention in the cerebellum remained unaltered (Figures 1 and 2). Marked nonspecific radioligand accumulation in Harderian glands (data not shown) resulted in the spillover of radioactivity into neighboring tissues, including the rostral striatum, irrespective of aprepitant pretreatment. Accordingly, striatal radioactivity even remained slightly higher than cerebellar radioactivity after treatment with excessive aprepitant (30mg/kg; Figure 2F). Correspondingly, BPND of [18F]FE-SPA-RQ in the striatum of gerbils treated with 30mg/kg aprepitant was estimated as 0.27 using the cerebellum as reference (Table 1). Moreover, due to spillover of radioactivity from the Harderian glands, apparent maximal NK-1 receptor occupancy did not reach 100%. We then conducted a time-stability analysis of specific radioligand binding by assessing the effects of progressive truncation of PET data on the estimated BPND values (Figure 3A and B), and found that a 120min scan could be sufficient for stable estimation of the outcome measures. In addition, BPND values calculated by SRTM analysis of dynamic data at 0–120min were well correlated with those determined with the striatum-to-cerebellum ratio of radioactivity at 120min (Figure 3C).
Figure 1.
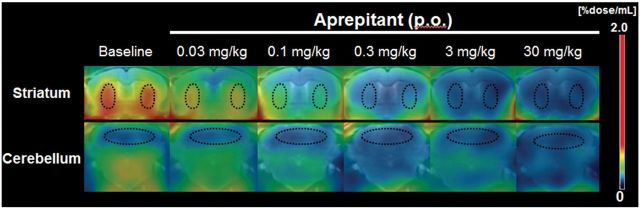
Representative coronal PET images showing [18F]FE-SPA-RQ distribution in gerbil brains at baseline and after oral administration (per os; p. o.) of aprepitant. PET data were generated by summation of dynamic data at 0–6h after intravenous radioligand injection, and were merged onto the MRI template. ROIs (outlined by dots) were placed on the striatum (upper row) and cerebellum (lower row).
Figure 2.

Time–radioactivity curves for [18F]FE-SPA-RQ in the gerbil striatum (closed squares) and cerebellum (open rhomboids) at baseline (A) and after pretreatments with aprepitant at doses of 0.03mg/kg (B), 0.1mg/kg (C), 0.3mg/kg (D), 3mg/kg (E), and 30mg/kg (F). Data were generated by defining ROIs on the PET images displayed in Figure 1. Radioligand uptake into each region was expressed as a percentage of injected dose per unit tissue volume (%dose/mL). Bars indicate standard errors of mean (n = 6 in each treatment group).
Table 1.
BPND of [18F]FE-SPA-RQ, Striatal NK-1 Receptor Occupancy, and Plasma Aprepitant Concentrations in Gerbils After oral Aprepitant Administration
| Parameter | Dose of aprepitant | vehicle | 0.03mg/kg | 0.1mg/kg | 0.3mg/kg | 3mg/kg | 30mg/kg |
|---|---|---|---|---|---|---|---|
| (n = 6) | (n = 6) | (n = 5) | (n = 6) | (n = 6) | (n = 4) | ||
| BPND | 1.70±0.09 | 1.50±0.18 | 0.68±0.08 | 0.44±0.10 | 0.37±0.08 | 0.27±0.06 | |
| Occupancy (%) | - | 11.1±11.1 | 59.7±5.6 | 74.9±5.7 | 78.1±5.1 | 85.0±2.8 | |
| Aprepitant concentration (ng/mL) | - | 2.6±0.2 | 7.4±0.8 | 26.2±3.5 | 274.7±10.3 | 3535.6±707.1 | |
Data are expressed as mean ± standard error of the mean.
Figure 3.
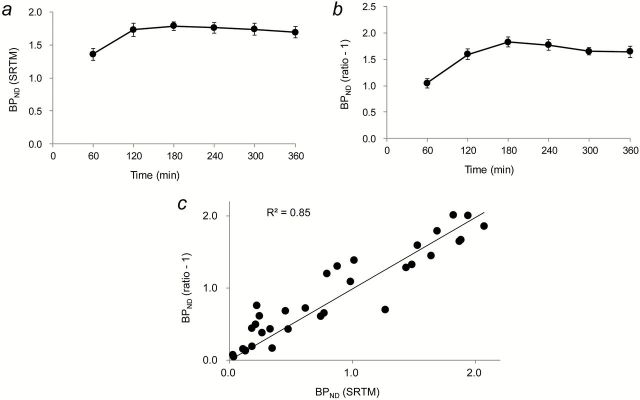
PET quantification of radioligand binding in the gerbil striatum. Time stability of [18F]FE-SPA-RQ binding potential values obtained by SRTM (BPND; A) and on the basis of the target-to-reference ratio of radioactivity (B). Baseline data without pretreatments were used for calculations. In panel B, regional radioactivity was quantified by averaging 15min dynamic data, and binding potential was determined as (striatum-to-cerebellum ratio) – 1. (C) Scatterplot demonstrating the relationship between BPND values determined by SRTM analysis of data at 0–120min and the target-to-reference ratio of radioactivity at 120 (112.5–127.5) min. Parameters were calculated using data at baseline and after pretreatment with aprepitant at doses of 0.03, 0.1, 0.3, 3, and 30mg/kg. The solid line indicates regression (y = 0.99x).
Relationship Between Central NK-1 Receptor Occupancy and Plasma Aprepitant Concentration
Concentrations of aprepitant in plasma at the initiation of PET scans were positively correlated with striatal NK-1 receptor occupancy by this drug in gerbils (Figure 4 and Table 1). A direct-model fit to experimental data well described the relationship between receptor occupancy and plasma aprepitant concentration (Figure 4). Maximal receptor occupancy was 85%, and the plasma aprepitant concentrations required for 50%, 90%, and 95% of maximal occupancy (EC50, EC90, and EC95) were 5.5, 50, and 105ng/mL, respectively.
Figure 4.

Relationship between plasma aprepitant concentration and NK-1 receptor occupancy by apretitant in the gerbil striatum calculated using [18F]FE-SPA-RQ-PET data. The regression curve was generated using the following equation: receptor occupancy = maximal receptor occupancy × Cp/[Cp + EC50]. The dot-dashed line represents the maximal receptor occupancy (85%), and the horizontal and vertical dashed lines denote the half-maximal occupancy (42.5%) and EC50 (5.5ng/mL). respectively.
We noted a large variability of estimates of NK-1 receptor occupancies below 10%, and a slightly excess in the number of data sets around the plateau of the occupancy. However, maximal receptor occupancy and EC50 were 85.3% and 3.8ng/mL, respectively, when data points below the x-axis and beyond 1 000ng/mL of plasma aprepitant concentration were excluded from the curve fit, and these values were not profoundly different from the original results.
NK-1 Receptor Occupancy by Aprepitant Quantified by Ex Vivo Autoradiography
To examine the validity of in vivo PET measurements of central NK-1 receptor occupancies, brain samples were collected from gerbils at time points ranging from 0.5 to 24h after treatment with aprepitant at 3 different doses. Then, autoradiography was performed by reacting [18F]FE-SPA-RQ with coronal sections of these brains. Similar to the PET images, autoradiograms demonstrated intense radiolabeling of the striatum, which was completely abolished by the addition of 10 μM aprepitant to the solution (Figure 5A). Based on data from ex vivo autoradiograms after treatment with 0.3mg/kg aprepitant (top row in Figure 5A), the temporal changes in receptor occupancy (Figure 5B and Table 2) indicated the establishment of an equilibrium between unbound aprepitant plasma and brain compartments within 4h, justifying the initiation of PET assays at 4h. In a scatterplot of receptor occupancy by aprepitant and its plasma concentration, data from samples collected 0.5 and 1h after treatment with 0.3mg/kg aprepitant could not be described by a direct pharmacokinetic-pharmacodynamic link, presumably due to incomplete equilibrium between plasma and brain compartments for free drugs at these time points (Figure 5B). By excluding these data from the model fit, EC90 and EC95 values were estimated to be 16 and 34ng/mL, respectively.
Figure 5.

Ev vivo analysis of NK-1 receptor occupancy by aprepitant in the gerbil striatum at different time points after oral administration. (A) Representative autoradiograms showing binding of [18F]FE-SPA-RQ to coronal sections of gerbil brains containing the striatum at 0.5, 1, 2, 4, 8, and 24h (left to right) after aprepitant administration at doses of 0.3, 3, and 30mg/kg (top to bottom). Radiolabeling of sections from untreated gerbils without (control) and with 10 µM aprepitant (non-specific binding) are displayed in the far right panel. (B) Striatal NK-1 receptor occupancy by aprepitant plotted against plasma concentrations of aprepitant in gerbils. The regression curve was generated as in the PET assays, and outlier data (indicated by circles), presumably in a non-equilibrium state, were excluded from the model fit.
Table 2.
Striatal NK-1 receptor occupancy by aprepitant and plasma aprepitant concentrations in gerbils after oral aprepitant administration
| Parameter | Dose | Time after administration | |||||
|---|---|---|---|---|---|---|---|
| 0. 5 h | 1 h | 2 h | 4 h | 8 h | 24 h | ||
| (n = 3) | (n = 3) | (n = 3) | (n = 3) | (n = 3) | (n = 5) | ||
| Occupancy (%) | 0.3mg/kg | -4.54±3.10 | 48.8±8.60 | 91.4±1.20 | 95.2±0.72 | 93.0±0.34 | 67.5±3.31 |
| 3mg/kg | 90.6±0.84 | 98.7±0.21 | 99.3±0.32 | 99.0±0.71 | 99.2±0.26 | 93.5±1.19 | |
| 30mg/kg | 99.6±0.08 | 99.1±0.20 | 99.3±0.52 | 99.2±0.44 | 98.9±0.29 | 98.6±0.33 | |
| Plasma Concentration (ng/mL) | 0.3mg/kg | 28.5±5.0 | 72.6±11.9 | 75.6±8.3 | 61.4±10.2 | 37.3±7.6 | 4.0±0.4 |
| 3mg/kg | 205.7±23.1 | 453.4±18.4 | 569.6±7.9 | 649.8±140.1 | 476.1±69.5 | 40.5±5.7 | |
| 30mg/kg | 2070.7±67.9 | 4438.0±441.9 | 6883.4±702.4 | 4949.7±409.7 | 4061.7±392.7 | 209.5±40.4 | |
Data are expressed as mean ± SE.
In Vivo PET of NK-1 Receptor Occupancy in a Marmoset
PET imaging of NK-1 receptors in the marmoset brain was conducted with [18F]FE-SPA-RQ to eliminate the influence of spillover radioactivity from extracranial tissues on the quantification of striatal receptor occupancies. The highest and lowest retention of [18F]FE-SPA-RQ in the brain was observed in the striatum and cerebellum, respectively, as in the gerbil PET analyses (Figure 6A). Unlike the data from gerbils, pretreatment with 20mg/kg aprepitant decreased striatal radioactivity to a level nearly equivalent to that of the cerebellum, despite increased initial radioligand uptake into all regions (Figure 6A and B). Using radioligand retention at 180min after injection as a quantitative index, receptor occupancy by aprepitant in the striatum was estimated to be 102.5%, indicating that complete receptor occupancy can be demonstrated by marmoset PET. In the marmoset, a pseudo-equilibrium state of specific radioligand binding was not observed in dynamic PET scans over 180min, implying that a longer PET measurement would be required to determine pharmacokinetic-pharmacodynamic relationships.
Figure 6.

In vivo distribution of [18F]FE-SPA-RQ in the marmoset brain. (A) Coronal PET images containing the caudate/putamen (left) and cerebellum (right) at baseline (top) and after oral aprepitant administration at a dose of 20mg/kg (bottom). PET images were generated by averaging dynamic data from 0–180min after intravenous radioligand injection and overlaid on the MRI template. ROIs were placed on the caudate (arrows), putamen (arrowheads), and cerebellum (cyan lines). (B) Time–activity curves for [18F]FE-SPA-RQ in the caudate/putamen (red symbols) and cerebellum (black symbols) of the marmoset at baseline (closed symbols) and after aprepitant administration (open symbols). Radioligand uptake into each region was expressed as a percentage of the injected dose per unit tissue volume (%dose/mL).
Plasma Protein Binding of Aprepitant
Protein binding of 0.1 μg/mL aprepitant in human and gerbil plasma was measured by ultracentrifugation. Both human and gerbil plasma samples displayed a high degree of protein binding: 99.64% and 99.30%, respectively. Accordingly, unbound aprepitant fractions in human and gerbil plasma were 0.36% and 0.70%, differing by approximately 2 fold.
Discussion
The present study demonstrated the validity of [18F]FE-SPA-RQ-PET in small animals for estimating the pharmacodynamics measures of central NK-1 receptor occupancy by aprepitant and their relationships to its plasma pharmacokinetics.
Due to the relatively slow kinetics of [18F]FE-SPA-RQ, we performed dynamic PET data acquisition in gerbils over 360min after radioligand injection, but our time-stability analyses also indicated that the duration for a dynamic scan could be shortened to 120min (Figure 3A). Quantification of specific radioligand binding could be made even shorter by conducting a 15min static PET scan at 120min after radioligand injection (Figure 3B and C), resulting in an increase of analytical throughput. By serially scanning gerbils with this method and by placing two animals on the stage of a PET scanner, data would be obtainable from 10 gerbils or more after a single radiosynthesis.
PET results in gerbils also suggested caution regarding the measurement of striatal NK-1 receptor occupancies, as the retention of [18F]FE-SPA-RQ was not reduced to a level equivalent to the cerebellum even with an excessive dose of aprepitant. This is attributable to the strong accumulation of [18F]FE-SPA-RQ in the Harderian glands and the consequent spillover of radioactivity to the anterior striatum. Such spillover is also likely to hamper precise determination of receptor occupancies induced by low-concentration aprepitant (Figure 4), although inclusion and exclusion of these data sets did not critically affect the result of the curve fit. Despite these technical issues, a fairly reasonable EC50 value (5.5ng/mL) was obtained by assuming that aprepitant occupied 50% of total NK-1 receptors when reduction of specific radioligand binding was 50% of the maximal blockade. Indeed, EC50 of aprepitant in humans was approximately 10ng/mL (Bergström et al., 2004). The proportion of protein-bound aprepitant in plasma is relatively high, and fractions of protein-unbound aprepitant in gerbil and human plasma were 0.36% and 0.7%, respectively. The EC50 value in gerbils, corrected for this species difference in protein binding, is 10.5ng/mL, and is in good agreement with the actual measure in humans.
It was reported that 90% and 95% occupancies of striatal NK-1 receptors by aprepitant were required for therapeutic efficacies in treatments of vomiting and overactive bladder, respectively (Bergström et al., 2004; Green et al., 2006). In a manner similar to EC50 determination, EC90 and EC95 in the striatum of gerbils were estimated to be 50 and 105ng/mL, respectively. These values could be translated to be 94 and 199ng/mL after correction for the species difference in plasma protein binding of aprepitant, which were comparable to EC90 (~100ng/mL) and EC95 (~190ng/mL), as reported elsewhere (Bergström et al., 2004), supporting the feasibility of using gerbil PET data for acquiring preliminary indices toward prediction of clinically-optimal doses of aprepitant.
To circumvent the interference in brain quantitation due to spillover from Harderian glands, we conducted ex vivo studies using brain slices obtained from aprepitant-treated gerbils. In contrast to in vivo PET, ex vivo autoradiography indicated nearly 100% receptor occupancy by high-dose aprepitant. Our data also showed that NK-1 receptor occupancy by aprepitant was rather stationary at 4–8h after oral administration, justifying PET assays initiated at 4h. Meanwhile, receptor occupancies at 0.5 and 1h after administration of low-dose (0.3mg/kg) aprepitant could not be described by a direct model linking pharmacokinetic and pharmacodynamic parameters, presumably due to the lack of a pseudo-equilibrium between plasma and brain compartments. EC90 and EC95, calculated by applying Hill’s plot to the observed data after eliminating these outliers, were 16 and 34ng/mL, respectively. These values were comparable to, but slightly smaller than the in vivo PET estimates. This small discrepancy might arise from inclusion of ex vivo data at 24h, which may not follow a pseudo-equilibrium model. In fact, dissociation between brain and plasma aprepitant concentrations was documented previously (Lindström et al., 2007), implying a notable hysteresis in the relationship between plasma pharmacokinetics and brain pharmacodynamics. Hence, ex vivo EC90 and EC95 values would become even closer to the in vivo measures by adding data in a pseudo-equilibrium state (e.g., samples at 4–8h after administration of aprepitant at doses <0.3mg/kg).
A full blockade of specific radioligand binding in the striatum, without critical influences of extracranial radioactive signals, was demonstrated by a PET scan of a common marmoset treated with high-dose aprepitant, providing additional proof of the effects of radioactive spillover from the Harderian glands in gerbils. Dynamic PET data in the marmoset also suggested that a steady state of radioligand binding could not be pursued by PET imaging over 180min. Indeed, BPND values were not time-stable in this scanning method (data not shown). Therefore, PET analyses over a long period would be needed to determine the minimal dynamic imaging time for quantifying binding potentials and to seek an appropriate time frame for a simplified, ratio-based estimation of radioligand binding. This would eventually allow a static PET scan protocol for marmosets with a reasonably high throughput.
A practical strategy for the characterization of aprepitant using small-animal PET can be proposed on the basis of the current findings. [18F]FE-SPA-RQ-PET scans in gerbils could be carried out at multiple time points after treatment with aprepitant at different doses to efficiently outline the pharmacodynamics profiles of aprepitant in the brain and their relationship to its plasma pharmacokinetics. PET imaging of marmosets with [18F]FE-SPA-RQ could subsequently be conducted at selected time points suitable for a direct model fit to more precisely determine links between the pharmacokinetics and pharmacodynamics of aprepitant in a pseudo-equilibrium state. This workflow would also enable the characterization of new drug candidates that act on central NK-1 receptors, and would possibly facilitate a prediction of its effective plasma concentration in humans. While slow kinetics of aprepitant in the brain could be captured with [18F]SPA-RQ and [18F]FE-SPA-RQ, which also exhibit relatively slow kinetics (Hietala et al., 2005; Okumura et al., 2008), new PET ligands with rapid dissociation from binding sites and clearance from the brain would be required for evaluations of novel NK-1 receptor antagonists with faster kinetics.
Statement of Interest
The authors declare no competing financial interests.
Acknowledgments
The authors are grateful to Hiroshi Mizuuchi, Yukiko Shoji, Toru Watanabe, Masaki Yamada, and Masami Takahashi for their support of the analyses in this study. We also thank Takeharu Minamihisamatsu and the staff of the Molecular Probe Program for technical assistance and production of radioisotopes.
References
- Aosaki T, Kawaguchi (1996). Actions of substance P on rat neostriatal neurons in vitro. J Neurosci 16:5141–5153. [DOI] [PMC free article] [PubMed] [Google Scholar]
- Bergstrom M, Hargreaves RJ, Burns HD, Goldberg MR, Sciberras D, Reines SA, Petty KJ, Ogren M, Antoni G, Langstrom B, Eskola O, Scheinin M, Solin O, Majumdar AK, Constanzer ML, Battisti WP, Bradstreet TE, Gargano C, Hietala J. (2004). Human positron emission tomography studies of brain neurokinin 1 receptor occupancy by aprepitant. Biol Psychiatry 55:1007–1012. [DOI] [PubMed] [Google Scholar]
- Blomeley CP, Kehoe LA, Bracci E. (2009). Substance P mediates excitatory interactions between striatal projection neurons. J Neurosci 29:4953–4963. [DOI] [PMC free article] [PubMed] [Google Scholar]
- Fong TM, Yu H, Strader CD. (1992). Molecular basis for the species selectivity of the neurokinin-1 receptor antagonists CP-96,345 and RP67580. J Biol Chem 267:25668–25671. [PubMed] [Google Scholar]
- George DT, Gilman J, Hersh J, Thorsell A, Herion D, Geyer C, Peng X, Kielbasa W, Rawlings R, Brandt JE, Gehlert DR, Tauscher JT, Hunt SP, Hommer D, Heilig M. (2008). Neurokinin 1 receptor antagonism as a possible therapy for alcoholism. Science 319:1536–1539. [DOI] [PubMed] [Google Scholar]
- Green SA, Alon A, Ianus J, McNaughton KS, Tozzi CA, Reiss TF. (2006). Efficacy and safety of a neurokinin-1 receptor antagonist in postmenopausal women with overactive bladder with urge urinary incontinence. J Urol 176:2535–2540. [DOI] [PubMed] [Google Scholar]
- Hamill T, Ryan C, Krause S, Eng W, Sanabria S, Francis B, Hargreaves R, Burns D. (2003). The synthesis and in vivo characterization of [18F] FESPARQ, a neurokinin-1 (NK1) receptor PET ligand. J Labelled Comp Radiopharm 46:S35–S35. [Google Scholar]
- Haneda E, Higuchi M, Maeda J, Inaji M, Okauchi T, Ando K, Obayashi S, Nagai Y, Narazaki M, Ikehira H. (2007). In vivo mapping of substance P receptors in brains of laboratory animals by high‐resolution imaging systems. Synapse 61:205–215. [DOI] [PubMed] [Google Scholar]
- Hayashi M. (1992). Ontogeny of some neuropeptides in the primate brain. Prog Neurobiol 38:231–260. [DOI] [PubMed] [Google Scholar]
- Hietala J, Nyman M, Eskola O, Laakso A, Grönroos T, Oikonen V, Bergman J, Haaparanta M, Forsback S, Marjamäki P, Lehikoinen P, Goldberg M, Burns D, Hamill T, Eng W-S, Coimbra A, Hargreaves R, Solin O. (2005). Visualization and quantification of neurokinin-1 (NK1) receptors in the human brain. Mol Imaging Biol 7:262–272. [DOI] [PubMed] [Google Scholar]
- Jakab RL, Hazrati LN, Goldman RP. (1996). Distribution and neurochemical character of substance P receptor (SPR)-immunoreactive striatal neurons of the macaque monkey: accumlation of SP fibers and SPR neurons and dendrites in ‘striocapsules’ encircling striosomes. J Comp Neurol 411:137–149. [DOI] [PubMed] [Google Scholar]
- Keller M, Montgomery S, Ball W, Morrison M, Snavely D, Liu G, Hargreaves R, Hietala J, Lines C, Beebe K, Reines S. (2006). Lack of efficacy of the substance p (neurokinin1 receptor) antagonist aprepitant in the treatment of major depressive disorder. Biol Psychiatry 59:216–223. [DOI] [PubMed] [Google Scholar]
- Kincy-Cain T, Bost KL. (1996). Increased susceptibility of mice to Salmonella infection following in vivo treatment with the substance P antagonist, spantide II. J Immunol 157:255–264. [PubMed] [Google Scholar]
- Kramer MS, Winokur A, Kelsey J, Preskorn SH, Rothschild AJ, Snavely D, Ghosh K, Ball WA, Reines SA, Munjack D, Apter JT, Cunningham L, Kling M, Bari M, Getson A, Lee Y. (2004). Demonstration of the efficacy and safety of a novel substance P (NK1) receptor antagonist in major depression. Neuropsychopharmacology 29:385–392 [DOI] [PubMed] [Google Scholar]
- Kramer MS, et al. (1998). Distinct mechanism for antidepressant activity by blockade of central substance P receptors. Science 281:1640–1645. [DOI] [PubMed] [Google Scholar]
- Lammertsma AA, Bench CJ, Hume SP, Osman S, Gunn K, Brooks DJ, Frackowiak RS. (1996). Comparison of methods for analysis of clinical [11C]raclopride studies. J Cereb Blood Flow Metab 16:42–52. [DOI] [PubMed] [Google Scholar]
- Lecci A, Maggi CA. (2001). Tachykinins as modulators of the micturition reflex in the central and peripheral nervous system. Regul Pept 101:1–18. [DOI] [PubMed] [Google Scholar]
- Lévesque M1, Wallman MJ, Parent R, Sík A, Parent A. (2007). Neurokinin-1 and neurokinin-3 receptors in primate substantia nigra. Neurosci Res 57:362–371. [DOI] [PubMed] [Google Scholar]
- Lindstrom E, von Mentzer B, Pahlman I, Ahlstedt I, Uvebrant A, Kristensson E, Martinsson R, Noven A, de Verdier J, Vauquelin G. (2007). Neurokinin 1 receptor antagonists: correlation between in vitro receptor interaction and in vivo efficacy. J Pharm Exp Ther 322:1286–1293. [DOI] [PubMed] [Google Scholar]
- McRitchie DA, Törk I. (1994). Distribution of substance P-like immunoreactive neurons and terminals throughout the nucleus of the solitary tract in the human brainstem. J Comp Neurol 343:83–101. [DOI] [PubMed] [Google Scholar]
- Metwali A, Blum AM, Elliott DE, Setiawan T, Weinstock JV. (2004). Cutting edge: hemokinin has substance P-like function and expression in inflammation. J Immunol 172:6528–6532. [DOI] [PubMed] [Google Scholar]
- Nakanishi S. (1991). Mammalian tachykinin receptors. Annu Rev Neurosci 14:123–136. [DOI] [PubMed] [Google Scholar]
- Okumura M, Arakawa R, Ito H, Seki C, Takahashi H, Takano H, Haneda E, Nakao R, Suzuki H, Suzuki K, Okubo Y, Suhara T. (2008). Quantitative analysis of NK1 receptor in the human brain using PET with 18F-FE-SPA-RQ. J Nucl Med 49:1749–1755. [DOI] [PubMed] [Google Scholar]
- Otsuka M, Yoshioka K. (1993). Neurotransmitter functions of mammalian tachykinins. Physiol Rev 73:229–308. [DOI] [PubMed] [Google Scholar]
- Reiner A, Hart NM, Lei W, Deng Y. (2010). Corticostriatal projection neurons - dichotomous types and dichotomous functions. Front Neuroanat 4:142. [DOI] [PMC free article] [PubMed] [Google Scholar]
- Ribeiro DS, Hökfelt T. (2000). Neuroanatomical localisation of Substance P in the CNS and sensory neurons. Neuropeptides 34:256–271. [DOI] [PubMed] [Google Scholar]
- Rigby M, O’Donnell R, Rupniak NMJ. (2005). Species differences in tachykinin receptor distribution: further evidence that the substance P (NK1) receptor predominates in human brain. J Comp Neurol 490:335–353. [DOI] [PubMed] [Google Scholar]
- Rioux L, Joyce JN. (1993). Substance P receptors are differentially affected in Parkinson’s and Alzheimer’s disease. J Neural Transm Park Dis Dement Sect 6:199–210. [DOI] [PubMed] [Google Scholar]
- Sanger GJ. (2004). Neurokinin NK1 and NK3 receptors as targets for drugs to treat gastrointestinal motility disorders and pain. Br J Pharmacol 141:1303–1312. [DOI] [PMC free article] [PubMed] [Google Scholar]
- Snider WD, McMahon SB. (1998). Tackling pain at the source: new ideas about nociceptors. Neuron 20:629–632. [DOI] [PubMed] [Google Scholar]
- Tai YC, Ruangma A, Rowland D, Siegel S, Newport DF, Chow PL, Laforest R. (2005). Performance evaluation of the microPET focus: a third-generation microPET scanner dedicated to animal imaging. J Nucl Med 46:455–463. [PubMed] [Google Scholar]
- Tattersall FD, Rycroft W, Cumberbatch M, Mason G, Tye S, Williamson DJ, Hale JJ, Mills SG, Finke PE, MacCoss M, Sadowski S, Ber E, Cascieri M, Hill RG, MacIntyre DE, Hargreaves RJ. (2000). The novel NK1 receptor antagonist MK-0869 (L-754,030) and its water soluble phosphoryl prodrug, L-758,298, inhibit acute and delayed cisplatin-induced emesis in ferrets. Neuropharmacology 39:652–663. [DOI] [PubMed] [Google Scholar]
- Tooney P, Crawter V, Chahl L. (2001). Increased tachykinin NK1 receptor immunoreactivity in the prefrontal cortex in schizophrenia. Biol Psychiatry 49:523–527. [DOI] [PubMed] [Google Scholar]
- Tooney P, Weidenhofer J, Yip J, Zavitsanou K, Huang XF, Chahl LA. (2006). Immunohistochemical localisation of the NK1 receptor in the human amygdala: preliminary investigation in schizophrenia. Prog Neuropsychopharmacol Biol Psychiatry 30:1313–1321. [DOI] [PubMed] [Google Scholar]
- Yasuno F, Sanabria SM, Burns D, Hargreaves RJ, Ghose S, Ichise M, Chin FT, Morse CL, Pike VW, Innis RB. (2007). PET imaging of neurokinin-1 receptors with [(18F]SPA-RQ in human subjects: assessment of reference tissue models and their test-retest reproducibility. Synapse 61:242–251. [DOI] [PMC free article] [PubMed] [Google Scholar]
- Zandbelt BB, van Buuren M, Kahn RS, Vink M. (2011). Reduced proactive inhibition in schizophrenia is related to corticostriatal dysfunction and poor working memory. Biol Psychiatry 70:1151–1158. [DOI] [PubMed] [Google Scholar]
- Zhang MR, Maeda J, Furutsuka K, Yoshida Y, Ogawa M, Suhara T, Suzuki K. (2003). [18F]FMDAA1106 and [18F]FEDAA1106: two positron-emitter labeled ligands for peripheral benzodiazepine receptor (PBR). Bioorg Med Chem Lett 13:201–204. [DOI] [PubMed] [Google Scholar]