

Abstract
White matter (WM) involvement in chronic fatigue syndrome (CFS) was assessed using voxel-based regressions of brain MRI against CFS severity scores and CFS duration in 25 subjects with CFS and 25 normal controls (NCs). As well as voxel-based morphometry, a novel voxel-based quantitative analysis of T1- and T2-weighted spin-echo (T1w and T2w) MRI signal level was performed. Severity scores included the Bell CFS disability scale and scores based on the 10 most common CFS symptoms. Hospital Anxiety and Depression Scale (HADS) depression and anxiety scores were included as nuisance covariates. By relaxing the threshold for cluster formation, we showed that the T1w signal is elevated with increasing CFS severity in the ventrolateral thalamus, internal capsule and prefrontal WM. Earlier reports of WM volume losses and neuroinflammation in the midbrain, together with the upregulated prefrontal myelination suggested here, are consistent with the midbrain changes being associated with impaired nerve conduction which stimulates a plastic response on the cortical side of the thalamic relay in the same circuits. The T2w signal versus CFS duration and comparison of T2w signal in the CFS group with the NC group revealed changes in the right middle temporal lobe WM, where impaired communication can affect cognitive function. Adjustment for depression markedly strengthened cluster statistics and increased cluster size in both T1w severity regressions, but adjustment for anxiety less so. Thus, depression and anxiety are statistical confounders here, meaning that they contribute variance to the T1w signal in prefrontal WM but this does not correlate with the co-located variance from CFS severity. MRI regressions with depression itself only detected associations with WM volume, also located in prefrontal WM. We propose that impaired reciprocal brain–body and brain–brain communication through the midbrain provokes peripheral and central responses which contribute to CFS symptoms. Although anxiety, depression and CFS may share biological features, the present evidence indicates that CFS is a distinct disorder. © 2015 The Authors. NMR in Biomedicine published by John Wiley & Sons, Ltd.
Keywords: CFS, MRI, severity, depression, midbrain, myelin upregulation, prefrontal white matter
Introduction
Chronic fatigue syndrome (CFS), or myalgic encephalomyelitis, is a common, debilitating, multisystem disorder of uncertain pathogenesis, for which there exists evidence of dysregulation of the central nervous system, immune system and cellular energy metabolism (1). However, its differentiation from psychiatric disorders, especially anxiety and depression, remains controversial (2,3). In this exploratory study, in view of the limited success of brain imaging in CFS so far, we shifted emphasis and performed voxel-based regressions of brain MR images with scores of CFS severity and CFS duration.
Two recent brain imaging studies have provided new insights into the aetiology of CFS, both implicating the midbrain. A voxel-based morphometry (VBM) analysis demonstrated white matter (WM) volume loss with increasing disease duration in the midbrain (4), and a positron emission tomography (PET) study which labelled activated microglia and activated astrocytes detected neuroinflammation in several locations, with the midbrain having the strongest statistics (5). Earlier studies using single-photon emission computed tomography (SPECT) and PET have reported brainstem and prefrontal changes (6–9). A PET study comparing subjects with multiple sclerosis with and without fatigue detected differences in extended prefrontal grey matter (GM) and WM (10).
Voxel-based image analysis of MRI in CFS with statistical parametric mapping (SPM) is limited. A PET study of CFS reported decreased glucose metabolism in the orbitofrontal cortex (9) and one VBM study detected decreased GM volume in the dorsolateral prefrontal GM (11), although another did not (12). WM hyperintensities were more prevalent in CFS in two studies (13,14), but had normal incidence in our (4) and another (15) study.
Two brain imaging studies have attempted to distinguish associations with CFS from associations with comorbid anxiety and/or depression. A PET study (9) detected correlations with depression (mesial orbitofrontal cortex), where differences from normal controls (NCs) were also detected, but could not determine: ‘whether depression is a triggering factor for CFS or the result of chronic suffering from fatigue’. However, a functional MRI (fMRI) study (16) reported activation in quite distinct brain locations for fatigue-inducing and anxiety-inducing scenarios. Non-imaging studies have indicated that CFS is distinct from major depressive disorder (2,17).
In the current study, in addition to VBM, we performed a novel voxel-based quantitative analysis of T1-weighted and T2-weighted spin-echo (T1w and T2w) brain MRI images after intersubject signal level normalisation. T1w and T2w images are ideal for cross-sectional studies because of their low noise, high resolution and minimal distortion from patient-induced and instrumentation-induced magnetic field inhomogeneities (18). In the absence of lesions, the T1w signal responds primarily to changes in the levels of myelin (19–21), making it suitable for the detection of subtle changes in WM over extended areas (large clusters of voxels). In the absence of lesions, the T2w signal responds primarily to regional blood volume (22) in the brain.
From the T statistic map generated here by each voxel-by-voxel MRI regression, clusters of contiguous voxels with T above a nominal threshold (normally specified as the equivalent P value) were defined. Guided by the principle, ‘broad signals are best detected by low thresholds and sharp focal signals are best detected by high thresholds’ (23), we relaxed the cluster-forming threshold from the conventional voxel P = 0.001 (‘high’ T threshold) used to detect focal signals to P = 0.005 (‘low’ T threshold) and tested the resulting clusters for significance.
This article presents results from a cross-sectional, voxel-based, brain MRI study of CFS. A preliminary partial analysis of the same dataset (4) demonstrated involvement of midbrain and right middle temporal WM, and abnormal relationships between brain MRI and autonomic function. The involvement of prefrontal WM, reported by other authors, allowed us to invoke an a priori hypothesis for this location. Together with the earlier midbrain volume loss and neuroinflammation evidence, the location and nature of the WM brain associations detected here permitted us to propose a single coherent explanation – impaired nerve conduction in the midbrain – for our observations.
Methods
Subjects
Twenty-seven subjects with CFS, aged 19–46 years, were recruited from community-based specialist and general practice. They met both the Fukuda (24) and Canadian (25) criteria for CFS and were assessed as described in ref. (4). All medications including ‘natural therapies’ were discontinued 2 weeks prior to the study week, except for paracetamol and oral contraceptives. Subjects with a history of chemical sensitivity or a body mass index (BMI) > 30, or who were pregnant, postmenopausal, unable to undertake brain MR or cerebral SPECT scans, or unable to discontinue medication, were excluded. The study period was delayed for any viral or bacterial infection until recovery.
Twenty-seven NCs unrelated to the subjects with CFS were recruited by public advertisement, and were matched for gender, age to within 2 years and weight to within 5 kg. They were not taking any medications and had no previous serious illnesses. All participants were compensated for transport costs alone. All examinations were completed within 1 week. The study protocol was approved by the Research Ethics Committee of the Royal Adelaide Hospital, and all subjects gave informed written consent.
Two subjects with CFS and their age- and sex-matched NCs were removed from the analysis based on their MR scan. One man, aged 30 years, had an absent right cerebellum without cerebellar symptoms, and one woman, aged 20 years, had a large frontal angiomatous tumour, again asymptomatic with regard to the tumour. Thus, 25 subjects with CFS with a mean duration of fatigue of 7.4 years (range, 2–15 years) and 25 NCs were assessed, with six men and 19 women in each group. The mean ages were 32 years (range, 19–46 years) for subjects with CFS and 32.8 years (range, 20–46 years) for NCs. The precursor to CFS onset was an infection in 14 cases (seven caused by serologically proven Epstein–Barr virus), work and stress in three, post-delivery in one and was unknown in seven.
Three CFS severity scores were used: the Bell CFS disability scale (CFS disability) (26) and two scores derived from self-scores of the 10 most significant symptoms (27,28). These were the ‘somatic symptom score’ (somatic SS) and the ‘neurological symptom score’ (neuro SS). The somatic SS was the sum of the six self-scores for severity of fatigue, change in sleeping pattern, dizziness on standing, pain in muscles, stomach symptoms and overall level of function. The neuro SS was the sum of the four self-scores for change in concentration, change in short-term memory, headaches and experience of emotional swings. All were scored such that lower scores indicated more severe symptoms. To determine the levels of depression and anxiety, all subjects completed the Hospital Anxiety and Depression Scale (HADS) questionnaire (29). We performed correlations between scores of CFS duration, CFS disability, somatic SS, neuro SS, anxiety and depression (from first principles in MatLab, The Mathworks Inc, Natick MA). Haemodynamic scores were also acquired with a 24-h ambulatory blood pressure monitor [see ref. (4) for correlations].
MR acquisition
MR images were acquired on a Philips 1.5-T Intera MR scanner (Philips, Eindhoven, the Netherlands) with a body transmit coil and birdcage receive coil. Three sequences were used: T1w (TR/TE/flip angle = 600 ms/15 ms/90º); T2w (TR/TE/flip angle = 4000 ms/80 ms/90º); and three-dimensional spoiled gradient-echo (TR/TE/flip angle = 5.76 ms/1.9 ms/9º). T1w and T2w images were transaxial with pixel sizes of 0.82 × 0.82 and 0.859 × 0.859 mm2, respectively, and a contiguous slice thickness of 3 mm. The three-dimensional gradient echo voxel size was 0.938 × 0.938 × 1.0 mm3 [see ref. (4) for visual MRI scoring].
Preprocessing of images
We limit ourselves here to VBM, T1w and T2w comparisons between CFS and NC groups, and regressions with measures of CFS severity and CFS duration, which detected associations in WM. SPM5 (http://www.fil.ion.ucl.ac.uk/spm) was used throughout.
First, the three-dimensional gradient-echo brain images were segmented into separate GM, WM and cerebrospinal fluid (CSF) images which were spatially normalised to the Montreal Neurological Institute (MNI) template. Each voxel value was the probability (range, 0.0–1.0) that it belonged to the partition in question (e.g. WM). Non-linear spatial normalisation of the grey and white partitions was then refined over six iterations using SPM5's DARTEL toolbox (30), each iteration using a template derived from the sum of the images from the previous iteration. This achieves greater accuracy than the standard SPM5 algorithm (30). An additional affine transformation of the final DARTEL GM template to the standard MNI GM template was computed and applied to the normalised partitions for each subject. The GM and WM partitions were then processed independently using VBM (32) which ‘modulated’ the voxel (probability) values to encode the local volume changes associated with the non-linear spatial normalisation. Intersubject normalisation of total volumes was achieved by including the total GM (WM) volume as a nuisance covariate in the GM (WM) SPM statistical analysis.
The T1w and T2w MR images for each subject were co-registered to their raw three-dimensional gradient-echo scan, and the DARTEL deformations computed above were applied to render them in MNI space. Finally, the spatially normalised T1w and T2w images were smoothed using an 8-mm full width at half-maximum (FWHM) Gaussian kernel. Intersubject T1w (and T2w) signal level normalisation was performed using the mean voxel value in a mask (brain volume) generated using voxel-based iterative sensitivity (VBIS) analysis (33). VBIS analysis is based on a preliminary CFS versus NC analysis using SPM's ‘proportional scaling’ and defines the mask as those voxels within brain parenchyma (GM + WM) with intersubject variance less than the median. These mean levels were then incorporated as a nuisance covariate in the SPM statistical analysis, effectively normalising the intersubject T1w (or T2w) signal levels. To reduce edge effects in the SPM statistical analyses, we excluded VBM (WM volume) voxels with values below 0.1 (for any subject), and T1w and T2w voxels with signal levels below 0.5 of the mean voxel value.
Cluster-forming thresholds
SPM generates statistics for both single voxels and clusters of voxels. A cluster is formed by contiguous voxels with an uncorrected voxel P below a nominal threshold, and SPM reports a cluster P for each cluster detected. In this article, guided by the principle ‘broad signals are best detected by low thresholds and sharp focal signals are best detected by high thresholds (23), in addition to testing for corrected cluster P < 0.05 (corrected for multiple cluster comparisons) from the cluster-forming uncorrected voxel P = 0.001 threshold, which is the convention for the detection of focal signals, we also relaxed the uncorrected voxel P to 0.005 to test for clusters larger in extent, but with generally less significant voxel P, which may have been insignificant with the stricter uncorrected voxel P = 0.001 threshold. Correction of cluster statistics for multiple cluster comparisons was performed using a non-stationary permutation method in the SPM ‘ns’ toolbox, which caters for variable image smoothness and has been validated for uncorrected voxel P thresholds of both 0.001 and 0.01 (34).
For clusters in WM with an a priori hypothesis (prefrontal WM here), and for which the corrected cluster P was not significant, the uncorrected cluster P was also tested.
Statistical designs
The full analysis of this study consisted of n = [1 + (4 + 2) + 18] × 2 × 4 = 200 regressions. Here, in the square brackets, ‘1’ refers to the categorical (group) comparison of CFS with NC and 18 refers to autonomic regressors for blood pressure (systolic, diastolic and pulse pressure) and heart rate whilst seated and asleep (4), for which complete results will be reported elsewhere. For ‘(4+2)’, ‘4’ refers to the CFS duration and three severity regressors (CFS disability, somatic SS and neuro SS) considered here. All four were analysed with a one-sided CFS-only regression, whereas ‘2’, somatic SS and neuro SS, were also analysed with a two-sided, CFS and NC interaction-with-group design which tested each voxel for CFS and NC regressions with opposite slopes. Two-sided regressions were not applied to the CFS duration, because it was not applicable to NC, nor to CFS disability, because it had the same value for all NC subjects (see plot in Figure2). The ‘×2’ accounts for both positive and negative regressions for each statistical design and ‘×4’ accounts for the four image types (GM volume, WM volume, T1w and T2w). This paper is confined to WM results from the analysis of WM volume and T1w and T2w images in group comparisons and regressions against CFS duration or CFS severity, that is [1 + (4 + 2)] × 2 × 3 = 42 regressions (‘×3’ here instead of ‘×4’ because GM volume regressions will not generate WM clusters). It should be noted that 200, not 42, was applied when correcting for multiple regressions (see below). All regressions were adjusted for age.
Figure 2.
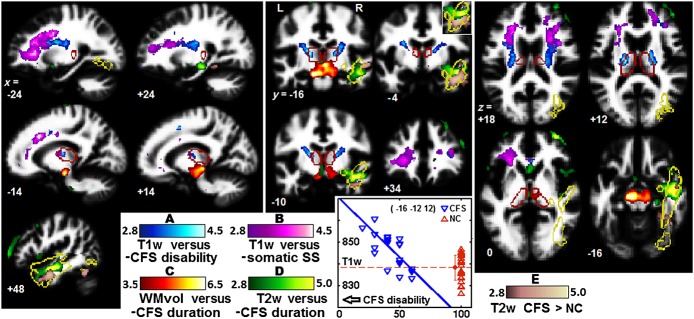
Clusters from regressions of T1-weighted spin-echo (T1w) versus chronic fatigue syndrome (CFS) disability (A), T1w versus (depression adjusted) somatic symptom score (somatic SS) (B), white matter (WM) volume versus CFS duration (C) and T2w versus CFS duration (D). (E) From the T2w group comparison with CFS > normal controls (NCs). (A–E) cross-reference to Table1. The clusters shown were formed with a voxel P threshold of 0.005 (T = 2.8), except for WM volume versus CFS duration (P = 0.001, T = 3.5). Red edges outline the thalamus and yellow edges the right inferior longitudinal fasciculus (ILF). The peak voxel for the CFS disability cluster is at the junction of the left ventrolateral thalamus and internal capsule (see x = –14, y = –16, z = +12) and the plot shows individual T1w values of that voxel for both subjects with CFS and NCs. The inset for y = –4 reverses the order of the T2w overlays to clarify the extent of overlap. The background image is the mean WM image from this study.
Correction for multiple regressions
Because we tested for significant clusters using two cluster-forming thresholds, the number of designs tested was N = 2 × n = 400. Bonferroni-corrected P values are obtained by multiplying corrected cluster P by N. However, because not all clinical measures are independent, the Bonferroni correction is too strict. We therefore used the false discovery rate (FDR), the expected proportion of false positives among all N designs tested (35). An upper bound, q = 0.05, was chosen for the expected FDR. The m strongest results with P values, P1,…,Pm, which satisfied P1,…,Pm < (m/N)q, were then deemed to be significant. If a cluster P was more significant after adjustment for depression, the adjusted value was used for the FDR assessment.
Adjustment for anxiety and depression
Regressions that yielded a cluster with corrected P < 0.05 were repeated with adjustment for the HADS depression and anxiety scores independently. In the preliminary report (4), adjustments were made by including both depression and anxiety as nuisance covariates. Here, because of the strong correlation detected between depression and anxiety, adjustment for depression only should be sufficient to adjust for both. However, because of the controversy around the role of depression and anxiety in CFS, regressions that yielded WM clusters with corrected cluster P < 0.05 were repeated separately with adjustment for depression and then anxiety. Because adjustment for depression had such a profound effect in some regressions, we also performed a satellite study of direct regressions between the MR images and depression itself, and then anxiety. To our knowledge, regressions of T1w and T2w against measures of anxiety and depression have not been performed previously.
Image display
All images were displayed using the ‘neurological’ convention (patient left is left on the image). The thalamic and inferior longitudinal fasciculus (ILF) edges superimposed on some images were derived from the masks defined in the TD and aal atlases incorporated in the Wake Forest University PickAtlas toolbox of SPM5. Colour-coded overlays of clusters from multiple regressions on a background image were achieved using the ‘slover’ program (http://www.imaging.mrc-cbu.cam.ac.uk/imaging/DisplaySlices).
Results
For the six regressors examined here (CFS duration, CFS disability, somatic SS, neuro SS and HADS depression and anxiety), significant correlations were found between the clinical scores of CFS disability and somatic SS (R = 0.82, P = 6e-7), CFS disability and neuro SS (0.66, 0.0003), CFS disability and depression (–0.49, 0.013), somatic SS and neuro SS (0.59, 0.002), somatic SS and depression (–0.50, 0.011), and anxiety and depression (0.69, 0.0001), although not for CFS disability or somatic SS and anxiety.
An FDR of 0.05 for the 200 regressions performed and the two cluster-forming thresholds tested was achieved by setting a corrected cluster P threshold of 0.008. Five WM clusters created with a voxel threshold of 0.005 from the MRI comparisons between CFS and NC or MRI regressions with CFS duration and CFS severity were significant by this criterion, although, in one case, only after adjustment for depression. Two new clusters were detected in T1w regressions with the severity measures CFS disability and somatic SS, and one new cluster from the T2w comparison between CFS and NC. The remaining two, from WM volume versus CFS duration and T2w versus CFS duration regressions, have been reported previously (4), and were included here to provide a complete summary of WM associations with CFS severity and duration.
Figure1 provides an overview of the cluster locations and extent for the T1w regressions, before and after adjustment for depression. They were located bilaterally in the prefrontal WM. The T1w association with CFS disability was stronger than with somatic SS. Adjustment for depression markedly increased cluster size, particularly on the left.
Figure 1.
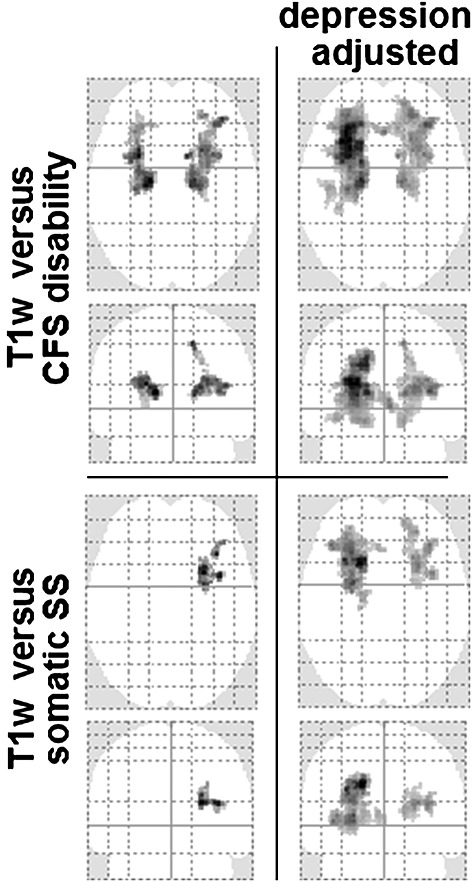
Axial and coronal projections of T statistic maxima showing cluster location and extent in prefrontal white matter (WM) for T1-weighted spin-echo (T1w) versus chronic fatigue syndrome (CFS) disability (top) and T1w versus somatic symptom score (SS) (bottom), before (left) and after (right) adjustment for depression. The voxel P threshold for cluster formation was 0.005.
Table1 lists the corrected cluster P values and sizes for all five regressions for cluster-forming uncorrected voxel P = 0.005 and 0.001, and with adjustment for depression and anxiety. Adjustment for depression greatly enhanced the clusters from regressions A, B and E, although, for A and E, this was partly a result of the merging of adjacent clusters. Initially, cluster B did not survive FDR correction for multiple tests (only clusters with P < 0.006 survived), but easily met this criterion after adjustment for depression. It was striking that, when the stricter uncorrected voxel P = 0.001 cluster-forming threshold was applied for regression A (after depression adjustment) and regressions C and D, their clusters, although reduced in size by a factor of 2–3, became more significant. Depression and anxiety adjustments had little effect on clusters from regressions C and D, although, for D, anxiety weakened P, which suggests that the effects of CFS duration on T2w correlate with the effects of anxiety on T2w. The cluster P values in Table1 are corrected for multiple cluster comparisons. However, regression A and B clusters were located where an a priori hypothesis applied. Therefore, their uncorrected cluster P values are relevant and, for regression B threshold 0.005 clusters, were 0.013 (right), 2.4e-6 and 0.0013 (left and right) depression adjusted, and 0.004 and 0.005 anxiety adjusted.
Table 1.
Corrected cluster P and cluster size k (voxels) for MRI regressions with chronic fatigue syndrome (CFS) severity and CFS duration, and CFS to normal control (NC) group comparisons that yielded significant clusters in white matter (corrected cluster P < 0.05). Voxel size was 2 × 2 × 2 mm3. Results are also listed after separate adjustment for depression and anxiety (‘d’ and ‘a’ in ‘adj’ column). Only clusters with P < 0.008 survived the rigorous false discovery rate correction for multiple regressions. For regression A, values separated by ‘&’ are for separate bilateral clusters, although, for the depression-adjusted 0.005 threshold case, the two clusters merged at the genu of the corpus callosum
| MR image | Regressor | adj | Cluster P and size (k) for two voxel thresholds | Cluster location | ||||
|---|---|---|---|---|---|---|---|---|
| 0.005 | 0.001 | |||||||
| P | k | P | k | |||||
| – | 0.0044 & 0.0056 | 901 & 978 | 0.035 | 131 | ventrolateral thalamus, | |||
| A | T1w | –CFS disability | d | 1.5e-5 | 6062 | 6.4e-6 & 0.016 | 1905 & 307 | internal capsule, |
| a | 2.5e-4 & 0.004 | 1962 & 1282 | 0.0010 | 435 | prefrontal WM | |||
| – | ns* | ns | ||||||
| B | T1w | –Somatic SS | d | 1.0e-4 | 1697 | 1.4e-4 | 364 | Prefrontal WM |
| a | ns* | ns | ||||||
| – | 1.7e-4 | 4067 | 2.9e-5 | 2228 | ||||
| C | WM volume | –CFS duration | d | 2.2e-4 | 4077 | 4.3e-5 | 2153 | Midbrain |
| a | 1.5e-4 | 4237 | 3.3e-5 | 2234 | ||||
| – | 0.0041 | 950 | 0.0032 | 356 | Right middle | |||
| D | T2w | –CFS duration | d | 0.0050 | 918 | 0.0031 | 351 | temporal |
| a | 0.011 | 414 | 0.011 | 228 | WM | |||
| – | 0.05 | 793 | ns | Right middle | ||||
| E | T2w | CFS > NC | d | 2.2e-4 | 1464 | 0.05 | 91 | temporal |
| a | ns | ns | WM | |||||
indicates significant uncorrected cluster P.
SS, symptom score; T1w, T1-weighted spin-echo; T2w, T2-weighted spin-echo; WM, white matter.
Figure2 shows clusters on selected sections for the four regressions and one group comparison from Table1. The T1w versus CFS disability clusters extended bilaterally from the ventrolateral thalamus (y = –16, z = +12 in Fig.2) through the posterior limb, genu and anterior limb of the internal capsule. The T1w versus somatic SS clusters shown were adjusted for depression and occupied more rostral frontal WM. (Refer to Fig.3 to resolve the overlap with T1w versus CFS disability at x = –24 and z = +18.) The plot shows T1w values for individual subjects versus CFS disability at the most significant voxel, and demonstrates that many of the CFS values exceeded the maximum value in the controls, although the difference in means was insignificant. The peak in the midbrain cluster in which the WM volume decreased with CFS duration was in the crus cerebri (see z = –16), although volume changes extended to the thalamus. Three voxels were significant after correction for multiple comparisons (4). The adjacent clusters from the two T2w designs mostly occupied the right middle temporal WM within the right ILF.
Figure 3.
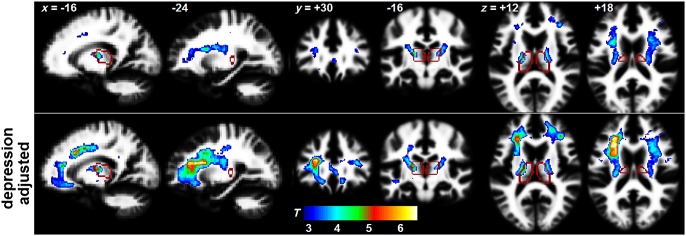
Clusters before (top row) and after (bottom row) adjustment for depression for the T1-weighted spin-echo (T1w) versus chronic fatigue syndrome (CFS) disability regression. The voxel threshold for cluster formation was P = 0.005 (T = 2.8). The edges of the thalamus are shown in red. The peak voxel shifted from the left ventrolateral thalamus–internal capsule junction near x = –16, y = –16, z = +12 in the top row to the left prefrontal white matter (WM) near x = –24, y = +30, z = +18 in the bottom row, indicating that depression effects were stronger more rostrally.
Figure3 demonstrates the effect of adjusting for depression in the T1w versus CFS disability regression. Voxel T statistics were strengthened and the cluster expanded beyond the internal capsule into the adjacent prefrontal WM. The location in MNI space of the peak voxel moved from (–16 –12 10) at the left ventrolateral thalamus–internal capsule junction to (–30 30 20) in the left prefrontal WM. At these voxels, the ratios of T1w variance from CFS disability to variance from depression (the ratios of the regression slopes) were 1.35 and 0.47, respectively.
Figure4 demonstrates, at a single voxel (–30, 30, 20), how depression adjustment reduces the T1w intersubject variances at most CFS disability values and renders them closer to their linear fit.
Figure 4.
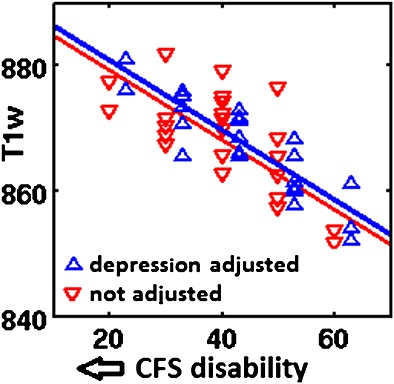
Reduction of variance by adjustment for depression (blue) in T1-weighted spin-echo (T1w) values of individual subjects at the location of the peak voxel (–30, 30, 20). The regression slope was unchanged. The blue symbols and linear fit have been offset to the right to avoid overlap.
Separate regressions of T1w and T2w with anxiety and depression yielded no significant clusters in WM. However, regressions of WM volume images with anxiety and depression yielded the three clusters in the prefrontal WM shown in Figure5. WM volume decreased with both increasing anxiety (top) and with increasing depression (bottom). With a cluster-forming threshold of 0.001, for anxiety only, one cluster had corrected P ≤ 0.05, whereas both clusters had uncorrected P ≤ 0.05. With a cluster-forming voxel threshold of 0.005, their corrected cluster P values were 0.02 and 0.09 (anxiety) and 0.025 (depression), and their uncorrected cluster P values were 0.001, 0.005 and 0.001, respectively, which are relevant here because, in this satellite analysis of MRI versus depression and anxiety, an a priori hypothesis can be posited for prefrontal WM (where adjustment for depression had profound effects on the T1w versus severity regressions). Peak voxels in these clusters were located at (–11, 49, 19), (22, 29, 35) and (–18, 19, 48), respectively.
Figure 5.
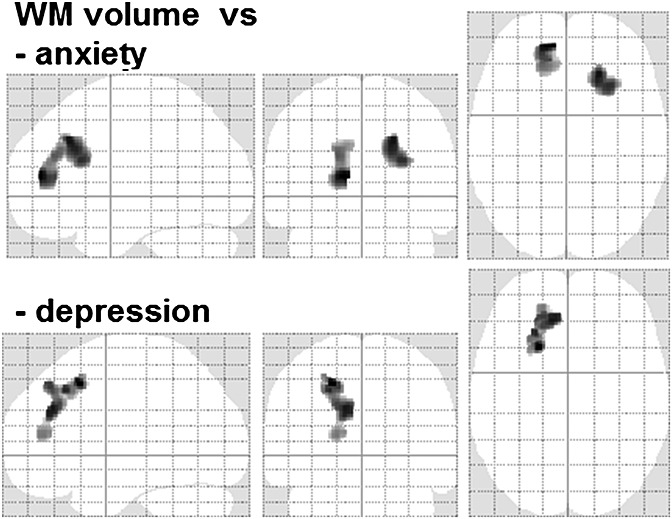
Maximum T statistic projections for white matter (WM) volume versus anxiety and WM volume versus depression. The clusters are in prefrontal WM and were formed with a voxel P = 0.005 threshold.
Discussion
This exploratory cross-sectional brain MRI study of CFS is distinguished by several novel features.
For the first time in CFS, T1w and T2w images were subjected to quantitative analysis. Intersubject signal levels were normalised with the VBIS method (33). We also performed VBM.
Instead of relying only on the comparison with an NC group, we additionally assessed linear regressions of brain MRI with clinical measures of CFS severity (and duration).
We repeated regressions to adjust for the effects of depression and anxiety.
We confined our attention to associations in WM. Because we anticipated that such associations may be large in extent, we relaxed the cluster-forming voxel P threshold to 0.005.
This approach yielded two important conclusions.
Nerve impulse conduction through the midbrain may be compromised in CFS. This was inferred from the paired observations of a severity-dependent increase in prefrontal T1w (myelination) and volume loss in midbrain WM.
CFS severity effects are independent of depression and anxiety. This was inferred by the observation that adjustments for depression and anxiety actually strengthened the T1w versus severity statistics.
T1w changes in prefrontal WM
Relaxation of the cluster-forming voxel threshold to 0.005 in this study revealed additional clusters in prefrontal WM where T1w correlated with the two CFS severity scores: CFS disability and somatic SS. Both scores decreased with increasing severity, so that their significant negative regressions with T1w in prefrontal WM correspond to increases in T1w with increasing CFS severity. Because T1w tracks changes in myelin levels (19,20), this can be interpreted to mean that increasing CFS severity is associated with upregulated myelin levels in prefrontal WM. Taken together with the reports of midbrain WM volume loss (4) and midbrain neuroinflammation (5) in CFS, we can infer that these midbrain changes are associated with impaired nerve conduction, which stimulates a plastic response in the same circuits (in prefrontal WM) on the cortical side of the thalamic relay. Although the mechanisms for such myelin upregulation remain under investigation, in vitro work has demonstrated a dynamic role for oligodendrocytes in the adaptation of myelin levels to regulate nerve impulse transmission through axons (36-40). Motor-evoked potential observations (41) also support impaired central nerve conduction in CFS. The T1w CFS versus NC group analysis revealed no significant differences, underlining the advantage of the linear regression approach.
If confirmed, our inference that midbrain nerve conduction is impaired in CFS is of pivotal importance. The midbrain is involved in both brain–body and brain–brain communication (42,43). The latter includes ascending neurohormonal (norepinephrine, dopamine and serotonin) fibres (44,45). These, together with the midbrain ascending reticular activation system, maintain cortical arousal in response to sensory stimuli or attention-demanding tasks, and maintain a normal state of consciousness (46). A midbrain conduction deficit would provide an explanation at least for the autonomic dysfunction, impaired cognition and sleep disturbance of CFS.
T2w changes in middle temporal WM
T2w responds inversely to changes in regional blood volume (22), and so the negative regression with CFS duration reported earlier (4) and included here (regression D in Table1, Fig.2) suggests that the right middle temporal WM blood volume increases with CFS duration. The group comparison for T2w with CFS > NC also yielded a right middle temporal WM cluster (regression E in Table1, Fig.2), suggesting reduced WM blood volume in this region in CFS. These adjacent T2w findings suggest local cerebrovascular dysregulation. They involve the middle temporal area of ILF (see edges in Fig.2) which subserves the anterior temporal lobe and superior temporal gyrus, which are key elements of the circuits involved in ‘semantic knowledge’ and ‘ongoing cognition’ (47,48). Impaired ILF function could therefore affect cognitive ability. Right ILF abnormalities have also been reported (in diffusion tensor MRI) in CFS (49) and in Gulf War Illness (50), which shares many symptoms with CFS. Temporal lobe involvement in CFS was also indicated in an electroencephalogram coherence study (17).
Implications of adjustment for depression (and anxiety)
Anxiety and depression were originally included in the voxel-wise MRI statistical analyses as nuisance covariates to ‘adjust out’ any contribution they might make to local severity correlations. This approach isolates the component of the MRI versus CFS severity correlation that is independent of depression (or anxiety). If this adjustment were to appreciably weaken the severity correlation, it would suggest that the severity correlation was largely driven by variations in comorbid depression and/or anxiety, and that CFS is psychogenic in origin. Instead, for both T1w versus severity regressions, adjustment for depression strengthened the corrected cluster P in prefrontal WM and increased the cluster size (Table1, A and B; Figs1 and 3), indicating that these results are independent of depression (and anxiety). Thus, although depression levels have an association with (contribute variance to) the T1w signal in prefrontal WM, this variance is not correlated with the co-located variance from the CFS severity association. That is, depression is a statistical ‘confounder’. Adjusting out the depression-related variance does not diminish the T1w versus CFS severity signal, but reduces the residual variance (see Fig.4) and results in a stronger statistical inference. Indeed, for the cluster from regression B, it was only the depression-adjusted cluster P that survived the rigorous FDR criteria applied here, confirming that it was not merely a chance finding, and providing support for the use of the 0.005 cluster-forming voxel threshold. For clusters A, C and D, their corrected cluster P values were actually stronger for the more stringent uncorrected voxel P = 0.001 cluster-forming threshold, despite their sizes being reduced.
The shift in the peak voxel from the thalamus–internal capsule junction in the T1w versus CFS disability cluster (Fig.3, top row, y = –12, z = +12) to the prefrontal WM after depression adjustment (Fig.3, bottom row, x = –24, z = 18) indicates that the depression confound was stronger for more frontal locations.
It is of interest that depression and CFS have been reported to share immuno-inflammatory processes both systemically (51) and centrally (52), as has anxiety centrally (53). However, our analysis indicates that neither anxiety nor depression contributes to the observed associations between T1w and CFS severity in the present study, where anxiety and depression levels were subsyndromal (4).
MRI versus anxiety and depression
Because of the marked changes observed in MRI (T1w) versus CFS severity regressions after adjustment for depression and anxiety, we performed additional MRI regressions directly with anxiety or depression. These yielded significant clusters, but only in (VBM) WM volume regressions (Fig.5). These clusters were also located prefrontally and were adjacent to the left ventral prefrontal cortex locations reported for an fMRI anxiety-inducing scenario in subjects with CFS (but not NCs) (16). A recent large diffusion tensor imaging (DTI) study has demonstrated that depression correlates with fractional anisotropy, and mean and radial diffusivity in extended prefrontal WM, although, unlike this study, no (VBM) WM volume correlation was detected (54).
Although adjusting out the depression-associated variance in T1w appreciably strengthened the T1w versus CFS disability statistical inference in prefrontal WM (Table1, Figs1, 3 and 4), the T1w versus depression regression itself did not yield a significant cluster (unless the cluster-forming threshold was relaxed excessively to uncorrected voxel P = 0.05, when a left prefrontal T1w cluster with uncorrected cluster P = 0.001 was detected – not shown).
We have demonstrated that the local prefrontal WM associations between T1w and CFS severity are independent of anxiety and depression. This is a local result and does not exclude the contentious interpretation (from the P = 0.011/0.013 correlations here between the clinical scores of somatic SS/CFS disability and HADS depression) that CFS is simply a manifestation of depression. However, all of the MRI regressions with depression itself only yielded one cluster (Fig.5) which was located in the same prefrontal WM in which the depression-independent T1w versus CFS severity regression was detected (Fig.3). That is, MRI signals in no other brain locations (which might influence CFS severity) correlated with depression, and therefore a depression-driven hypothesis for CFS is not supported here.
WM volume and myelination changes are decoupled
Clusters from three WM volume regressions, namely with CFS duration (midbrain, Fig.2), and anxiety and depression (prefrontal WM, Fig.5), are not accompanied by co-located clusters from corresponding T1w regressions, indicating no changes in myelination. Thus, the volume changes do not appear to involve the oligodendrocytes which contain myelin. Instead, astrocyte shrinkage or loss has been proposed (4) to yield the volume loss.
Study limitations
Causality cannot be determined from the cross-sectional study reported here. Longitudinal studies are now indicated to confirm the inferences suggested here by the CFS duration regressions.
Two of the severity scores, somatic SS and neuro SS, used as regressors here, although based on the most frequent CFS symptoms (27,28) and having much in common with validated scores, such as the ‘Centers for Disease Control (CDC) CFS Symptom Inventory’ (55), cannot themselves be regarded as validated. Validated severity measures may yield even stronger MRI associations.
Because of the novelty of the experimental method, some interpretations proposed here are not well established in the neuroimaging community. In particular, we interpret intersubject variation in signal-normalised T1w to reflect variation in myelin levels. T1w is also influenced by tissue fluid levels, but so too is T2w (21). The absence of parallel T1w and T2w associations reduces the likelihood that variations in fluid levels can explain the T1w (or T2w) variations observed here.
The indirect inference here from prefrontal T1w variation, that nerve impulse propagation in the midbrain is compromised in CFS, raises the question of whether it would be better to confirm/refute a midbrain conduction deficit using DTI and/or resting-state fMRI? The answer to this question for a small structure such as the midbrain which contains multiple crossing, in some cases dispersed, fibre bundles is unclear. This will depend on the suitability of DTI and fMRI, which are compromised by distortions from instrumentation and patient-induced magnetic field inhomogeneities and a relatively coarse voxel size, for a study of the midbrain. Clinical studies incorporating both T1w and DTI and/or fMRI imaging are required to assess their relative strengths. Future studies in this laboratory will also include advanced DTI acquisition and processing (55–56).
Conclusions
The severity-dependent elevation of myelination in the internal capsule and prefrontal WM reported here, together with midbrain volume loss and midbrain neuroinflammation in CFS reported elsewhere (4,5), suggest that these midbrain changes are associated with impaired midbrain nerve conduction. Impaired brain–body and brain–brain communication through the midbrain could explain many of the autonomic and cognitive symptoms of CFS. Despite the observation here that clinical scores of CFS severity correlate with those of depression, in prefrontal WM the T1w variance associated with CFS severity does not correlate with the variance associated with anxiety and depression. Thus, although anxiety, depression and CFS may share biological similarities, on the present evidence, CFS appears to be a distinct disorder. T2w changes were detected in right middle temporal lobe WM which is relevant to cognition (47,48). This work highlights the potential of quantitative analysis of T1w and T2w MRI in clinical research.
Acknowledgments
We thank David F. Abbott for useful discussions on this work. This work was undertaken with funding from the Judith Jane Mason Foundation, John T. Reid Charitable Trusts, The Queen Elizabeth Hospital Nuclear Medicine Trust Fund and the Alison Hunter Memorial Foundation who also provided administrative assistance. These funding sources had no involvement in the design of this study. Important imaging support was provided by The Queen Elizabeth Hospital Radiology Department.
Glossary
- BMI
body mass index
- CFS
chronic fatigue syndrome
- CSF
cerebrospinal fluid
- DTI
diffusion tensor imaging
- FDR
false discovery rate
- fMRI
functional MRI
- FWHM
full width at half-maximum
- GM
grey matter
- HADS
Hospital Anxiety and Depression Scale
- ILF
inferior longitudinal fasciculus
- MNI
Montreal Neurological Institute
- NC
normal control
- neuro SS
neurological symptom score
- PET
positron emission tomography
- somatic SS
somatic symptom score
- SPECT
single-photon emission computed tomography
- SPM
statistical parametric mapping
- SS
symptom score
- T1w
T1-weighted spin-echo
- T2w
T2-weighted spin-echo
- VBIS
voxel-based iterative sensitivity
- VBM
voxel-based morphometry
- VL
ventrolateral
- WM
white matter.
References
- 1.Carruthers B, van de Sande M, DeMeirleir K, Klimas N, Broderick G, Mitchell T, Staines D, Powles A, Speight N, Vallings R, Bateman L, Baumgarten-Austrheim B, Bell D, Carlo-Stella N, Chia J, Darragh A, Lewis D, Jo D, Light A, Marshall-Gradisnik S, Mena I, Mikovits J, Miwa K, Murovska M, Pall M, Stevens S. Myalgic encephalomyelitis: international consensus criteria. J. Intern. Med. 2011;270:327–338. doi: 10.1111/j.1365-2796.2011.02428.x. [DOI] [PMC free article] [PubMed] [Google Scholar]
- 2.Christley Y, Duffy T, Everall I, Martin C. The neuropsychiatric and neuropsychological features of chronic fatigue syndrome: revisiting the enigma. Curr. Psychiatr. Rep. 2013;15:353–362. doi: 10.1007/s11920-013-0353-8. [DOI] [PubMed] [Google Scholar]
- 3.Harvey S, Wadsworth M, Wessely S, Hotopf M. The relationship between prior psychiatric disorder and chronic fatigue: evidence from a national birth cohort study. Psychol. Med. 2008;38:933–940. doi: 10.1017/S0033291707001900. [DOI] [PMC free article] [PubMed] [Google Scholar]
- 4.Barnden L, Crouch B, Kwiatek R, Burnet R, Mernone A, Chryssidis S, Scroop G, Del Fante P. A brain MRI study of chronic fatigue syndrome: evidence of brainstem dysfunction and altered homeostasis. NMR Biomed. 2011;24(10):1302–1312. doi: 10.1002/nbm.1692. [DOI] [PMC free article] [PubMed] [Google Scholar]
- 5.Nakatomi Y, Mizuno K, Ishii A, Wada Y, Tanaka M, Tazawa S, Onoe K, Fukuda S, Kawabe J, Takahashi K, Kataoka Y, Shiomi S, Yamaguti K, Inaba M, Kuratsune H, Watanabe Y. Neuroinflammation in patients with chronic fatigue syndrome/myalgic encephalomyelitis: an 11C-(R)-PK11195 PET study. J. Nucl. Med. 2014;55:945–950. doi: 10.2967/jnumed.113.131045. [DOI] [PubMed] [Google Scholar]
- 6.Costa DC, Tannock C, Brostoff J. Brainstem perfusion is impaired in chronic fatigue syndrome. Q. J. Med. 1995;88:767–773. [PubMed] [Google Scholar]
- 7.Lange G, Wang M, DeLuca J, Natelson B. Neuroimaging in chronic fatigue syndrome. Am. J. Med. 1998;105(3A):50S–53S. doi: 10.1016/s0002-9343(98)00175-2. [DOI] [PubMed] [Google Scholar]
- 8.Tirelli U, Chierichetti F, Tavio M, Simonelli C, Bianchin G, Zanco P, Ferlin G. Brain positron emission tomography (PET) in chronic fatigue syndrome: preliminary data. Am. J. Med. 1998;105(3A):54S–58S. doi: 10.1016/s0002-9343(98)00179-x. [DOI] [PubMed] [Google Scholar]
- 9.Siessmeier T, Nix WA, Hardt J, Schreckenberger M, Egle UT, Bartenstein P. Observer independent analysis of cerebral glucose metabolism in patients with chronic fatigue syndrome. J. Neurol. Neurosurg. Psychiatry. 2003;74:922–928. doi: 10.1136/jnnp.74.7.922. [DOI] [PMC free article] [PubMed] [Google Scholar]
- 10.Roelcke U, Kappos L, Lechner-Scott J, Brunschweiler H, Huber S, Ammann W, Plohman A, Dellas S, Maguire R, Missimer J, Radu E, Steck A, Leenders K. Reduced glucose metabolism in the frontal cortex and basal ganglia of multiple sclerosis patients with fatigue. Neurology. 1997;48:1566–1571. doi: 10.1212/wnl.48.6.1566. [DOI] [PubMed] [Google Scholar]
- 11.Okada T, Tanaka M, Kuratsune H, Watanabe Y, Sadato N. Mechanisms underlying fatigue: a voxel-based morphometric study of chronic fatigue syndrome. BMC Neurol. 2004;4:14–19. doi: 10.1186/1471-2377-4-14. [DOI] [PMC free article] [PubMed] [Google Scholar]
- 12.de Lange F, Kalkman J, Bleijenberg G, Hagoort P, van der Meer J, Toni I. Gray matter volume reduction in the chronic fatigue syndrome. Neuroimage. 2005;26:777–781. doi: 10.1016/j.neuroimage.2005.02.037. [DOI] [PubMed] [Google Scholar]
- 13.Lange G, DeLuca J, Maldjian J, Lee H-J, Tiersky L, Natelson B. Brain MRI abnormalities exist in a subset of patients with chronic fatigue syndrome. J. Neurol. Sci. 1999;171:3–7. doi: 10.1016/s0022-510x(99)00243-9. [DOI] [PubMed] [Google Scholar]
- 14.Natelson B, Cohen J, Brasloff I, Lee H-J. A controlled study of brain magnetic resonance imaging in patients with the chronic fatigue syndrome. J. Neurol. Sci. 1993;120:213–217. doi: 10.1016/0022-510x(93)90276-5. [DOI] [PubMed] [Google Scholar]
- 15.Greco A, Tannock C, Brostoff J, Costa D. Brain MR in chronic fatigue syndrome. Am. J. Neuroradiol. 1997;18:1265–1269. [PMC free article] [PubMed] [Google Scholar]
- 16.Caseras X, Mataix-Cols D, Rimes K, Giampietro V, Brammer M, Zelaya F, Chalder T, Godfrey E. The neural correlates of fatigue: an exploratory imaginal fatigue provocation study in chronic fatigue syndrome. Psychol. Med. 2008;38:941–951. doi: 10.1017/S0033291708003450. [DOI] [PubMed] [Google Scholar]
- 17.Duffy F, McAnulty G, McCreary M, Cuchural G, Komaroff A. EEG spectral coherence data distinguish chronic fatigue syndrome patients from healthy controls and depressed patients—a case control study. BMC Neurol. 2011;11:82–93. doi: 10.1186/1471-2377-11-82. [DOI] [PMC free article] [PubMed] [Google Scholar]
- 18.Bushberg J, Seibert J, Leidholdt E, Boone J. The Essential Physics of Medical Imaging. Philadelphia, PA: Lippincott, Williams and Wilkins; 2002. [Google Scholar]
- 19.Koenig S. Cholesterol of myelin is the determinant of gray–white contrast in MRI of brain. Magn. Reson. Imaging. 1991;20:285–291. doi: 10.1002/mrm.1910200210. [DOI] [PubMed] [Google Scholar]
- 20.Koenig S, Brown R, Spiller M, Lundbom N. Relaxometry of brain: why white matter appears bright in MRI. Magn. Reson. Med. 1990;14:482–495. doi: 10.1002/mrm.1910140306. [DOI] [PubMed] [Google Scholar]
- 21.Roberts T, Mikulis D. Neuro MR: principles. J. Magn. Reson. Imaging. 2007;26:823–837. doi: 10.1002/jmri.21029. [DOI] [PubMed] [Google Scholar]
- 22.Anderson C, Kaufman M, Lowen S, Rohan M, Renshaw P, Teicher M. Brain T2 relaxation times correlate with regional cerebral blood volume. MAGMA. 2005;18:3–6. doi: 10.1007/s10334-004-0076-2. [DOI] [PubMed] [Google Scholar]
- 23.Friston KJ, Worsley KJ, Frackowiak RSJ, Mazziotta JC, Evans AC. Assessing the significance of focal activations using their spatial extent. Hum. Brain Mapping. 1994;1:214–220. doi: 10.1002/hbm.460010306. [DOI] [PubMed] [Google Scholar]
- 24.Fukuda K, Straus SE, Hickie I, Sharpe MC, Dobbins JG, Komaroff A. The chronic fatigue syndrome: a comprehensive approach to its definition and study. Ann Intern Med. 1994;121:953–959. doi: 10.7326/0003-4819-121-12-199412150-00009. [DOI] [PubMed] [Google Scholar]
- 25.Carruthers B, Jain AK, De Meirleir KL, Peterson DL, Klimas N, Lerner AM, C BA, Flor-Henry P, Joshi P, Powles A, Sherkey JA, Van de Sande MI. Myalgic Encephalomyelitis/Chronic Fatigue Syndrome: Clinical working case definition, Diagnostic and Treatment Protocols. J Chron Fatig Syn. 2003;11:87–97. [Google Scholar]
- 26.Bell DS. The Doctor's Guide to Chronic Fatigue Syndrome. Reading, MA: Addison Wesley; 1995. [Google Scholar]
- 27.Hawk C, Jason L, Torres-Harding S. Reliability of a chronic fatigue syndrome questionnaire. J. Chronic Fatigue Syndrome. 2006;13:41–66. doi: 10.1207/s15327558ijbm1303_8. [DOI] [PubMed] [Google Scholar]
- 28.Wilson A, Hickie I, Hadzi-Pavlovic D, Wakefield D, Parker G, Straus S, Dale J, McCluskey D, Hinds G, Brickman A, Goldenberg D, Demitrack M, Wessley S, Sharpe M, Lloyd A. What is chronic fatigue syndrome? Heterogeneity within an international multicentre study. Aust. NZ J. Psychiatry. 2001;35:520–527. doi: 10.1046/j.1440-1614.2001.00888.x. [DOI] [PubMed] [Google Scholar]
- 29.Zigmond A, Snaith R. The Hospital Anxiety and Depression Scale. Acta Psychiatr. Scand. 1983;67:361–370. doi: 10.1111/j.1600-0447.1983.tb09716.x. [DOI] [PubMed] [Google Scholar]
- 30.Ashburner J. A fast diffeomorphic image registration algorithm. Neuroimage. 2007;38:95–113. doi: 10.1016/j.neuroimage.2007.07.007. [DOI] [PubMed] [Google Scholar]
- 31.Yassa M, Stark C. A quantitative evaluation of cross-participant registration techniques for MRI studies of the medial temporal lobe. Neuroimage. 2009;44:319–327. doi: 10.1016/j.neuroimage.2008.09.016. [DOI] [PubMed] [Google Scholar]
- 32.Good CD, Johnsrude IS, Ashburner J, Henson RNA, Friston K, Frackowiak R. A voxel-based morphometric study of ageing in 465 normal adult human brains. Neuroimage. 2001;14:21–36. doi: 10.1006/nimg.2001.0786. [DOI] [PubMed] [Google Scholar]
- 33.Abbott D, Pell G, Pardoe H, Jackson G. Voxel-based iterative sensitivity (VBIS): methods and a validation of intensity scaling for T2-weighted imaging of hippocampal sclerosis. Neuroimage. 2009;44:812–819. doi: 10.1016/j.neuroimage.2008.09.055. [DOI] [PubMed] [Google Scholar]
- 34.Hayasaka S, Phan K, Liberzon I, Worsley K, Nichols T. Nonstationary cluster-size inference with random field and permutation methods. Neuroimage. 2004;22:676–687. doi: 10.1016/j.neuroimage.2004.01.041. [DOI] [PubMed] [Google Scholar]
- 35.Benjamini Y, Hochberg Y. Controlling the false discovery rate: a practical and powerful approach to multiple testing. J. R. Statist. Soc., Ser. B. 1995;57:289–300. [Google Scholar]
- 36.Yamazaki Y, Hozumi Y, Kaneko K, Sugihara T, Fujii S, Goto K, Kato H. Modulatory effects of oligodendrocytes on the conduction velocity of action potentials along axons in the alveus of the rat hippocampal CA1 region. Neuron Glia Biol. 2007;3:325–334. doi: 10.1017/S1740925X08000070. [DOI] [PubMed] [Google Scholar]
- 37.Fields R. White matter in learning, cognition and psychiatric disorders. Trends Neurosci. 2008;31:361–370. doi: 10.1016/j.tins.2008.04.001. [DOI] [PMC free article] [PubMed] [Google Scholar]
- 38.Gibson E, Purger D, Mount C, Goldstein A, Lin G, Wood L, Inema I, Miller S, Bieri G, Zuchero J, Barres B, Woo P, Vogel H, Monje M. Neuronal activity promotes oligodendrogenesis and adaptive myelination in the mammalian brain. Science. 2014;344 doi: 10.1126/science.1252304. doi: 10.1126/science.1252304. [DOI] [PMC free article] [PubMed] [Google Scholar]
- 39.Emery B. Regulation of Oligodendrocyte Differentiation and Myelination. Science. 2010;330:779–782. doi: 10.1126/science.1190927. [DOI] [PubMed] [Google Scholar]
- 40.Salami M, Itami C, Tsumoto T, Kimura F. Change of conduction velocity by regional myelination yields constant latency irrespective of distance between thalamus and cortex. Proc. Natl. Acad. Sci. 2003;100:6174–6179. doi: 10.1073/pnas.0937380100. [DOI] [PMC free article] [PubMed] [Google Scholar]
- 41.Hilgers A, Frank J, Bolte P. Prolongation of central motor conduction time in chronic fatigue syndrome. J. Chronic Fatigue Syndrome. 1998;4(2):23–32. [Google Scholar]
- 42.Miyachi S. Cortico-basal ganglia circuits--parallel closed loops and convergent/divergent connections. Brain Nerve. 2009;61:351–359. [PubMed] [Google Scholar]
- 43.Redgrave P, Coizet V, Comoli E, McHaffie J, Leriche M, Vautrelle N, Hayes L, Overton P. Interactions between the midbrain superior colliculus and the basal ganglia. Front. Neuroanat. 2010;22:132. doi: 10.3389/fnana.2010.00132. [DOI] [PMC free article] [PubMed] [Google Scholar]
- 44.Guyton A, Hall J. Textbook of Medical Physiology. Philadelphia, PA: Elsevier; 2006. [Google Scholar]
- 45.Nolte J, Angevine JBJ. The Human Brain in Photographs and Diagrams. St. Louis, MO: Mosby; 2000. [Google Scholar]
- 46.Nolte J. The Human Brain. An Introduction to its Functional Anatomy. St Louis, MO: Mosby; 2002. [Google Scholar]
- 47.Patterson K, Nestor P, Rogers T. Where do you know what you know? The representation of semantic knowledge in the human brain. Nat. Rev. Neurosci. 2007;98:976–987. doi: 10.1038/nrn2277. [DOI] [PubMed] [Google Scholar]
- 48.Wang M, He B. Across-modal investigation of the neural substrates for ongoing cognition. Front. Psychol. 2014;5:1–10. doi: 10.3389/fpsyg.2014.00945. [DOI] [PMC free article] [PubMed] [Google Scholar]
- 49.Zeineh M, Kang J, Atlas S, Raman M, Reiss A, Norris J, Valencia I, Montoya J. Right arcuate fasciculus abnormality in chronic fatigue syndrome. Radiology. 2014 doi: 10.1148/radiol.14141079. doi 10.1148/radiol.14141079. [DOI] [PubMed] [Google Scholar]
- 50.Rayhan R, Stevens B, Timbol C, Adewuyi O, Walitt B, VanMeter J, Baraniuk J. Increased brain white matter axial diffusivity associated with fatigue, pain and hyperalgesia in gulf war illness. PLoS One. 2013;8:10. doi: 10.1371/journal.pone.0058493. [DOI] [PMC free article] [PubMed] [Google Scholar]
- 51.Anderson G, Berk M, Maes M. Biological phenotypes underpin the physio-somatic symptoms of somatization, depression, and chronic fatigue syndrome. Acta Psychiatr. Scand. 2014;129:83–97. doi: 10.1111/acps.12182. [DOI] [PubMed] [Google Scholar]
- 52.Shungua D, Weiduschata N, Murrough J, Maoa X, Pillemer S, Dykea J, Medow M, Natelson B, Stewart J, Mathew S. Increased ventricular lactate in chronic fatigue syndrome. III. Relationships to cortical glutathione and clinical symptoms implicate oxidative stress in disorder pathophysiology. NMR Biomed. 2012;25:1073–1087. doi: 10.1002/nbm.2772. [DOI] [PMC free article] [PubMed] [Google Scholar]
- 53.Mathew S, Mao X, Keegan K, Levine S, Smith E, Heier L, Otcheretko V, Coplan J, Shungu D. Ventricular cerebrospinal fluid lactate is increased in chronic fatigue syndrome compared with generalized anxiety disorder: an in vivo 3.0 T (1)H MRS imaging study. NMR Biomed. 2009;22(3):251–258. doi: 10.1002/nbm.1315. [DOI] [PubMed] [Google Scholar]
- 54.Hayakawa Y, Sasaki H, Takao H, Hayashi N, Kunimatsua A, Ohtomo K, Aoki S. Depressive symptoms and neuroanatomical structures in community-dwelling women: a combined voxel-based morphometry and diffusion tensor imaging study with tract-based spatial statistics. NeuroImage Clin. 2014;4:481–487. doi: 10.1016/j.nicl.2014.03.002. [DOI] [PMC free article] [PubMed] [Google Scholar]
- 55.Wagner D, Nisenbaum R, Heim C, Jones J, Unger E, Reeves W. Psychometric properties of the CDC symptom inventory for assessment of chronic fatigue syndrome. Pop. Health Metrics. 2005;3:8. doi: 10.1186/1478-7954-3-8. [DOI] [PMC free article] [PubMed] [Google Scholar]
- 56.Calamante F, Masterton RJ, Tournier J-D, Smith R-E, Willats L, Raffelt D, Connelly A. Track-weighted functional connectivity (TW-FC): a tool for characterizing the structural–functional connections in the brain. Neuroimage. 2013;70:199–210. doi: 10.1016/j.neuroimage.2012.12.054. [DOI] [PubMed] [Google Scholar]
- 57.Raffelt D, Tournier J-D, Stephen Rose S, Ridgway G, Henderson R, Crozier S, Salvado O, Connelly A. Apparent fibre density: a novel measure for the analysis of diffusion-weighted magnetic resonance images. Neuroimage. 2012;59:3976–3994. doi: 10.1016/j.neuroimage.2011.10.045. [DOI] [PubMed] [Google Scholar]