

Abstract
To outline further genetic mechanisms of transformation from follicular lymphoma (FL) to diffuse large B-cell lymphoma (DLBCL), we have performed whole genome array-CGH in 81 tumors from 60 patients [29 de novo DLBCL (dnDLBCL), 31 transformed DLBCL (tDLBCL), and 21 antecedent FL]. In 15 patients, paired tumor samples (primary FL and a subsequent tDLBCL) were available, among which three possessed more than two subsequent tumors, allowing us to follow specific genetic alterations acquired before, during, and after the transformation. Gain of 2p15–16.1 encompassing, among others, the REL, BCL11A, USP34, COMMD1, and OTX1 genes was found to be more common in the tDLBCL compared with dnDLBCL (P < 0.001). Furthermore, a high-level amplification of 2p15–16.1 was also detected in the FL stage prior to transformation, indicating its importance during the transformation event. Quantitative real-time PCR showed a higher level of amplification of REL, USP34, and COMMD1 (all involved in the NFκΒ-pathway) compared with BCL11A, which indicates that the altered genes disrupting the NFκΒ pathway may be the driver genes of transformation rather than the previously suggested BCL11A. Moreover, a 17q21.33 amplification was exclusively found in tDLBCL, never in FL (P < 0.04) or dnDLBCL, indicating an upregulation of genes of importance during the later phase of transformation. Taken together, our study demonstrates potential genomic markers for disease progression to clinically more aggressive forms. We also confirm the importance of the TP53-, CDKN2A-, and NFκΒ-pathways for the transformation from FL to DLBCL. © 2014 Wiley Periodicals, Inc.
Introduction
Follicular lymphoma (FL) is one of the most common types of indolent B-cell lymphoma in Western countries and accounts for approximately 25% of all non-Hodgkin lymphomas (Conconi et al., 2012). Despite a usually indolent clinical course with a long estimated survival of more than 10 years, FL is mainly incurable (Fisher et al., 2005). FL commonly transforms to the more aggressive diffuse large B-cell lymphoma (DLBCL) at reported frequencies between 15% and 60% of the included cases in various studies (Conconi et al., 2012). Even though a transformation is mainly seen from FL to DLBCL, transformation from other types of low malignant lymphomas to various types of biologically aggressive lymphoma has been reported (Montoto and Fitzgibbon, 2011). Transformation from FL to DLBCL (tDLBCL) is often accompanied by treatment resistance and poor survival. Although the treatment results of FL and de novo DLBCL (dnDLBCL), as well as tDLBCL, have improved over the years, the histological transformation from FL to tDLBCL remains a critical event in the FL progression. Insights into the evolution of the tumor cells (i.e., chromosomal aberrations, mutations, etc.) are highly warranted for early recognition of disease progression to clinically more aggressive forms.
Previous studies have shown that chromosomal aberrations are associated with histological transformation from FL to tDLBCL, such as loss of 1p36, 6q, and 17p and gains on 2p, 7, 12q13–14, and X (Martinez-Climent et al., 2003; Berglund et al., 2007; Lossos and Gascoyne, 2011). Genes such as TP53, TP73, MDM2, and MYC as well as REL (at 2p16) are often mentioned as possibly involved in the transformation pathogenesis. There are previous reports on 2p15–16 gain detected by genome-wide array-comparative genomic hybridization (CGH) in DLBCL (Martinez-Climent et al., 2003; Tagawa et al., 2005; Nanjangud et al., 2007). Amplification of 2p encompassing the REL gene has been detected in FL using quantitative real-time polymerase chain reaction (qPCR) and CGH (Goff et al., 2000).
Earlier reports on the molecular mechanism of transformation give little insight whether the transformation could be predicted by genetic alterations in the FL already at diagnosis or if the alterations occur in a minor subpopulation that is undetectable using current methodology. In this study, we attempted to elucidate the molecular mechanism behind the transformation from FL to the more aggressive tDLBCL. We have also included samples from patients with dnDLBCL to better pinpoint tDLBCL-specific features. We have analyzed patients with paired tumor samples with biopsies from both the FL stage of disease and the tDLBCL counterpart as well as nonpaired samples of tDLBCL. In three patients, we were able to study more than two subsequent tumors allowing us to follow the progression of specific genetic alterations acquired during the transformation process.
Materials and Methods
Patients and Clinical Samples
The 81 tumor samples studied comprised 21 FL, 31 tDLBCL, and 29 dnDLBCL [10 showing germinal center (GC) and 19 of non-GC related immunophenotype, Hans et al. (2004)] collected from a total of 60 patients. Paired tumor samples, with both the FL as well as tDLBCL counterpart, were available from 15 patients (cases 44–51, 53, and 55–60). The tumors termed “FL prior to transformation” refer to the FL-tumors collected closest in time prior to the DLBCL-transformation (in cases 59 and 60 with more than two subsequent tumors of the FL counterpart). Clinical details are presented in Table1. DNA was isolated from frozen tumor samples and the patients were identified from medical files of the Departments of Pathology-Cytology at the Karolinska University Hospital, Solna, and Uppsala Academic Hospital, Sweden. Diagnostic material including immunohistochemical stains was reviewed according to the WHO 2008 classification (Campo et al., 2011), the tumors were not retrospectively analyzed regarding the presence of t(14;18)(q32;q21). The study of the clinical samples was approved by the Ethical Committee of the Karolinska University Hospital (No. 01–004) and Uppsala Academic Hospital (No. 2008/246).
Table 1.
Clinical Characteristics of the Included Patients
| Tumor no | Case no | Year | Age at diagn | Sex | Diagnosis | Institute | Transformed/De novo | GC/non-GC | Stage | Follow-up time (Mo) | Outcome | Treatment |
|---|---|---|---|---|---|---|---|---|---|---|---|---|
| 1 | 1 | 2007 | 86 | M | DLBCL | Karolinska | Transformed | GC | II A | 40 | DnL | R-CHOP, MIME |
| 2 | 2 | 2007 | 51 | F | DLBCL | Karolinska | De novo | Non-GC | IIIB | 76 | relaps x 2, CCR | R-CHOP, SCT, DHAP |
| 3 | 3 | 2007 | 35 | M | DLBCL | Karolinska | De novo | GC | II A | 76 | CCR | R-CHOP |
| 4 | 4 | 2007 | 46 | M | DLBCL | Karolinska | De novo | GC | III B | 1 | DoL | R-MIME |
| 5 | 5 | 2007 | 61 | M | DLBCL | Karolinska | De novo | Non-GC | III B | 18 | relaps, DoL | R-CHOP, MIME SCT |
| 6 | 6 | 2006 | 29 | F | DLBCL | Karolinska | Transformed | GC | IV A | 83 | CCR | R-CHOP, HDT, SCT |
| 7 | 7 | 2006 | 77 | F | DLBCL | Karolinska | De novo | Non-GC | IV A | 84 | CCR | R-CHOP, RT |
| 8 | 8 | 2006 | 68 | M | DLBCL | Karolinska | De novo | Non-GC | IIA | 84 | CCR | na |
| 9 | 9 | 2006 | 5 | M | DLBCL | Karolinska | Relaps | GC | III | 1 | DoL | NHL BFM-90 |
| 10 | 10 | 2005 | 91 | F | DLBCL | Karolinska | De novo | GC | IA | 70 | DnL | WW, surgery |
| 11 | 11 | 2005 | 54 | M | DLBCL | Karolinska | De novo | Non-GC | IA | 91 | CCR | R-CHOP |
| 12 | 12 | 2005 | 34 | M | DLBCL | Karolinska | Transformed | GC | IIIA | 97 | CCR | R-CHOP |
| 13 | 13 | 2005 | 68 | M | DLBCL | Karolinska | De novo | Non-GC | IIA | 12 | DoL | R-CHOP, CHVP |
| 14 | 14 | 2005 | 74 | F | DLBCL | Karolinska | De novo | Non-GC | IIA | 80 | DnL | R-CHOP |
| 15 | 15 | 2005 | 87 | F | DLBCL | Karolinska | De novo | Non-GC | IV | 1 | DoL | na |
| 16 | 16 | 2005 | 70 | F | DLBCL | Karolinska | Transformed | GC | IV | 14 | DoL | R-CHOP, DHAP, MIME, Fludara, Cytosar |
| 17 | 17 | 2004 | 63 | M | DLBCL | Karolinska | Transformed | GC | IIA | 102 | CCR | R-CHOP |
| 18 | 18 | 2004 | 62 | F | DLBCL | Karolinska | De novo | GC | IIA | 4 | DnL | R-CHOP |
| 19 | 19 | 2004 | 51 | M | DLBCL | Karolinska | De novo | Non-GC | IVA | 108 | relaps, CCR | R-CHOP, MIME, HDT, SCT |
| 20 | 20 | 2004 | 56 | M | DLBCL | Karolinska | De novo | Non-GC | IIIA | 110 | CCR | R-CHOP, Cytosar |
| 21 | 21 | 2004 | 74 | F | DLBCL | Karolinska | Transformed | GC | IIIA | 26 | relaps, DoL | R-CHOP, MIME |
| 22 | 22 | 2004 | 63 | M | DLBCL | Karolinska | Transformed | GC | IV | 104 | relaps, DoL | R-CHOP |
| 23 | 23 | 2003 | 63 | F | DLBCL | Karolinska | Transformed | GC | IA | 120 | CCR | R-CHOP |
| 24 | 24 | 2002 | 59 | M | DLBCL | Karolinska | De novo | na | IA | 60 | CNS relaps, DoL | R-CHOP, RT |
| 25 | 25 | 2002 | 63 | M | DLBCL | Karolinska | Transformed | GC | IV | 15 | cutan relaps, DNL | R-CHOP |
| 26 | 26 | 2002 | 71 | F | DLBCL | Karolinska | De novo | Non-GC | IIA | 20 | DoL | R-CHOP |
| 27 | 27 | 2002 | 63 | M | DLBCL | Karolinska | De novo | Non-GC | IIB | 113 | relaps, AML/MDS - DnL | R-CHOP, RT, R-MIME, SCT, |
| 28 | 28 | 2002 | 48 | M | DLBCL | Karolinska | De novo | Non-GC | IIIB | 133 | CCR | R-CHOP |
| 29 | 29 | 2002 | 49 | M | DLBCL | Karolinska | Transformed | GC | IA | 20 | DoL | R-CHOP |
| 30 | 30 | 2002 | 83 | F | DLBCL | Karolinska | De novo | Non-GC | IIA | 5 | DoL | R-CHOP |
| 31 | 31 | 2001 | 67 | F | DLBCL | Karolinska | Transformed | GC | IIA | 38 | DoL | R-CHOP, R-MIME, RT |
| 32 | 32 | 2001 | 13 | F | DLBCL | Karolinska | De novo | Non-GC | IIA | 139 | CCR | NHL BF M 90 |
| 33 | 33 | 2001 | 32 | M | DLBCL | Karolinska | De novo | Non-GC | IA | 140 | CCR | R-CHOP, RT |
| 34 | 34 | 2001 | 83 | M | DLBCL | Karolinska | De novo | Non-GC | IA | 55 | DnL | R-CHOP, splenectomy |
| 35 | 35 | 2001 | 62 | M | DLBCL | Karolinska | Transformed | GC | IVA | 143 | Relaps, CCR | R-CHOP, R-MIME, RT |
| 36 | 36 | 2001 | 60 | F | DLBCL | Karolinska | De novo | GC | IVA | 144 | CCR | R-CHOP |
| 37 | 37 | 2001 | 56 | F | DLBCL | Karolinska | De novo | GC | IA | 150 | relaps, CCR | R-CHOP, DHAP, SCT |
| 38 | 38 | 2000 | 77 | F | DLBCL | Karolinska | De novo | Non-GC | IIA | 37 | relaps,DoL | R-CHOP, MIME, RT, Gemzar |
| 39 | 39 | 2000 | 81 | M | DLBCL | Karolinska | De novo | GC | na | 1 | DoL | no treatment |
| 40 | 40 | 1999 | 77 | F | DLBCL | Karolinska | De novo | Non-GC | IV | 24 | DoL | R-CHOP |
| 41 | 41 | 1999 | 55 | M | DLBCL | Karolinska | Transformed | Non GC | IV | 53 | DoL | R-CHOP |
| 42 | 42 | 2004 | 63 | F | DLBCL | Karolinska | De novo | GC | II | 108 | CCR | R-CHOP |
| 43 | 43:2 | 2007 | 66 | M | DLBCL | Karolinska | Transformed | GC | IVB | 71 | CCR | R-MIME, SCT |
| 44 | 44:1 | 2001 | 31 | M | DLBCL | Karolinska | Transformed | GC | IV | 150 | CCR | R-CHOP, MIME, Cytosar, autoSCT |
| 45 | 44:2 | 2003 | 33 | M | FL III | Karolinska | na | na | IIIA | 0 | CCR | MIME, alloSCT |
| 46 | 45:1 | 2001 | 49 | M | FL I | Karolinska | na | na | IV | 32 | transformed to DLBCL | splenectomy |
| 47 | 45:2 | 2004 | 52 | M | DLBCL | Karolinska | Transformed | GC | IV | 70 | DoL | R-CHOP, autoSCT, BEAM, DHAP, Gemzar |
| 48 | 46:1 | na | 37 | M | FL n.a. | Uppsala | na | na | na | na | na | na |
| 49 | 46:2 | na | na | M | DLBCL | Uppsala | Transformed | GC | na | na | na | na |
| 50 | 47:1 | na | 61 | M | FL II | Uppsala | na | na | na | na | na | na |
| 51 | 47:2 | na | na | M | DLBCL | Uppsala | Transformed | GC | na | na | na | na |
| 52 | 48:1 | na | 33 | F | FL I | Uppsala | na | na | na | na | na | na |
| 53 | 48:2 | 1992 | 33 | F | DLBCL | Uppsala | Transformed | GC | IIIA | 120 | CCR | CHOP, ABMT |
| 54 | 49:1 | 1988 | 71 | M | FL II | Uppsala | na | na | na | 90 | transformed to DLBCL | WW, chlorambucil |
| 55 | 49:2 | 1995 | 78 | M | DLBCL | Uppsala | Transformed | GC | IVB | 7 | DoL | CHOP |
| 56 | 50:1 | 1994 | 69 | F | FL I | Uppsala | na | na | na | 12 | na | na |
| 57 | 50:2 | 1995 | 70 | F | DLBCL | Uppsala | Transformed | GC | IVA | na | na | na |
| 58 | 51:1 | 1985 | 48 | F | FL I | Uppsala | na | na | na | 60 | transformed to DLBCL | na |
| 59 | 51:2 | 1990 | 53 | F | DLBCL | Uppsala | transformed | GC | IVB | 21 | DoL | CHOP |
| 60 | 52:1 | 1970 | 25 | F | FL I | Uppsala | na | na | na | 247 | transformed to DLBCL | RT, Chlorambucil |
| 61 | 53:1 | 1991 | 50 | F | FL I | Uppsala | na | na | na | 48 | transformed to DLBCL | Chlorambucil, CHOP |
| 62 | 53:2 | 1995 | 54 | F | DLBCL | Uppsala | Transformed | GC | IVB | 38 | DoL | MIME |
| 63 | 54:2 | 1994 | 57 | M | DLBCL | Uppsala | Transformed | GC | IVB | 116 | CCR | CT, ABMT |
| 64 | 55.1 | 1997 | 60 | M | FL I | Uppsala | na | na | na | 14 | transformed to DLBCL | Chlorambucil |
| 65 | 55:2 | 1999 | 62 | M | DLBCL | Uppsala | Transformed | GC | IIB | 38 | CCR | CHOP |
| 66 | 56:1 | 1984 | 71 | F | FL I | Uppsala | na | na | na | 9 | transformed to DLBCL | RT |
| 67 | 56:2 | 1985 | 72 | F | DLBCL | Uppsala | Transformed | GC | IIIB | 4 | DoL | COP |
| 68 | 57:1 | na | 60 | F | FL I | Uppsala | na | na | na | 3 | transformed to DLBCL | splenectomy |
| 69 | 57:2 | na | na | F | DLBCL | Uppsala | Transformed | GC | IVA | 132 | DoL | CHOP |
| 70 | 58:1 | 1992 | 51 | F | FL I | Uppsala | na | na | na | 58 | transformed to DLBCL | CHOP, chlorambucil |
| 71 | 58:2 | 1997 | 56 | F | DLBCL | Uppsala | Transformed | GC | IIIA | na | progression | CT |
| 72 | 58:3 | na | na | F | DLBCL | Uppsala | Transformed | GC | na | 61 | DoL | CT |
| 73 | 59:1 | 1992 | 39 | F | FL I | Uppsala | na | na | na | 96 | progression | WW, chlorambucil, CHOP |
| 74 | 59:2 | na | na | F | FL I | Uppsala | na | na | na | na | progression | WW, chlorambucil, CHOP |
| 75 | 59:3 | na | na | F | FL II | Uppsala | na | na | na | na | transformed to DLBCL | WW, chlorambucil, CHOP |
| 76 | 59:4 | 2000 | 47 | F | DLBCL | Uppsala | Transformed | GC | IIB | 40 | DoL | MIME |
| 77 | 60:1 | 1987 | 39 | F | FL II | Uppsala | na | na | na | 148 | progression | WW, chlorambucil |
| 78 | 60:2 | na | na | F | FL II | Uppsala | na | na | na | na | progression | WW, chlorambucil |
| 79 | 60:3 | na | na | F | FL II | Uppsala | na | na | na | na | progression | WW, chlorambucil |
| 80 | 60:4 | na | na | F | FL I | Uppsala | na | na | na | na | transformed to DLBCL | WW, chlorambucil |
| 81 | 60:5 | 1999 | 51 | F | DLBCL | Uppsala | Transformed | GC | IVA | 48 | DoL | CT |
Mo, months; M, male; F, female; na, not available; DnL, death not related to lymphoma; CCR, continous complete remission; DoL, dead of lymphoma; R, retuximab; CHOP, cyclophosphamide, vincristine, adriamycin, and prednisone; MIME, methyl-gag, iphosphamide, methotrexate, and epiposid; SCT, stem cell transplantation; DHAP, dexamethasone, ara-C, platinum; RT, radio therapy; NHL BFM-90, Berlin Frankfurt Munster protocol; WW, wait and watch; BEAM, carmustine, etoposide, cytarabine, melphalan; ABMT, high dose therapy with autologous stem cell rescue; COP, cyclophosphamide, vincristine, and prednisone; CT, different combination of chemotherapy.
The tumors from the Karolinska University Hospital (cases 1–45) are presented for the first time whereas the tumors from Uppsala (cases 46–60) were previously reported in a series of cases investigated by conventional CGH (Berglund et al., 2007). DNA was prepared from fresh frozen tumor samples using the QIAamp DNA Mini Kit (Qiagen, Valencia, CA) or a method based on Proteinase K digestion and phenol–chloroform extraction.
Construction of Genomic 1 Mb Array
The 1-Mb array clone set was obtained from the Welcome Trust Sanger Institute, Hinxton, UK (Fiegler et al., 2003). Coordinates for the clones have been obtained from the Ensembl Genome Browser (http://www.ensembl.org/Homo_sapiens, release 27.35a. 1, NCBI 35 assembly, December 14, 2004). Clones which are mapped to more than one chromosome or which repeatedly showed inconsistent copy number in array-CGH analysis were excluded. As a result, a total of 3,038 clones (2555 BACs, 477 PACs, and six cosmids) were included in the analysis, giving an average distance between the clone midpoints of 0.97 Mb.
Construction of the microarray was performed essentially according to the published protocol with minor modifications (Fiegler et al., 2003). Briefly, clone DNA was extracted using a modified alkali lysis method (microprepping) and individually amplified using three different degenerate oligonucleotide (DOP)-PCR primers. The three DOP-PCR products for each clone were then mixed and amplified using a 5′-amine-modified universal primer (amino-PCR). The amino-PCR products were printed in duplicate onto CodeLink slides (Amersham Biosciences, Little Chalfont, UK) using a MicroGrid II robot (Genomic Solutions, Huntingdon, UK) in 4 × 6 subarrays. Further details of the microarray construction have been published elsewhere (McCabe et al., 2006).
Labeling and Hybridization of Array-CGH
Labeling and hybridization were performed essentially as previously described (Seng et al., 2005). Briefly, each microarray was prehybridized with 80 μg of Cot1 DNA (Roche Diagnostics, Mannheim, Germany) and 400 μg of herring sperm DNA (Sigma–Aldrich, St. Louis, MO) for 2 h in hybridization buffer [50% formamide, 10% dextran sulfate, 0.1% Tween 20, 2× saline-sodium citrate (SSC), 10 mM Tris (pH 7.4)]. Four-hundred nanograms of tumor and reference genomic DNA were labeled with Cy5-dCTP or Cy3-dCTP (Amersham Biosciences, Little Chalfont, UK), respectively, using a BioPrime Kit (Invitrogen, Palsely, UK) with custom-made dNTP mix (dCTP 1 mM, dATP 2 mM, dGTP 2 mM, and dTTP 2 mM). A mixture of normal blood DNA from either 20 males or 20 females was used as a sex-mismatched reference. The labeled and purified DNA from test and reference were mixed and coprecipitated with 45 μg of Cotl DNA and 200 μg of Herring sperm DNA. The precipitated DNA was dissolved in hybridization buffer, incubated at 37°C for 2 h and applied to the prehybridized microarrays. Hybridization was performed in a humidified Micro Array Hybridization Chamber (Camlab, Cambridge, UK) at 37°C for 24 h. The arrays were then washed successively in 1× Phosphate buffered saline (PBS)/0.05% Tween 20 at room temperature for 15 min twice, 50% formamide/2× SSC at 42°C for 30 min once, and 1× PBS/0.05% Tween 20 at room temperature for 15 min. Finally, the arrays were briefly rinsed in 1× PBS and dried by centrifugation. The arrays were scanned using a GenePix 4100A personal scanner (Axon Instruments, Union City, CA) and the images quantified using a GenePix Pro 5.1 (Axon Instruments) as previously described (Seng et al., 2005).
Array-CGH Data Analysis
The results were analyzed using Microsoft Excel, as described elsewhere (McCabe et al., 2006). Briefly, after exclusion of spots with weak Cy3 (reference) signals (less than four times the average intensity of six Drosophila BAC spots), the median of test/reference signal intensity ratio in each subarray was calculated and used as a normalization value. The test/reference ratio of each clone was then divided by the normalization value in each subarray, and an average of the normalized ratio between the duplicates was calculated. Spots were excluded when the duplicates differed by more than 10% from their average. The log2 values of normalized test/reference ratio were plotted on abscissa against clone positions on the ordinate.
The ability of 1 Mb array used in this study to discriminate single copy number changes has been validated and the thresholds for copy number changes determined (McCabe et al., 2006). Briefly, the threshold for single copy loss or gain was defined as being greater than three standard deviations from the average test/reference ratio of autosomal clones in a series of normal male/female hybridizations, which is equivalent to a log2 ratio of greater magnitude than −0.21 for loss and greater than +0.18 for gain. Homozygous deletions were defined as log2 ratio of −1.0 or below. The threshold for high-level amplification was set to the log2 value of +1.80 or greater (equivalent to a copy number gain of five or more). The raw data files of the array-CGH including relevant clinical and histopathological data have been submitted to gene expression omnibus archives http://www.ncbi.nlm.nih.gov/geo/query/acc.cgi?acc=GSE56884.
A copy number change was considered significant when a minimum of two adjacent clones were altered. In some cases, although the copy number deviation did not reach the threshold, the same extent of deviation from the baseline was observed for many consecutive clones. These cases were judged as having losses or gains affecting a subpopulation of tumor cells resulting in the intermediate value. Chromosomes X and Y were excluded from the analysis as hybridizations were sex-mismatched for the purpose of hybridization quality control. Reproducibility of the results was confirmed by repeating the experiments in selected cases (not shown). Normalization was done against the 10 Mb panel of clones in each subarray.
Quantification of Copy Number by qPCR
Certain recurrent chromosomal alterations detected by array-CGH were selected for further validation using the TaqMan CopyNumber Assay following the manufacturer's protocol (Applied Biosystems). Assays were selected for two recurrently altered regions, that is, gains on 2p15–16.3 encompassing the BCL11A, REL, PEX13, USP34, XPO1, COMMD1, and OTX1 genes and 19q13.2 covering the MAP4K1 gene (not shown). The target assays for BCL11 (Hs02846256_cn), REL (Hs01779268_cn), PEX13 (Hs04585064_cn), USP34 (Hs00679286_cn), XPO1 (Hs03394660_cn), COMMD1 (Hs02311388_cn), OTX1 (Hs01242264_cn), and MAP4K1 (Hs00189955_cn) were labeled with 6-carboxyfluorescein (FAM) dye whereas the reference gene RNase P (cat. no. 4403328) was labeled with VIC.
The reactions were set up and run on a 96-well plate using a real-time PCR machine (StepOne plus, Applied Biosystems) and a standard amplification method with the following cycling conditions: 95°C for 10 min, followed by 40 cycles of 95°C for 15 sec, and 60°C for 1 min. To enable normalization of the input target DNA added to each well, the internal control RNase P gene was amplified in parallel in the same well along with the target gene and under identical thermal cycling conditions. Each reaction was run in triplicate, and each experiment was repeated twice.
Amplification data for determination of copy numbers were analyzed using the Sequence Detection Software SDS 2.2 (Applied Biosystems). The target gene data were normalized to RNase P (which is always two copies/genome) and calibrated to normal-pooled blood DNA (Promega) which is supposed to have two copies for the gene of interest. Results were exported as text file and analyzed in the CopyCaller software V1.0 (Applied Biosystems) for target gene copy number prediction. DNA for PCR analysis was available from 53 of the 81 tumors (Supporting Information Table2). Raw data results from the qPCR analyses of copy numbers from all analyzed cases are given in Supporting Information Table3.
Table 2.
The Most Frequently Detected (≥20%) Alterations in the Tumor Groups Analyzed by Array-CGH
| Alterationa | Chromosomal region | No of cases (%) |
P-valueb |
||||
|---|---|---|---|---|---|---|---|
| Flanking clone (from pter-qter) | FL prior to transformation | tDLBCL | dnDLBCL | FL vs tDLBCL | tDLBCL vs dnDLBCL | ||
| 1p loss | |||||||
| Subregion FL | 1p35.3–36.11 | RP3–398I9//RP3–437I16 | 8 (53) | 5 (17) | 3 (10) | 0.02 | ns |
| Subregion tDLBCL | 1p36.32–36.33 | CTB-14E10//RP1–37J18 | 6 (40) | 11 (38) | 2 (7) | ns | 0.01 |
| Subregion de novo DLBCL | 1p36.32–36.12 | CTB-14E10//RP11–418J17 | 0–9 (0–53) | 1–11 (3–38) | 2–5 (7–17) | ns-0.008–0.0001-nsc | ns-ns-0.01-ns |
| 2p gain | |||||||
| Subregion FL | 2p15–16.3 | RP11–19A8//RP11–52F10 | 3 (20) | 6–12 (21–41) | 1 (3) | ns | ns−0.001 |
| Subregion tDLBCL | 2p15–16.1 | RP11–260K8//RP11–261A24 | 3 (20) | 12 (41) | 1 (3) | ns | 0.001 |
| 6q loss | |||||||
| Subregion FL | 6q23.2–24.1 | RP11–557H15//RP11–15H7 | 3 (20) | 7–8 (24–28) | 9 (31) | ns | ns |
| Subregion tDLBCL | 6q16.3–16.3 | RP11–117M4//RP3–449G2 | 1 (7) | 9 (31) | 11–12 (38–41) | ns | ns |
| Subregion de novo DLBCL | 6q16.3–22.1 | RP3–449G2//RP3–383B8 | 0 (0) | 7–9 (24–31) | 12 (41) | ns-0.02 | ns |
| 8q gain | |||||||
| Subregion FL | 8q12.2–12.2 | RP11–35A5//RP3–491L6 | 8 (53) | 9–10 (31–34) | 1 (3) | ns | 0.01–0.005 |
| Subregion tDLBCL | 8q12.2–12.2 | RP11–35A5//RP11–35A5 | 8 (53) | 10 (34) | 1 (3) | ns | 0.005 |
| 13q loss | |||||||
| Subregion FL | 13q31.3–32.1 | RP11–632L2//RP11–318K19 | 3 (20) | 6 (21) | 0–1 (0–3) | ns | 0.02–0.05 |
| Subregion tDLBCL | 13q21.1–21.31 | RP11–516G5//RP11–67L17 | 1–2 (7–14) | 8 (28) | 2 (7) | ns | ns |
| Subregion de novo DLBCL | 13q21.32-21.33 | RP11–424E21//RP11–393H6 | 2 (14) | 6–7 (21–24) | 2 (7) | ns | ns |
| 15q loss | |||||||
| Subregion 1 tDLBCL | 15q24.1–24.1 | RP11-8P11//RP11–414J4 | 1 (7) | 8 (28) | 1 (3) | ns | 0.03 |
| Subregion 2 tDLBCL | 15q26.1–26.3 | RP11–326A19//CTB-154P1 | 1 (7) | 8 (28) | 1 (3) | ns | 0.03 |
| Subregion de novo DLBCL | 15q21.1–21.1 | RP11–151N17//RP11–151N17 | 2 (14) | 7 (24) | 5 (7) | ns | ns |
| 17q gain | |||||||
| Subregion 1 tDLBCL | 17q21.33-21.33 | RP11–94C24//RP11–506D12 | 0 (0) | 8 (28) | 0 (0) | 0.04 | 0.004 |
| Subregion 2 tDLBCL | 17q22–23.1 | RP11–19F16//RP11–178C3 | 0 (0) | 8 (28) | 0–2 (0–7) | 0.04 | 0.004-ns |
| 18q gain | |||||||
| Subregion FL | 18q21.1–21.32 | RP11–116K4//RP11–396N11 | 8 (53) | 7–8 (24–28) | 10–11 (34–38) | ns | ns |
| Subregion tDLBCL | 18q21.32-21.32 | RP11–396N11//RP11–396N11 | 8 (53) | 8 (28) | 10 (34) | ns | ns |
| Subregion de novo DLBCL | 18q12.3–21.32 | RP11–486C18//RP11–350K6 | 6–8 (21–28) | 6–7 (21–24) | 11 (38) | ns-ns-0.04-ns | ns |
| 19p loss | |||||||
| Subregion FL | 19p13.3–13.11 | CTC-546C11//CTC-260F20 | 7 (47) | 3–4 (10–14) | 0 (0) | 0.02–0.03 | ns |
| 19q loss | |||||||
| Subregion FL | 19q13.2–13.43 | CTB-186G2//GS1–1129C9 | 7 (47) | 4 (14) | 0 (0) | 0.03 | ns |
| 22q loss | |||||||
| Subregion FL | 22q11.21-13.2 | XX-p273a17//RP1–85F18 | 7 (47) | 6 (21) | 0 (0) | ns | 0.02 |
| Subregion tDLBCL | 22q11.21-13.2 | XX-p273a17//RP1–85F18 | 7 (47) | 6 (21) | 0 (0) | ns | 0.02 |
| No of tumors | 15 | 29 | 29 | ||||
Subregions refer to the most commonly occurring alteration defined by FL, tDLBCL, and dnDLBCL, respectively (see Fig. 1); FL, follicular lymphoma; tDLBCL, transformed diffuse large B-cell lymphoma; dnDLBCL, de novo DLBCL; ns, not significant.
Fishers exact test, significancy is indicated in bold.
Statistical analysis of possible outcomes between the two groups.
Table 3.
Chromosomal Alterations Identified in Transformed Lymphomas
| Tumor no | Case no | Diagnosis | Abberationsa |
|---|---|---|---|
| 45 | 44:1 | DLBCL | −6p22.3 |
| 46 | 44:2 | FL | −6p22.3 |
| 47 | 45:1 | FL | +2p16.1-15, −5q15-q23.2, +6p21.3-12.1, +7, +8, +10p14, −16p13.1-11.2 |
| 48 | 45:2 | DLBCL | +1pter-36.2, +2p16.1-14, −5q15-23.2, +6p21.3-12.1, +7, +8, −9, +10pter-11.2, +11pter-12, +11q14.2-qter, −13pter-q12.3, −16p13.1-11.2, −17p, −18pter-11.2, +18p11.2-qter, −19p13.2-12 |
| 49 | 46:1 | FL | – |
| 50 | 46:2 | DLBCL | −1pter-31.1,+1q21.3-24.3, −3p21.3-21.2, −3q13.3-22.1, −4q, −5pter-p14.1,+7p22.1-14.3, +7q22.1-qter, −8p, +8q13.2-qter,+9q, −11q12.1-13.3, −15, −17p, −19, −20q,+21, −22 |
| 51 | 47:1 | FL | – |
| 52 | 47:2 | DLBCL | +1q21.1-25.3, +5p, −6q23.3-25.2,+12q12-21.1, −16q12.1-23.3 |
| 53 | 48:1 | FL | −1pter-33, +1q25.3-32.1, −1q41-42.3, +2p21-16.2, −3p26.1-25.2, −4pter-16.1, −6p22.1-21.1,+7p22.1-qter,+8, |
| 54 | 48:2 | DLBCL | −1pter-33, +1q25.3-32.1, −1q41-42.3, +2p21-16.2, −3p26.1-25.2,+4p, −6p22.1-21.1,+7p22.1-qter,+8, +9, −10q, −11, +12, −13, +14, −15q, + 17p, +17q, −20q |
| 55 | 49:1 | FL | +3p21.3-21.1, +8q12.1-12.3, + 11 |
| 56 | 49:2 | DLBCL | −1pter-36.2, +3p21.3-21.1, −6p22.1-21.3, −6q13-24.1, +8q12.1-12.3, −9p21.3, −9p.21, −9q33.2-qter, +11, +12p13.3-12.3, −17pter-p.11.2, +17q12-21.3, −17q23.1-25.3, +18pter-q21.3 |
| 57 | 50:1 | FL | +8p11.2-12.1, −8q21.2-22.1, −10q22.2-25.1, −20q11.2-qter |
| 58 | 50:2 | DLBCL | −5q13.3-14.1, −9p21.2-22.1, +9p12-21.2, +12, −14q21.3-22.3 |
| 59 | 51:1 | FL | −1pter-36.2, +1q, +3, + 4p15.3, −4q13.2-21.2, +5, +6pter-21.1, +7, +9, −13q12.3-12.1, −16q21, +18pter-q21.3, −22 |
| 60 | 51:2 | DLBCL | −1pter-33, +1q, +3, +4p15.3, +5, +6pter-21.1, +7, +9, −11pter-13, −12q23.2-qter, −13q12.3-14.3, −15q23, −16q21-23.1, +18pter-q22.1, −19q, −20, −22 |
| 62 | 53:1 | FL | −1pter-12, −4pter-16.1, −7q21.1-22.1, +7q22.1-31.33, +9p13.2-21.1, −11p12-q14.1, +18, −20q, −22 |
| 63 | 53:2 | DLBCL | −1pter-12, +2p-q14.2, −2q23.3-qter, −4pter-16.1, −6p22.1-21.1, −7q21.1-22.1, +7q22.1-31.3, +9p13.2-q21.1, −11p12-q14.1, −15, −17pter-q21.3, +17q21.3-qter, +18, −20q, −22 |
| 65 | 55.1 | FL | +1pter-36.2, +1q, +11, −13q21.1-34, +18, +19 |
| 66 | 55:2 | DLBCL | +1pter-36.2, −3p13-q21.1, −8pter-23.2, −9pter-21.1, +11, −13q21.1-34, +16p13.11-q12.1, + 18, +19 |
| 67 | 56:1 | FL | −1p34.2-12, −4p16.2-15.1, −7q35-36.3, −9pter-13.3, + 9p13.3-qter, −12pter-q13.1, −13, −14q24.3-31.1, −18, −22 |
| 68 | 56:2 | DLBCL | +1pter-p34.2, −1p34.2-12, −2q31.1-32.2, −4p16.2-15.1, −5q13.2-14.3, −7q35-36.3, −9pter-13.3, +9p13.3-qter, −10q23.1-23.3, −12pter-q13.1, −13, −14q24.3-13.1, −17p, +19q, −22 |
| 69 | 57:1 | FL | −1p36.2-35.1, +8, +11q24.2-qter |
| 70 | 57:2 | DLBCL | −1p36.23-35.1, +6p22.3, +8, +11q24.2-qter, +12p13.3-12.3 |
| 71 | 58:1 | FL | −3p26.1-25.1, +3p25.1-22.1, −6q12-24.1, +8, −9p22.1-21.3, −17, −19 |
| 72 | 58:2 | DLBCL | +2p16.3-14, +6pter-q12, −6q12-24.1,+7, −9p22.1-21.3, +13q33.3-34, −17, −19 |
| 73 | 58:3 | DLBCL | +2p16.3-14, +6pter-q12, −6q12-24.1, +7, −9p22.1-21.3, +13q33.3-34, −17, −19 |
| 74 | 59:1 | FL | −1pter-23.3, −4pter-15.2, −7pter-21.3, −11p13-q14.1, −12q24.1-qter, −17, +18, −19, −22 |
| 75 | 59:2 | FL | −1pter-32.3, +1q31.1-qter, +2p23.3-15, −17pter-p12, +18, −19, −22 |
| 76 | 59:3 | FL | −1pter-32.3, +1q23.3-24.2, +2p16.3-14, −3pter-25.3, +3q22.2-qter, −4q31.2-34.1, −6q22.3-24.1,+7q21.1-31.1, +8q, −9p23-21.1, +9q21.1, +11pter-11.2, +11q22.3-23.3, −11q23.3-qter, −13q31.3-qter, −14q21.3-24.2, +15pter-15.1, −15q15.1-qter, −17p, +18 |
| 77 | 59:4 | DLBCL | −1pter-32.3, +1q23.3-24.2, −2p23.1-16.3, +2p16.3-14, −3pter-25.3, +3q22.2-qter, −4p12-q21.1, −4q31.2-34.1, +6pter-24.3, −6p21.1-12.2, −6q14.1-25.2, +7pter-14.1, +7q11.2-32.1, +8q, +9pter-22.3, −9p22.3-21.3, +9q21.1, +9q22.3-33.2, +10p, −10q26.1-qter, +11pter-15.1, +11q22.3-23.3, −11q23.3-qter, −13(homozygot), +15pter-q15.1, −15q15.1-qter, −17p, +18q21.3-23, −19, −22 |
| 78 | 60:1 | FL | −1pter-34.3,+1q22-qter, +11pter-11.2, −14q24.2-qter, −15q14-21.1, −19 |
| 79 | 60:2 | FL | −1pter-34.3, +1q22-qter, +11pter-11.2, −14q24.2-qter, −19, −22 |
| 80 | 60:3 | FL | −1pter-32.3, +1q21.3-qter, +2pter-12, +3p25.1-qter, +4q31.2-qter, +5, −6pter-21.1, +7, +8, +9q21.1-33.3, −10q21.3-qter, −11q12.1-qter, +12q13.3-21.3, +13, −14q23.3-qter, −16, −17p, −19, −22 |
| 81 | 60:4 | FL | −1pter-32.3, +1q21.3-qter, +2pter-12, +4q31.2-qter, +5, −6pter-21.1, +7, +8, +9q21.1-33.3, −10q21.3-qter, −11q12.1-qter, −12q13.3-21.3, +13, −14q23.3-qter, −16, −17p, −19, −22 |
| 82 | 60:5 | DLBCL | −1p, +1q21.2-qter,+2pter-12, +4q31.2-qter, +5, −6p22.3-qter, +7, +8, +9q21.1-33.3, −10, +12p13.1-q21.3, −14q31.3-qter, −17p, +20, −22 |
High level amplification is indicated in bold; DLBCL, diffuse large B-cell lymphoma; FL, follicular lymphoma.
Immunohistochemistry
Formalin-fixed paraffin embedded sections (4-µm thick) from seven cases with detected 2p amplification (cases 12, 21, 23, 31, 45, 58, and 59), 5 DLBCL GC type without 2p changes (cases 4, 6, 16, 17, and 18), 5 DLBCL non-GC type without 2p changes (cases 2, 7, 8, 13, and 15) and six cases of low grade FL (control samples) were immunostained using Bond-Max system (Leica Newcastle Upon Tyne, UK). Deparaffinization was done at 75°C using Bond Dewax solution. Dehydration was performed using ethanol, and rehydration by Bond wash solution 10× concentrate. Ethylenediaminetetraacetic acid (EDTA) buffer pH 8.9–9.1 (Bond Epitope Retrieval Solution 2 catalog no. AR9640) was used for antigen retrieval at 25°C.
Slides were incubated with polyclonal rabbit anti-human BCL11A [N-terminus, LS-B3530-50, Nordic BioSite (1:600)] and mouse monoclonal anti-human REL [N-terminus, Santa Cruz Biotechnology (1:800)] for 20 min at room temperature. Polymeric horseradish peroxidase-anti-mouse rabbit IgG reagent was used and staining was visualized with diaminobenzidine (Bond Polymer Refine Detection Kit, catalog no. DS 9800). Images were acquired using the Olympus BX51 microscope and digital camera Olympus U-TV0.5XC-3.
Statistical Analysis
Differences between the studied groups were evaluated by statistical analysis using the software system SigmaPlot v.11.0 (Systat Software, Inc., CA). The Fisher's exact test (two tail) was applied to determine difference in studied groups. Results were considered as statistically significant with P-values less than 0.05.
Results
Overall Whole Genome CGH Array Alterations
The tumors were categorized into (a) FL prior to transformation, (b) tDLBCL, and (c) dnDLBCL (Table2). The dnDLBCL tumors were furthermore divided into GC and non-GC categories based on immunohistochemistry according to Hans algorithm (Hans et al., 2004). All tDLBCL, both the paired and nonpaired samples, were of GC immunophenotype.
Studies based on paired tumor samples are of the highest importance to outline chromosomal changes occurring during the transformation from FL to tDLBCL. However, samples where both FL and tDLBCL counterparts are available from the same patient are scarce, and we have therefore analyzed also samples of tDLBCL, with known FL history, but no available diagnostic FL samples. Alterations detected in each tumor category are shown in Figure 1.
Figure 1.
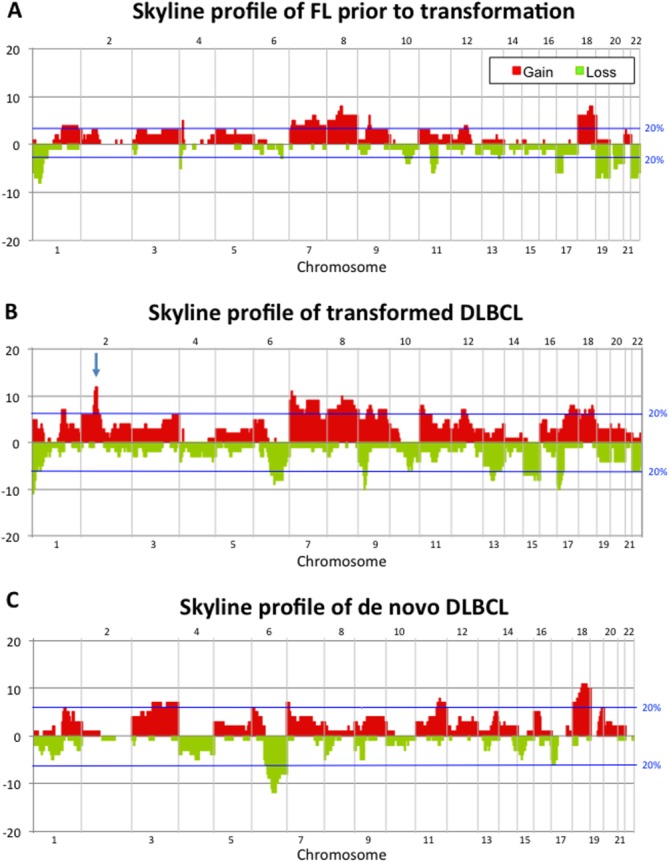
Skyline profiles showing the alterations identified by array-CGH in (A) FL prior to transformation, (B) tDLBCL as well as in (C) dnDLBCL tumors. Gains are indicated in red and losses in green. The blue lines indicate the threshold for alterations identified in at least 20% of the tumors. The arrow in (B) pinpoints 2p amplifications encompassing, among others, the BCL11A and REL-genes. [Color figure can be viewed in the online issue, which is available at http://wileyonlinelibrary.com.]
In general, gains were more common than losses and more aberrations were found in tDLBCL than in dnDLBCL. The selected alterations were further narrowed down in each tumor group into a minimal altered region defined by the most frequently occurring aberration. The regions of greatest significance in each group are listed in Table2. The significance of each alteration was evaluated in tDLBCL vs. FL as well as tDLBCL versus dnDLBCL.
Alterations of Importance for the Transformation Process
In an attempt to outline chromosomal changes occurring during histological transformation from FL to tDLBCL, we found that gains at 17q21.33 (P < 0.04) and 17q22–23.1 (P < 0.04) were statistically more often seen in the tDLBCL (Table2). We also found a tendency for higher frequency of losses at 6q16.3 (P < 0.08) (Supporting Information Table1). This region, encompassing among others the SIM1, RNAH, GRIK2, and DJ467n11.1 genes, is frequently deleted in hematological malignancies including DLBCL of both de novo and transformed origin (Berglund et al., 2007; Thelander et al., 2008).
When comparing the alterations detected in the tDLBCL to those found in the dnDLBCL (Table2), changes of interest were losses of 1p36.32–36.33 (P < 0.01), 13q31.3–32.1 (P < 0.02), 15q24.1 (P < 0.03), 15q26.1–26.3 (P < 0.03), and 22q11.21-13.2 (P < 0.02), and gains in 2p15–16.1 (P < 0.001), 8q12.2 (P < 0.005), 17q21.33 (P < 0.004), and 17q22–23.1 (P < 0.004).
Early and Late Events During Transformation
Paired samples from 15 patients (cases 44–51, 53, and 55–60) with two or more tumors collected throughout the course of transformation were available, permitting a more thorough analysis of the progression of specific chromosomal events during the transformation process. The aberrations identified in each individual tumor are listed in Table3, and the most commonly occurring alterations (detected in two or more paired tumors) are given in Supporting Information Table4. Gain of 2p15.1–16.1 was among the most frequently changed regions (29% of FL and 38% of tDLBCL).
Table 4.
The Most Frequent Array-CGH Alterations in FL in Relation to the Total Number of Alterations
| Case no | No of alt | −6 | +8 | −1p | −20q | −10 | +1q | −19 | −22 | −15q | +2p15-16 | +7 | +6p | +18q | −13q | −17p | −9p21 | −14q |
|---|---|---|---|---|---|---|---|---|---|---|---|---|---|---|---|---|---|---|
| 46:1 | 0 | |||||||||||||||||
| 47:1 | 0 | |||||||||||||||||
| 44:2 | 1 | −6p22.3 | ||||||||||||||||
| 49:1 | 3 | +8q12.1-12.3 | ||||||||||||||||
| 57:1 | 3 | +8 | −1p36.2-35.1 | |||||||||||||||
| 50:1 | 4 | +8p11.2-12 | −20q11.2-qter | −10q22.2-25.1 | ||||||||||||||
| 60:1 | 6 | −1pter-34.3 | +1q22qter | −19 | ||||||||||||||
| 60:2 | 6 | −1pter-34.3 | +1q22qter | −19 | −22 | −15q14-21.1 | ||||||||||||
| 45:1 | 7 | +8 | +2p15-16 | +7 | +6p21.3-12.1 | |||||||||||||
| 55:1 | 7 | +1q | +18 | −13q | ||||||||||||||
| 59:2 | 7 | −1pter-32 | +1q31.1-qter | −19 | −22 | +2p15-16 | +18 | −17pter-p12 | ||||||||||
| 58:1 | 7 | −6q12-24.1 | +8 | −19 | −17 | −9p22-21.3 | ||||||||||||
| 48:1 | 9 | −6p22.1-21.1 | +8 | −1pter-33 | +1q25.3-32.1 | +2p15-16 | +7p22.1-qter | |||||||||||
| 53:1 | 9 | −1pter-12 | −20q | −22 | +7q22.1-31.3 | +18 | ||||||||||||
| 56:1 | 9 | −1p34.2-12 | −22 | −13 | −9pter-13.3 | −14q24.3-31-1 | ||||||||||||
| 59:1 | 9 | −1pter-23.3 | −19 | −22 | +18 | −17 | ||||||||||||
| 51:1 | 11 | −1pter-36.2 | +1q | −22 | +7 | +6pter−21.1 | +18pter-q21.3 | |||||||||||
| 60:4 | 18 | −6pter-21.1 | +8 | −1pter-32.3 | −10q21.3-qter | +1q21.3-qter | −19 | −22 | +2pter-12 | +7 | −17p | −14q23.3-qter | ||||||
| 60:3 | 19 | −6pter-21.1 | +8 | −1pter-32.3 | −10q21.3-qter | +1q21.3-qter | −19 | +2pter-12 | +7 | −17p | −14q23.3-qter | |||||||
| 59:3 | 20 | −6q22.3-24.1 | +8q | −1pter32.3 | +1q23.3-24 | −15q15.1-qter | +2p14-16 | +7q21.1-31.1 | +18 | −13q | −17p | −9p23-21.1 | −14q21.3-24.2 |
Bold indicates high level amplification; FL, Follicular Lymphoma; alt, alteration.
To outline the succession of chromosomal gains or losses during histological transformation, we studied the alterations in relation to number of changes in each individual tumor among the FL-tDLBCL pairs (Tables4 and 5). Losses of 9p, 13q, 14q, and 17p and gains in 2p, 6p, 7q, and 18 were detected in FL tumors with ≥7 alterations (Table4) and were therefore considered as late events in the FL prior to transformation. In the tDLBCL, losses of 1p, 6p, 6q, 9p, and 14q as well as gains of 1q, 6p, 8q, and 12q were considered as early events as these abnormalities appeared in the tumors with five alterations or less (Table5). Thus, losses of 9p and 14q as well as gains of 6p were identified as late events in FL prior to transformation and as early in tDLBCL, indicating that genes within these regions may be of importance for the peritransformational phase.
Table 5.
The Most Frequent Array-CGH Alterations in tDLBCL in Relation to the Total Number of Alterations
| Case no | No of alt | −6p | −9p | −14q | +6p | −1p | +8 | −6q | +1q | +12q | +2p15−16 | −17p | +7 | −19 | +1p | −13q | +18q | +17q | −22 | −10 | −15q | −20q |
|---|---|---|---|---|---|---|---|---|---|---|---|---|---|---|---|---|---|---|---|---|---|---|
| 44:1 | 1 | −6p22.3 | ||||||||||||||||||||
| 50:2 | 4 | −9p21.2−22.1 | −14q21.3−22.3 | |||||||||||||||||||
| 57:2 | 4 | +6p22.3 | −1p36.2–35 | +8 | ||||||||||||||||||
| 47:2 | 5 | −6q23–25.2 | +1q21.1–25.3 | +12q12–21.1 | ||||||||||||||||||
| 58:2 | 8 | +6pter-q12 | −6q12–24.1 | +2p14–16 | −17 | +7 | −19 | |||||||||||||||
| 55:2 | 9 | −9pter-21.1 | +1pter-36.2 | −13q21.1–34 | +18 | |||||||||||||||||
| 49:2 | 14 | −6p22.1–21.3 | −9p21.3 | −1pter-36.2 | +8q12 | −6q13–24 | −17pter-11.2 | +17q12–21 | ||||||||||||||
| 56:2 | 14 | −9pter-13.3 | −14q24.3–13.1 | 1p34.2–12 | −17p | +1pter-34.2 | −13 | −22 | −10q23.1–23.3 | |||||||||||||
| 53:2 | 15 | −6p22.1–21.1 | −1pter-12 | +2p16-q14.2 | −17pter-q21 | +7q22.1–31.3 | +18 | +17q21.3-qter | −22 | −15 | −20q | |||||||||||
| 60:5 | 15 | −6p22.3-qter | −14q31.3-qter | −1p | +8 | +1q21.2-qter | +12p13.1−q21.3 | +2pter-12 | −17p | +7 | −22 | −10 | ||||||||||
| 45:2 | 17 | −9 | +6p21-12 | +8 | +2p14–16 | −17p | +7 | −19p13.2–12 | +1pter-36.2 | |||||||||||||
| 46:2 | 17 | −1pter-31 | +8q13-qter | +1q21.33-24.3 | −17p | +7p22-14 | −19 | −22 | −15 | −20q | ||||||||||||
| 51:2 | 17 | +6pter-21.1 | −1pter-33 | +1q | +7 | −19q | −22 | −15q23 | −20 | |||||||||||||
| 48:2 | 18 | −6p22.1–21.1 | −1pter-33 | +8 | +1q25.3–32.1 | +12 | +2p16–21 | +7p22.1-qter | +17q | −10 | −15q | −20q | ||||||||||
| 59:4 | 30 | −6p21.1–12.2 | −9p22.3–21.3 | +6pter-24.3 | −1pter-32.3 | +8q | −6q22.3–24 | +1q23.3–24.2 | +2p14–16.3 | −17p | +7pter-14.1 | −19 | −13 | +18q21.3–23 | −22 | −10q26.1-qter | −15q15.1-qter | |||||
Bold indicate high level amplification; tDLBCL, transformed diffuse large B-cell lymphoma; alt, alteration.
Lymphoma of GC and Non-GC Origin
Clinically, non-GC origin of DLBCL is considered to be more aggressive than the GC subtype (Hans et al., 2004). Among the GC DLCBL, the transformed tumors have a less favorable clinical outcome compared with the de novo cases. In our series, all tDLBCL had GC-related immunophenotype. An attempt was made to compare the alterations identified in GC (10 tumors) vs. non-GC (19 tumors) subcategories of dnDLBCL (Supporting Information Table1). The statistical analysis indicated that a deletion of 1p36.32–36.33 is more common in the GC group (20% vs. 0%, P < 0.053). However, in our study a relatively small number of tumors was available for analysis in the two groups studied and was therefore not considered further. The importance of this alteration could be investigated in larger tumor series.
Furthermore, only one of the dnDLBCL tumors showed 2p amplification and this was interestingly of GC origin (Supporting Information Table1 and Figs. 1A and 1B). When comparing the CGH-derived dnDLBCL with the tDLBCL (which are all of GC origin) regarding amplification of 2p15–16, the difference is not significant (P < 0.12), indicating that this alteration may reflect cell of origin distribution (GC origin) rather than an oncogenic event related to transformation. However, our data on subsequent FL-tDLBCL tumors strongly indicate an involvement of this region in the transformation. This aspect is therefore further discussed below.
Amplification of 2p15–16
A gain of 2p15–16 was seen in 3/15 (20%) FL, 12/29 (41%) tDLBCL and in 1/29 (3%) of the dnDLBCL (GC origin) tumors (Table2). Interestingly, the only dnDLBCL tumor that showed a 2p amplification was of GC origin (Supporting Information Table1 and Figs. 1A and 1B), as is all tDLBCL. This could indicate that this DLBCL was in fact of transformed origin with a previously unknown FL counterpart. Notably, the only alteration that was detected as a high level amplification encompassed 2p15–16.3 carrying, among others, the BCL11A, REL, PEX13, USP34, XPO1, COMMD1, and OTX1 genes. These were therefore subjected to further analysis using qPCR (Table6 and Supporting Information Table2). The 16 lymphoma samples showing more or less than two copy numbers of the analyzed genes in 2p15–16.3 are listed in Table6. The highest level of amplification within this region was seen in USP34 (3–20 times) whereas the lowest level was noted for BCL11A (3–8 times). The most frequently amplified gene among the analyzed tumors was PEX13 (in eight tumors) and the least occurring was OTX1 (in five tumors; Case 59 was excluded from the comparison as DNA was not available for all the analyses).
Table 6.
Gene Copy Number Estimated by Quantitative Real-Time PCR [Color table can be viewed in the online issue, which is available at http://wileyonlinelibrary.com.]
| Detected copy number |
||||||||
|---|---|---|---|---|---|---|---|---|
| Case no | Diagnosis | BCL11A | REL | PEX13 | USP34 | XPO1 | COMMD1 | OTX1 |
| 2 | DLBCL | 2 | 2 | 3 | 1 | 1 | 1 | 1 |
| 5 | DLBCL | 2 | 2 | 2 | 1 | 2 | 2 | 1 |
| 7 | DLBCL | 2 | 1 | 2 | 1 | 2 | 1 | 1 |
| 12 | DLBCL | 2 | 3 | 3 | 3 | 2 | 3 | 2 |
| 17 | DLBCL | 2 | 2 | 2 | 1 | 2 | 2 | 2 |
| 20 | DLBCL | 3 | 3 | 3 | 3 | 3 | 3 | 2 |
| 21 | DLBCL | 7 | 9 | 8 | 10 | >8 | 6 | >9 |
| 23 | DLBCL | 3 | 4 | 4 | 4 | 4 | >4 | 4 |
| 31 | DLBCL | 3 | 3 | 3 | 3 | 3 | 3 | 3 |
| 45:1 | FL | 2 | 2 | 3 | 2 | 2 | 2 | 2 |
| 45:2 | DLBCL | 3 | 10 | 16 | 20 | 6 | 9 | 8 |
| 58:2 | DLBCL | 8 | 7 | 12 | 13 | 8 | 9 | 2 |
| 58:3 | DLBCL | 6 | 7 | 10 | 11 | 9 | 9 | 3 |
| 59:2 | FL | 3 | 3 | na | na | na | na | na |
| 59:3 | FL | 7 | 9 | na | na | na | na | na |
| 59:4 | DLBCL | 6 | 6 | na | na | na | na | na |
DLBCL, diffuse large B-cell lymphoma; FL, follicular lymphoma; Losses are indicated in green and gains in red; na, DNA not available.
Discussion
Alterations of Importance for the Transformation Process
In an attempt to outline chromosomal regions that are lost or gained during histological transformation from FL to tDLBCL, we performed a comparison of the alterations identified by array-CGH in three studied groups, that is, FL, tDLBCL as well dnDLBCL (Supporting Information Table1). A comparison between the tDLBCL and dnDLBCL indicates alterations that differ between the transformed and the de novo cases and is therefore indicative of transformation as well as de novo specific alteration. Using a Fisher's exact test, we identified statistically significant regions of interest (Table2) among which amplification of 2p15–16 appeared to be the most significant (P < 0.001). This alteration has mainly been reported in the group of GC-DLBCL and never observed in the ABC subtype (Lenz et al., 2008). However, it should be noted that the dnDLBCL predominantly (19/29 = 66%) belong to the non-GC group and a comparison between dnDLBCL and tDLBCL may rather reflect the GC vs. non-GC cell of origin. The 2p15–16 region was the only one in our tumor setting where a high level amplification was detected and was therefore studied further (discussed below).
We also examined the difference in alterations between the FL and the tDLBCL groups. However, these two groups are genetically linked by clonal evolution from FL to tDLBCL meaning that alterations of importance for the transformation process appear already in the FL and not only in the tDLBCL counterpart (Berglund et al., 2007). Therefore, alterations of importance for the initiation of transformation would appear already within the FL counterpart, and may not be identified as statistically different between these two subgroups studied and could therefore be missed. The chromosomal regions that appeared as statistically significant (Table2) may rather indicate alterations of importance for the early phase of tDLBCL rather than for the initiation of the transformation process.
Early tDLBCL Phase
Interestingly, we noted that a gain encompassing 17q21.33 was exclusively found in tDLBCL (P < 0.004)(Table2) indicating that an upregulation of this region may be of greater importance later in the transformation process rather than in the initiation phase, as it was not observed in the FL counterpart. It has previously been speculated that a gain of 17q, and in particular 17q21, is of importance in the histological transformation of FL to tDLBCL (Martinez-Climent et al., 2003; Nanjangud et al., 2007). One possible candidate, located in 17q21.33, that could be considered of importance in tumorigenesis is the NME1/NM23 gene that is involved in the transcriptional regulation of both NMYC and MYC. High expression of NME1/NM23 has been associated with decreased metastasis in breast cancer as well as in melanoma. However, in non-Hodgkin lymphoma it has been associated with adverse outcome (Niitsu et al., 2001) and is therefore a good target for further investigation.
The Peri-Transformation Phase
We found that loss of 6q16.3-24.1 is common during the transformation process from FL to tDLBCL as shown in other studies (Berglund et al., 2007; Nanjangud et al., 2007; Eich et al., 2010; Lossos and Gascoyne, 2011; Bouska et al., 2014). This chromosomal region is large but still very few candidate genes have been identified. In our previous study, we identified loss of 6q16-21 as a transitional change that was more common in tDLBCL than in FL (Berglund et al., 2007; Rane et al., 2011). This region is also frequently lost in solid tumors and SEN6A has been postulated as a tumor suppressor gene (Rane et al., 2011). In our setting, the minimal deleted regions at 6q16.3 that was found in the tDLBCL tumors were not observed as lost in the FL tumors (Table2). The 6q deletions identified in the FL tumors were situated more distal at 6q23.2-24.1 (Table2). Candidate genes in this region are TNFAIP3 as well as PERP and have earlier been discussed as targets in FL (Henderson et al., 2004; Ross et al., 2007; Schwaenen et al., 2009; Bouska et al., 2014).
However, the most striking finding in our study appears to be the amplification of the 2p15-16 that was found to be the most frequently gained region in the peritransformation phase. This will be more thoroughly discussed below.
Other statistically different alterations between the FL and tDLBCL were found, such as losses of 1p35.3-36.11 (P < 0.02), 19p13 (P < 0.02), and 19q13 (P < 0.03). Losses of these regions were more common in the FL than in the tDLBCL counterpart (Table2). This could be interpreted as if genes encompassed by these alterations are not directly involved in the initiation of the transformation. It is interesting to note that none of the dnDLBCL displayed any such alterations in chromosome 19.
As mentioned earlier, loss of 9p and 14q as well as gain of 6p were noted as late FL events and as early tDLBCL events (Tables4 and 5) indicating involvement in the peritransformational phase. Loss of 9p and gain of 6p were also more frequent in tDLBCL compared to FL in the paired samples. The CDKN2A/P14ARF gene located at 9p21 is a strong candidate and has previously shown to be involved in the transformation of FL (Lossos and Gascoyne, 2011). Furthermore, the CCND3 gene at 6p21 has previously been suggested to be involved in the transformation from FL to tDLBCL (Martinez-Climent et al., 2003). In a recent paper by Okosun et al. (2014) on transformation from FL to tDLBCL, it is stated that no single compelling genetic event could be identified as responsible for transformation but that distinct genetic alterations may prompt the onset of aggressive disease. However, in our series of subsequent and paired tumors, we strongly believe that an upregulation of genes in 2p15–16 could be such a translocation prone alteration.
Amplification of the Region 2p15-16
When tDLBCL were compared with dnDLBCL, the statistically most significant change by array-CGH was an amplification of 2p15–16.3 (P < 0.001) encompassing, among others, the BCL11A, REL, PEX13, USP34, COMMD1, and OTX1 genes. This region was found to be most frequently gained in the FL samples collected prior to transformation as well as the first tDLBCL samples immediately after transformation. Notably, in all tDLBCL tumors, a high level amplification was observed indicating its significance in the transformation process. A discussion has previously been raised concerning if the true target gene in this amplicon is REL, BCL11A or both. REL has been shown to be more frequently amplified and it may therefore play a more important role than BCL11A in the pathogenesis of the tDLBCL (Fukuhara et al., 2006). This hypothesis is also supported by our investigation using qPCR which showed a higher level of amplifications of REL compared to BCL11A in cases with 2p15–16.3 amplifications (Table6). In case 31, equal copy numbers were detected in REL and BCL11A (i.e., three copies of each), whereas in cases 12, 21, 23, 45, and 59 the copy numbers of BCL11A ranged from 2 to 7 copies whereas REL showed 2 to10 copies (Table6). In case 45:2, the difference was highest with three copies of BCL11A and 10 copies of REL indicating that REL may be the driver gene. In case 59, tumors 2 and 4 showed equal copy numbers that is, 3 and 6, respectively. However, the intermediate tumor 59:3 showed a difference of seven copies for BCL11A and nine copies of REL. Interestingly, this tumor is a FL just prior to transformation to tDLBCL.
However, we also investigated the PEX13, USP34, XPO1, COMMD1, and OTX1 genes included in the 2p15–16.3 amplicon. We noted that the highest level of amplification was seen for USP34 that was amplified up to 20 times, showing the highest amplification in three cases (tumors 21, 45:2, and 58:2). USP34 has previously showed to be involved as a negative regulator of the NF-κB signaling pathway in lymphocytes; however, it is most extensively studied in T-cells (Poalas et al., 2013). PEX13 appeared as the most commonly amplified (eight cases) whereas OTX1 was the least commonly amplified (four cases) even though the level of amplification of OTX1 was in general higher compared with BCL11A. The OTX1 protein acts as a transcription factor and has been suggested to be of importance in B-cell maturation (Omodei et al., 2009) making it an interesting candidate for further analysis of involvement in the transformation process. Notably, in cases 45:1 and 45:2 (Table6), representing the FL and tDLBCL counterparts from the same patient, the biggest increase in copy numbers were noted for USP34 (from 2 to 20 copies), PEX13 (from 3 to16 copies), and REL (from 2 to10 copies), indicating the importance of these three genes for transformation.
Taken together, these findings indicate that the REL gene can be of greater importance than BCL11A as a driver gene for the transformation process from FL to tDLBCL. However, the other genes within the 2p15-16.3 amplicon could also be of importance for the tumor transformation as all of them show a significant level of amplification. Their importance for the transformation process remains to be illuminated. In cases 45, 58, and 59, more than two subsequent tumors were available for further analysis during the transformation process. In two of these (45 and 58), the amplification of 2p15-16 was first seen in the tDLBCL whereas it was absent in the FL prior to transformation (Fig. 2). However, in case 59, amplification was seen already in the FL stage of disease (tumor 59:3), indicating that this alteration occurs early in the transformation process and drives the transformation rather than being a result of it. Notably, a tendency to amplification was seen already in tumor 59:2 (Fig. 2 and Table6) which is the FL tumor preceding the FL prior to transformation (59:3). Therefore, we suggest that amplification of 2p15-16 could be associated with the transformation process and that this alteration may possibly serve as a biomarker for the detection of FL with a potential to transform to tDLBCL as well as to discriminate between dnDLBCL and tDLBCL (Figs. 3 and 4).
Figure 2.

(A) Array-CGH profiles of chromosome 2 from subsequent tumors from cases 45, 58, and 59 showing progression with high level amplification of 2p15-16, encompassing the BCL11A and REL genes. The dotted line indicates the transformation from FL to tDLBCL. The blue arrow indicates the amplification encompassing the BCL11A and REL genes. (B) qPCR showing copy numbers of BCL11A and REL in the subsequent tumors from cases 45 and 59, respectively. [Color figure can be viewed in the online issue, which is available at http://wileyonlinelibrary.com.]
Figure 3.
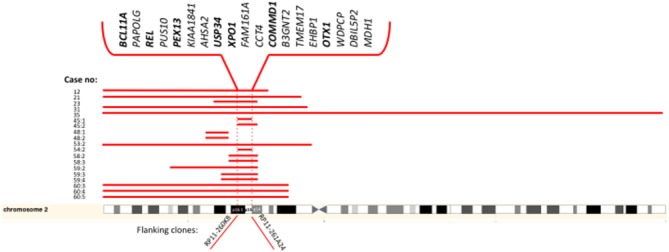
Genes located within the minimal region of gain in 2p15-p16.1 identified in transformed tumors by array-CGH. The clones flanking the minimal region are indicated below. Genes that have been further investigated by qPCR in this study are indicated in bold. [Color figure can be viewed in the online issue, which is available at http://wileyonlinelibrary.com.]
Figure 4.
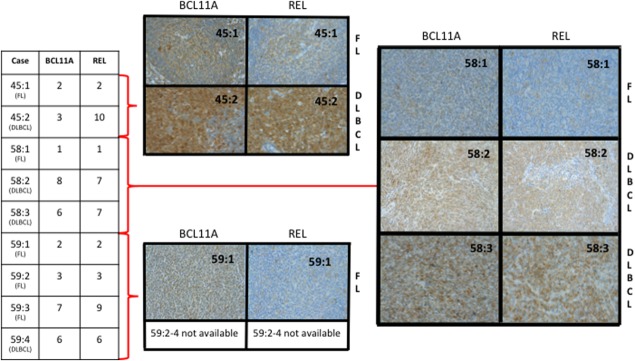
Immunohistochemistry of BCL11A and REL performed on subsequent tumors of transformed lymphoma from cases 45, 58, and 59 showing a correlation between copy numbers by qPCR (left) and the protein expression (right). FL = follicular lymphoma; DLBCL = diffuse large B-cell lymphoma. [Color figure can be viewed in the online issue, which is available at http://wileyonlinelibrary.com.]
In summary, we identified differential genomic events between dnDLBCL and tDLBCL that may be of importance in the histological transformation from FL to tDLBCL, as well as reflect the GC vs. non-GC cell of origin. The chromosomal region 2p15-16 appeared as a high level amplification in all of the tDLBCL tumors where it was detected, underlining its significance in the transformation process. Notably, it was in one case shown to be amplified already in the FL counterpart prior to the paired tDLBCL tumor, indicating its importance for the peritransformation phase. Taken together, 2p15-16 amplification in lymphoma serve as a marker for early recognition of disease progression and we suggest that REL, PEX13, and USP34 may be driver genes rather than BCL11A as previously suggested. Furthermore, a gain of 17q21-23 was exclusively detected in tDLBCL, making this region of interest for candidate genes involved in the late transformation process. We also confirm the impact of the TP53-, NF-κΒ−, and CDKN2A pathways in the transformation process from FL to tDLBCL.
Acknowledgments
The authors are grateful to Ann Kaufeldt for her expert technical assistance with the immunohistochemistry.
Additional Supporting Information may be found in the online version of this article.
References
- Berglund M, Enblad G, Thunberg U, Amini RM, Sundstrom C, Roos G, Erlanson M, Rosenquist R, Larsson C, Lagercrantz S. Genomic imbalances during transformation from follicular lymphoma to diffuse large B-cell lymphoma. Mod Pathol. 2007;20:63–75. doi: 10.1038/modpathol.3800708. [DOI] [PubMed] [Google Scholar]
- Bouska A, McKeithan TW, Deffenbacher KE, Lachel C, Wright GW, Iqbal J, Smith LM, Zhang W, Kucuk C, Rinaldi A, Bertoni F, Fitzgibbon J, Fu K, Weisenburger DD, Greiner TC, Dave BJ, Gascoyne RD, Rosenwald A, Ott G, Campo E, Rimsza LM, Delabie J, Jaffe ES, Braziel RM, Connors JM, Staudt LM, Chan WC. Genome-wide copy-number analyses reveal genomic abnormalities involved in transformation of follicular lymphoma. Blood. 2014;123:1681–1690. doi: 10.1182/blood-2013-05-500595. [DOI] [PMC free article] [PubMed] [Google Scholar]
- Campo E, Swerdlow SH, Harris NL, Pileri S, Stein H, Jaffe ES. The 2008 WHO classification of lymphoid neoplasms and beyond: Evolving concepts and practical applications. Blood. 2011;117:5019–5032. doi: 10.1182/blood-2011-01-293050. [DOI] [PMC free article] [PubMed] [Google Scholar]
- Conconi A, Ponzio C, Lobetti-Bodoni C, Motta M, Rancoita PM, Stathis A, Moccia AA, Mazzucchelli L, Bertoni F, Ghielmini M, Cavalli F, Zucca E. Incidence, risk factors and outcome of histological transformation in follicular lymphoma. Br J Haematol. 2012;157:188–196. doi: 10.1111/j.1365-2141.2012.09054.x. [DOI] [PubMed] [Google Scholar]
- Eich HT, Diehl V, Gorgen H, Pabst T, Markova J, Debus J, Ho A, Dorken B, Rank A, Grosu AL, Wiegel T, Karstens JH, Greil R, Willich N, Schmidberger H, Dohner H, Borchmann P, Muller-Hermelink HK, Muller RP, Engert A. Intensified chemotherapy and dose-reduced involved-field radiotherapy in patients with early unfavorable Hodgkin's lymphoma: Final analysis of the German Hodgkin Study Group HD11 trial. J Clin Oncol. 2010;28:4199–4206. doi: 10.1200/JCO.2010.29.8018. [DOI] [PubMed] [Google Scholar]
- Fiegler H, Carr P, Douglas EJ, Burford DC, Hunt S, Scott CE, Smith J, Vetrie D, Gorman P, Tomlinson IP, Carter NP. DNA microarrays for comparative genomic hybridization based on DOP-PCR amplification of BAC and PAC clones. Genes Chromosomes Cancer. 2003;36:361–374. doi: 10.1002/gcc.10155. [DOI] [PubMed] [Google Scholar]
- Fisher RI, LeBlanc M, Press OW, Maloney DG, Unger JM, Miller TP. New treatment options have changed the survival of patients with follicular lymphoma. J Clin Oncol. 2005;23:8447–8452. doi: 10.1200/JCO.2005.03.1674. [DOI] [PubMed] [Google Scholar]
- Fukuhara N, Tagawa H, Kameoka Y, Kasugai Y, Karnan S, Kameoka J, Sasaki T, Morishima Y, Nakamura S, Seto M. Characterization of target genes at the 2p15-16 amplicon in diffuse large B-cell lymphoma. Cancer Sci. 2006;97:499–504. doi: 10.1111/j.1349-7006.2006.00209.x. [DOI] [PMC free article] [PubMed] [Google Scholar]
- Goff LK, Neat MJ, Crawley CR, Jones L, Jones E, Lister TA, Gupta RK. The use of real-time quantitative polymerase chain reaction and comparative genomic hybridization to identify amplification of the REL gene in follicular lymphoma. Br J Haematol. 2000;111:618–625. doi: 10.1046/j.1365-2141.2000.02352.x. [DOI] [PubMed] [Google Scholar]
- Hans CP, Weisenburger DD, Greiner TC, Gascoyne RD, Delabie J, Ott G, Muller-Hermelink HK, Campo E, Braziel RM, Jaffe ES, Pan Z, Farinha P, Smith LM, Falini B, Banham AH, Rosenwald A, Staudt LM, Connors JM, Armitage JO, Chan WC. Confirmation of the molecular classification of diffuse large B-cell lymphoma by immunohistochemistry using a tissue microarray. Blood. 2004;103:275–282. doi: 10.1182/blood-2003-05-1545. [DOI] [PubMed] [Google Scholar]
- Henderson LJ, Okamoto I, Lestou VS, Ludkovski O, Robichaud M, Chhanabhai M, Gascoyne RD, Klasa RJ, Connors JM, Marra MA, Horsman DE, Lam WL. Delineation of a minimal region of deletion at 6q16.3 in follicular lymphoma and construction of a bacterial artificial chromosome contig spanning a 6-megabase region of 6q16-q21. Genes Chromosomes Cancer. 2004;40:60–65. doi: 10.1002/gcc.20013. [DOI] [PubMed] [Google Scholar]
- Lenz G, Wright GW, Emre NC, Kohlhammer H, Dave SS, Davis RE, Carty S, Lam LT, Shaffer AL, Xiao W, Powell J, Rosenwald A, Ott G, Muller-Hermelink HK, Gascoyne RD, Connors JM, Campo E, Jaffe ES, Delabie J, Smeland EB, Rimsza LM, Fisher RI, Weisenburger DD, Chan WC, Staudt LM. Molecular subtypes of diffuse large B-cell lymphoma arise by distinct genetic pathways. Proc Natl Acad Sci USA. 2008;105:13520–13525. doi: 10.1073/pnas.0804295105. [DOI] [PMC free article] [PubMed] [Google Scholar]
- Lossos IS, Gascoyne RD. Transformation of follicular lymphoma. Best Pract Res Clin Haematol. 2011;24:147–163. doi: 10.1016/j.beha.2011.02.006. [DOI] [PMC free article] [PubMed] [Google Scholar]
- Martinez-Climent JA, Alizadeh AA, Segraves R, Blesa D, Rubio-Moscardo F, Albertson DG, Garcia-Conde J, Dyer MJ, Levy R, Pinkel D, Lossos IS. Transformation of follicular lymphoma to diffuse large cell lymphoma is associated with a heterogeneous set of DNA copy number and gene expression alterations. Blood. 2003;101:3109–3117. doi: 10.1182/blood-2002-07-2119. [DOI] [PubMed] [Google Scholar]
- McCabe MG, Ichimura K, Liu L, Plant K, Backlund LM, Pearson DM, Collins VP. High-resolution array-based comparative genomic hybridization of medulloblastomas and supratentorial primitive neuroectodermal tumors. J Neuropathol Exp Neurol. 2006;65:549–561. doi: 10.1097/00005072-200606000-00003. [DOI] [PMC free article] [PubMed] [Google Scholar]
- Montoto S, Fitzgibbon J. Transformation of indolent B-cell lymphomas. J Clin Oncol. 2011;29:1827–1834. doi: 10.1200/JCO.2010.32.7577. [DOI] [PubMed] [Google Scholar]
- Nanjangud G, Rao PH, Teruya-Feldstein J, Donnelly G, Qin J, Mehra S, Jhanwar SC, Zelenetz AD, Chaganti RS. Molecular cytogenetic analysis of follicular lymphoma (FL) provides detailed characterization of chromosomal instability associated with the t(14;18)(q32;q21) positive and negative subsets and histologic progression. Cytogenet Genome Res. 2007;118:337–344. doi: 10.1159/000108318. [DOI] [PubMed] [Google Scholar]
- Niitsu N, Okamoto M, Okabe-Kado J, Takagi T, Yoshida T, Aoki S, Honma Y, Hirano M. Serum nm23-H1 protein as a prognostic factor for indolent non-Hodgkin's lymphoma. Leukemia. 2001;15:832–839. doi: 10.1038/sj.leu.2402105. [DOI] [PubMed] [Google Scholar]
- Okosun J, Bodor C, Wang J, Araf S, Yang CY, Pan C, Boller S, Cittaro D, Bozek M, Iqbal S, Matthews J, Wrench D, Marzec J, Tawana K, Popov N, O'Riain C, OShea D, Carlotti E, Davies A, Lawrie CH, Matolcsy A, Calaminici M, Norton A, Byers RJ, Mein C, Stupka E, Lister TA, Lenz G, Montoto S, Gribben JG, Fan Y, Grosschedl R, Chelala C, Fitzgibbon J. Integrated genomic analysis identifies recurrent mutations and evolution patterns driving the initiation and progression of follicular lymphoma. Nat Genet. 2014;46:176–181. doi: 10.1038/ng.2856. [DOI] [PMC free article] [PubMed] [Google Scholar]
- Omodei D, Acampora D, Russo F, De Filippi R, Severino V, Di Francia R, Frigeri F, Mancuso P, De Chiara A, Pinto A, Casola S, Simeone A. Expression of the brain transcription factor OTX1 occurs in a subset of normal germinal-center B cells and in aggressive Non-Hodgkin Lymphoma. Am J Pathol. 2009;175:2609–2617. doi: 10.2353/ajpath.2009.090542. [DOI] [PMC free article] [PubMed] [Google Scholar]
- Poalas K, Hatchi EM, Cordeiro N, Dubois SM, Leclair HM, Leveau C, Alexia C, Gavard J, Vazquez A, Bidere N. Negative regulation of NF-kappaB signaling in T lymphocytes by the ubiquitin-specific protease USP34. Cell Commun Signal. 2013;11:25. doi: 10.1186/1478-811X-11-25. [DOI] [PMC free article] [PubMed] [Google Scholar]
- Rane NS, Sandhu AK, Zhawar VS, Kaur G, Popescu NC, Kandpal RP, Jhanwar-Uniyal M, Athwal RS. Restoration of senescence in breast and ovarian cancer cells following the transfer of the YAC carrying SEN6A gene located at 6q16.3. Cancer Genomics Proteomics. 2011;8:227–233. [PubMed] [Google Scholar]
- Ross CW, Ouillette PD, Saddler CM, Shedden KA, Malek SN. Comprehensive analysis of copy number and allele status identifies multiple chromosome defects underlying follicular lymphoma pathogenesis. Clin Cancer Res. 2007;13:4777–4785. doi: 10.1158/1078-0432.CCR-07-0456. [DOI] [PubMed] [Google Scholar]
- Schwaenen C, Viardot A, Berger H, Barth TF, Bentink S, Dohner H, Enz M, Feller AC, Hansmann ML, Hummel M, Kestler HA, Klapper W, Kreuz M, Lenze D, Loeffler M, Moller P, Muller-Hermelink HK, Ott G, Rosolowski M, Rosenwald A, Ruf S, Siebert R, Spang R, Stein H, Truemper L, Lichter P, Bentz M, Wessendorf S. Microarray-based genomic profiling reveals novel genomic aberrations in follicular lymphoma which associate with patient survival and gene expression status. Genes Chromosomes Cancer. 2009;48:39–54. doi: 10.1002/gcc.20617. [DOI] [PubMed] [Google Scholar]
- Seng TJ, Ichimura K, Liu L, Tingby O, Pearson DM, Collins VP. Complex chromosome 22 rearrangements in astrocytic tumors identified using microsatellite and chromosome 22 tile path array analysis. Genes Chromosomes Cancer. 2005;43:181–193. doi: 10.1002/gcc.20181. [DOI] [PubMed] [Google Scholar]
- Tagawa H, Suguro M, Tsuzuki S, Matsuo K, Karnan S, Ohshima K, Okamoto M, Morishima Y, Nakamura S, Seto M. Comparison of genome profiles for identification of distinct subgroups of diffuse large B-cell lymphoma. Blood. 2005;106:1770–1777. doi: 10.1182/blood-2005-02-0542. [DOI] [PubMed] [Google Scholar]
- Thelander EF, Ichimura K, Corcoran M, Barbany G, Nordgren A, Heyman M, Berglund M, Mungall A, Rosenquist R, Collins VP, Grander D, Larsson C, Lagercrantz S. Characterization of 6q deletions in mature B cell lymphomas and childhood acute lymphoblastic leukemia. Leuk Lymphoma. 2008;49:477–487. doi: 10.1080/10428190701817282. [DOI] [PubMed] [Google Scholar]
Associated Data
This section collects any data citations, data availability statements, or supplementary materials included in this article.