

Abstract
Objective
Identifying genetic variation associated with brain structures in aging may elucidate new biologic mechanisms underlying resilience to cognitive decline. We investigated whether carrying one copy of the protective haplotype “KL-VS” in longevity gene KLOTHO (KL) is associated with greater gray matter volume in healthy human aging compared to carrying no copies.
Methods
We performed unbiased whole-brain analysis in cognitively normal older adults from two independent cohorts to assess the relationship between KL-VS and gray matter volume using voxel-based morphometry.
Results
We found that KL-VS heterozygosity was associated with greater volume in right dorsolateral prefrontal cortex (rDLPFC). Because rDLPFC is important for executive function, we analyzed working memory and processing speed in individuals. KL-VS heterozygosity was associated with enhanced executive function. Larger rDLPFC volume correlated with better executive function across the lifespan examined. Statistical analysis suggested that volume partially mediates the effect of genotype on cognition.
Interpretation
These results suggest that variation in KL is associated with bigger brain volume and better function.
Introduction
The aging brain undergoes structural atrophy and functional decline, particularly in the medial temporal1–5 and frontal cortices.6–11 The process of aging, however, is amenable to change, and can be influenced by genetics.12 Thus, identifying genetic influences that modify anatomic and functional changes of the aging brain may reveal novel strategies to predict and promote healthy brain function with advancing age.
The longevity gene Klotho was identified in mice as an aging suppressor.13,14 Two variants in the human KLOTHO gene (KL), rs9536314 (F352V), and rs9527025 (C370S) segregate together and form a haplotype (KL-VS) that increases klotho secretion15,16 and may alter its functions.16,17 Klotho circulates throughout the body and brain.13,14,18,19 Its diverse functions include regulation of insulin,14 Wnt20 FGF,21 and N-methyl-D-aspartate (NMDA) receptor15 signaling, and transport of ion channels.22 Carrying one copy, but not two, of the KL-VS haplotype has been associated with longevity,16,23,24 healthy cardiovascular functions,16,23 and better renal health.25 Recently, KL-VS heterozygosity was linked to better global cognition in healthy older adults.15 Since KL-VS heterozygosity has been associated with protection of aging body systems and better cognition, we wondered whether it similarly protects against atrophy of the aging human brain.
We performed an unbiased whole-brain survey to determine whether KL-VS heterozygosity is associated with greater gray matter (GM) volume in any brain regions – and then assessed whether greater volume is associated with better function.
Materials and Methods
Study participants
For Cohort 1 (n = 100 males, n = 122 females), healthy, cognitively normal older adults (53–85 years) were recruited for studies of healthy aging from the San Francisco community at the Memory and Aging Center of the University of California, San Francisco (UCSF). For Cohort 2 (n = 54 males, n = 146 females), healthy, cognitively normal elderly community-dwelling individuals (53–94 years) were recruited to the Memory and Aging Project at Rush University Medical Center. All individuals in primary analyses were aged 53–89; one 94-year-old KL-VS homozygote was included in secondary analyses to maximize sample size. All adults from both cohorts were Caucasian (self-described in Cohort 1; non-Hispanic European ancestry based on genome-wide association study [GWAS] data in Cohort 2), had a Mini-Mental State Examination26 (MMSE) score ≥25, a normal neurological examination and a consensus diagnosis of normal control. All participants provided written informed consent. Institutional review boards at each university approved all aspects of this research.
Study design
We utilized a multi-stage study design to identify and replicate findings in a stepwise fashion in two independent cohorts of cognitively healthy older adults (Fig.1). The first stage of analysis was conducted in samples from Cohort 1. This consisted of two unbiased whole-GM analyses of separate “discovery” (n = 20 KL-VS heterozygotes, n = 21 noncarriers) and “validation” (n = 30 KL-VS heterozygotes, n = 32 noncarriers) groups. Matched subgroups (“Discovery” and “Validation” in Table1) of KL-VS single-copy carriers and noncarriers were used in these preliminary analyses to reduce heterogeneity due to image acquisition, genetic risk and demographic variables and improve our ability to detect true associations between genotype and cortical volume. KL-VS heterozygotes were matched to noncarriers based on (in order): scan type, APOE ε4 genotype, sex, age, years of education, and handedness. Candidate brain regions (regions of interest [ROIs]) that showed significant association with KL-VS heterozygosity in both the discovery and validation groups, using a priori criteria (described in the Neuroimaging analysis section), were defined as validated.
Figure 1.
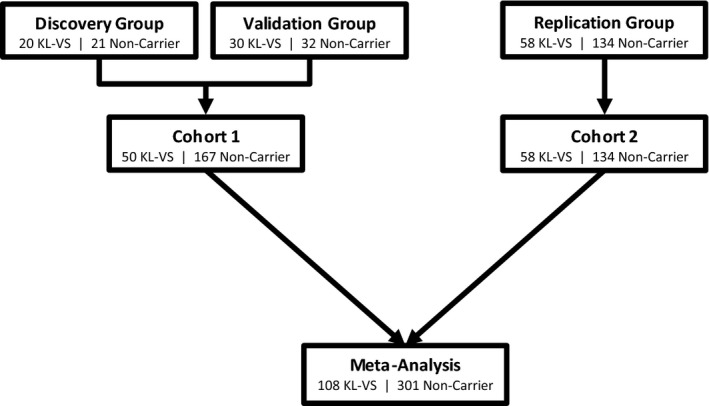
Multi-stage study design for discovery, validation, and replication of brain regions associated with KL-VS genotype in healthy cognitive aging. The first stage of analysis consisted of two unbiased whole-gray matter (GM) analyses of separate “discovery” and “validation” groups. Noncarriers were matched to KL-VS heterozygotes for age, sex, years of education, scan type, APOE ε4 genotype and handedness to reduce heterogeneity. In the full Cohort 1 analysis, additional noncarriers were added. Samples from Cohort 1 are from the UCSF Memory and Aging Center. Replication was performed using a region of interest-based analysis conducted in Cohort 2, an independent community-based sample from the Rush University Memory and Aging Project. Whole-GM meta-analysis was used to confirm findings from Cohorts 1 and 2.
Table 1.
Descriptive information for KL-VS heterozygotes and noncarriers from Cohort 1, Cohort 2, and meta-analysis
| Cohort 1 | Cohort 2 | Meta-analysis | |||||||
|---|---|---|---|---|---|---|---|---|---|
| Noncarrier (n = 167) | KL-VS Het. (n = 50) | P-value | Noncarrier (n = 134) | KL-VS Het. (n = 58) | P-value | Noncarrier (n = 301) | KL-VS Het. (n = 108) | P-value | |
| TIV (mean ± SE) | 1.74 × 10⁶ ± 1.4 × 10⁴ | 1.75 × 10⁶ ± 2.5 × 10⁴ | 0.73 | 1.67 × 10⁶ ± 1.8 × 10⁴ | 1.70 × 10⁶ ± 2.7 × 10⁴ | 0.36 | 1.71 × 10⁶ ± 1.1 × 10⁴ | 1.72 × 10⁶ ± 1.8 × 10⁴ | 0.49 |
| Age (mean ± SE) | 69.9 ± 0.5 | 71.5 ± 0.9 | 0.16 | 80.7 ± 0.5 | 80.4 ± 0.8 | 0.77 | 74.7 ± 0.5 | 76.3 ± 0.8 | 0.10 |
| Education (mean ± SE) | 17.4 ± 0.2 | 17.4 ± 0.4 | 0.97 | 15.5 ± 0.3 | 16.0 ± 0.4 | 0.31 | 16.5 ± 0.2 | 16.6 ± 0.3 | 0.77 |
| Sex (M/F) | 68/99 | 29/21 | 0.03 | 37/97 | 16/42 | 0.99 | 105/196 | 45/63 | 0.21 |
| Scan type (1.5/3 T) | 18/149 | 4/46 | 0.57 | 134/0 | 58/0 | NA | 152/149 | 62/46 | 0.22 |
| APOE ε4 (0/1) | 127/40 | 42/8 | 0.24 | 111/23 | 45/13 | 0.39 | 238/63 | 87/21 | 0.74 |
Summary statistics for participants in Cohort 1, Cohort 2, and meta-analysis. Age (53–89 years), education (8–28 years), sex (male or female), scan type (1.5 or 3 T MRI), and APOE ε4 carrier status (0 or 1, where 0 = noncarrier and 1 = carrier of 1 or 2 APOE ε4 alleles) are shown. Two-tailed P-values were from ANOVA (continuous traits) or chi-square (categorical variables) tests by genotype. M, male; F, female.
To further evaluate these findings in a full cohort reflecting the population frequency of KL-VS heterozygosity (20–25%) as compared to noncarriers, we analyzed all individuals with available neuroimaging and genetic data from Cohort 1 (inclusive of individuals from the preliminary discovery and validation analyses; Fig.1). The primary purpose of this analysis was to ensure that the KL-VS heterozygote effect was not being overestimated in the matched cohorts and was reflective of the population. We conducted whole-GM analysis as well as analysis focused specifically on the ROIs significantly validated in our preliminary analyses. These findings are presented as the “Cohort 1” results.
We next sought to replicate the Cohort 1 findings by estimating the effect of carrying one versus no copies of KL-VS on ROI volumes in an independent normal aging population comprised of community-dwelling individuals in a different geographic region (Cohort 2) (Fig.1), who were participants in the Rush University Memory and Aging Project (n = 58 KL-VS heterozygotes, n = 134 noncarriers).
Finally, to confirm that both cohorts showed similar effects of KL-VS genotype on brain volume and cognitive function, we performed secondary meta-analysis of Cohort 1 and 2 participants.
Genotyping
For Cohort 1, genotyping of rs9536314 for F352V and rs9527025 for C370S was performed using Sequenom iPLEX Technology (Sequenom, San Diego, CA). All PCR reactions and subsequent steps were performed per manufacturer's instructions. The SpectroAquire and MassARRAY Typer Software packages (Sequenom, San Diego, CA) were used for interpretation and Typer analyzer (v 3.4.0.18) was used to review and analyze all data. Genotypes with “Conservative” or “Moderate” quality calls (99% of total genotyped samples) were utilized for analysis. For Cohort 2, samples were genotyped on the Affymetrix Genechip 6.0 platform (Affymetrix Inc., Santa Clara, CA; n = 30 KL-VS heterozygotes, n = 88 noncarriers, n = 5 homozygotes) and on the Illumina OmniExpress platform (Illumina Inc., San Diego, CA; n = 28 heterozygotes, n = 46 noncarriers, n = 3 homozygotes; P = 0.19 no significant difference between platform and genotype, chi-squared test). Standard quality control measures were applied by individual (genotype success rate >95%, genotype-derived sex concordant with reported sex, excess inter/intra-heterozygosity) and by SNP (Hardy–Weinberg Equilibrium P > 0.001; minor allele frequency [MAF] >0.05, genotype call rate >0.95; misshap test >1 × 10⁻⁹). Genotype imputation was performed with BEAGLE27 (version: 3.3.2) using the 1000 Genomes Project.28 An imputation confidence score (INFO) of >0.3 was required for inclusion. For purposes of KL-VS dose in statistical analysis, minor allele doses between 0–0.002 were considered as 0, between 0.994–1.006 were considered as 1, and between 1.994–2 were considered as 2. As expected from HapMap and previous work,23 rs9536314 and rs9527025 were in perfect linkage disequilibrium in all samples genotyped. For all primary analyses, single-copy KL-VS carriers were compared to noncarriers. Homozygotes for the KL-VS allele, a rare genotype associated with shortened lifespan and harmful health effects,16,23,29,30 were only included in exploratory secondary analyses due to the low frequency of this genotype (n = 5 in Cohort 1, n = 8 in Cohort 2).
Image acquisition
Participants from Cohort 1 underwent structural T1-weighted MR imaging on a 3 T (n = 46 KL-VS heterozygotes, n = 149 noncarriers, n = 5 homozygotes) scanner at the Neuroscience Imaging Center at UCSF and 1.5 T (n = 4 KL-VS heterozygotes, n = 18 noncarriers) scanner at the San Francisco Veterans Affairs Medical Center as described.31 KL-VS heterozygotes and noncarriers were matched for field strength distribution for all Cohort 1 analyses. Individuals from Cohort 2 had T1-weighted anatomical data collected on a 1.5 T GE (General Electric, Waukesha, WI) MRI scanner as described.32 MRI scans from all individuals in both cohorts were acquired within 1 year of the clinical visit and neuropsychological evaluation.
Neuropsychological assessment
For Cohort 1 (n = 208 KL-VS heterozygotes and noncarriers with ≥1 score available), Cohort 2 (n = 191 KL-VS heterozygotes and noncarriers with ≥1 score available), and in meta-analysis, a composite executive Z-score (representing number of positive or negative standard deviations from the mean) was calculated for each participant as a measure of overall function in the executive cognitive domain. Positive scores represent better performance. In Cohort 1, the following were measured as described33: Modified Trails (variable of interest: completion time; cognitive domains assessed: set shifting, processing speed), digits backward (number correct; working memory), D-word generation (number correct; phonemic generation), and Stroop inhibition (number correct; response inhibition). Three outlier scores (±3 standard deviations from the mean) for Modified Trails were excluded from analysis since they indicated errors in testing or data entry. In Cohort 2, a similar battery was assessed34 and included: digits backward (number correct; working memory), Stroop color naming (number correct; perceptual speed, inhibition), number comparison test (number correct; perceptual speed, inhibition), and symbol digit modalities (number correct; perceptual speed, working memory). Two outlier scores from Stroop color naming and one outlier score from symbol digit modalities were excluded. Composite executive Z-scores were combined by meta-analysis accounting for test center in statistical modeling. Sensitivity analysis was performed on cohort-specific standardized scores for digits backward (the only test shared across groups). For exploratory secondary analyses, composite executive Z-scores were similarly recalculated separately for each cohort across all genotype groups (all homozygotes had ≥1 score available for analysis).
Image processing
To assess the effect of KL-VS heterozygosity (scored as absent or present) versus noncarriers on GM volume, we conducted whole-GM voxel-based morphometry (VBM) analysis using well-described methods.35,36 Briefly, T1-weighted structural MR images were preprocessed in SPM8 running under Matlab (The MathWorks, Inc., Natick, MA) then warped with DARTEL37 to a custom healthy older adult template using default settings with bias correction, light cleaning and skull stripping. DARTEL-processed GM images were smoothed with an 8 mm kernel. All images were processed in a single batch and were manually curated for accurate segmentation.
Neuroimaging analysis
For primary VBM analyses, a general linear model (glm) was fit at each voxel to model the dependence of tissue volume on KL-VS heterozygosity using vlsm2.5.38 In the two-stage discovery-validation analysis for Cohort 1 (Fig.1), significantly validated regions were identified in the following manner. In the discovery group, a priori significant findings in whole-GM analysis were established at an uncorrected Puncorr < 0.001 and cluster size >100 mm3. In the validation group, significant validation was established in whole-GM analysis at Puncorr < 0.001 for any size cluster that overlapped with significant clusters in the discovery analysis. Validated regions were combined to form an ROI that was used to account for multiple comparisons and for independent replication in Cohort 2. To adjust for multiple testing, discovery and validation groups were combined with additional noncarriers. We established the T-threshold for family wise error (FWE) correction by performing 1000 permutations of the error in each analytic model and identifying the T-value representing P < 0.05 on the error distribution.39 Significance was established for whole GM (PFWE-whole < 0.05) and for the ROI identified in the discovery-validation as represented by the Automated Anatomical Labeling (AAL) atlas40 (PFWE-ROI < 0.05). This analysis is presented as the full “Cohort 1” analysis. We hypothesized a priori that KL-VS heterozygotes would have larger GM volume compared to noncarriers (one-tailed test). Since glm in vlsm2.5 is set up as one-tailed, we also explicitly tested the converse relationship (i.e., that KL-VS heterozygosity is associated with smaller volume) in a separate analysis. The model was adjusted for age at time of scan, total intracranial volume (TIV), sex, years of education and field strength (1.5 or 3 T). Sensitivity analysis was also conducted on samples with 3 T scans only to exclude any bias due to scanner.41
For Cohort 2, VBM was performed within the ROI defined by the discovery-validation analysis, adjusting for age at time of scan, TIV, sex, and years of education. Significant replication was established at P < 0.05 divided by the number of ROIs tested (P < 0.025 for two ROIs tested). For VBM meta-analysis, whole-GM was analyzed in Cohorts 1 and 2 in models adjusting for age at time of scan, TIV, sex, years of education, scan type, and test center. For exploratory secondary meta-analyses of all three genotype groups, whole-GM VBM was performed adjusting for the same variables as above. In secondary analyses, homozygotes were scored as 0, noncarriers were scored as 1, and KL-VS heterozygotes were scored as 2 to reflect the hypothesized biological relationship of genotypes based on the literature.16,23,29,30 For quantitative assessments of volume, mean GM proportion (a proxy of volume) was extracted for the cluster of interest and standardized by cohort for use in regression analysis adjusting for TIV and other demographic variables as described below.
Statistical analysis
Linear regression models (linear regression t-test equivalent to a type IV or III analysis of variance [ANOVA]) were used to assess the relationship of KL-VS genotype, standardized ROI volumes, and composite executive Z-scores in individuals from Cohort 1 and Cohort 2. For primary analyses, linear models accounted for age, sex, education, APOE ε4 carrier status (present or absent), TIV (for analyses of volume only), and KL-VS haplotype status (0 or 1 allele). Test center was also included as a variable in the nonweighted meta-analysis to confirm findings in Cohorts 1 and 2 were consistent in direction and to estimate the magnitude of effect. Additional models were used to test for interaction effects of KL-VS genotype by age and KL-VS genotype by volume on cognition, accounting for all above covariates and main effects. For secondary analysis of all three genotype groups, KL-VS homozygotes were scored as 0, noncarriers were scored as 1, and KL-VS heterozygotes were scored as 2. Mediation analysis was performed as originally described.42 First, bivariate models were run to test the direct effects of genotype on volume and cognition, and of volume on cognition. Next, multivariate models were run to assess whether volume altered the association between genotype and cognition (i.e., modeling genotype and volume as predictors of cognition). We then compared the size of the effect of genotype on cognition with or without volume in the model to estimate the contribution of volume as a predictor of cognition. All regression analyses were two-tailed unless indicated otherwise. Adjusted composite executive Z-scores and ROI volume measures were calculated as best linear unbiased estimates. Regression analyses were performed in Stata10.1/MP (StataCorp LP, College Station, TX). Linear regression lines and slope and intercept comparisons were calculated in Prism 6 (Graphpad Software, Inc., La Jolla, CA). Post hoc pairwise comparisons were calculated using Tukey's multiple comparisons test in Prism.
Results
Participant characteristics
We performed analysis in two independent cohorts of cognitively healthy older adults (Fig.1). The first cohort consisted of individuals from the UCSF Memory and Aging Center (Cohort 1; n = 50 KL-VS heterozygotes, n = 167 noncarriers). The second cohort comprised participants from the Rush University Memory and Aging Project (Cohort 2; n = 58 KL-VS heterozygotes, n = 134 noncarriers). Together, the two cohorts comprised 409 Caucasian individuals (53–89 years of age) without dementia or mild cognitive impairment, and with a MMSE26 score ≥25. Twenty-six percent of individuals were heterozygous for the KL-VS allele (Table1), which is close to the 20–25% heterozygosity frequency typically seen in European populations.16,24
Unbiased whole-brain analysis identifies rDLPFC as a region of interest associated with KL-VS heterozygosity
We hypothesized that carrying one copy of the KL-VS haplotype would be associated with greater GM volume compared to noncarriers, which we investigated using whole-GM VBM. In the discovery group, we found that carrying one KL-VS allele was associated with greater GM volume in frontal cortical brain regions (Puncorr < 0.001), including right dorsolateral prefrontal cortex (rDLPFC) (MaxT = 4.51, cluster size [mm3] = 867, peak Montreal Neurological Institute [MNI] coordinates = 39, 26, 36) and left supplemental motor area (lSMA, MaxT = 4.24, cluster = 840, MNI = −14, −6, 59). In the validation group, both regions were also associated with KL-VS heterozygosity using an a priori significance threshold of Puncorr < 0.001 (rDLPFC: MaxT = 3.50, cluster = 20, peak MNI coordinates = 33, 15, 42; lSMA: MaxT = 4.01, cluster = 122, MNI = −12, −6, 54). The coordinates represent a single voxel that has the strongest t-value within a broader significant cluster; the clusters overlapped extremely closely between the discovery and validation groups. No other regions fulfilled validation criteria. In analyses testing whether KL-VS heterozygosity is associated with lower GM volume, no regions met validation criteria (data not shown).
To confirm the effect of KL-VS heterozygosity on whole-brain and ROI volumes in a group representative of KL-VS population frequencies, we performed final Cohort 1 analysis of all individuals with available neuroimaging and genetic data, inclusive of the original discovery and validation cohorts. In Cohort 1 analysis, we also accounted for multiple testing at the whole-GM level and in an ROI mask using the right middle frontal gyrus (to broadly encompass rDLPFC) and lSMA AAL atlas regions. KL-VS heterozygotes showed larger rDLPFC volume, significant at the ROI level (PFWE-ROI = 0.04, Fig.2A). Carrying one copy of KL-VS was also associated with greater GM volume in the lSMA in Cohort 1, significant at the ROI-corrected (PFWE-ROI = 0.01) and whole-GM (PFWE-whole = 0.05) levels. Cohort 1 analysis of only participants with 3 T images rendered similar findings (data not shown).
Figure 2.

KL-VS heterozygosity is associated with greater volumes of right dorsolateral prefrontal cortex (DLPFC) in two independent cohorts and meta-analysis of healthy older adults, independent of age. (A–C) Voxel-based morphometry (VBM) results are shown as statistical T-value maps (in color) overlaid on an axial slice of the template brain from DARTEL. Significant findings are highlighted by yellow circles. Maps are thresholded at the specified T-values to reflect stated P-value. Left side of image corresponds to left side of brain. (A) In blue, full Cohort 1 analysis demonstrated association between carrying one copy of the KL-VS haplotype and greater gray matter (GM) volume in right DLPFC (rDLPFC). Greater rDLPFC volume remained significant after permutation-based correction for multiple testing for two ROIs of interest, rDLPFC (PFWE-ROI = 0.04) and left supplemental motor area (data not shown). T-map is thresholded at T = 3.35–5.3 (Puncorr < 0.001). (B) In red, significant replication of greater rDLPFC volume in KL-VS heterozygotes was demonstrated in Cohort 2 VBM analysis (Puncorr < 0.05). T-map is thresholded at T = 1–2.2 for visualization purposes. (C) In purple, meta-analysis of Cohorts 1 and 2 showed greater volume in rDLPFC in KL-VS heterozygotes (Puncorr < 0.001). T-map is thresholded at T = 1.65–3.7 (Puncorr < 0.05). (D–F) Quantitation of rDLPFC volume Z-scores in KL-VS heterozygotes and noncarriers in (D) Cohort 1, (E) Cohort 2, and (F) meta-analysis. Data are means ± SEM. *P < 0.05, ***P < 0.001 versus noncarrier (two-tailed, linear statistical model). (G–I) Quantitation of rDLPFC volume Z-scores as a function of age in KL-VS heterozygotes and noncarriers. KL-VS heterozygosity was associated with greater rDLPFC volume across all ages in (G) Cohort 1, (two-tailed P = 4.07 × 10⁻⁵), (H) Cohort 2, (P = 0.02), and (I) meta-analysis (P = 2.64 × 10⁻⁵). There was a significant difference in intercepts (P < 0.0001) but not in slopes (P = 0.58) between the two linear predictions. Data in (D–I) are adjusted by age, sex, education, APOE ε4 carrier status, total intracranial volume (TIV), and (in F and I) test center.
KL-VS heterozygosity is associated with greater rDLPFC volume, independent of age, in two cohorts and via meta-analysis
We next sought to replicate our Cohort 1 findings by estimating the effect of KL-VS specifically on lSMA and rDLPFC volumes in an independent, community-based cohort of cognitively healthy older adults (Cohort 2) using the same ROIs as above. A cluster representing rDLPFC showed significantly greater volume in KL-VS heterozygotes versus noncarriers in Cohort 2, significant at an a priori replication threshold of P < 0.025 for two ROIs tested (MaxT = 2.17, cluster = 213 mm3, MNI = 24, 48, 25) (Fig.2B). This significant cluster overlapped with the significant rDLPFC cluster from the full Cohort 1 analysis, demonstrating that the same neuroanatomical region has greater volume in KL-VS heterozygotes in two independent groups of cognitively normal older adults. lSMA did not show significantly greater volume in KL-VS heterozygotes from Cohort 2.
Since prefrontal cortices are selectively vulnerable to aging,9,43 and we hypothesized that KL-VS counters structural brain aging, we conducted further analyses of rDLPFC. We performed secondary whole-GM VBM meta-analysis of Cohorts 1 and 2 to confirm the KL-VS effect and found that rDLPFC volume was greater in individuals carrying one KL-VS allele versus noncarriers (Puncorr < 0.001, MaxT = 3.37, cluster = 41, MNI = 31, 23, 39) (Fig.2C). Quantitative measures of volume for each individual were extracted for the VBM finding located in rDLPFC in Cohorts 1 and 2. KL-VS heterozygotes had greater rDLPFC volumes when compared to noncarriers in both independent cohorts (Cohort 1: P = 4.07 × 10⁻⁵ and Cohort 2: P = 0.02) (Fig.2D–E) and in secondary meta-analysis of both cohorts (P = 2.64 × 10⁻⁵) (Fig.2F; Table2).
Table 2.
Regression analyses for KL-VS heterozygotes and noncarriers from Cohort 1, Cohort 2, and meta-analysis
| Beta estimate (STD error) | P-value | |
|---|---|---|
| I. Outcome: rDLPFC volume | ||
| Cohort 1/Cohort 2 | ||
| Total intracranial volume | 1.42 × 10⁻⁶ (3.61 × 10⁻⁷)/1.34 × 10−6 (3.61 × 10⁻⁷) | 1.19 × 10⁻⁴/2.86 × 10−6 |
| Age | −0.05 (0.01)/−0.05 (0.01) | 8.45 × 10⁻⁹/3.76 × 10−5 |
| Sex (F) | −0.04 (0.13)/0.34 (0.17) | 0.78/0.04 |
| Education | 0.03 (0.03)/−0.02 (0.02) | 0.33/0.32 |
| APOE ε4 carrier | 0.16 (0.15)/−0.23 (0.17) | 0.27/0.17 |
| Genotype, KL-VS | 0.60 (0.14)/0.33 (0.14) | 4.07 × 10⁻⁵/0.02 |
| Meta-analysis: Cohorts 1 and 2 | ||
| Total intracranial volume | 1.35 × 10⁻⁶ (2.50 × 10⁻⁷) | 1.09 × 10⁻⁷ |
| Age | −0.05 (0.01) | 1.94 × 10⁻¹² |
| Sex (F) | −0.20 (0.10) | 0.05 |
| Education | −0.01 (0.02) | 0.77 |
| Center | −0.55 (0.12) | 2.88 × 10⁻⁶ |
| APOE ε4 carrier | −0.04 (0.11) | 0.70 |
| Genotype, KL-VS | 0.43 (0.10) | 2.64 × 10⁻⁵ |
| II. Outcome: Composite exec. Z-score | ||
| Cohort 1/Cohort 2 | ||
| Age | −0.04 (9.41 × 10⁻³)/−0.05 (0.01) | 7.08 × 10⁻⁵/5.84 × 10−5 |
| Sex (F) | 0.04 (0.14)/−0.07 (0.15) | 0.75/0.66 |
| Education | 0.09 (0.03)/0.08 (0.02) | 7.84 × 10⁻³/9.04 × 10−4 |
| APOE ε4 carrier | −3.20 × 10⁻³ (0.16)/−0.06 (0.17) | 0.98/0.73 |
| Genotype, KL-VS | 0.46 (0.16)/0.31 (0.15) | 2.06 × 10⁻³/0.04 |
| Meta-analysis: Cohorts 1 and 2 | ||
| Age | −0.04 (0.01) | 3.55 × 10⁻⁸ |
| Sex (F) | −0.01 (0.10) | 0.90 |
| Education | 0.08 (0.02) | 1.68 × 10⁻⁵ |
| Center | −0.52 (0.12) | 2.93 × 10⁻⁵ |
| APOE ε4 carrier | −0.04 (0.12) | 0.72 |
| Genotype, KL-VS | 0.38 (0.11) | 4.71 × 10⁻⁴ |
| III. Outcome: Composite exec. Z-score with rDLPFC volume | ||
| Meta-analysis: Cohorts 1 and 2 | ||
| rDLPFC volume | 0.11 (0.05) | 0.04 |
| Total intracranial volume | 2.59 × 10⁻⁷ (2.72 × 10⁻⁷) | 0.34 |
| Age | −0.03 (0.01) | 5.54 × 10⁻⁶ |
| Sex (F) | −0.01 (0.11) | 0.96 |
| Education | 0.08 (0.02) | 1.26 × 10⁻⁵ |
| Center | −0.46 (0.12) | 3.33 × 10⁻⁴ |
| APOE ε4 carrier | −0.04 (0.12) | 0.73 |
| Genotype, KL-VS | 0.33 (0.11) | 2.12 × 10⁻³ |
KL-VS heterozygosity is associated with greater rDLPFC volume and enhanced executive function after accounting for several variables. The estimate and accompanying error reflect the effect (beta) of each independent variable as a predictor of rDLPFC volume or composite executive Z-score after accounting for all other variables in the model. For Cohorts 1 and 2, the linear statistical model included as independent variables: age, sex, education, APOE ε4 carrier status, total intracranial volume (TIV, in I only), and KL-VS heterozygosity (0 or 1). For the meta-analysis, the model additionally included test center as a predictor variable. All tests were two-tailed. rDLPFC, right dorsolateral prefrontal cortex.
We next investigated whether the association of KL-VS heterozygosity with rDLPFC volume varies by age to test our hypothesis that klotho counters brain aging. In each cohort and in secondary meta-analysis, rDLPFC volume decreased with advancing age (Cohort 1: P = 8.45 × 10⁻⁹; Cohort 2: P = 3.76 × 10⁻⁵; meta-analysis: P = 1.94 × 10⁻¹²) (Table2), consistent with prior reports.8,43–46 Interestingly, the age-related decrease in rDLPFC volume was observed in both KL-VS heterozygotes and in noncarriers (no significant interaction of KL-VS and age, Cohort 1: P = 0.19; Cohort 2: P = 0.25; meta-analysis: P = 0.46; no significant difference in slopes of linear predictions, P = 0.58) (Fig.2G–I). KL-VS heterozygotes had larger rDLPFC volume than noncarriers across all ages (significant difference in intercept of linear predictions, P < 0.0001). These data suggest that KL-VS heterozygosity is associated with greater baseline rDLPFC volume but does not prevent age-related decline.
KL-VS heterozygotes show better executive function
Since KL-VS heterozygotes exhibited greater rDLPFC volume, and this cortical region is essential to the neural network subserving executive function,47–49 we hypothesized that KL-VS is associated with better executive function. To test this, we calculated composite Z-scores probing specific measures of executive function such as working memory, task inhibition, and processing speed using normalized scores from multiple neuropsychological tests.
Meta-analysis showed that older age and lower education were associated with worse executive function. KL-VS heterozygosity was associated with better executive function in both cohorts (Cohort 1: P = 2.06 × 10⁻³ and Cohort 2: P = 0.04) and showed a consistent association in combined meta-analysis (P = 4.71 × 10⁻⁴) (Fig.3A–C; Table2) after accounting for these effects. Similar to volume, the KL-VS effect on executive function occurred across all ages in Cohorts 1, 2, and in secondary meta-analysis (Fig.3D–F). Sensitivity analysis of “digits backwards,” a neuropsychological measure of executive function shared by both cohorts, showed similar results (data not shown).
Figure 3.
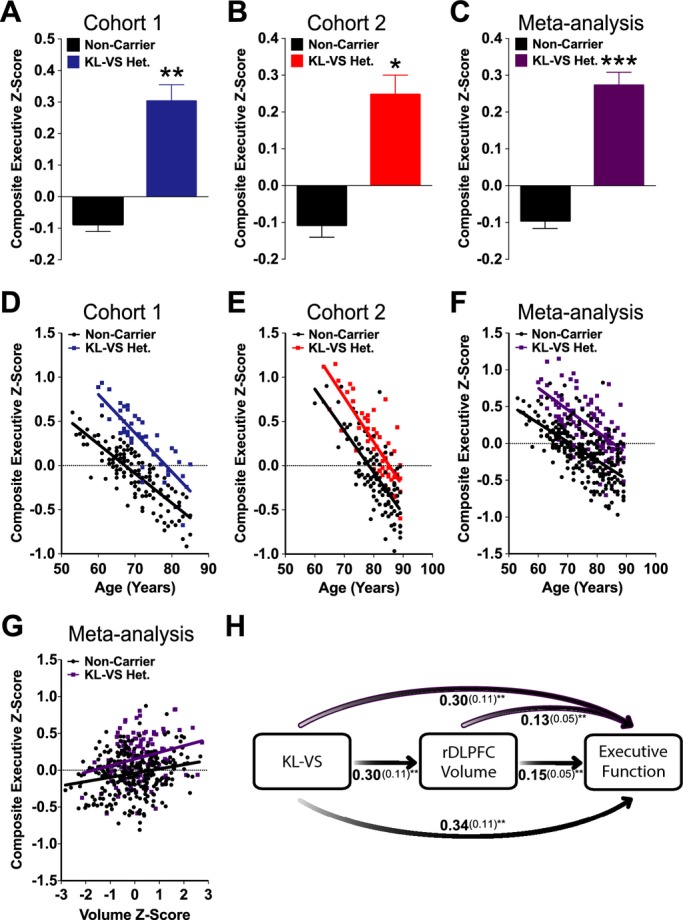
KL-VS heterozygosity is associated with enhanced executive function in two independent cohorts and meta-analysis of healthy older adults, independent of age. KL-VS heterozygotes showed higher composite executive Z-scores than noncarriers in (A) Cohort 1, (B) Cohort 2, and (C) meta-analysis. Data are means ± SEM and were analyzed by a linear model adjusting for age, education, sex, APOE ε4 carrier status and (in C) center. *P < 0.05, **P < 0.01, ***P < 0.001 versus noncarrier (two-tailed). (D–F) KL-VS heterozygosity-associated enhancements in executive function were observed across all ages in (D) Cohort 1 (two-tailed P = 2.06 × 10⁻³), (E) Cohort 2 (P = 0.04), and (F) meta-analysis (P = 4.71 × 10⁻⁴). (G) In meta-analysis, right dorsolateral prefrontal cortex (rDLPFC) volume was positively correlated with composite executive Z-scores in both KL-VS heterozygotes and noncarriers (P = 0.003). (H) Mediation analysis of KL-VS heterozygosity and rDLPFC volume as predictors of executive function in Cohorts 1 and 2. Bivariate (black shaded arrows, middle and bottom) and multivariate (purple outlined arrows, top) analyses of direct and indirect effects of KL-VS heterozygosity and rDLPFC volume demonstrated that each were significant predictors of executive function, indicating that KL-VS-associated enhancement in executive function was partially mediated by rDLPFC volume. Estimated effects (beta, in bold) of genotype and/or volume as predictors of cognition, along with the standard error (in parentheses), are provided for each analysis. **P < 0.01 (two-tailed).
Greater rDLPFC volume partially mediates the effect of KL-VS heterozygosity on enhanced executive function
rDLPFC volume was positively correlated with composite executive Z-scores by meta-analysis (P = 0.003, β ± SE = 0.15 ± 0.05), consistent with previous observations.48 Interestingly, after accounting for the influence of rDLPFC volume, effects of KL-VS heterozygosity on enhanced executive function persisted (meta-analysis P = 0.002; Fig.3G; Table2). There was no interaction between rDLPFC volume and KL-VS heterozygosity on executive function via meta-analysis (P = 0.70). In light of this, we performed mediation analysis42 to assess how much of the KL-VS association with greater rDLPFC volume contributed to enhanced executive function (Fig.3H). In bivariate models, KL-VS genotype significantly predicted rDLPFC volume (P = 0.007, 0.30 ± 0.11) and executive function (P = 0.003, 0.34 ± 0.11). rDLPFC volume also significantly predicted executive function (P = 0.003, 0.15 ± 0.05). Furthermore, when rDLPFC volume was added to the multivariate model, although both KL-VS (P = 0.008, 0.30 ± 0.11) and rDLPFC volume (P = 0.008, 0.13 ± 0.05) remained significant predictors of executive function (Fig.3H) the effect of KL-VS was slightly attenuated. Approximately 12% of the KL-VS effect on executive function was mediated by rDLPFC volume. These data indicate that KL-VS-associated increases in rDLPFC volume partially, but not completely, account for enhanced executive function.
Exploratory analyses show that KL-VS homozygosity tends to be associated with smaller rDLPFC volume and worse executive function
In exploratory secondary analyses we assessed effects of carrying two copies of KL-VS. Since KL-VS homozygotes show decreased lifespan and increased disease risk compared to noncarriers and heterozygotes,16,23,29,30 we hypothesized that they would similarly show lower rDLPFC volume and executive function. Thus, we performed meta-analysis modeling the hypothesized relationship of KL-VS genotype on GM volume (via VBM) and executive function across both cohorts (n = 13 KL-VS homozygotes, n = 108 KL-VS heterozygotes, n = 301 noncarriers) (Table3).
Table 3.
Descriptive information for all KL-VS genotype groups from Cohort 1, Cohort 2 and meta-analysis
| Cohort 1 | Cohort 2 | Meta-analysis | ||||||||||
|---|---|---|---|---|---|---|---|---|---|---|---|---|
| Noncarrier (n = 167) | KL-VS het. (n = 50) | KL-VS homo. (n = 5) | P-value | Noncarrier (n = 134) | KL-VS het. (n = 58) | KL-VS homo. (n = 8) | P-value | Noncarrier (n = 301) | KL-VS het. (n = 108) | KL-VS homo. (n = 13) | P-value | |
| Age (mean ± SE) | 69.9 ± 0.5 | 71.5 ± 0.9 | 74.2 ± 0.5 | 0.17 | 80.7 ± 0.5 | 80.4 ± 0.8 | 82.1 ± 1.8 | 0.75 | 74.7 ± 0.5 | 76.3 ± 0.8 | 79.1 ± 1.7 | 0.06 |
| Education (mean ± SE) | 17.4 ± 0.4 | 17.4 ± 0.4 | 17.6 ± 1.0 | 0.97 | 15.5 ± 0.3 | 16.0 ± 0.4 | 14.3 ± 1.2 | 0.28 | 16.5 ± 0.2 | 16.6 ± 0.3 | 15.5 ± 0.9 | 0.41 |
| Sex (M/F) | 68/99 | 29/21 | 3/2 | 0.08 | 37/97 | 16/42 | 1/7 | 0.64 | 105/196 | 45/63 | 4/9 | 0.41 |
| Scan type (1.5/3 T) | 18/149 | 4/46 | 0/5 | 0.64 | 134/0 | 58/0 | 8/0 | NA | 152/149 | 62/46 | 8/5 | 0.38 |
| APOE ε4 (0/1) | 127/40 | 42/8 | 3/2 | 0.42 | 111/23 | 45/13 | 8/0 | 0.28 | 238/63 | 87/21 | 11/2 | 0.91 |
Summary statistics for participants in Cohort 1, Cohort 2, and meta-analysis. Age (53–94 years), education (8–28 years), sex (male or female), scan type (1.5 or 3 T MRI), and APOE ε4 carrier status (0 or 1, where 0 = noncarrier and 1 = carrier of 1 or 2 APOE ε4 alleles) are shown. Two-tailed P-values were from ANOVA (continuous traits) or chi-square (categorical variables) tests by genotype. M, male; F, female.
In whole-GM VBM, KL-VS genotype was associated with rDLPFC volume (Puncorr < 0.005, MaxT = 2.64, cluster = 24, MNI = 26, 45, 31). KL-VS heterozygotes had the greatest rDLPFC volume, KL-VS noncarriers had average volume, and KL-VS homozygotes had the smallest volume (Fig.4A; Table4). The overall relationship of KL-VS genotype and volume was significant (P = 0.01). Post hoc pairwise comparisons using this model revealed that rDLPFC volume in KL-VS heterozygotes was greater compared to noncarriers (P < 0.05), as anticipated. rDLPFC volume of KL-VS homozygotes showed significantly lower volume (P < 0.05) only when compared to noncarriers in a separate VBM analysis. In all three genotype groups, rDLPFC volume decreased with age (P = 7.29 × 10⁻¹³; no significant interaction between KL-VS and age, P = 0.93; no significant difference between slopes, P = 0.41) and baseline was highest in KL-VS heterozygotes, in the middle for noncarriers, and lowest for KL-VS homozygotes (significant difference between intercepts, P < 0.0001) (Fig.4B; Table4).
Figure 4.

KL-VS heterozygosity and homozygosity are associated with right dorsolateral prefrontal cortex (DLPFC) volume, independent of age. (A) KL-VS heterozygotes showed greater rDLPFC volume and KL-VS homozygotes showed smaller rDLPFC volume than noncarriers via meta-analysis (P = 0.01). Data are means ± SEM and were analyzed by a linear model adjusting for age, education, sex, APOE ε4 carrier status and center. Post hoc pairwise tests demonstrated there was a significant difference between KL-VS heterozygotes versus noncarriers. *P < 0.05 (two-tailed Tukey's multiple comparisons test). rDLPFC volume in homozygotes showed significantly lower volume only when compared to noncarriers in a separate VBM analysis (P < 0.05). (B) rDLPFC volume Z-scores as a function of age across KL-VS genotype. Across all ages, KL-VS heterozygosity was associated with greater rDLPFC volume while KL-VS homozygotes showed lower rDLPFC volume via meta-analysis (P = 0.01). Overall genotype effects on baseline (P < 0.0001), but not their slopes over time (P = 0.41), were significantly different across groups. Data are adjusted by age, sex, education, APOE ε4 carrier status, total intracranial volume (TIV), and test center.
Table 4.
Regression analyses for all KL-VS genotype groups from meta-analysis of Cohorts 1 and 2
| Beta estimate (STD error) | P-value | |
|---|---|---|
| I. Outcome: rDLPFC volume | ||
| Meta-analysis: Cohorts 1 and 2 | ||
| Total intracranial volume | 1.39 × 10⁻⁶ (2.51 × 10⁻⁷) | 5.62 × 10⁻⁸ |
| Age | −0.05 (0.01) | 7.29 × 10⁻¹³ |
| Sex (F) | −0.07 (0.10) | 0.52 |
| Education | −0.02 (0.02) | 0.31 |
| Center | −0.58 (0.12) | 1.61 × 10−06 |
| APOE ε4 carrier | −0.09 (0.11) | 0.40 |
| Genotype, KL-VS | 0.24 (0.09) | 0.01 |
| II. Outcome: Composite exec. Z-score | ||
| Meta-analysis: Cohorts 1 and 2 | ||
| Age | −0.03 (0.01) | 5.25 × 10⁻⁵ |
| Sex (F) | −0.13 (0.10) | 0.20 |
| Education | 0.07 (0.02) | 1.42 × 10⁻⁴ |
| Center | −0.44 (0.12) | 4.40 × 10⁻⁴ |
| APOE ε4 carrier | 0.03 (0.12) | 0.83 |
| Genotype, KL-VS | 0.21 (0.10) | 0.03 |
| III. Outcome: Composite exec. Z-score with rDLPFC volume | ||
| Meta-analysis: Cohorts 1 and 2 | ||
| rDLPFC volume | 0.11 (0.01) | 0.03 |
| Total intracranial volume | −5.22 × 10⁻⁷ (2.75 × 10⁻⁷) | 0.06 |
| Age | −0.02 (0.01) | 2.76 × 10⁻³ |
| Sex (F) | −0.18 (0.11) | 0.10 |
| Education | 0.07 (0.02) | 7.54 × 10⁻⁵ |
| Center | −0.36 (0.13) | 4.83 × 10⁻³ |
| APOE ε4 carrier | 0.03 (0.12) | 0.80 |
| Genotype, KL-VS | 0.18 (0.10) | 0.07 |
KL-VS genotype is associated with greater rDLPFC volume and enhanced executive function after accounting for several variables. The estimate and accompanying error reflect the effect (beta) of each independent variable as a predictor of rDLPFC volume or composite executive Z-score after accounting for all other variables in the model. For meta-analysis, the linear statistical model included as independent variables: age, sex, education, APOE ε4 carrier status, total intracranial volume (TIV, in I and III only), KL-VS genotype (homozygotes scored as 0, noncarriers scored as 1, and heterozygotes scored as 2) and test center. All tests were two-tailed. rDLPFC, right dorsolateral prefrontal cortex.
In parallel with volume, the hypothesized KL-VS genotype relationship with executive function was also significant (P = 0.03) (Table4). KL-VS heterozygotes showed enhanced executive function, noncarriers showed average levels and KL-VS homozygotes showed the lowest levels. Post hoc pairwise comparisons using this model revealed that executive function in KL-VS heterozygotes was significantly better (P < 0.005, one-tailed) and in KL-VS homozygotes tended to be worse (P = 0.16, one-tailed), compared to noncarriers (Fig.5A). In all three genotype groups, executive function significantly declined with age (P = 5.25 × 10⁻⁵; no significant difference between slopes, P = 0.49), and baseline differed by KL-VS genotype (P < 0.0001) (Fig.5B; Table4). Volume of rDLPFC was positively correlated with executive function (P = 0.002, 0.15 ± 0.05), but there was no interaction between rDLPFC volume and KL-VS genotype on executive function via meta-analysis (P = 0.41) (Fig.5C).
Figure 5.
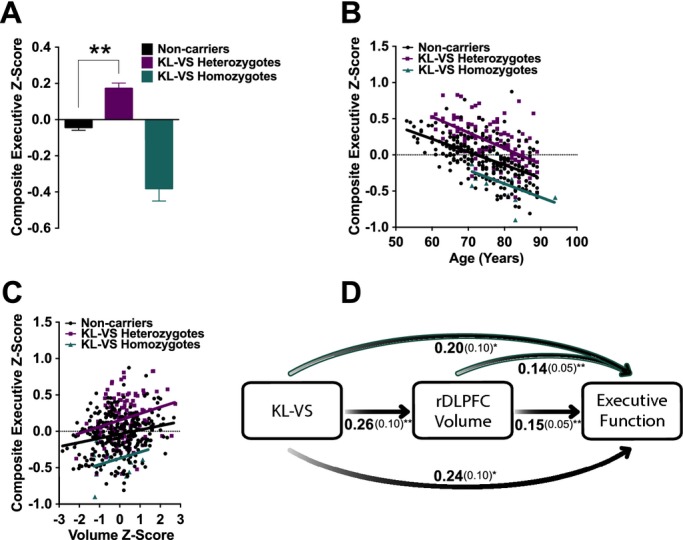
KL-VS heterozygosity and homozygosity are associated with executive function and this is partially mediated by right dorsolateral prefrontal cortex (DLPFC) volume. (A) KL-VS heterozygotes showed higher composite executive Z-scores than noncarriers and KL-VS homozygotes in meta-analysis (P = 0.03). Data are means ± SEM and were analyzed by a linear model adjusting for age, education, sex, APOE ε4 carrier status, and center. Post hoc pairwise comparisons using this model showed that executive function in KL-VS heterozygotes was significantly better (P < 0.005, one-tailed) and in KL-VS homozygotes tended to be worse (P = 0.16, one-tailed), compared to noncarriers. (B) Composite executive Z-scores as a function of age across KL-VS genotype. Across all ages, KL-VS heterozygotes had enhanced executive function whereas KL-VS homozygotes showed lower executive function via meta-analysis (P = 0.03). Overall genotype effects on baseline (P < 0.0001), but not their slopes over time (P = 0.49), were significantly different across groups. (C) rDLPFC volume positively correlated with executive function across KL-VS genotypes (P = 0.002). (D) Mediation analysis of direct and indirect effects of KL-VS genotype and rDLPFC volume as predictors of executive function in both Cohorts. Bivariate (black shaded arrows, middle, and bottom) and multivariate (teal outlined arrows, top) analyses show that each were significant predictors of executive function, indicating that KL-VS genotype effects on executive function were partially mediated by rDLPFC volume. Estimated effects (beta, in bold) of genotype and/or volume as predictors of cognition, along with the standard error (in parentheses), are provided for each analysis. *P < 0.05, **P < 0.01.
We performed mediation analysis using all three genotype groups. In bivariate models, KL-VS genotype significantly predicted rDLPFC volume (P = 0.01, 0.26 ± 0.10) and executive function (P = 0.02, 0.24 ± 0.10) (Fig.5D). rDLPFC volume also significantly predicted executive function (P = 0.002, 0.15 ± 0.05). In multivariate models, rDLPFC volume (P = 0.004, 0.14 ± 0.05) and KL-VS genotype (P = 0.048, 0.20 ± 0.10) were both significant predictors of executive function (Fig.5D). Approximately 16% of the KL-VS effect on executive function was mediated by rDLPFC volume in the analysis of all three genotype groups. As in the primary analyses, these data indicate that KL-VS-associated alterations in rDLPFC volume partially account for differing levels of executive function.
Discussion
Our data reveal that carrying a longevity-promoting variant of KL is associated with greater frontal brain volume and executive function. In two independent cohorts of healthy, cognitively normal older adults, carrying one copy of the KL-VS haplotype was strongly associated with greater volume of rDLPFC, a region vulnerable to structural and functional decline with aging.8,43–46 This advantage was limited to heterozygotes, as homozygotes tended to show reduced volume and function. The results of this study suggest that genetic influences on longevity, such as KL variants, may also promote structural and functional integrity of the brain.
KL-VS effects on brain structure and function were observed across all ages examined. These findings raise the possibility that klotho enhances “baseline” rDLPFC volume and executive function. Whether this positive neurogenetic influence on brain structure and function extrapolates to earlier life stages, or to diseases of the young or aging brain, requires further study.
Several methodological approaches were implemented to ensure validity of our findings. We used a multi-stage analytical framework for both identification and replication of rDLPFC brain structure findings associated with KL-VS heterozygosity. Since our findings were observed in two independent aging populations that include community-dwelling individuals, it is likely that our inferences extrapolate widely. Caveats of our study include inclusion of only Caucasians within the United States, raising the possibility that more varied environmental or genetic influences could mask effects in other populations. Genome-wide data were available to confirm non-Hispanic European ancestry within Cohort 2 but such data were not available for samples in Cohort 1, who were self-described Caucasian. The consistency of the estimated effect of KL-VS heterozygosity on brain volume and executive function in both cohorts suggests a low probability of confounding due to genetic variability. Neuroimaging data were acquired at two different field strengths, 1.5 and 3 T; sensitivity analysis of only 3 T data demonstrated similar results as those combining scan types, suggesting scanner differences contributed minimal variability.
KL-VS heterozygosity may contribute to better executive function by enhancing physiological and molecular mechanisms within affected networks and structures. Broadly, prefrontal cortex is central to sensory, motor, and limbic networks.50–52 Specifically, rDLPFC influences cognitive action control,48 working memory,53–55 motor learning,56 and emotion regulation57 in health and disease.58–63 Greater rDLPFC volume associated with carrying one copy of KL-VS may thus enhance function within multiple networks. Furthermore, the increase15,16 in circulating KL levels resulting from KL-VS heterozygosity may bolster molecular and physiological substrates of cognitive function. Interestingly, in animal models, genetic reduction of klotho leads to synaptic reduction64 and dysmyelination65; transgenic overexpression of klotho enhances cognition and synaptic plasticity, in part, through NMDA receptor-dependent mechanisms that are key to cognition.15 Thus, KL-VS heterozygosity may increase synaptic plasticity or enhance functional connectivity in networks linked to cognition.
While interactions with other genetic variants cannot be ruled out, the results of our single-gene analysis are in line with previous work. KL-VS heterozygosity was recently associated with enhanced global cognition in three independent cohorts of healthy older adults.15 Because the rDLPFC plays important roles in multiple domains of cognition, and because executive function can influence other cognitive domains, it is interesting to speculate that greater rDLPFC volume in KL-VS heterozygotes could contribute to broad enhancements in global cognition.
KL-VS homozygosity tended to be associated with smaller rDLPFC volume and worse executive function. These findings are consistent with previous work describing deleterious effects on lifespan,16 cardiovascular disease risk,23,30 and cognition29 from carrying two copies of this allele. It is unclear why KL-VS heterozygosity is beneficial and homozygosity tends to be deleterious. Possibilities include that heterozygosity may cause compensatory increases in wild-type KL protein levels while homozygosity may result in abnormally low levels or solely mutant KL. Alternatively, there may be adverse effects of abnormally high or low KL levels resulting from homozygosity. These possibilities require further study.
Region-specific changes in brain volume broadly impact brain health and cognition. While smaller regional volumes are implicated in decreased cognition due to stress66,67 or disease,68–70 less is known about whether larger volumes may boost individual cognitive abilities, provide resilience to disease, or predict healthy brain aging. A recent study showing that larger CA3 hippocampal subregions in young adults predict the precision of memory recall71 highlights a growing appreciation that anatomical variation is closely linked with function – and that bigger volumes can indicate better function. Our data that KL-VS heterozygosity predicts bigger rDLPFC and better executive function, at baseline, demonstrate a role for greater volume in enhanced executive function.
The aging brain is capable of maintaining overall function in the absence of disease6 and can be positively influenced by modifiers of structural integrity and synaptic function.9 Our data suggest that KL exerts a genetic influence on regional brain volume and its associated function at baseline and is a potential predictor of healthy brain aging. Whether KL-VS heterozygosity also provides resilience against neurodegenerative diseases such as Alzheimer's, other neurologic disease, or psychiatric disease is an important line of investigation.
Ultimately, understanding mechanisms by which heterozygous KL-VS carriers derive structural and functional benefits – along with characterizing KL-VS associations with neurologic and psychiatric disease – may enable us to predict brain health and identify protective strategies for combating age- and disease-related neural dysfunction.
Acknowledgments
Primary support for data analyses was provided by the Larry L. Hillblom Foundation 2012-A-015-FEL (J. S. Y.), NIA Diversity Supplement to P50 AG023501 (J. S. Y.; PI: B. L. M.), Paul Beeson Aging Award NIA AG034531 (D. B. D.), American Federation for Aging Research (D. B. D.), Coulter-Weeks Foundation (D. B. D.), Bakar Foundation (D. B. D.). Additional support, including for assembly of cohorts, provided by Hillblom Aging Network (B. L. M.), NIA AG032289 (J. K.), R01AG15819 (D. A. B.), and R01AG17917 (D. A. B.). We thank Katherine Rankin for support on neuroimaging analysis.
Conflict of Interest
The authors have no conflicts of interest. Dr. Miller has the following disclosures: he serves as Medical Director for the John Douglas French Foundation; Scientific Director for the Tau Consortium; Director/Medical Advisory Board Member of the Larry L. Hillblom Foundation; and Scientific Advisory Board Member for the National Institute for Health Research Cambridge Biomedical Research Centre and its subunit, the Biomedical Research Unit in Dementia (UK).
References
- Jack CR, Petersen RC, Xu Y, et al. Rate of medial temporal lobe atrophy in typical aging and Alzheimer's disease. Neurology. 1998;51:993–999. doi: 10.1212/wnl.51.4.993. [DOI] [PMC free article] [PubMed] [Google Scholar]
- Hinman JD, Abraham CR. What's behind the decline? The role of white matter in brain aging. Neurochem Res. 2007;32:2023–2031. doi: 10.1007/s11064-007-9341-x. [DOI] [PubMed] [Google Scholar]
- McDonald CR, McEvoy LK, Gharapetian L, et al. Regional rates of neocortical atrophy from normal aging to early Alzheimer disease. Neurology. 2009;73:457–465. doi: 10.1212/WNL.0b013e3181b16431. [DOI] [PMC free article] [PubMed] [Google Scholar]
- Small SA, Schobel SA, Buxton RB, et al. A pathophysiological framework of hippocampal dysfunction in ageing and disease. Nat Rev Neurosci. 2011;12:585–601. doi: 10.1038/nrn3085. [DOI] [PMC free article] [PubMed] [Google Scholar]
- Kerchner GA, Bernstein JD, Fenesy MC, et al. Shared vulnerability of two synaptically-connected medial temporal lobe areas to age and cognitive decline: a seven tesla magnetic resonance imaging study. J Neurosci. 2013;33:16666–16672. doi: 10.1523/JNEUROSCI.1915-13.2013. [DOI] [PMC free article] [PubMed] [Google Scholar]
- Creasey H, Rapoport SI. The aging human brain. Ann Neurol. 1985;17:2–10. doi: 10.1002/ana.410170103. [DOI] [PubMed] [Google Scholar]
- Raz N, Gunning FM, Head D, et al. Selective aging of the human cerebral cortex observed in vivo: differential vulnerability of the prefrontal gray matter. Cereb Cortex. 1997;7:268–282. doi: 10.1093/cercor/7.3.268. [DOI] [PubMed] [Google Scholar]
- Buckner RL. Memory and executive function review in aging and AD: multiple factors that cause decline and reserve factors that compensate. Neuron. 2004;44:195–208. doi: 10.1016/j.neuron.2004.09.006. [DOI] [PubMed] [Google Scholar]
- Raz N, Rodrigue KM. Differential aging of the brain: patterns, cognitive correlates and modifiers. Neurosci Biobehav Rev. 2006;30:730–748. doi: 10.1016/j.neubiorev.2006.07.001. [DOI] [PMC free article] [PubMed] [Google Scholar]
- Clapp WC, Rubens MT, Sabharwal J, Gazzaley A. Deficit in switching between functional brain networks underlies the impact of multitasking on working memory in older adults. Proc Natl Acad Sci USA. 2011;108:7212–7217. doi: 10.1073/pnas.1015297108. [DOI] [PMC free article] [PubMed] [Google Scholar]
- Wen W, Zhu W, He Y, et al. Discrete neuroanatomical networks are associated with specific cognitive abilities in old age. J Neurosci. 2011;31:1204–1212. doi: 10.1523/JNEUROSCI.4085-10.2011. [DOI] [PMC free article] [PubMed] [Google Scholar]
- Kenyon CJ. The genetics of ageing. Nature. 2010;464:504–512. doi: 10.1038/nature08980. [DOI] [PubMed] [Google Scholar]
- Kuro-o M, Matsumura Y, Aizawa H, et al. Mutation of the mouse klotho gene leads to a syndrome resembling ageing. Nature. 1997;390:45–51. doi: 10.1038/36285. [DOI] [PubMed] [Google Scholar]
- Kurosu H, Yamamoto M, Clark JD, et al. Suppression of aging in mice by the hormone Klotho. Science. 2005;309:1829–1833. doi: 10.1126/science.1112766. [DOI] [PMC free article] [PubMed] [Google Scholar]
- Dubal DB, Yokoyama JS, Zhu L, et al. Life extension factor klotho enhances cognition. Cell Rep. 2014;7:1065–1076. doi: 10.1016/j.celrep.2014.03.076. [DOI] [PMC free article] [PubMed] [Google Scholar]
- Arking DE, Krebsova A, Macek M, et al. Association of human aging with a functional variant of klotho. Proc Natl Acad Sci USA. 2002;99:856–861. doi: 10.1073/pnas.022484299. [DOI] [PMC free article] [PubMed] [Google Scholar]
- Tucker Zhou TB, King GD, Chen C, Abraham CR. Biochemical and functional characterization of the klotho-VS polymorphism implicated in aging and disease risk. J Biol Chem. 2013;288:36302–36311. doi: 10.1074/jbc.M113.490052. [DOI] [PMC free article] [PubMed] [Google Scholar]
- Matsumura Y, Aizawa H, Shiraki-Iida T, et al. Identification of the human klotho gene and its two transcripts encoding membrane and secreted klotho protein. Biochem Biophys Res Commun. 1998;242:626–630. doi: 10.1006/bbrc.1997.8019. [DOI] [PubMed] [Google Scholar]
- Shiraki-Iida T, Aizawa H, Matsumura Y, et al. Structure of the mouse klotho gene and its two transcripts encoding membrane and secreted protein. FEBS Lett. 1998;424:6–10. doi: 10.1016/s0014-5793(98)00127-6. [DOI] [PubMed] [Google Scholar]
- Liu H, Fergusson MM, Castilho RM, et al. Augmented Wnt signaling in a mammalian model of accelerated aging. Science. 2007;317:803–806. doi: 10.1126/science.1143578. [DOI] [PubMed] [Google Scholar]
- Kurosu H, Kuro-o M. The Klotho gene family and the endocrine fibroblast growth factors. Curr Opin Nephrol Hypertens. 2008;17:368–372. doi: 10.1097/MNH.0b013e3282ffd994. [DOI] [PubMed] [Google Scholar]
- Chang Q, Hoefs S, van der Kemp AW, et al. The beta-glucuronidase klotho hydrolyzes and activates the TRPV5 channel. Science. 2005;310:490–493. doi: 10.1126/science.1114245. [DOI] [PubMed] [Google Scholar]
- Arking DE, Atzmon G, Arking A, et al. Association between a functional variant of the KLOTHO gene and high-density lipoprotein cholesterol, blood pressure, stroke, and longevity. Circ Res. 2005;96:412–418. doi: 10.1161/01.RES.0000157171.04054.30. [DOI] [PubMed] [Google Scholar]
- Invidia L, Salvioli S, Altilia S, et al. The frequency of Klotho KL-VS polymorphism in a large Italian population, from young subjects to centenarians, suggests the presence of specific time windows for its effect. Biogerontology. 2010;11:67–73. doi: 10.1007/s10522-009-9229-z. [DOI] [PubMed] [Google Scholar]
- Hu MC, Kuro-o M, Moe OW. The emerging role of Klotho in clinical nephrology. Nephrol Dial Transplant. 2012;27:2650–2657. doi: 10.1093/ndt/gfs160. [DOI] [PMC free article] [PubMed] [Google Scholar]
- Folstein MF, Folstein SE, McHugh PR. “Mini-mental state”. A practical method for grading the cognitive state of patients for the clinician. J Psychiatr Res. 1975;12:189–198. doi: 10.1016/0022-3956(75)90026-6. [DOI] [PubMed] [Google Scholar]
- Browning SR, Browning BL. Rapid and accurate haplotype phasing and missing-data inference for whole-genome association studies by use of localized haplotype clustering. Am J Hum Genet. 2007;81:1084–1097. doi: 10.1086/521987. [DOI] [PMC free article] [PubMed] [Google Scholar]
- Abecasis GR, Auton A, Brooks LD, et al. An integrated map of genetic variation from 1,092 human genomes. Nature. 2012;491:56–65. doi: 10.1038/nature11632. [DOI] [PMC free article] [PubMed] [Google Scholar]
- Deary IJ, Harris SE, Fox HC, et al. KLOTHO genotype and cognitive ability in childhood and old age in the same individuals. Neurosci Lett. 2005;378:22–27. doi: 10.1016/j.neulet.2004.12.005. [DOI] [PubMed] [Google Scholar]
- Majumdar V, Nagaraja D, Christopher R. Association of the functional KL-VS variant of Klotho gene with early-onset ischemic stroke. Biochem Biophys Res Commun. 2010;403:412–416. doi: 10.1016/j.bbrc.2010.11.045. [DOI] [PubMed] [Google Scholar]
- Sturm VE, Yokoyama JS, Seeley WW, et al. Heightened emotional contagion in mild cognitive impairment and Alzheimer's disease is associated with temporal lobe degeneration. Proc Natl Acad Sci USA. 2013;110:9944–9949. doi: 10.1073/pnas.1301119110. [DOI] [PMC free article] [PubMed] [Google Scholar]
- Fleischman DA, Leurgans S, Arfanakis K, et al. Gray-matter macrostructure in cognitively healthy older persons: associations with age and cognition. Brain Struct Funct. 2013;219:2029–2049. doi: 10.1007/s00429-013-0622-7. [DOI] [PMC free article] [PubMed] [Google Scholar]
- Rankin KP, Kramer J, Miller BL. Patterns of cognitive and emotional empathy in frontotemporal lobar degeneration. Cogn Behav Neurol. 2005;18:28–36. doi: 10.1097/01.wnn.0000152225.05377.ab. [DOI] [PubMed] [Google Scholar]
- Bennett DA, Schneider JA, Buchman AS, et al. Overview and findings from the rush Memory and Aging Project. Curr Alzheimer Res. 2012;9:646–663. doi: 10.2174/156720512801322663. [DOI] [PMC free article] [PubMed] [Google Scholar]
- Ashburner J, Friston KJ. Voxel-based morphometry–the methods. Neuroimage. 2000;11(6 Pt 1):805–821. doi: 10.1006/nimg.2000.0582. [DOI] [PubMed] [Google Scholar]
- Wilson SM, Brambati SM, Henry RG, et al. The neural basis of surface dyslexia in semantic dementia. Brain. 2009;132(Pt 1):71–86. doi: 10.1093/brain/awn300. [DOI] [PMC free article] [PubMed] [Google Scholar]
- Ashburner J. A fast diffeomorphic image registration algorithm. Neuroimage. 2007;38:95–113. doi: 10.1016/j.neuroimage.2007.07.007. [DOI] [PubMed] [Google Scholar]
- Bates E, Wilson SM, Saygin A, et al. Voxel-based lesion-symptom mapping. Nat Neurosci. 2003;6:448–450. doi: 10.1038/nn1050. [DOI] [PubMed] [Google Scholar]
- Kimberg DY, Coslett HB, Schwartz MF. Power in voxel-based lesion-symptom mapping. J Cogn Neurosci. 2007;19:1067–1080. doi: 10.1162/jocn.2007.19.7.1067. [DOI] [PubMed] [Google Scholar]
- Tzourio-Mazoyer N, Landeau B, Papathanassiou D, et al. Automated anatomical labeling of activations in SPM using a macroscopic anatomical parcellation of the MNI MRI single-subject brain. Neuroimage. 2002;15:273–289. doi: 10.1006/nimg.2001.0978. [DOI] [PubMed] [Google Scholar]
- Ho AJ, Hua X, Lee S, et al. Comparing 3 T and 1.5 T MRI for tracking Alzheimer's disease progression with tensor-based morphometry. Hum Brain Mapp. 2010;31:499–514. doi: 10.1002/hbm.20882. [DOI] [PMC free article] [PubMed] [Google Scholar]
- Baron RM, Kenny DA. The moderator-mediator variable distinction in social psychological research: conceptual, strategic, and statistical considerations. J Pers Soc Psychol. 1986;51:1173–1182. doi: 10.1037//0022-3514.51.6.1173. [DOI] [PubMed] [Google Scholar]
- Morrison JH, Baxter MG. The ageing cortical synapse: hallmarks and implications for cognitive decline. Nat Rev Neurosci. 2012;13:240–250. doi: 10.1038/nrn3200. [DOI] [PMC free article] [PubMed] [Google Scholar]
- Hu S, Chao HH-A, Zhang S, et al. Changes in cerebral morphometry and amplitude of low-frequency fluctuations of BOLD signals during healthy aging: correlation with inhibitory control. Brain Struct Funct. 2014;219:983–994. doi: 10.1007/s00429-013-0548-0. [DOI] [PMC free article] [PubMed] [Google Scholar]
- Müller-Oehring EM, Schulte T, Rohlfing T, et al. Visual search and the aging brain: discerning the effects of age-related brain volume shrinkage on alertness, feature binding, and attentional control. Neuropsychology. 2013;27:48–59. doi: 10.1037/a0030921. [DOI] [PMC free article] [PubMed] [Google Scholar]
- Taki Y, Thyreau B, Kinomura S, et al. A longitudinal study of age- and gender-related annual rate of volume changes in regional gray matter in healthy adults. Hum Brain Mapp. 2013;34:2292–2301. doi: 10.1002/hbm.22067. [DOI] [PMC free article] [PubMed] [Google Scholar]
- Zimmerman ME, Brickman AM, Paul RH, et al. The relationship between frontal gray matter volume and cognition varies across the healthy adult lifespan. Am J Geriatr Psychiatry. 2006;14:823–833. doi: 10.1097/01.JGP.0000238502.40963.ac. [DOI] [PubMed] [Google Scholar]
- Cieslik EC, Zilles K, Caspers S, et al. Is there one DLPFC in cognitive action control? Evidence for heterogeneity from co-activation-based parcellation. Cereb Cortex. 2013;23:2677–2689. doi: 10.1093/cercor/bhs256. [DOI] [PMC free article] [PubMed] [Google Scholar]
- Barbey AK, Koenigs M, Grafman J. Dorsolateral prefrontal contributions to human working memory. Cortex. 2013;49:1195–1205. doi: 10.1016/j.cortex.2012.05.022. [DOI] [PMC free article] [PubMed] [Google Scholar]
- Robertson EM, Tormos JM, Maeda F, Pascual-Leone A. The role of the dorsolateral prefrontal cortex during sequence learning is specific for spatial information. Cereb Cortex. 2001;11:628–635. doi: 10.1093/cercor/11.7.628. [DOI] [PubMed] [Google Scholar]
- Miller EK, Cohen JD. An integrative theory of prefrontal cortex function. Annu Rev Neurosci. 2001;24:167–202. doi: 10.1146/annurev.neuro.24.1.167. [DOI] [PubMed] [Google Scholar]
- Koenigs M, Grafman J. The functional neuroanatomy of depression: distinct roles for ventromedial and dorsolateral prefrontal cortex. Behav Brain Res. 2009;201:239–243. doi: 10.1016/j.bbr.2009.03.004. [DOI] [PMC free article] [PubMed] [Google Scholar]
- Honey GD, Bullmore ET, Sharma T. Prolonged reaction time to a verbal working memory task predicts increased power of posterior parietal cortical activation. Neuroimage. 2000;12:495–503. doi: 10.1006/nimg.2000.0624. [DOI] [PubMed] [Google Scholar]
- Hillary FG, Genova HM, Chiaravalloti ND, et al. Prefrontal modulation of working memory performance in brain injury and disease. Hum Brain Mapp. 2006;27:837–847. doi: 10.1002/hbm.20226. [DOI] [PMC free article] [PubMed] [Google Scholar]
- Fried PJ, Rushmore RJ, Moss MB, et al. Causal evidence supporting functional dissociation of verbal and spatial working memory in the human dorsolateral prefrontal cortex. Eur J Neurosci. 2014;39:1973–1981. doi: 10.1111/ejn.12584. [DOI] [PMC free article] [PubMed] [Google Scholar]
- Lin C-HJ, Chiang M-C, Wu AD, et al. Enhanced motor learning in older adults is accompanied by increased bilateral frontal and fronto-parietal connectivity. Brain Connect. 2012;2:56–68. doi: 10.1089/brain.2011.0059. [DOI] [PubMed] [Google Scholar]
- Lévesque J, Eugène F, Joanette Y, et al. Neural circuitry underlying voluntary suppression of sadness. Biol Psychiatry. 2003;53:502–510. doi: 10.1016/s0006-3223(02)01817-6. [DOI] [PubMed] [Google Scholar]
- Sabatini U, Boulanouar K, Fabre N, et al. Cortical motor reorganization in akinetic patients with Parkinson's disease: a functional MRI study. Brain. 2000;123(Pt 2):394–403. doi: 10.1093/brain/123.2.394. [DOI] [PubMed] [Google Scholar]
- Cools R, Stefanova E, Barker RA, et al. Dopaminergic modulation of high-level cognition in Parkinson's disease: the role of the prefrontal cortex revealed by PET. Brain. 2002;125(Pt 3):584–594. doi: 10.1093/brain/awf052. [DOI] [PubMed] [Google Scholar]
- Whitfield-Gabrieli S, Thermenos HW, Milanovic S, et al. Hyperactivity and hyperconnectivity of the default network in schizophrenia and in first-degree relatives of persons with schizophrenia. Proc Natl Acad Sci USA. 2009;106:1279–1284. doi: 10.1073/pnas.0809141106. [DOI] [PMC free article] [PubMed] [Google Scholar]
- Chai XJ, Whitfield-Gabrieli S, Shinn AK, et al. Abnormal medial prefrontal cortex resting-state connectivity in bipolar disorder and schizophrenia. Neuropsychopharmacology. 2011;36:2009–2017. doi: 10.1038/npp.2011.88. [DOI] [PMC free article] [PubMed] [Google Scholar]
- Dreher J-C, Koch P, Kohn P, et al. Common and differential pathophysiological features accompany comparable cognitive impairments in medication-free patients with schizophrenia and in healthy aging subjects. Biol Psychiatry. 2012;71:890–897. doi: 10.1016/j.biopsych.2012.01.002. [DOI] [PMC free article] [PubMed] [Google Scholar]
- Lindberg O, Westman E, Karlsson S, et al. Is the subcallosal medial prefrontal cortex a common site of atrophy in Alzheimer's disease and frontotemporal lobar degeneration? Front Aging Neurosci. 2012;4:32. doi: 10.3389/fnagi.2012.00032. [DOI] [PMC free article] [PubMed] [Google Scholar]
- Shiozaki M, Yoshimura K, Shibata M, et al. Morphological and biochemical signs of age-related neurodegenerative changes in klotho mutant mice. Neuroscience. 2008;152:924–941. doi: 10.1016/j.neuroscience.2008.01.032. [DOI] [PubMed] [Google Scholar]
- Chen CD, Sloane JA, Li H, et al. The antiaging protein Klotho enhances oligodendrocyte maturation and myelination of the CNS. J Neurosci. 2013;33:1927–1939. doi: 10.1523/JNEUROSCI.2080-12.2013. [DOI] [PMC free article] [PubMed] [Google Scholar]
- Gilbertson MW, Shenton ME, Ciszewski A, et al. Smaller hippocampal volume predicts pathologic vulnerability to psychological trauma. Nat Neurosci. 2002;5:1242–1247. doi: 10.1038/nn958. [DOI] [PMC free article] [PubMed] [Google Scholar]
- Hanson JL, Chung MK, Avants BB, et al. Structural variations in prefrontal cortex mediate the relationship between early childhood stress and spatial working memory. J Neurosci. 2012;32:7917–7925. doi: 10.1523/JNEUROSCI.0307-12.2012. [DOI] [PMC free article] [PubMed] [Google Scholar]
- Duarte A, Hayasaka S, Du A, et al. Volumetric correlates of memory and executive function in normal elderly, mild cognitive impairment and Alzheimer's disease. Neurosci Lett. 2006;406:60–65. doi: 10.1016/j.neulet.2006.07.029. [DOI] [PMC free article] [PubMed] [Google Scholar]
- Jack CR, Lowe VJ, Weigand SD, et al. Serial PIB and MRI in normal, mild cognitive impairment and Alzheimer's disease: implications for sequence of pathological events in Alzheimer's disease. Brain. 2009;132(Pt 5):1355–1365. doi: 10.1093/brain/awp062. [DOI] [PMC free article] [PubMed] [Google Scholar]
- Dickerson BC, Bakkour A, Salat DH, et al. The cortical signature of Alzheimer's disease: regionally specific cortical thinning relates to symptom severity in very mild to mild AD dementia and is detectable in asymptomatic amyloid-positive individuals. Cereb Cortex. 2009;19:497–510. doi: 10.1093/cercor/bhn113. [DOI] [PMC free article] [PubMed] [Google Scholar]
- Chadwick MJ, Bonnici HM, Maguire EA. CA3 size predicts the precision of memory recall. Proc Natl Acad Sci USA. 2014;111:10720–10725. doi: 10.1073/pnas.1319641111. [DOI] [PMC free article] [PubMed] [Google Scholar]