

Abstract
We present histological, MRI, and clinical features of an adult patient with relapsing encephalomyelitis and antibodies against myelin oligodendrocyte glycoprotein (MOG). Furthermore, we report molecular details of the recognized epitope that is specific for human MOG. A brain biopsy revealed multiple sclerosis (MS)-type II pathology. Some features overlapped with both MS and neuromyelitis optica spectrum disorders (NMOSD), whereas others were distinct from both MS and NMOSD. Immunoadsorption and rituximab induced clinical stabilization. This case contributes a new, so far missing link in the emerging spectrum of MOG-antibody-associated encephalomyelitis.
Introduction
Antibodies (abs) to myelin oligodendrocyte glycoprotein (MOG) induce demyelination in rodents and primates.1 Therefore, identification of patients with anti-MOG abs may have diagnostic and therapeutic implications. Abs against conformationally intact MOG are very rare in adult MS patients, but occur in about one-fourth of patients with childhood MS and ADEM.1–3 Recent studies indicated that MOG antibodies are also present in some patients with anti-aquaporin-4 (AQP4)-negative neuromyelitis optica (NMO)/NMO spectrum disease (NMOSD),4,5 and in very few patients with demye-linating syndromes associated with anti-NMDA-receptor abs.6
Here, we present the first histopathology of an adult patient with relapsing-remitting encephalomyelitis and serum abs to MOG.
Case Report
Clinical course
A 66-year-old Caucasian woman first developed myelitis with leg weakness and hypaesthesia below Th7 in January 2011 (EDSS 3.5) (clinical course in Fig.1A). Spinal magnetic resonance imaging (sMRI) showed a T2-hyperintense, partially Gadolinium (Gd)-based contrast-enhancing (Gd+) lesion at Th8/9. Cerebral MRI (cMRI) demonstrated scattered “non-specific” white matter lesions. Visual evoked potentials were normal. Serum anti-AQP4 abs and NMDA-receptor abs were negative and detailed CSF analysis normal. Autoimmune myelitis was assumed and high-dose glucocorticosteroid (GC) therapy led to almost full recovery. Several relapses of myelitis occurred despite treatment with azathioprine and mycophenolate mofetil and incompletely recovered after high-dose GC. New lesions on sMRI (≤2 vertebral segments) appeared (Fig.2A1/2). In December 2012, she experienced another myelitis at the level C6/7 (Fig.2B1/2) and developed a symptomatic (EDSS 6.0) ponto-mesencephalic lesion with nausea, dysphagia, double vision, dysarthria, and left-sided facial paresis (Fig.2C1/2). Abs to MOG were measured for the first time and tested positive at this point. Subsequently, stored serum samples were also tested for MOG abs (Fig.1). Immunoadsorption (IA) followed by immunoglobulins (IVIG) led to marked clinical improvement. Therapy with rituximab (RX, 2 × 1 g) led to complete B-cell depletion. After minimal B-cell counts recovered in August 2013, the patient developed a massive, bilateral, parieto-occipital, confluent white matter lesion accompanied by visual apraxia and cognitive deficits that progressed despite GC and re-treatment with RX (Fig.2D1/2). A brain biopsy of this lesion within the splenium on the right side was performed and progressive multifocal leukoencephalopathy (PML) could be ruled out (JCV qPCR in CSF was also negative). Finally, the patient stabilized after repeated IA and IVIG as well as RX combined with low-dose oral GC (Fig. S1).
Figure 1.
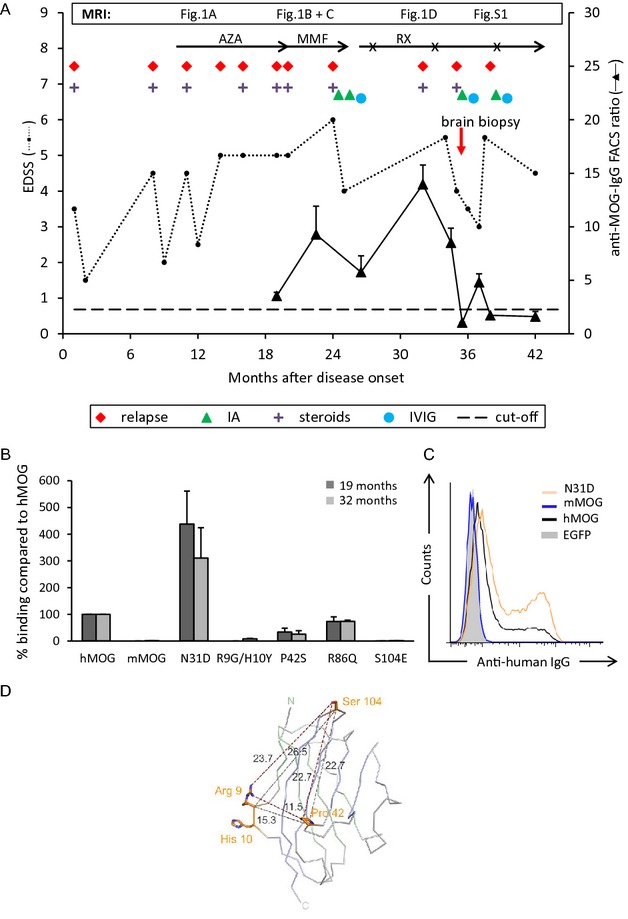
Clinical course and antibodies to MOG. (A) The dashed horizontal line indicates the threshold of anti-MOG positivity. (B) Reactivity to MOG variants at 19 (black) and 32 months (gray) after disease onset. Mean ± SEM of three replicates. (C) Reactivity to human MOG, MOG lacking glycosylation (N31D), and mouse MOG at month 32. (D) Visualization of amino acids recognized by the patient's autoantibodies. The structure of the human MOG model7 is shown as Cα-trace, Cα-atoms of the front β-sheet are colored blue, those of the back β-sheet green. The amino acids involved in antibody binding are shown as stick models. Cα-Cα and minimum side chain distances are given in Å. AZA, azathioprine; MMF, mycophenolate mofetil; RX, rituximab (RX courses are indicated with x); IA, immune adsorption; GC, glucocorticosteroids; EDSS, expanded disability status scale; MOG, myelin oligodendrocyte glycoprotein.
Figure 2.

MRI Findings. (A) sMRI (Nov 2011/10 months after disease onset) displaying a T2- hyperintense lesion on level Th3 (A1) with Gd-enhancement on T1w (A2) on sagittal sequences. (B) sMRI (Dec 2012/24 months after disease onset) showing a new cervical lesion on level C6 with T2 hyperintense signal, edema, zonal appearance (B1), and rim-enhancing pattern (B2). (C) cMRI (Dec 2012/24 months after disease onset), showing a sharply demarcated, zonally composed pontomesencephalic lesion across the midline. A tigroid or leopard pattern was noted on T2-weighted sequences with multiple small focal zones of normal white matter signal within the area of confluent signal hyperintensity (C1) and a rim-enhancing pattern after Gd administration (C2). (D) cMRI D1 (T2w) + D2 (T1w +Gd), Aug 2013/32 months after disease onset: bihemispheric, sharply demarcated confluent tumefactive parieto-occipital lesion across the splenium of the corpus callosum with rim-enhancing pattern. sMRI, spinal magnetic resonance imaging; cMRI, cerebral magnetic resonance imaging.
The patient's consent was obtained according to the declaration of Helsinki, and immunological blood and CSF investigations were approved by the local ethics committee.
Antibodies to MOG
Abs to MOG and the recognized epitopes were analyzed with a cell-based assay essentially as described.7 Briefly, HeLa cells were transfected with human MOG-EGFP or EGFP alone using Lipofectamine 2000 (Invitrogen, Carlsbad, California, USA)) and were incubated with serum diluted 1:50. Binding was determined with anti-human IgG-biotin followed by streptavidin-APC (Jackson ImmunoResearch, West Grove, Pennsylvania, USA). Anti-MOG reactivity was assessed by flow cytometry using a BD FACSVerse flow cytometer. We gated on EGFPhigh cells and calculated the ratio of the mean channel fluorescence intensity (MFI) of MOG-EGFP-transfected cells and cells transfected with EGFP alone in the APC channel. The threshold for the FACS ratio of MOG reactivity was set to the mean plus 3 SDs (2.27) of 39 control samples from healthy donors. The MOG-specific monoclonal ab (mAb) 8-18C5 (Ref7) was used as a positive control for transfection (Fig. S2A). Details about our assay, controls, and the MOG reactivity of this patient are presented in Figures1 and S2B.
The anti-MOG reactivity in our patient correlated with clinical disease activity and increased at month 32 after disease onset when a biopsy was performed because of disease exacerbation (Figs.1 and S2C), and subsequently dropped as a consequence of IA (Figs.1A and S2D) even below our detection limit. We compared the intensity of MOG reactivity seen in this patient with that observed in NMO patients with anti-MOG abs. To this end, we tested 24 patients with diagnosis of NMO from our outpatient clinic. Of the 24, 17 had antibodies to AQP4, but not to MOG. Two of the seven anti-AQP4-negative NMO patients scored positive for abs to MOG in our assay with an intensity comparable to the case described here (Fig. S2E–G).
The anti-MOG abs of the index patient had the complement-activating IgG1 isotype at months 19 (data not shown) and 32 (Fig.S2H) after disease onset. There was no evidence for intrathecal production of MOG abs (Fig. S2I). We identified amino acids on MOG (R9/H10, P42, S104) as critical for ab binding and noted that deglycosylated MOG was recognized better than human MOG (Fig.1B–D). No crossreactivity to mouse MOG was observed (Figs.1B and C, S2B). This is consistent with the fact that mouse MOG contains the mutants' amino acids G9/Y10 and S42. The pattern of epitope recognition stayed constant over time (Fig.1B).
Neuroimaging
During the observation period of 3 years, the patient's lesions on MRI spread in a caudo-cranial direction, starting with multifocal spinal cord lesions which extended over less than two vertebral segments, followed by brainstem involvement, and subsequently by a large bihemispheric white matter lesion. The ponto-mesencephalic and the large bihemispheric lesion in the splenium of the corpus callosum were sharply demarcated, zonally composed with circular Gd-enhancement in the periphery of the lesion. Lesions showed regression over time (Figs.2 and S1).
Neuropathological examination
The biopsy specimen contained normal appearing white matter, the zone of early active demyelination, and the late active center of the lesion. Overall, pathological analysis revealed an inflammatory demyelinating lesion with partial axonal preservation and reactive astrocytic scaring (Fig.3). Inflammation was reflected by T-lymphocytes (Fig.3A) and activated macrophages or microglia (Fig.3B). At the active lesion edge macrophages contained early myelin degradation products (Fig.3C), were reactive for MOG (Fig.3D) or proteolipid protein (PLP) (Fig.3E) and MOG immunoreactivity was diminished in comparison with that for PLP. In contrast, a substantial number of cells expressing cyclic nucleotide phosphodiesterase (CNPase), but not MOG or PLP, were present in the actively demyelinating zone, most likely representing late oligodendrocyte progenitor cells (Fig.3F). Profound reactivity for C9neo suggesting terminal complement activation was present at areas of active demyelination (Fig.3H), but not in the normal appearing white matter (Fig.3G) or the inactive lesion core (Fig3I). In the lesion center, numerous CNPase-positive premyelinating oligodendrocytes were present, but fully remyelinated lesion areas were not contained within the biopsy specimen (Fig.3J). Astrocytes showed changes of protoplasmatic and fibrillary gliosis without loss of AQP-4 or -1 reactivity (Fig.3K and L). Neurofilament staining showed preservation of axons in the demyelinated lesion (Fig.3M). Sections stained for amyloid precursor protein reveal a moderate number of axons with disturbed fast axons transport (Fig.3N). IgG profoundly accumulated in early active lesions (Fig.3O). Presence of JC-virus infection (PML) was excluded by immunohistochemistry. Details about applied antibodies and methods are included in the supplementary material.
Figure 3.

Immunohistochemical analyses of inflammation, demyelination, and complement activation. (A) Moderate tissue infiltration by CD8+ T-lymphocytes. (B) The active lesion edge is densely infiltrated by activated macrophages, expressing the p22 component of the NADPH oxidase complex. (C) In the same area, the macrophages contain luxol fast blue-positive myelin degradation products. (D) There is profound loss of MOG immunoreactivity at the active site of the lesion; MOG-positive granules can be seen in the cytoplasm of macrophages (early active lesion). (E) In comparison with MOG, there is more intense immunoreactivity for PLP; PLP is also seen in granular form in the cytoplasm of macrophages. (F) The most intense immunoreactivity for myelin-related proteins is seen for CNPase, which is also expressed in MOG-negative oligodendrocyte progenitor cells. Immunoreactivity for activated complement (C9neo antigen) is only present at the active lesion edge (H), but not in the normal appearing white matter (G), or the inactive lesion center (I). (H) At the active lesion edge C9neo reactivity is seen on myelinated fibers and in myelin degradation products within macrophages. In the lesion center complete demyelination is seen. (J) However, immunocytochemistry for CNPase shows numerous immunoreactive cells (premyelinating oligodendrocytes) and a fine meshwork of CNPase reactive fibers. Such changes are typical for very early stages of remyelination. (K) Astrocytes within the lesion are preserved, show reactive gliosis as seen by GFAP staining and (L) express aquaporin 4. (M) Immunocytochemistry for phosphorylated neurofilament shows preservation of axons in the demyelinated lesion. (N) Sections stained for amyloid precursor protein reveal a moderate number of axons with disturbed fast axons transport. (O, serial section to H) Staining for human immunoglobulin G shows profound accumulation of IgG in early active lesions; IgG is diffusely deposited in the lesions, but shows accentuation on fibrillar structures in a similar pattern as depicted for complement C9neo staining. Magnification bars: 50 μm. MOG, myelin oligodendrocyte glycoprotein; CNPase, cyclic nucleotide phosphodiesterase; PLP, proteolipid protein.
Discussion
The clinical and radiological features of this patient are different from recently reported anti-MOG-positive cases.6,8,9 Specifically, recurrent myelitis affected less than two vertebral segments, there was no evidence for optic nerve involvement, and several relapses occurred despite immunosuppressive therapy. Histopathological examination revealed severe demyelination with features designated previously as “pattern II MS”.10 This is distinct from the astrocytopathy typically seen in NMO.11 So far, there are no published reports of histopathological features of patients with anti-MOG Abs who clinically present as typical NMO/NMOSD. While lesions in brainstem and splenium can also be observed in NMOSD and in patients with anti-MOG and anti-NMDA-receptor abs,6,12,13 detailed MR imaging at different time points revealed features unusual for these disorders and MS: (1) lesions evolved in a caudo-cranial direction; (2) there was no longitudinally extensive transverse myelitis (LETM); (3) no otherwise typical MS lesions were seen; and (4) lesions had a zonal configuration and were sharply demarcated with rim-like Gd-enhancement.
The zonal configuration on MRI is in line with the histopathological features, such as the centrifugal expansion reflected by densely packed macrophages at the lesion edge and the preservation of CNPase-positive, premyelinating oligodendrocytes within the lesion edge and center. The early active lesion part was characterized by deposition of IgG and activated complement at the sites of ongoing demyelination. This is the histopathology previously described as MS lesion type II.10 Complement activation in the biopsy was restricted to the area of active demyelination. This was surprising, since blood–brain barrier damage with leakage of serum proteins was also seen in the periplaque white matter and within the lesion center. However, our data on the details of antibody binding show that deglycosylated MOG is much more effectively recognized by this patient's abs than glycosylated MOG. Possibly, there is reduced glycosylation at the site of active inflammation facilitating binding of abs to MOG on myelin sheaths resulting in complement activation. While no specific autoantibody has been consistently described in the majority of MS patients, we present here – to our knowledge – the first patient with “pattern II MS” and a specific autoantibody that is presumably linked to demyelination.
We assume that the anti-MOG abs in this patient contribute to the demyelination, because (1) the abs recognize extracellular MOG, (2) abs can access the CNS via the locally open blood–brain barrier, (3) abs have a complement-activating isotype, (4) the histopathology greatly resembles anti-MOG-mediated demyelination in animals and MS-type “pattern II”,10,14 and (5) the clinical response to IA indicates the presence of pathogenic antibodies.
The anti-human MOG IgG in our patient did not cross-react with mouse MOG, therefore direct proof of their pathogenicity cannot be obtained in rodent transfer models. Injection of IgG pooled from anti-MOG-positive NMO patients directly into the brain of mice resulted in transient pathology, consistent with the view that anti-MOG antibodies contribute to tissue destruction.15 The potential pathogenic activity of human abs to MOG is also supported by in vitro experiments: Abs to MOG have typically – as in the patient we describe here – the IgG1 isotype and such IgG1 abs to MOG were previously reported to induce complement mediated killing in transfectants.4 Furthermore, IgG from children with MOG abs induced cytoskeletal alterations in a human oligodendroglial cell line.16
We found that three loops connecting the β-strands of the extracellular Ig-V-like domain of MOG are involved in binding our patient's autoantibodies. The nearly complete loss of binding to R9G/H10Y and S104E indicates that both regions are bound simultaneously, consistent with the distances between the amino acids and the observed maximum dimensions of single epitopes of up to 21 × 28 Å.17
Longitudinal follow-up of MOG abs revealed an association between anti-MOG reactivity and clinical disease activity. Thus, abs to MOG may serve as a biomarker with therapeutic implications. We noted an increase of anti-MOG antibodies after replacing MMF with rituximab. The temporal stability of the recognized epitope pattern suggests that this increase is due to preexisting MOG-specific antibody secreting cells and memory B cells, and not to epitope spreading. The mechanism of the increase of anti-MOG reactivity remains unclear, but we previously observed in NMO patients that RX therapy resulted in an increase of the B-cell survival factor BAFF.18 Intriguingly, a transient increase of abs to AQP4 was previously observed in some patients after RX therapy and was linked to elevated BAFF levels.19 This issue requires further examinations.
In summary, this patient with abs to MOG has features that partly overlap with NMOSD and anti-NMDA receptor abs encephalitis (brainstem and spinal cord involvement, large lesion in the splenium) and partly with MS (histopathology, relapsing-remitting disease), while other features are distinct from NMOSD (no LETM, no optic nerve involvement) and anti-NMDA receptor abs encephalitis (no psychiatric abnormalities or autonomic dysfunction) as well as from MS (no oligoclonal bands, no typical periventricular lesions). We propose that this case contributes a new, possibly bridging element in the emerging spectrum of MOG antibody-associated encephalomyelitis.
Acknowledgments
We are grateful to G. Krishnamoorthy and N. Kawakami for comments on the manuscript. We thank F.-W. Kreth for performing the stereotactic needle biopsy and G. Buchholz for patient care. This study was supported by the Deutsche Forschungsgemeinschaft (SFB-TR 128; SyNergy), the Klinische Kompetenznetz Multiple Sklerose, Verein zur Therapieforschung für MS Kranke, Werner Reichenberger Stiftung, and Gemeinnützige Hertie Stiftung.
Author Contributions
M. Spadaro and M. C. Mayer determined anti-MOG antibodies, interpreted the data and edited the manuscript. C. Breithaupt interpreted the data and edited the manuscript. L. A. Gerdes and T. Kümpfel treated and evaluated the patient, interpreted the data, and wrote the manuscript. B. Ertl-Wagner analyzed the MRI data, interpreted the data, and wrote the manuscript. H. Lassmann and A. Giese performed neuropathological examination, analysis, interpretation, and manuscript writing. S. Laurent, M. Krumbholz, T. Högen, and A. Straube were involved in patient evaluation and care, interpretation of data, and manuscript editing. R. Hohlfeld supervised the patient care, interpreted the data, wrote and edited the manuscript. E. Meinl interpreted the data, wrote and edited the manuscript, and raised funding.
Conflict of Interest
None declared.
Supporting Information
Figure S1. MRI imaging. (A1 + A2) cMRI, T2w, showing tigroid/leopard pattern of large bihemispheric lesion in the splenium of the corpus callosum in August 2013/37 months after disease onset. (B) sMRI, T2w, showing regression of C7 lesion in January 2014/37 months after disease onset. (C) cMRI, T2w, showing regression of brainstem lesion in August 2013/37 months after disease onset. (D) cMRI, T2w (D1), T1 (D2) showing regression of large bihemispheric lesion in the splenium of the corpus callosum and lack of Gd-enhancement in June 2014/47 months after disease onset.
Figure S2. Detection of antibodies to MOG. (A) HeLa cells transiently transfected with human MOG were stained with the anti-MOG mAb 8-18C5 to ensure MOG expression. All cells showing a high EGFP fluorescence intensity were recognized by this mAb. (B) Serum from the index patient obtained 32 months after disease onset was diluted 1:50 and incubated with HeLa cells transfected with murine MOG-EGFP (left) and human MOG-EGFP (right). For FACS ratio calculation gates were set on cells with an EGFP expression level above 500 as indicated. (C) Dilution of the serum obtained at month 32 when the biopsy was performed. At this time point, the patient had an IgG concentration of 8.7 g/L. Serum was diluted from 1:50 (green) up to 1:450 (blue) and the IgG concentration in the diluted serum sample is given. (D) At month 35.5, the serum IgG concentration was 1.0 g/L, the IgG concentration in the diluted serum sample is given. The anti-MOG IgG dropped after immunoadsorption below the detection limit. (E–G) Sera from three anti-AQP4-negative NMO patients were diluted 1:50 and incubated with EGFP or human MOG-EGFP-transfected HeLa cells. The patient shown in E had a strong response, which dropped over time (FACS ratios 41.6, 10.7, and 3.14). The time points of blood drawing are given. The patient in F (FACS ratio 2.47) scored borderline positive, while the one in G (FACS ratio 1.05) was negative. (H) The isotype of the MOG-specific antibodies was analyzed using anti-human IgG1-4 in the serum sample obtained 32 months after disease onset. Anti-MOG antibodies were of the IgG1 isotype. (I) MOG-specific antibodies were identified at a serum dilution of 1:50 (left), they were not detected anymore when the serum was diluted (1:270) to the same IgG concentration of the corresponding CSF (middle). The serum/CSF pair was obtained at month 32. The solid lines indicate transfection with human MOG, the closed graphs transfection with EGFP (histograms C–G and I).
References
- Mayer MC, Meinl E. Glycoproteins as targets of autoantibodies in CNS inflammation: MOG and more. Ther Adv Neurol Disord. 2012;5:147–159. doi: 10.1177/1756285611433772. [DOI] [PMC free article] [PubMed] [Google Scholar]
- O'Connor KC, McLaughlin KA, De Jager PL, et al. Self-antigen tetramers discriminate between myelin autoantibodies to native or denatured protein. Nat Med. 2007;13:211–217. doi: 10.1038/nm1488. [DOI] [PMC free article] [PubMed] [Google Scholar]
- Reindl M, Di Pauli F, Rostasy K, Berger T. The spectrum of MOG autoantibody-associated demyelinating diseases. Nat Rev Neurol. 2013;9:455–461. doi: 10.1038/nrneurol.2013.118. [DOI] [PubMed] [Google Scholar]
- Mader S, Gredler V, Schanda K, et al. Complement activating antibodies to myelin oligodendrocyte glycoprotein in neuromyelitis optica and related disorders. J Neuroinflammation. 2011;8:184. doi: 10.1186/1742-2094-8-184. [DOI] [PMC free article] [PubMed] [Google Scholar]
- Kitley J, Woodhall M, Waters P, et al. Myelin-oligodendrocyte glycoprotein antibodies in adults with a neuromyelitis optica phenotype. Neurology. 2012;79:1273–1277. doi: 10.1212/WNL.0b013e31826aac4e. [DOI] [PubMed] [Google Scholar]
- Titulaer MJ, Höftberger R, Iizuka T, et al. Overlapping demyelinating syndromes and anti-N-methyl-d-aspartate receptor encephalitis. Ann Neurol. 2014;75:411–428. doi: 10.1002/ana.24117. [DOI] [PMC free article] [PubMed] [Google Scholar]
- Mayer MC, Breithaupt C, Reindl M, et al. Distinction and temporal stability of conformational epitopes on myelin oligodendrocyte glycoprotein recognized by patients with different inflammatory central nervous system diseases. J Immunol. 2013;191:3594–3604. doi: 10.4049/jimmunol.1301296. [DOI] [PubMed] [Google Scholar]
- Kitley J, Waters P, Woodhall M, et al. Neuromyelitis optica spectrum disorders with aquaporin-4 and myelin-oligodendrocyte glycoprotein antibodies: a comparative study. JAMA Neurol. 2014;71:276–283. doi: 10.1001/jamaneurol.2013.5857. [DOI] [PubMed] [Google Scholar]
- Sato DK, Callegaro D, Lana-Peixoto MA, et al. Distinction between MOG antibody-positive and AQP4 antibody-positive NMO spectrum disorders. Neurology. 2014;11:474–481. doi: 10.1212/WNL.0000000000000101. [DOI] [PMC free article] [PubMed] [Google Scholar]
- Lucchinetti C, Brück W, Parisi J, et al. Heterogeneity of multiple sclerosis lesions: implications for the pathogenesis of demyelination. Ann Neurol. 2000;47:707–717. doi: 10.1002/1531-8249(200006)47:6<707::aid-ana3>3.0.co;2-q. [DOI] [PubMed] [Google Scholar]
- Misu T, Höftberger R, Fujihara K, et al. Presence of six different lesion types suggests diverse mechanisms of tissue injury in neuromyelitis optica. Acta Neuropathol. 2013;125:815–827. doi: 10.1007/s00401-013-1116-7. [DOI] [PMC free article] [PubMed] [Google Scholar]
- Makino T, Ito S, Mori M, et al. Diffuse and heterogeneous T2-hyperintense lesions in the splenium are characteristic of neuromyelitis optica. Mult Scler. 2013;19:308–315. doi: 10.1177/1352458512454772. [DOI] [PubMed] [Google Scholar]
- Kim W, Kim SH, Huh SY, Kim HJ. Brain abnormalities in neuromyelitis optica spectrum disorder. Mult Scler Int. 2012;2012:735486. doi: 10.1155/2012/735486. [DOI] [PMC free article] [PubMed] [Google Scholar]
- Storch MK, Stefferl A, Brehm U, et al. Autoimmunity to myelin oligodendrocyte glycoprotein in rats mimics the spectrum of multiple sclerosis pathology. Brain Pathol. 1998;8:681–694. doi: 10.1111/j.1750-3639.1998.tb00194.x. [DOI] [PMC free article] [PubMed] [Google Scholar]
- Saadoun S, Waters P, Owens GP, et al. Neuromyelitis optica MOG-IgG causes reversible lesions in mouse brain. Acta Neuropathol Commun. 2014;2:35. doi: 10.1186/2051-5960-2-35. [DOI] [PMC free article] [PubMed] [Google Scholar]
- Dale RC, Tantsis EM, Merheb V, et al. Antibodies to MOG have a demyelination phenotype and affect oligodendrocyte cytoskeleton. Neurol Neuroimmunol Neuroinflamm. 2014;1:e12. doi: 10.1212/NXI.0000000000000012. [DOI] [PMC free article] [PubMed] [Google Scholar]
- Ramaraj T, Angel T, Dratz EA, et al. Antigen-antibody interface properties: composition, residue interactions, and features of 53 non-redundant structures. Biochim Biophys Acta. 2012;1824:520–532. doi: 10.1016/j.bbapap.2011.12.007. [DOI] [PMC free article] [PubMed] [Google Scholar]
- Pellkofer HL, Krumbholz M, Berthele A, et al. Long-term follow-up of patients with neuromyelitis optica after repeated therapy with rituximab. Neurology. 2011;76:1310–1315. doi: 10.1212/WNL.0b013e3182152881. [DOI] [PubMed] [Google Scholar]
- Nakashima I, Takahashi T, Cree BA, et al. Transient increases in anti-aquaporin-4 antibody titers following rituximab treatment in neuromyelitis optica, in association with elevated serum BAFF levels. J Clin Neurosci. 2011;18:997–998. doi: 10.1016/j.jocn.2010.12.011. [DOI] [PubMed] [Google Scholar]
Associated Data
This section collects any data citations, data availability statements, or supplementary materials included in this article.
Supplementary Materials
Figure S1. MRI imaging. (A1 + A2) cMRI, T2w, showing tigroid/leopard pattern of large bihemispheric lesion in the splenium of the corpus callosum in August 2013/37 months after disease onset. (B) sMRI, T2w, showing regression of C7 lesion in January 2014/37 months after disease onset. (C) cMRI, T2w, showing regression of brainstem lesion in August 2013/37 months after disease onset. (D) cMRI, T2w (D1), T1 (D2) showing regression of large bihemispheric lesion in the splenium of the corpus callosum and lack of Gd-enhancement in June 2014/47 months after disease onset.
Figure S2. Detection of antibodies to MOG. (A) HeLa cells transiently transfected with human MOG were stained with the anti-MOG mAb 8-18C5 to ensure MOG expression. All cells showing a high EGFP fluorescence intensity were recognized by this mAb. (B) Serum from the index patient obtained 32 months after disease onset was diluted 1:50 and incubated with HeLa cells transfected with murine MOG-EGFP (left) and human MOG-EGFP (right). For FACS ratio calculation gates were set on cells with an EGFP expression level above 500 as indicated. (C) Dilution of the serum obtained at month 32 when the biopsy was performed. At this time point, the patient had an IgG concentration of 8.7 g/L. Serum was diluted from 1:50 (green) up to 1:450 (blue) and the IgG concentration in the diluted serum sample is given. (D) At month 35.5, the serum IgG concentration was 1.0 g/L, the IgG concentration in the diluted serum sample is given. The anti-MOG IgG dropped after immunoadsorption below the detection limit. (E–G) Sera from three anti-AQP4-negative NMO patients were diluted 1:50 and incubated with EGFP or human MOG-EGFP-transfected HeLa cells. The patient shown in E had a strong response, which dropped over time (FACS ratios 41.6, 10.7, and 3.14). The time points of blood drawing are given. The patient in F (FACS ratio 2.47) scored borderline positive, while the one in G (FACS ratio 1.05) was negative. (H) The isotype of the MOG-specific antibodies was analyzed using anti-human IgG1-4 in the serum sample obtained 32 months after disease onset. Anti-MOG antibodies were of the IgG1 isotype. (I) MOG-specific antibodies were identified at a serum dilution of 1:50 (left), they were not detected anymore when the serum was diluted (1:270) to the same IgG concentration of the corresponding CSF (middle). The serum/CSF pair was obtained at month 32. The solid lines indicate transfection with human MOG, the closed graphs transfection with EGFP (histograms C–G and I).