Abstract
Objective
Signaling via β-adrenergic receptors activates heterotrimeric G-proteins, which dissociate into α and βγ subunits. In salivary glands, the α subunit of Gs stimulates adenylate cyclase, increasing cyclic AMP levels and promoting exocytosis. The goals of this study were to determine Gαs localization in salivary glands and whether it undergoes redistribution upon activation.
Methods
Mouse parotid and submandibular (SMG) glands were fixed with paraformaldehyde and prepared for immunofluorescence labeling with anti-Gαs.
Results
In unstimulated parotid and SMG acinar cells, Gαs was localized mainly to basolateral membranes. Some parotid acinar cells also exhibited cytoplasmic fluorescence. Isoproterenol (IPR) stimulation resulted in decreased membrane fluorescence and increased cytoplasmic fluorescence, which appeared relatively uniform by 30 min. Beginning about 2 hr after IPR, cytoplasmic fluorescence decreased and membrane fluorescence increased, approaching unstimulated levels in SMG acini by 4 hr. Some parotid acini exhibited cytoplasmic fluorescence up to 8 hr after IPR. The IPR-induced redistribution of Gαs was prevented (SMG) or reduced (parotid) by prior injection of propranolol. Striated duct cells of unstimulated mice exhibited general cytoplasmic fluorescence, which was unchanged after IPR.
Conclusions
Gαs is localized to basolateral membranes of unstimulated salivary acinar cells. Activation of Gαs causes its release from the cell membrane and movement into the cytoplasm. Reassociation of Gαs with the membrane begins about 2 hr after stimulation in the SMG, but complete reassociation takes several hours in the parotid gland. The presence of Gαs in striated duct cells suggests a role in signal transduction of secretion and/or electrolyte transport processes.
Keywords: Heterotrimeric G-proteins, Parotid gland, Submandibular gland, Immunofluorescence, Isoproterenol, Propranolol
Introduction
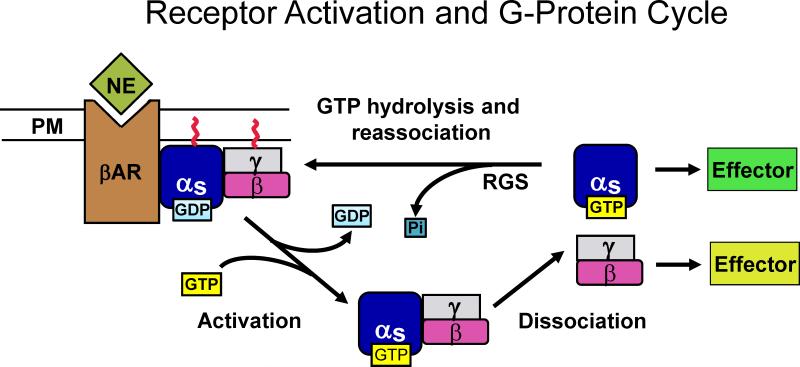
Signal transduction via cell surface β-adrenergic receptors involves heterotrimeric guanosine triphosphate (GTP) binding proteins (G-proteins), which consist of an α-subunit that binds and hydrolyzes GTP and β- and γ-subunits that form a stable complex (1, 2). G-proteins are peripheral membrane proteins associated with G-protein-coupled receptors (GPCRs) and bound to the inner side of the plasma membrane via covalent lipid modifications (3, 4). In the inactive state, guanosine diphosphate (GDP) is bound to the α-subunit (Figure 1). Ligand binding to a GPCR results in exchange of GTP for GDP, activating the G-protein and releasing it from the receptor. The α-subunit then dissociates from the βγ complex and modulates the activity of an effector protein, leading to a change in the concentration of an intracellular second messenger. In the Gs G-protein family, the Gαs subunit activates adenylate cyclase, which forms cyclic AMP (cAMP) from ATP, initiating cAMP-dependent signaling cascades. Hydrolysis of GTP due to the intrinsic GTPase activity of Gαs allows reassociation of the α and βγ subunits and termination of the signal.
Figure 1.
β-Adrenergic receptor activation and the G-protein cycle. In the resting state, the heterotrimeric G-protein, Gs, is bound to the β-adrenergic receptor (βAR), and anchored to the plasma membrane (PM) via covalently attached lipid molecules. Norepinephrine (NE) released from sympathetic nerve terminals in the salivary glands binds to the βAR, resulting in activation of Gs. Cytoplasmic GTP is exchanged for GDP on the Gα subunit, causing release of Gs from the receptor and dissociation of the Gα and Gβγ subunits. In salivary gland acinar cells Gα then activates the effector protein, adenylate cyclase, which forms cAMP from ATP. Gβγ may activate other effector proteins. Hydrolysis of GTP, accelerated by regulator of G-protein signaling (RGS) proteins, results in reassociation of Gα and Gβγ, and subsequent reassociation of Gs with the βAR. (For color reproduction on the Web and in print.)
Salivary glands have been used extensively to study mechanisms of protein secretion, and provided early evidence implicating cyclic AMP as a second messenger in the process of exocytosis (5, 6). In rodent parotid and submandibular (SMG) glands, exocytosis is stimulated mainly by binding of the sympathetic neurotransmitter norepinephrine to β-adrenergic receptors, which are GPCRs. Several Gα proteins are present in salivary glands. Gαs, Gαi1/2 and Gαi3 have been identified biochemically in salivary gland plasma membranes and secretory granule membranes (7, 8). Transcripts for Gαq, Gα11 and Gα14, and their translation products, have been detected in rat SMG by RT-PCR and Western blotting (9). The α-subunit of G0 has been localized immunocytochemically mainly to duct cells of rat and mouse parotid and SMG (10).
Previous studies of several cell types in vitro have shown that upon activation and dissociation from Gβγ, Gαs is released from the cell membrane and moves into the cytoplasm (11-17). Initially, the internalized Gαs appears to be distributed diffusely throughout the cytoplasm; at later times it is associated with intracellular vesicles (12, 14). Release from the cell membrane is thought to be due to depalmitoylation of Gαs (12, 18); its association with vesicular membranes is due to repalmitoylation (19). In these systems, upon termination of receptor stimulation, Gαs reassociates with the plasma membrane.
The specific localization of Gαs in salivary glands, i.e., cell type, membrane domain, etc., as well as its possible redistribution upon receptor stimulation and G-protein activation, remain unknown. The goals of this study, therefore, were to determine the localization of Gαs in the cells of the parotid and SMG of mice, and to determine the effect of in vivo β-adrenergic receptor stimulation on its intracellular distribution.
Materials and Methods
Animals
Nineteen adult male and female B6SJLF1 mice, 3 – 6.5 months old, were used in these experiments. The mice were housed in plastic cages and provided with standard laboratory chow and water, ad libitum. Some mice were injected with the norepinephrine analog isoproterenol (IPR, 10 mg/kg, i.p.; Sigma-Aldrich, St. Louis, MO, USA) 15 or 30 min, or 1, 2, 4, 6 or 8 hr prior to tissue fixation. Additionally, some mice were injected with the β-receptor antagonist propranolol (20 mg/kg, i.p.; Sigma-Aldrich) 30 min prior to IPR. All animals were anesthetized deeply with a mixture of Ketamine and Xylazine (90 mg and 10 mg per kg body weight, i.p.) prior to tissue collection, and were euthanized by exsanguination. Housing and care of the mice were carried out according to the Guide for the Care and Use of Laboratory Animals, and all procedures were approved by the Institutional Animal Care and Use Committee of the University of Connecticut Health Center.
Tissue Preparation
The salivary glands were fixed either by immersion or by vascular perfusion with 4% paraformaldehyde buffered with 0.1 M sodium cacodylate, pH 7.4. For immersion fixation, the parotid and SMG were excised from anesthetized animals, placed in a drop of fixative solution, cut into pieces 2-4 mm on a side and placed in fresh fixative solution at 4°C for 16-24 hours. For perfusion fixation, the abdomen and thorax of anesthetized animals were opened, the right atrium of the heart was cut, a 21-gauge needle connected via tubing to a reservoir of fixative solution was inserted into the left ventricle, and vascular perfusion of the fixative solution was carried out for about 5 min. After excision, the parotid and SMG were placed in fresh fixative solution, as above. The fixed tissues were then stored in 1% buffered paraformaldehyde at 4°C.
The fixed tissues were cryoprotected with 30% sucrose, embedded in OCT, and rapidly frozen in isopentane cooled by dry ice. Frozen sections were cut at 10 μm in a cryostat and collected on Super Frost Plus slides (Fisher Scientific, Fairlawn, NJ). The frozen sections were stored in a tightly closed box at -20°C for a few days prior to immunolabeling.
Immunofluorescence
The sections were rinsed 3 times with phosphate buffered saline (PBS) for 5 min each, then treated with 1% BSA / 5% normal goat serum in PBS for 30 min to block non-specific binding. The sections were incubated with an affinity purified antibody made against the 10 C-terminal amino acids of Gαs (RM, 3-6 μg/ml; [20]) for 60 min at room temperature; the antibody was kindly provided by Teresa Jones (National Institutes of Health). After 3 rinses with PBS for 5 min each, the sections were incubated with FITC-labeled goat anti-rabbit IgG (KPL, Gaithersburg, MD) for 30 min at room temperature. After thorough rinsing with PBS, cover slips were mounted with Vectashield (Vector Laboratories, Burlingame, CA) and the sections were observed in a Leitz Orthoplan microscope with epifluoresence illumination. Qualitative assessments of fluorescence distribution were made using images recorded on Kodak Elite Chrome 200 film. The 35 mm slides were scanned in an Agfa DuoScan or Epson Perfection V750 Pro scanner; using Photoshop (version 7.0) or CS4 Extended (version 11.0.2) (Adobe Systems Incorporated, San Jose, CA) the overall brightness of the scanned images was reduced about 30% to approximate the brightness observed in the microscope.
Fluorescence Intensity Measurement
Membrane and cytoplasmic fluorescence intensities of acinar cells were determined by the method of Freudzon et al. (15). Images were obtained from the immunolabeled sections with a Zeiss Pascal LSM5 confocal microscope (Carl Zeiss, Inc., Thornwood, NY) using a 40x 1.2 NA objective lens, with 488 nm dichroic and 515-530 nm emission filters. Membrane-associated and cytoplasmic fluorescence intensities were measured using MetaMorph software (Molecular Devices Corp., Downingtown, PA), corrected for background fluorescence measured on sections incubated with non-immune IgG instead of anti-Gαs, and membrane : cytoplasm ratios were calculated. Thirty-eight to 66 individual measurements were made on parotid sections, and 12-39 measurements were made on SMG sections. To determine fluorescence intensities of striated ducts, separate apical (supranuclear) and basal (infranuclear) areas were outlined in the MetaMorph program, the average fluorescence intensity was determined for each area, and the apical : basal ratio was calculated for each pair of measurements. Seven to 24 pairs of measurements were made on parotid sections, and 7-23 pairs of measurements were made on SMG sections. One-way ANOVA and two-tailed t-tests were used to assess statistical significance of differences in fluorescence intensities.
Results
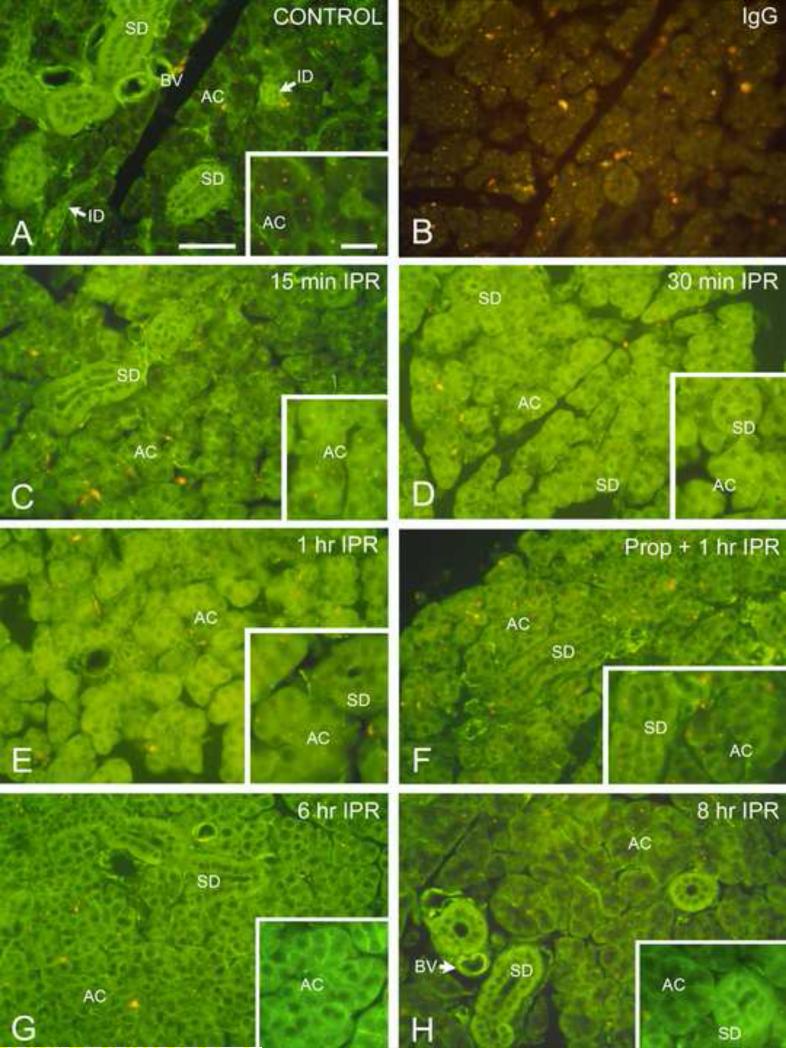
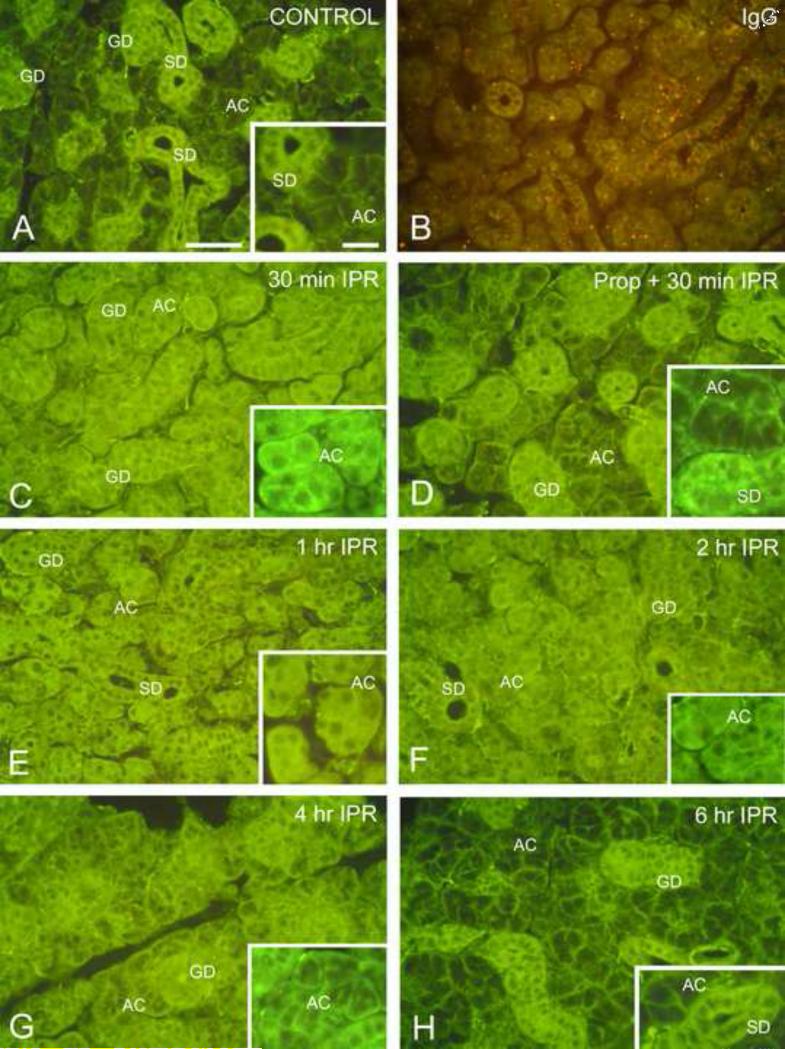
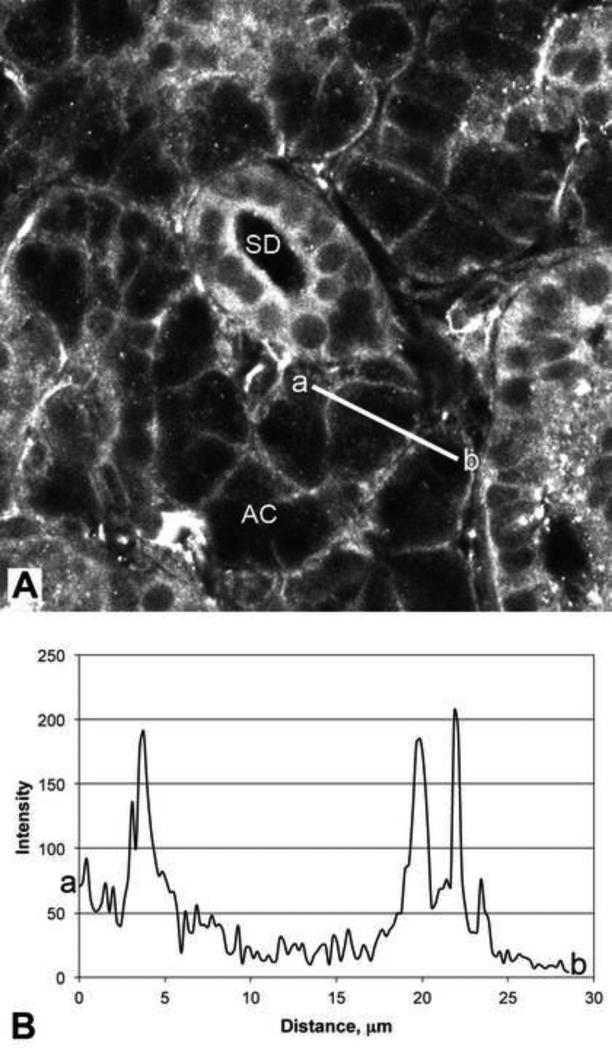
In the mouse parotid and SMG, Gαs was mainly localized to the basolateral plasma membranes of acinar cells (Figs. 2A, 3A, 4A and 4C). The predominant plasma membrane localization was confirmed by confocal microscopy and fluorescence intensity measurements (Fig. 5). Rarely, some fluorescence was noted along the luminal membrane. Gαs fluorescence also appeared to be present throughout the cytoplasm of intercalated, striated and granular duct cells (Figs. 2A, 3A, 4A, 4E and 4G). Small blood vessels and some nerves adjacent to acinar and duct cells exhibited relatively bright fluorescence. No specific fluorescence or significant levels of autofluorescence were observed in sections of unstimulated (Fig. 2B) or isoproterenol stimulated (Fig. 3B) glands incubated with non-immune IgG or BSA/NGS instead of the anti-Gαs antibody. Orange autofluorescence of lysosomes was particularly prominent in these sections.
Figure 2.
Immunofluorescence localization of Gαs in mouse parotid gland. Scale bars: main panels, 50 μm; insets, 20 μm. (For color reproduction on the Web and in print.)
A. Unstimulated control. In the secretory acinar cells (AC), Gαs is localized to the basolateral membranes; minimal cytoplasmic labeling is observed. Cells of the striated (SD) and intercalated (ID) ducts show strong cytoplasmic fluorescence. Smooth muscle cells surrounding small blood vessels (BV) also are labeled.
B. Unstimulated control incubated with non-immune IgG. Weak non-specific fluorescence is seen in the acini and ducts. Lysosomes exhibit orange autofluorescence.
C. Isoproterenol, 15 min. Gαs fluorescence is seen along the cell membranes and present in the cytoplasm of the acinar cells (AC). No fluorescence is present in the nuclei. Apical fluorescence in the striated ducts (SD) appears to be increased.
D. Isoproterenol, 30 min. Most of the fluorescence in acinar cells (AC) is cytoplasmic, and membrane-associated fluorescence is further reduced. Apical fluorescence is still present in the striated ducts (SD).
E. Isoproterenol, 1 hr. Acinar cell (AC) cytoplasm remains fluorescent, however, the apical labeling of striated ducts (SD) appears reduced (inset). A similar distribution of fluorescence was seen at 2 hr and 4 hr after isoproterenol administration.
F. Propranolol/Isoproterenol, 1 hr. Administration of the β-receptor antagonist propranolol 30 min prior to isoproterenol reduces redistribution of Gαs. Cytoplasmic fluorescence of acinar cells (AC) is reduced, and some Gαs remains associated with the cell membranes. Striated duct (SD).
G. Isoproterenol, 6 hr. The acinar cells (AC) exhibit decreased cytoplasmic fluorescence and increased membrane-associated fluorescence. Apical fluorescence of striated duct (SD) cells is reduced.
H. Isoproterenol, 8 hr. The distribution of fluorescence is similar to that of the unstimulated control gland. Most acinar cells (AC) show basolateral membrane-associated fluorescence, and minimal cytoplasmic fluorescence. Intense cytoplasmic fluorescence is seen in striated ducts (SD);.apical fluorescence is diminished. Blood vessel (BV).
Figure 3.
Immunofluorescence localization of Gαs in mouse submandibular gland. Scale bars: main panels, 50 μm; insets, 20 μm. (For color reproduction on the Web and in print.)
A. Unstimulated control. In the secretory acinar cells (AC), Gαs is localized to the basolateral membranes of the cells; minimal cytoplasmic labeling is observed. Cells of the striated (SD) and granular (GD) ducts show strong cytoplasmic fluorescence.
B. Isoproterenol, 2 hr; incubated with non-immune IgG. Weak non-specific fluorescence is seen in the acini and ducts. Lysosomes exhibit orange autofluorescence.
C. Isoproterenol, 30 min. Most of the fluorescence in acinar cells (AC) is located in the cytoplasm; membrane-associated fluorescence is substantially reduced. Some apical fluorescence is seen in the striated and granular ducts (GD).
D. Propranolol/Isoproterenol, 30 min. Administration of the β-receptor antagonist, propranolol, 30 min prior to isoproterenol, reduces redistribution of Gαs. Most of the fluorescence in acinar cells (AC) is associated with the cell membranes, similar to the unstimulated control gland. Only low levels of fluorescence are present in the acinar cell cytoplasm. Fluorescence is present throughout the cytoplasm of striated (SD) and granular ducts (GD).
E. Isoproterenol, 1 hr. Fluorescence is present throughout the acinar cell (AC) cytoplasm; little or no membrane-associated fluorescence is seen. Apical labeling of striated (SD) and granular ducts (GD) is still apparent.
F. Isoproterenol, 2 hr. The acinar cells (AC) exhibit slightly decreased cytoplasmic fluorescence and increased membrane-associated fluorescence. Apical labeling of striated (SD) and granular ducts (GD) is still apparent.
G. Isoproterenol, 4 hr. Cytoplasmic fluorescence of the acinar cells (AC) is reduced, and membrane-associated fluorescence is increased. Granular duct (GD).
H. Isoproterenol, 6 hr. The distribution of fluorescence is similar to that of the unstimulated control gland. Most acinar cells (AC) show basolateral membrane-associated fluorescence, and minimal cytoplasmic fluorescence. Strong cytoplasmic fluorescence is seen in striated (SD) and granular ducts (GD), but apical fluorescence appears reduced.
Figure 4.
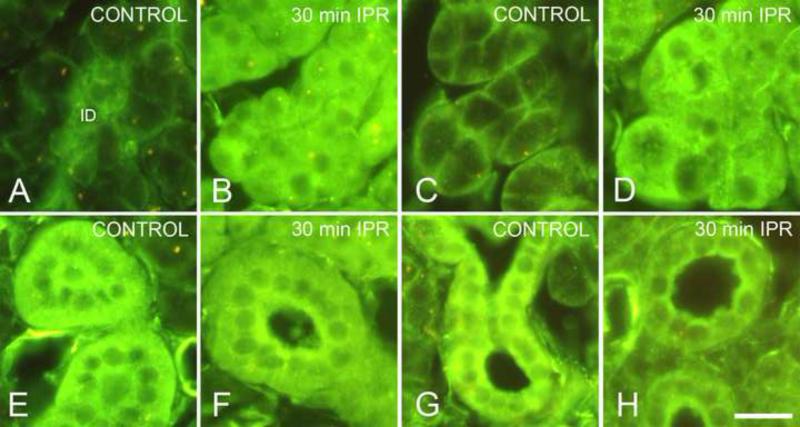
Distribution of Gαs in acinar and striated duct cells. Scale bar = 20 μm. (For color reproduction on the Web and in print.)
A. Parotid acinar cells, unstimulated control. Basolateral membranes of acinar cells are labeled; intercalated duct cells (ID) show cytoplasmic labeling.
B. Parotid acinar cells, 30 min isoproterenol. Gαs is distributed throughout the cytoplasm of acinar cells; nuclei are unlabeled.
C. Submandibular acinar cells, unstimulated control. Basolateral membranes of acinar cells are labeled.
D. Submandibular acinar cells, 30 min isoproterenol. Gαs is distributed throughout the cytoplasm of acinar cells.
E. Parotid striated duct, unstimulated control. Gαs is distributed throughout the cytoplasm of striated duct cells.
F. Parotid striated duct, 30 min isoproterenol. Fluorescence intensity appears greater in the apical cytoplasm of striated duct cells.
G. Submandibular striated duct, unstimulated control. Gαs is distributed throughout the cytoplasm of striated duct cells.
H. Submandibular striated duct, 1 hr isoproterenol. Fluorescence intensity appears greater in the apical cytoplasm of striated duct cells.
Figure 5.
Fluorescence intensity distribution in submandibular acinar cells.
A. Confocal image of a section of an unstimulated submandibular gland labeled with antibody to Gαs. The line a-b indicates the path and length of the intensity scan shown in panel B. Acinar cells (AC); striated duct (SD).
B. Fluorescence intensity scan across the acinar cell shown in panel A. The beginning of the scan is indicated by ‘a’, and the end of the scan by ‘b’. The peaks at 4, 20 and 22 μm represent Gαs associated with the plasma membrane.
Stimulation of β-adrenergic receptors by in vivo injection of IPR caused apparent dissociation of Gαs from the acinar plasma membrane and diffusion throughout the cytoplasm. This was apparent as an overall increase in cytoplasmic fluorescence, evident in many cells at 15 min after IPR injection (Fig. 2C), and in essentially all acinar cells by 30 min (Figs. 2D, 3C, 4B and 4D). No fluorescence was observed in the nuclei (insets, Figs. 2C, 2D, 3C and 3E; Fig. 4B and 4D).
In parotid acinar cells, cytoplasmic fluorescence was high at 1 hr (Fig. 2E) and remained elevated up to 4 hr after IPR injection. At 6 hr after IPR (Fig. 2G) cytoplasmic fluorescence had decreased and plasma membrane fluorescence was increased, suggesting reassociation of Gαs with the plasma membrane. By 8 hr after IPR (Fig. 2H), the distribution of fluorescence was similar to that in unstimulated glands.
In the SMG, a reduction in cytoplasmic fluorescence and apparent reassociation of Gαs with the plasma membrane was detectable by 2 hr after IPR stimulation (Figs. 3E and 3F), was further advanced by 4 hr (Fig. 3G), and appeared to be complete by 6 hr after stimulation (Fig. 3H).
Pre-injection of the β-receptor antagonist propranolol reduced the dissociation of Gαs from the acinar cell plasma membrane caused by IPR in both the parotid and SMG (Figs. 2F and 3D), although this effect was more evident in the SMG. This indicates that the IPR-induced redistribution of Gαs occurred in response to β-adrenergic receptor stimulation.
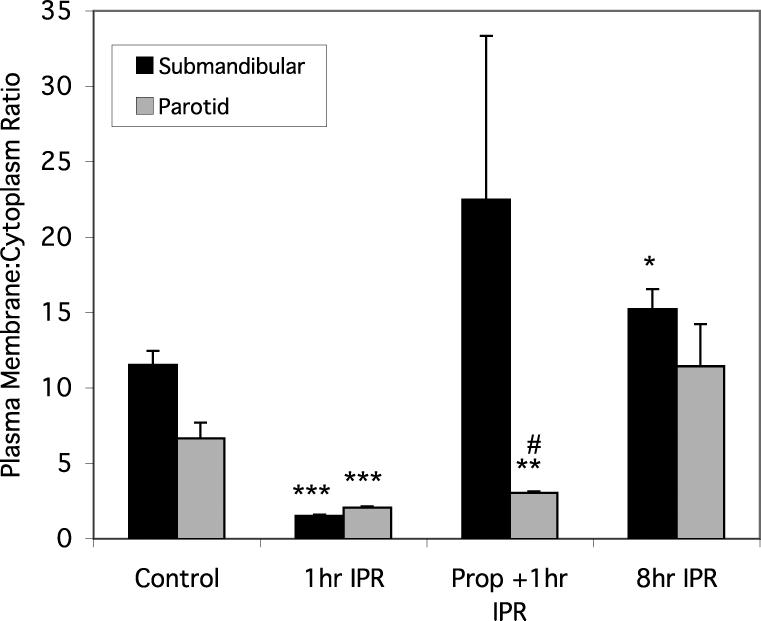
To quantify changes in Gαs localization, confocal images of section of the glands were analyzed at various times after treatment by tracing straight lines over regions corresponding to individual cells (see Figure 5). Fluorescence intensity measurements, expressed as plasma membrane : cytoplasm ratios, confirmed the dissociation of Gαs from, and its reassociation with, the plasma membrane following IPR stimulation of the acinar cells of both the parotid and SMG (Fig. 6). One hour after IPR stimulation, the plasma membrane : cytoplasm fluorescence ratio had decreased 3-fold and 7-fold in the parotid and SMG, respectively. Eight hours after IPR, the fluorescence ratios had increased and were slightly greater than control values, ~ 70% and 30% for the parotid and SMG, respectively. The effect of propranolol treatment was variable: in the SMG, 1 hr after IPR, the fluorescence ratio for propranolol-treated cells was much greater, although not significantly, than in animals only injected with IPR; in the parotid, the fluorescence ratio for propranolol-treated cells was slightly but significantly greater, than in animals only injected with IPR (Fig. 6).
Figure 6.
Plasma membrane : cytoplasm fluorescence intensity ratios in parotid and SMG acinar cells. Error bars represent standard error of the mean. Significant difference from unstimulated controls: *, p<0.05; **, p<0.01; ***, p<0.001. Significant difference from 1 hr IPR: #, p<0.001.
In sections of IPR stimulated glands, an apparent accumulation of Gαs in the apical cytoplasm of striated duct cells was noted, in both the parotid (Figs. 2C, 2D and 4F) and SMG (Fig. 4H) at early times after stimulation. The intensity of the apical fluorescence was reduced at later times after stimulation (Figs. 2G and 2H). Fluorescence intensity measurements of striated duct cells (Table 1) revealed slightly greater fluorescence intensity in the apical cytoplasm than in the basal cytoplasm. In the parotid gland there was an increase in the fluorescence of the apical cytoplasm at 1 hr after IPR; however, the changes in the apical : basal fluorescence ratio were not statistically significant.
Table 1.
Apical : basal cytoplasmic fluorescence intensity ratios in striated ducts.1
| Parotid Mean ± SE (n) | SMG Mean ± SE (n) | |
|---|---|---|
| Control | 1.040 ± 0.052 (10) | 1.231 ± 0.046 (14) |
| 1 hr IPR | 1.364 ± 0.042 (24) | 1.227 ± 0.037 (23) |
| Propranol + 1 hr IPR | 1.157 ± 0.038 (9) | 1.070 ± 0.058 (7) |
| 8 hr IPR | 1.045 ± 0.069 (7) | n.d.2 |
No significant differences were observed among the various conditions.
n.d., not determined
Discussion
The present results show that Gαs is associated with the plasma membrane of salivary gland acinar cells, and is internalized following IPR stimulation. Studies of cultured cells demonstrated that dissociation of Gαs from the plasma membrane occurs rapidly, within 1-2 min following IPR stimulation of β-adrenergic receptors (12, 13). In parotid and SMG acinar cells, dissociation was underway at 15 min, the earliest time point examined after IPR stimulation; by 30-60 min dissociation was essentially complete. This is similar to the time course of Gαs dissociation and translocation in immature mouse oocytes expressing exogenous β2-adrenergic receptors (17). The extent of Gαs dissociation at 15 min after stimulation varied from cell to cell, most likely due to the rate of absorption of IPR from the peritoneum and its diffusion from blood vessels to the acinar cells. Dissociation and internalization of Gαs is thought to be important for termination of the signal or desensitization, and/or regulation of other cytoplasmic molecules (3). Gαs interacts with several cell organelles, including microtubules and endosomes (21), and regulates specific intracellular transport processes (22, 23). In Xenopus oocytes Gαs is associated with yolk platelet membranes and may have a role in their formation or function (24). Cytochemical studies of rodent salivary glands have shown the presence of adenylate cyclase at the luminal membrane in addition to the basolateral cell membranes (25-27). Activation of luminal adenylate cyclase by Gαs released from the basolateral cell membranes could result in local cAMP generation necessary for exocytosis or endocytic membrane retrieval.
Reassociation of Gαs with the plasma membrane is evident, at least in the SMG, as early as 2 hr after IPR, a time frame similar to that observed in vitro (12). Completion of this process in the salivary glands takes considerably longer, however, possibly due to prolonged receptor stimulation in vivo, or different rates of receptor internalization. Studies of cultured cells suggest that plasma membrane reassociation of Gαs may occur via binding to vesicular structures (13, 14, 16); we were not able to determine if a vesicular mechanism is involved in this process in the salivary glands.
Most models of Gs activation assume that the Gβγand Gβγ subunits dissociate from one another. In some cells Gβγ is known to be released from the plasma membrane (14) and to interact with several organelles and proteins (21). Our results clearly show that activated Gαs is released from the plasma membrane, but they do not address the fate of Gβγ or the possibility that at least some Gαβγ heterotrimers remain intact. While there is clear evidence that Gα and Gβγ subunits do physically dissociate, in some cells intact Gαβγ heterotrimers are capable of activating their effector molecules (28).
Gαs also is present in intercalated and striated duct cells. It appears to be diffusely distributed in the cytoplasm, although striated duct cells exhibited somewhat brighter apical fluorescence adjacent to the luminal membrane after IPR stimulation. However, a statistically significant redistribution of Gαs in duct cells after IPR stimulation, as assessed by fluorescence intensity ratios, was not shown by our analysis. Previous studies showed Ca++ oscillations in mouse SMG duct cells in response to IPR stimulation that were inhibited by antibodies to Gαs (29). Both duct cell types contain secretory granules and release proteins into saliva. Norepinephrine and vasoactive intestinal peptide stimulate cAMP production in rabbit SMG striated ducts (30), and sympathetic nerve stimulation depletes apical secretory granules in cat SMG striated ducts (31). We have shown that the regulatory and catalytic subunits of type II PKA are associated with the luminal membrane and the small apical secretory vesicles in human striated duct cells (32; Zinn et al., manuscript in preparation). Activation of Gαs and local generation of cAMP could activate PKA, leading to granule exocytosis and/or electrolyte reabsorption, e.g., involving the cystic fibrosis transmembrane conductance regulator (CFTR; 33), by striated duct cells. Taken together, these data suggest the presence of a cAMP-mediated signaling complex located in the apical region of striated duct cells.
In summary, the Gα subunit of the heterotrimeric GTP-binding protein Gs is predominantly localized to the basolateral plasma membranes of acinar cells of unstimulated salivary glands. β-Adrenergic receptor stimulation results in activation of Gαs, which in turn activates adenylate cyclase, generating cAMP and leading to PKA activation and exocytosis. Following activation, Gαs dissociates from the cell membrane and diffuses throughout the cytoplasm, potentially interacting with other intracellular organelles or effector molecules. The internalization of Gαs is prevented by propranolol, indicating that dissociation occurs in response to β-adrenergic stimulation. Reassociation of Gαs with the membrane requires several hours, and is apparent earlier in the SMG than in the parotid gland.
Highlights.
Gαs was localized by immunofluorescence in mouse parotid and submandibular glands.
Gαs was mainly present on the basolateral membrane of unstimulated acinar cells.
β-adrenergic stimulation resulted in redistribution of Gαs to the cytoplasm.
Between 2 and 8 hr after stimulation, Gαs reassociated with basolateral membranes.
In striated duct cells, Gαs may accumulate apically after stimulation.
Acknowledgements
We thank Dr. Teresa Jones (National Institutes of Health, Bethesda MD) for providing the RM antibody to Gαs and Dr. Laurinda Jaffe for her continuing support and for providing access to the confocal microscope. We thank Dr. Jaffe and Dr. Maija Mednieks for critically reading the manuscript. The support and advice of Dr. John Aghajanian and Ms. Maya Yankova are gratefully acknowledged.
Funding
Supported by NIH Grants 5R25GM071937 (KOE) and the University of Connecticut Health Center.
Footnotes
Publisher's Disclaimer: This is a PDF file of an unedited manuscript that has been accepted for publication. As a service to our customers we are providing this early version of the manuscript. The manuscript will undergo copyediting, typesetting, and review of the resulting proof before it is published in its final citable form. Please note that during the production process errors may be discovered which could affect the content, and all legal disclaimers that apply to the journal pertain.
Competing interests
There are no conflicts of interest for any of the authors in this work.
Ethical Approval
All animal procedures were approved by the Institutional Animal Care and Use Committee of the University of Connecticut Health Center.
References
- 1.Wettschureck N, Offermanns S. Mammalian G proteins and their cell type specific functions. Physiol Rev. 2005;85:1159–1204. doi: 10.1152/physrev.00003.2005. [DOI] [PubMed] [Google Scholar]
- 2.Oldham WM, Hamm HE. Heterotrimeric G protein activation by g-protein-coupled receptors. Nat Rev Mol Cell Biol. 2008;9:60–71. doi: 10.1038/nrm2299. [DOI] [PubMed] [Google Scholar]
- 3.Marrari Y, Crouthamel M, Irannejad R, Wedegaertner PB. Assembly and trafficking of heterotrimeric G proteins. Biochemistry. 2007;46:7665–7677. doi: 10.1021/bi700338m. [DOI] [PMC free article] [PubMed] [Google Scholar]
- 4.Vögler O, Barceló JM, Ribas C, Escribá PV. Membrane interactions of G proteins and other related proteins. Biochim Biophys Acta. 2008;1778:1640–1652. doi: 10.1016/j.bbamem.2008.03.008. [DOI] [PubMed] [Google Scholar]
- 5.Bdolah A, Schramm A. The function of 3’5’-cyclic AMP in enzyme secretion. Biochem Biophys Res Commun. 1965;18:452–454. doi: 10.1016/0006-291x(65)90730-8. [DOI] [PubMed] [Google Scholar]
- 6.Amsterdam A, Ohad I, Schramm M. Dynamic changes in the ultrastructure of the acinar cell of the rat parotid gland during the secretory cycle. J Cell Biol. 1969;41:753–773. doi: 10.1083/jcb.41.3.753. [DOI] [PMC free article] [PubMed] [Google Scholar]
- 7.Ahmad SN, Alam SQ, Alam BS. Effect of ageing on adenylate cyclase activity and G-proteins in rat submandibular salivary glands. Arch Oral Biol. 1990;35:885–890. doi: 10.1016/0003-9969(90)90067-k. [DOI] [PubMed] [Google Scholar]
- 8.Watson EL, DiJulio D, Kauffman D, Iversen J, Robinovitch MR, Izutsu KT. Evidence for G proteins in rat parotid plasma membranes and secretory granule membranes. Biochem J. 1992;285:441–449. doi: 10.1042/bj2850441. [DOI] [PMC free article] [PubMed] [Google Scholar]
- 9.Baker OJ, Camden JM, Ratchford AM, Seye CI, Erb L, Weisman GA. Differential coupling of the P2Y1 receptor to Gα14 and Gαq/11 proteins during the development of the rat salivary gland. Arch Oral Biol. 2006;51:359–370. doi: 10.1016/j.archoralbio.2005.10.004. [DOI] [PubMed] [Google Scholar]
- 10.Watson EL, Oliver C, D'Silva N, Belton CM. Localization of the G-protein G0 in exocrine glands. J Histochem Cytochem. 1994;42:41–47. doi: 10.1177/42.1.7505300. [DOI] [PubMed] [Google Scholar]
- 11.Ransnäs LA, Svoboda P, Jasper JR, Insel PA. Stimulation of β-adrenergic receptors of S49 lymphoma cells redistributes the α subunit of the stimulatory G protein between cytosol and membranes. Proc Natl Acad Sci USA. 1989;86:7900–7903. doi: 10.1073/pnas.86.20.7900. [DOI] [PMC free article] [PubMed] [Google Scholar]
- 12.Wedegaertner PB, Bourne HR, von Zastrow M. Activation-induced subcellular redistribution of Gsα. Mol Biol Cell. 1996;7:1225–1233. doi: 10.1091/mbc.7.8.1225. [DOI] [PMC free article] [PubMed] [Google Scholar]
- 13.Yu J-Z, Rasenick MM. Real-time visualization of a fluorescent Gαs: dissociation of the activated G protein from plasma membrane. Mol Pharmacol. 2002;61:352–359. doi: 10.1124/mol.61.2.352. [DOI] [PubMed] [Google Scholar]
- 14.Hynes TR, Mervine SM, Yost EA, Sabo JL, Berlot CH. Live cell imaging of Gs and the β2-adrenergic receptor demonstrates that both αs and β1β7 internalize upon stimulation and exhibit similar trafficking patterns that differ from that of the β2-adrenergic receptor. J Biol Chem. 2004;279:44101–44112. doi: 10.1074/jbc.M405151200. [DOI] [PubMed] [Google Scholar]
- 15.Freudzon L, Norris RP, Hand AR, Tanaka S, Saeki Y, Jones TLZ, et al. Regulation of meiotic prophase arrest in mouse oocytes by GPR3, a constitutive activator of the Gs G protein. J Cell Biol. 2005;171:255–265. doi: 10.1083/jcb.200506194. [DOI] [PMC free article] [PubMed] [Google Scholar]
- 16.Allen JA, Yu JZ, Donati RJ, Rasenick MM. Beta-adrenergic receptor stimulation promotes G alpha s internalization through lipid rafts: a study in living cells. Mol Pharmacol. 2005;67:1493–1504. doi: 10.1124/mol.104.008342. [DOI] [PubMed] [Google Scholar]
- 17.Norris RP, Freudzon L, Freudzon M, Hand AR, Mehlmann LM, Jaffe LA. A Gs-linked receptor maintains meiotic arrest in mouse oocytes, but luteinizing hormone does not cause meiotic resumption by terminating receptor-Gs signaling. Dev Biol. 2007;310:240–249. doi: 10.1016/j.ydbio.2007.07.017. [DOI] [PMC free article] [PubMed] [Google Scholar]
- 18.Wedegaertner PB, Bourne HR. Activation and depalmitoylation of Gsα. Cell. 1994;77:1063–1070. doi: 10.1016/0092-8674(94)90445-6. [DOI] [PubMed] [Google Scholar]
- 19.Jones TLZ, Degtyarev MY Backlund PS., Jr The stoichiometry of Gαs palmitoylation in its basal and activated states. Biochemistry. 1997;36:7185–7191. doi: 10.1021/bi9628376. [DOI] [PubMed] [Google Scholar]
- 20.Simonds WF, Goldsmith PK, Woodard CJ, Unson CG, Spiegel AM. Receptor and effector interactions of Gs. Functional studies with antibodies to the αs carboxyl-terminal decapeptide. FEBS Lett. 1989;249:189–194. doi: 10.1016/0014-5793(89)80622-2. [DOI] [PubMed] [Google Scholar]
- 21.Hewavitharana T, Wedegaertner PB. Non-canonical signaling and localizations of heterotrimeric G proteins. Cell Signal. 2012;24:25–34. doi: 10.1016/j.cellsig.2011.08.014. [DOI] [PMC free article] [PubMed] [Google Scholar]
- 22.Bomsel M, Mostov KE. Possible role of both the α and βγ subunits of the heterotrimeric G protein, Gs, in transcytosis of the polymeric immunoglobulin receptor. J Biol Chem. 1993;268:25824–25835. [PubMed] [Google Scholar]
- 23.Pimplikar SW, Simons K. Regulation of apical transport in epithelial cells by a Gs class of heterotrimeric G protein. Nature. 1993;362:456–458. doi: 10.1038/362456a0. [DOI] [PubMed] [Google Scholar]
- 24.Gallo CJ, Hand AR, Jones TLZ, Jaffe LA. Stimulation of Xenopus oocyte maturation by inhibition of the G-protein αs subunit, a component of the plasma membrane and yolk platelet membranes. J Cell Biol. 1995;130:275–284. doi: 10.1083/jcb.130.2.275. [DOI] [PMC free article] [PubMed] [Google Scholar]
- 25.Durham JP, Galanti N, Revis NW. The purification and characterization of plasma membranes and the subcellular distribution of adenylate cyclase in mouse parotid gland. Biochim Biophys Acta. 1975;394:388–405. doi: 10.1016/0005-2736(75)90292-8. [DOI] [PubMed] [Google Scholar]
- 26.Cutler LS, Rodan SB. Biochemical and cytochemical studies on adenylate cyclase activity in the developing rat submandibular gland: differentiation of of the acinar secretory compartment. J Embryol Exp Morphol. 1976;36:291–303. [PubMed] [Google Scholar]
- 27.Kim SK. The cytochemical localization of adenylate cyclase activity in mucous and serous cells of the salivary gland. J Supramol Struct. 1976;4:185–197. doi: 10.1002/jss.400040206. [DOI] [PubMed] [Google Scholar]
- 28.Lambert NA. Dissociation of heterotrimeric G-protein in cells. Sci Signal. 2008;1:re5. doi: 10.1126/scisignal.125re5. [DOI: 10.1126/scisignal.125re5] [DOI] [PubMed] [Google Scholar]
- 29.Luo X, Zeng W, Xu X, Popov S, Davignon I, Wilkie SM, et al. Alternate coupling of receptors to Gs and Gi in pancreatic and submandibular gland cells. J Biol Chem. 1999;274:17684–17690. doi: 10.1074/jbc.274.25.17684. [DOI] [PubMed] [Google Scholar]
- 30.Evans RL, Perrott MN, Lau KR, Case RM. Elevation of intracellular cAMP by noradrenaline and vasoactive intestinal peptide in striated ducts isolated from the rabbit mandibular salivary gland. Arch Oral Biol. 1996;41:689–694. doi: 10.1016/s0003-9969(96)00028-3. [DOI] [PubMed] [Google Scholar]
- 31.Garrett JR, Kidd A. Effects of nerve stimulation and denervation on secretory material in submandibular striated duct cells of cats, and the possible role of these cells in the secretion of salivary kallikrein. Cell Tissue Res. 1975;161:71–84. doi: 10.1007/BF00222115. [DOI] [PubMed] [Google Scholar]
- 32.Piludu M, Mednieks MI, Hand AR. Cyclic AMP-receptor proteins in human salivary glands. Eur J Morphol. 2002;40:219–225. doi: 10.1076/ejom.40.4.219.16696. [DOI] [PubMed] [Google Scholar]
- 33.Catalán MA, Nakamoto T, Gonzalez-Begne M, Camden JM, Wall SM, Clarke LL, et al. Cftr and ENaC ion channels mediate NaCl absorption in the mouse submandibular gland. J Physiol. 2010;588:713–724. doi: 10.1113/jphysiol.2009.183541. [DOI] [PMC free article] [PubMed] [Google Scholar]


