

Abstract
Glioblastoma (GBM) is the most common and fatal primary brain tumor in humans and it is essential that new and better therapies are developed to treat this disease. Previous research suggests that casein kinase 2 (CK2), may be a promising therapeutic target for GBMs. CK2 has enhanced expression or activity in numerous cancers, including GBM and it has been demonstrated that inhibitors of CK2 regressed tumor growth in GBM xenograft mouse models. Our studies demonstrate that the CK2 subunit, CK2α, is overexpressed in and plays an important role in regulating brain tumor initiating cells (BTIC) in GBM. Initial studies showed that two GBM cell lines (U87-MG and U138) transduced with CK2α had enhanced proliferation and anchorage-independent growth. Inhibition of CK2α using siRNA or small molecule inhibitors (TBBz, CX-4945) reduced cell growth and decreased tumor size and increased the survival rate in GBM xenograft mouse models. We also verified that inhibition of CK2α decreased the activity of a well-known GBM initiating cell regulator, β-catenin. Loss of CK2α decreased two β-catenin-regulated genes that are involved in GBM initiating cell growth, OCT4 and NANOG. To determine the importance of CK2α in GBM stem cell maintenance, we reduced CK2α activity in primary GBM samples and tumor spheres derived from GBM patients. We discovered that loss of CK2α activity reduced the sphere forming capacity of BTIC and decreased numerous GBM stem cell markers including CD133, CD90, CD49f, and A2B5. Our study suggests that CK2α is involved in GBM tumorigenesis by maintaining BTIC through the regulation of β-catenin.
Keywords: casein kinase 2, β-catenin, glioblastoma, CX-4945, brain tumor initiating cells, cancer stem cells
Introduction
Glioblastoma (GBM) is the most common malignant primary brain tumor in adults. Four out of every 100,000 Americans are diagnosed with GBM, which represents ~15% of all primary brain tumors (1). Once the diagnosis of GBM has been made, the overall median survival time for patients treated with surgery, radiation and chemotherapy is only 14 to 15 months (2). The identification of GBM-associated cancer stem cells (CSCs) or GBM-associated brain tumor initiating cells (BTIC) has fueled research into the contributing role of this cell type in GBM pathogenesis and chemotherapy resistance (3). The BTIC were shown to be capable of self-renewal and multi-lineage differentiation, they initiate tumor formation upon intracranial implantation within mice, and exhibit elevated therapeutic resistance relative to bulk glioma cells (4). Therefore, elucidation of the molecular mechanisms underlying BTIC maintenance and proliferation offers new molecular targets for developing more effective GBM treatments.
An intriguing molecular target for GBM therapy is casein kinase 2 (CK2), which is a highly ubiquitous and conserved protein serine/threonine kinase composed of two catalytic subunits (CK2α or CK2α') and two regulatory subunits (CK2β) (5). CK2 had increased protein expression or activity in the majority of cancers examined and its growth-related functions have been supported by the identification of a large number of growth-related proteins substrates (6). CK2 is believed to be involved in GBM tumorigenesis, since inhibition of CK2 activity through small molecule inhibitors or siRNA induced apoptosis, and reduced growth in mouse xenograft models of human GBMs (7–11). In addition, there is evidence suggesting that the CK2α subunit plays an important role in GBM. A genome-wide analysis of GBMs revealed an increase in the CK2α gene (CSNK2a1) (10), and enhanced CK2α expression has been observed compared with pair-matched normal brain samples (12).
In addition to its possible role in GBM tumorigenesis, there are recent reports indicating CK2α may play a role of BTIC maintenance and growth in GBM. For example, inhibition of CK2α was shown to impact the self-renewal capabilities of leukemia stem cells (13) and non-small cell lung carcinoma stem cells (14). CK2α has also been shown to play an important role in neural stem cell proliferation and differentiation, indicating a potential role in BTIC in GBM (15). Additionally, in vitro studies indicate that CK2α may also be involved in BTIC growth by controlling well known mediators of GBM including the Wnt/β-catenin pathway (16–18).
To determine if CK2α does play an integral role in GBM tumorigenesis and in BTIC growth, we first generated immortalized GBM cell lines that had modulated CK2α expression. We verified that inhibition of CK2α using short interfering RNA (siRNA), short hairpin (shRNA), or small molecule inhibitors decreased growth, colony formation, and tumor size in mice. Moreover, we also discovered that an important regulator of BTIC in GBM, β-catenin, was decreased when CK2α activity was inhibited. We extended our findings to tumor spheres generated from GBM patients and determined that inhibition of CK2α decreased tumor sphere self-renewal, size, and in vivo tumorigenic potential of these cell lines. Through our work, we demonstrate for the first time that CK2α may play an important role in BTIC maintenance through the regulation of β-catenin in GBM.
Results
GBM patients with increased expression of CK2α may lead to a worse prognosis
Enhanced CK2α expression or activity has been observed in a variety of solid tumors including GBM. To verify that CK2α is overexpressed in GBM we analyzed primary samples from GBM patients. Consistent with previous reports, we discovered that 57% (4/7) of the GBM samples had a 2- to 5-fold increase in CK2α protein expression compared with normal brain samples (10;12). We also conducted QPCR and verified that CK2α mRNA expression was enhanced in the same GBM patient samples (Fig. 1A and B). To expand on our initial findings we also analyzed CK2α expression using the R2 microarray analysis and visualization platform (R2: microarray analysis and visualization platform (http://r2.amc.nl)). We discovered that compared to an expression data set containing 172 normal brain sections, CK2α expression was significantly increased in a data set derived from 84 GBM samples (19)(Supplemental Fig. S1A). We determined that the difference was statistically significant (p = 1.2×10⁻¹⁰) using One Way Analysis of Variance (ANOVA). We also analyzed a data set that contained 101 tumor stem cells that were derived from GBM patients (20)(Supplemental Fig. S1A). Consistently, we saw a reduction in CK2α expression in the normal brain data set when compared to the GBM data set that was statistically significant (p = 1.3×10⁻⁸). We also conducted a preliminary prognosis analysis of CK2α expression in GBM patients using the Repository of Molecular Brain Neoplasia Data (Rembrandt). By sorting the GBM patients into high or low expression of CK2α, our findings suggest that GBM patients with high CK2α expression has a trend towards a worse prognosis compared with their low-expressing counterparts (Fig. 1C). While our findings were not statistically significant (p = 0.08) we expanded our initial findings to The Cancer Genome Atlas (TCGA). We discovered that when the GBM patients were separated by subtype (classical, mesenchymal, neural, and proneural) only the mesenchymal subgroup had a statistically significant change (p = 0.034) in patient prognosis when comparing patients with high versus low CK2α expression (Fig. 1D). The remaining subtypes did not have a statistically significant change in patient survival when the GBM patients were separated by CK2α expression (Supplemental Fig. S1B).
Figure 1.

Increased CK2α expression may lead to a worse prognosis for GBM patients. A, Western blot measuring the fold change in CK2α in seven primary GBM samples compared with normal brain (NB). GAPDH was used to control for protein load. B, QPCR analysis of primary GBM samples. *-represents samples with higher expression of CK2α. C. Survival curve for all GBM patients with high or low expression of CK2α using the REMBRANDT database. D. Survival curve for the mesenchymal subtype of GBM patients with high or low expression of CK2α using the TCGA.
CK2α is important in GBM tumorigenesis in vitro
To verify that CK2α is involved in GBM tumorigenesis, we modulated CK2 expression in two GBM cell lines, U87-MG and U138. We stably transduced YFP-tagged CK2α and CK2β using a retrovirus and verified the expression of each gene (Fig. 2A). The U87-MG cells transduced with CK2α exhibited enhanced cell growth and anchorage-independent growth, while exogenous expression of CK2β only enhanced cell growth compared with the YFP-transduced cells (Fig. 2B and D). We saw similar results in the U138 YFP-CK2α and YFP-CK2β transduced cells (Fig. 2C). These findings suggest that CK2α overexpression, and to a lesser extent CK2β, increased GBM tumorigenic phenotypes. To confirm the importance of CK2α, we decreased both CK2α and CK2β expression 5- to 10-fold using siRNAs in both U87-MG and U138 cell lines (Fig. 3A). We verified our siRNA specificity by monitoring the expression of the corresponding CK2 isoform. Little to no change was observed in CK2β expression when our cells were treated with siRNA to CK2α (siCK2α), as well as the reverse with siCK2β and CK2α expression (Fig. 3A). While reducing either CK2 subunit decreased GBM cell growth, decreasing CK2α had a larger reduction in growth (Fig. 3B, Supplemental Fig. S2A). In addition, only the reduction in CK2α inhibited anchorage-independent growth, confirming CK2α as a key regulator of GBM tumorigenisis (Fig. 3C). We also conducted a dose-dependent assay using multiple small molecule CK2 inhibitors (TBBz and CX-4945) and found that inhibiting CK2 activity through these inhibitors also decreased GBM cell and anchorage-independent growth (Fig. 3D to F, Supplemental Fig. S2B). Our data are consistent with prior studies and taken together our preliminary data further confirm the importance of CK2α in GBM tumorigenesis.
Figure 2.

Exogenous overexpression of CK2 genes increased tumorigenesis in two immortalized GBM cell lines. A, U87-MG and U138 cells were stably transduced with YFP, YFPCK2α, or YFP-CK2β. * represents YFP-CK2α, ** represents YFP-CK2β, arrow represents endogenous CK2α, double arrow represents endogenous CK2β. B and C, cell growth of GBM cell lines transduced with YFP-CK2α or YFP-CK2β. The cell lines were cultured in 10% fetal bovine serum and viable cells were counted daily. Results are from two separate experiments, each done in triplicate. *represents a statistically significant change from the control, P < 0.05, as measured by the Mann-Whitney U test. D, soft agar analysis of U87-MG cells expressing CK2α or CK2β. Results are from two separate experiments, each done in triplicate. *represents a statistically significant change from the control, P < 0.05.
Figure 3.

Reducing expression or inhibiting CK2α activity decreased GBM tumorigenesis in vitro. A, siRNAs specific to CK2α (siCK2α) and CK2β (siCK2β) were introduced into U87-MG and U138 cells. A scrambled nonspecific siRNA (siScr) was used as a control. The numbers under each blot correspond to the fold change in protein levels relative to the control. B, cell growth analysis of U87-MG transfected with siRNA. The cell lines were cultured in 10% fetal bovine serum and viable cells were counted daily. Results are from two separate experiments, each done in triplicate. C, anchorage-independent growth of U87-MG cells treated with siRNAs. D and E, cell growth analysis of U87-MG treated with CK2 inhibitors TBBz or CX-4945. F, anchorage-independent growth of U87-MG cells treated CK2 inhibitors in soft agar. Results are from two separate experiments, each done in triplicate. *represents a statistically significant change from the control, P < 0.05, as measured by the Mann–Whitney U test
CK2α is necessary for GBM tumorigenesis in vivo
We extended our study by testing the effects of reduction of CK2α expression on tumor formation, predicting that reducing endogenous CK2α expression would reduce the tumorigenicity of GBM cells. We generated an inducible shRNA to CK2α in U87-MG cells (U87 shCK2α). With doxycycline (Dox) induction (shCK2α+Dox), CK2α protein expression was reduced 3- to 4-fold compared with the uninduced control (shCK2α-Dox) and the uninfected cells induced with doxycycline (uninfect+Dox) (Fig. 4A). Even though CK2α expression was decreased with doxycycline induction, we did not observe a change in CK2β levels, indicating that the shRNA to CK2α was specific (Fig. 4A). The U87 shCK2+Dox cells consistently had significantly less cell growth compared with the shCK2α-Dox control cells (Fig. 4B). Subsequently, we pretreated the U87-MG shCK2α cells with doxycycline and performed intracranial injections into NOD scid gamma mice. The mice were injected with 50,000 U87 shCK2α+Dox or shCK2α-Dox cells. We determined that the mice injected with the U87 shCK2α+Dox cells had significantly higher survival compared with the mice injected with U87 shCK2α-Dox cells, with the median survival time after tumor implantation increasing from 20 days to >40 days (P = 0.0009) (Fig. 4C). To investigate tumor growth after implantation we harvested the mouse brains at 10 and 35 days and conducted hematoxylin and eosin staining to determine the growth of the tumors. At 10 days there was a significant reduction in tumor size and growth in the U87 shCK2α+Dox cells compared with the shCK2α-Dox controls (Fig. 4D). A similar change was observed at 35 days as well (Fig. 4D). We verified that CK2α protein and mRNA expression were reduced in the tumors derived from the U87 shCK2α+Dox cells compared with the shCK2α-Dox cells (Fig. 4E and F).
Figure 4.

Reducing expression of CK2α using shRNA decreased GBM tumorigenesis in vivo. A, shRNAs specific to CK2α (shCK2α) were introduced through lentiviral infections into U87-MG cells. 5 μg/mL of Dox was used to induce expression of shRNA (shCK2α+Dox). The uninduced infected cells (shCK2α-Dox) and uninfected cells treated with Dox (uninfect+Dox) were used as controls. The numbers under each blot correspond to the fold change in protein levels relative to the uninfected control. B, cell growth analysis of U87-MG infected with shCK2α. *represents a statistically significant change from the control, P < 0.05, as measured by the Mann-Whitney U test. C, survival curve of mice intracranially injected with infected cells. D, representative hematoxylin and eosin staining of brains 10 days (left) and 35 days (right) post-injection. E, Western blot showing CK2α expression from two representative tumors harvested 10 days post-injection. F, QPCR analysis comparing normal mouse brain to xenograft tumors from mice 40 days post-injection.
CK2α expression/activity regulates β-catenin transcriptional activity in GBM cells
We discovered in our GBM cell lines that β-catenin protein levels were reduced 2- to 3-fold only when CK2α expression was reduced using siCK2α and shCK2α (Figs. 3A and 4A). To determine if the decrease in β-catenin protein levels significantly altered its transcriptional activity, we generated GBM cell lines that were stably transduced with a previously published Wnt/β-catenin GFP reporter construct (21). This reporter plasmid has seven β-catenin/LEF-1 transcriptional response elements that precede GFP. Therefore when β-catenin is active it will transcribe GFP, and expression of GFP can be used to measure the transcriptional activity of β-catenin. U87-MG and U138 transduced with the GFP reporter treated with siRNA to CK2α exhibited a 2- to 3-fold reduction in both β-catenin expression and transcriptional activity as measured by GFP expression (Fig. 5A). We also measured two β-catenin-regulated genes, OCT4 and NANOG. Conducting QPCR on the U87-MG siRNA-treated cells, we determined that cells deficient in CK2α, but not CK2β, had a 2- to 3-fold reduction in both OCT4 and NANOG mRNA (Fig. 5B). To verify that CK2α inhibition decreased β-catenin transcriptional activity, we treated U87-MG and U138 transduced cell lines with the CK2α inhibitors TBBz or CX-4945. We found that inhibition of CK2α activity also resulted in a 2- to 3-fold decrease in β-catenin protein expression and a 2- to 10-fold decrease in its transcriptional activity as measured by GFP expression (Fig. 5C and D). QPCR analysis of the treated cell lines also consistently showed a 2-fold decrease in OCT4 and NANOG (Fig. 5E and F). To determine if the β-catenin is a major signaling pathway by which CK2α can regulate GBM tumorigenesis, we stably transduced β-catenin in U87 shCK2α and U138 shCK2α cell lines. We verified that even after Dox treatment, resulting in a 2- to 3-fold reduction in CK2α expression, β-catenin expression was increased to similar levels as the cell lines not treated with Dox (Fig. 5G). Upon reintroduction of β-catenin we discovered that cell growth and anchorage independent growth in cells lacking CK2α expression was rescued to levels similar to cell lines not treated with Dox (Fig. 5H–J). The canonical Wnt/β-catenin signaling was shown to play a key role in the regulation of tissue self-renewal (22) and has been well studied in BTIC in GBM. In addition, OCT4 and NANOG were both previously found to regulate BTIC growth (23). Our findings suggest that CK2α may be involved in maintaining BTIC through the regulation of β-catenin.
Figure 5.

U87-MG and U138 cells were transduced with a Wnt/β-catenin GFP reporter construct. A, reducing CK2α expression using siCK2α decreased β-catenin expression and transcriptional activity (as measured by GFP). B, QPCR analysis of β-catenin-regulated genes, OCT4 and NANOG, in U87-MG cells transfected with siCK2α or siCK2β. C and D, treatment with the CK2 inhibitors, CX-4945 or TBBz, decreased β-catenin expression and transcriptional activity in both U87-MG and U138 cells. E and F, QPCR analysis of OCT4 and NANOG after treatment with CK2 inhibitors. G, β-catenin was stably transduced into U87 shCK2α or U138 shCK2α cell lines. Cells treated were either treated with 5 μg/mL of Dox (+Dox) or a PBS control (−Dox). H, Cell growth of U87 shCK2α cells transduced with β-catenin and treated with Dox. I, Cell growth of U138 shCK2α cells transduced with β-catenin and treated with Dox. F, anchorage-independent growth of U87 shCK2α cells transduced with β-catenin and treated with Dox in soft agar. Results are from two separate experiments, each done in triplicate. *represents a statistically significant change from the control, P < 0.05, as measured by the Mann-Whitney U test
Inhibiting CK2α activity in GBM tumor spheres reduces β-catenin activity
To explore the significance of CK2α in BTICs, we generated multiple GBM tumor spheres cell lines from GBM patient samples. Tumor spheres have become widely accepted as a method for culturing cells that are enriched for cells that are capable of self-renewal and tumor initiation from primary GBM (24). We initially verified that our GBM tumor spheres were enriched for BTIC by monitoring CD133 expression. Using FACS, we determined that our tumor spheres were enriched for CD133+ cells (75% to 95%) compared with the isotype control, indicating that our tumor spheres were enriched for BTIC (Fig. 6A). Further analysis of the CD133+ subpopulation showed that CK2α mRNA expression was not significantly different compared to the CD133− group (Supplemental Fig. S3). We also compared the CD15+ and CD15− subpopulations and did not observe a significant difference. This finding was consistent with previously published findings and were not too surprising since CK2α has been shown to play an integral role in a variety of cellular processes including: regulating proliferation/apoptosis balance, the UPR (unfolded protein response), rRNA synthesis, and spliceosome functions (25). To determine if CK2α is important in BTIC we generated tumor spheres that upon doxycycline induction would express shRNAs specific to CK2α (shCK2α+Dox). We determined that induction of doxycycline reduced CK2α protein expression 3-fold and mRNA expression 2-fold compared with the uninduced tumor spheres (shCK2α-Dox) or the control tumor spheres that were not infected but were treated with doxycycline (uninfect+Dox). There was no change in CK2β protein expression indicating that our shRNA was specific to CK2α (Fig. 6B). Consistent with our previous findings, we also observed a 2- to 3-fold decrease in β-catenin levels and a 2-fold reduction in OCT4 and NANOG mRNA levels in the shCK2α+Dox tumor spheres compared with the control tumor spheres (Fig. 6B and C). The tumor spheres were also treated with the CK2 inhibitor, CX-4945. We determined that inhibiting CK2 activity also reduced β-catenin protein expression 3-fold and reduced the transcriptional activity of β-catenin as measured by the Wnt/β-catenin GFP reporter by 2- to 6-fold (Fig. 6D and E). Consistently, OCT4 and NANOG mRNA expression was also decreased 2- to 3-fold (Fig. 6F). To confirm these findings, we analyzed an additional tumor sphere cell line (TS #2). Consistent with our previous results we discovered a dose-dependent response to CX-4945 in the TS#2 spheres resulting in a 5-fold reduction of β-catenin expression and a 5- to 10-fold reduction in NANOG and OCT4 expression (Supplemental Fig. S4A and B).
Figure 6.

Reducing CK2α expression decreases β-catenin expression and activity in tumor spheres derived from GBM patients. A, FACS analysis showing the expression of CD133 in the tumor sphere cell line (right) compared with the isotype control (left). B, shRNAs specific to CK2α (shCK2α) were introduced through lentiviral infections into a tumor sphere cell line. 5 μg/mL of Dox was used to induce expression of shRNA (shCK2α+Dox). The uninduced infected cells (shCK2α-Dox) and uninfected cells treated with Dox (Uninfected) were used as controls. The numbers under each blot correspond to the fold change in protein levels relative to the control. C, QPCR analysis of β-catenin-responsive genes. D, Western blot showing protein expression after tumor spheres were treated with CX-4945. E, Tumor spheres transduced with Wnt/β-catenin GFP reporter and treated with CX-4945. F, QPCR analysis of β-catenin-responsive genes after treatment with CK2 inhibitor. *represents a statistically significant change from the control, P < 0.05, as measured by the Mann–Whitney U test
CK2α plays an important role in maintaining BTIC in GBM
To determine if CK2α plays an important role in BTIC we first determined if CK2α inhibition reduced the number of BTIC in our tumor spheres by analyzing the GBM stem cell marker CD133. Upon CX-4945 treatment we observed a shift in the FACS profiles indicating that the subpopulation of CD133+ cells was reduced ~80% (Fig. 7A). Since CD133 is still a controversial GBM stem cell marker, we also analyzed an additional freshly dissociated GBM tumor sphere line (passage <5) for additional neural stem cell markers: CD15, A2B5, CD49f, and CD90 (26)(Fig. 7B). Our FACS analysis showed that in low passage tumor spheres both 5μM and 10μM CX-4945 treatment reduced the CD15+ subpopulation by ~50% and A2B5+ cells by ~70% (Fig. 7B). We also observed a decrease in the CD49f+ and CD90+ cells by 22% and 23%, respectively (Supplemental Fig 5). Consistent with our previous data the low passage tumor spheres had a reduction in CD133+ cells (Supplemental Fig. 4). To determine if the decrease in GBM stem cell markers was functionally significant we analyzed stem cell phenotypes in our tumor spheres transduced with shRNA to CK2α. We discovered that the shCK2α+Dox tumor spheres had a significantly reduced size compared with the shCK2α-Dox spheres (Fig. 7C). In addition, decreasing CK2α expression reduced the number of tumor spheres that formed, ~2-fold compared with the shCK2α-Dox tumor spheres, and ~10-fold when treated with the CK2 inhibitors, TBBz or CX-4945 (Fig. 7D). We also determined the frequency of sphere-initiating cells by performing a limited dilution assay (LDA)(27). The shCK2α+Dox tumor spheres had a significant decrease in the in vitro sphere-forming capacity of the cells (1/3,432) compared with the shCK2α-Dox tumor spheres (1/301) or the uninfected spheres treated with Dox (1/301) (P = 0.009) (Fig. 7E). We also consistently discovered a dose-dependent effect when the tumor spheres were cultured with CX-4945. Compared with the DMSO control (1/83), 5 μM CX-4945 reduced the sphere forming capacity of the spheres 13-fold (1/1,100), while 10 μM had a 200-fold reduction (1/16,884) (P = 0.005 and P = 0.0007) (Fig. 7E). To verify our findings, we analyzed the TS #2 cell line and determined that the sphere-forming capacity was reduced in the CX-4945 (1/1846) and TBBz treated spheres (1/1250) compared to the DMSO control spheres (1/30)(P = 0.0002) (Supplemental Fig. S4C). We also determined that the TS#2 spheres had reduced proliferation and sphere size when treated with CX-4945 (Supplemental Fig. S4D and E). These findings are consistent with our work and provide additional support showing that CK2α plays an integral role in maintaining BTIC growth.
Figure 7.

CK2α activity is important for maintaining the stem cell phenotypes in GBM tumor spheres. A, FACS analysis of tumor spheres treated with 5μM and 10μM of CX-4945. Left, histogram of FACS profile. Right, Mean Fluorescence Intensity (MFI) of each treatment. B, FACS analysis of CD15+ and CD90+ cells. Left, histogram of FACS profile. Right, Mean Fluorescence Intensity (MFI) of each treatment. C, tumor sphere size after infection with inducible shCK2α. Left, Cells induced with Dox (shCK2α+Dox) and uninduced tumor spheres (shCK2α-Dox). Right, representative image of tumor spheres after CK2α expression was modulated. D, tumor sphere formation capacity was monitored by plating 100 cells and counting the number of spheres that formed after 14 days. Left, shCK2α+Dox and shCK2α-Dox induced cells. Right, tumor spheres cultured in 5μM CX-4945 and 25μM of TBBz. *represents a statistically significant change from the control, P < 0.05, as measured by the Mann–Whitney U test. E, Left, LDA of GBM tumor spheres with modulated CK2α expression using shCK2α. Black represents uninfected cells +Dox, green represents spheres not induced (shCK2α-Dox), and red represents spheres induced with Dox (shCK2α+Dox). Dotted lines represent the 95% confidence interval. Right, LDA of tumor spheres treated with varying concentrations of CX-4945. Green represents DMSO-treated spheres, red represents spheres treated with 5 μM CX-4945, black represents spheres treated with 10μM CX-4945.
Discussion
Recent evidence suggests that CK2 is involved in maintaining a subpopulation of cells in the tumor that is responsible for initiating and maintaining tumor growth. This BTIC subpopulation is capable of self-renewal, asymmetric division, and multi-lineage differentiation (28;29), and current evidence suggests that it is necessary (and sufficient) to eradicate BTICs for therapeutic efficacy in multiple forms of cancer (30;31). Here we demonstrate for the first time that decreasing CK2α expression or reducing its activity through small molecule inhibitors decreases the BTIC subpopulation in GBM. Using GBM tumor spheres derived from patients, we determined that loss of CK2α resulted in a decrease in OCT4 and NANOG, two β-catenin-regulated genes associated with BTICs (23). Oct4 was shown to play an essential role in maintaining the stem cell properties of BTIC through Sox2 expression (32), while NANOG modulated GBM stem cell clonogenicity and proliferation (33). The loss of these BTIC regulators resulted in a loss of GBM “stemness” as evident through the decrease in tumor sphere size, growth, and sphere-forming capacity (Figure 8). Together, our findings show for the first time that targeting CK2α not only decreases GBM tumorigenicity, but can also deplete the BTIC subpopulation making it an intriguing therapeutic target for GBM.
Figure 8.
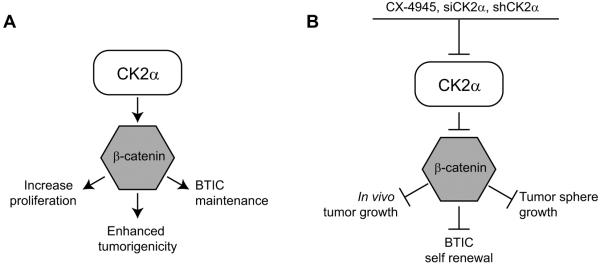
Diagram of the CK2α and β-catenin pathway in GBM. A, Signaling cascade in which CK2α regulates GBM tumorigenesis through β-catenin. B, Effects of CK2α inhibition on GBM growth.
The mechanism by which CK2α can regulate β-catenin activity has been well studied in other tumor types, but is currently unknown in GBM. In vitro mapping studies identified the Thr393 site in the central armadillo repeat domain of β-catenin as a key site regulating β-catenin proteasomal-dependent degradation (34). Additionally, CK2α was shown to regulate β-catenin indirectly. CK2α was found to phosphorylate and inhibit AKT/protein kinase B, known activators of β-catenin (35;36), and phosphorylate α-catenin at Ser641 thereby preventing the inhibitory effects of α-catenin on β-catenin (37). These studies suggest that CK2α may positively regulate β-catenin activity directly or indirectly, but additional studies are needed to determine the exact mechanism by which CK2α can regulate β-catenin activity in BTICs.
While we demonstrated that CK2α can regulate β-catenin, there are other pathways that CK2α could potentially regulate in maintaining BTICs. For instance, CK2α has been linked to the hedgehog (HH)/Gli1 and Notch pathways. The HH pathway was shown to regulate self-renewal, growth, and survival of BTIC (38), and regulate key factors in maintaining GBM tumor initiating cells including: Bmi1 (39–41) and ABCG2 (42). Notch signaling was also shown to play critical roles in GBM stem cell survival and self-renewal (43–45). Interestingly, CK2α was shown to regulate both pathways in lung cancer. Inhibition of CK2α using small molecule inhibitors reduced expression and activity of Gli1, which altered ABCG2 expression that led to a reduction in the BTIC-like side population in lung cancer cells (46). Decreasing CK2α expression using siRNA resulted in a reduction in Notch transcriptional activity that resulted in a reduction in the stem cell subpopulation (47). These reports combined with our findings suggest that CK2α may influence multiple pathways in GBM initiating cell maintenance suggesting that inhibition of CK2α could yield better therapeutic effects than using HH or Notch inhibitors alone.
While a great deal of research has been conducted to generate a CK2α inhibitor for cancer therapy, there is only one molecule that is currently being tested for clinical trials. CX-4945 is a CK2α small molecule adenosine triphosphate-binding site inhibitor that possesses a high bioavailability and is currently in phase I clinical trials (48). Through our work and that of others, CX-4945 treatment has been shown to decrease cell adhesion, migration, and cell cycle progression, while also inducing apoptosis in immortalized and primary GBM samples (49). Past studies also demonstrate that CX-4945 treatment significantly inhibits tumor growth and increases median survival time when GBM cells are injected subcutaneously into the flank or intracranially in a mouse xenograft model (50). Our findings expand on these initial reports by demonstrating that CX-4945 could decrease GBM initiating cell growth and stemness through β-catenin. We found that in GBM tumor spheres CX-4945 had a dose-dependent response resulting in a decrease in β-catenin expression, β-catenin-regulated genes (OCT4 and NANOG), and GBM stemness. Taken together, our findings indicate that targeting CK2α using CX-4945 could be a powerful therapeutic treatment for GBM patients due to the role of CK2α in maintaining numerous pathways necessary for GBM tumorigenesis and BTIC growth. Additional clinical studies should be conducted to determine the efficacy of CX-4945 in GBM.
Materials and Methods
Cell culture and primary tissue samples
The GBM cell lines U87-MG and U138 (American Type Culture Collection, Manassas, Virginia, USA) were cultured in Dulbecco's modified Eagle medium (DMEM) supplemented with 10% fetal bovine serum and 2 mM L-glutamine. Cells were transfected using Effectene (Qiagen, Valencia, CA, USA) according to the manufacturer's protocol. Tumor spheres were derived from primary GBMs and cultured in a tumor stem base medium previously shown to enrich for GBM stem cells (24). Our tumor sphere medium consisted of neurobasal medium containing B27-A, 20 ng/mL epidermal growth factor, 20 ng/mL basic fibroblast growth factor, and 20 μg/mL heparin. The seven GBM tissue samples were harvested from primary GBM patients and the tissue was immediately frozen in dry ice. The normal brain was harvested from temporal lobe of a patient undergoing anterior temporal lobectomy for removal of mesial temporal sclerosis. The tissue was immediately frozen in dry ice and later thawed for harvesting of protein lysate.
Western blot
For protein analysis, protein extracts from cells were harvested and immunoblotted as previously described (51). The following antibodies were used for immunoblotting: green fluorescent protein (GFP), CK2α, and glyceraldehyde 3-phosphate dehydrogenase (GAPDH) (all from Cell Signaling Technology, Danvers, MA, USA), and CK2β (Millipore, Hayward, CA, USA). Chemiluminescence signals were quantitated using NIH Image J (National Institutes of Health, Bethesda, MD, USA).
RNA interference
U87-MG and U138 cells were transfected with 25 nM CK2α (#1027423, Qiagen, Valencia, CA, USA), CK2β (4390824 Ambion, Life Technologies, Austin, TX, USA) or non-target siRNA (4390843 Ambion, Austin, TX, USA) for 24 hours, using DharmaFECT transfection reagent 1 (Thermo Scientific, Waltham, MA, USA) according to the manufacturer's protocol. The lentiviral inducible shRNA plasmid, pTRIPZ, was used to express shRNA to the CK2α gene (Thermo Scientific, Waltham, MA, USA).
Retroviral and lentiviral infections
The retrovirus pMSCV-YPet was generated by subcloning YPet from the pCEP4-YPet plasmid into the pMSCV backbone (52). Retroviral infections were carried out as previously described except that the Phoenix-Ampho cell lines were used instead of HEK293 cells (51). Thirty-six hours after infection of the U87-MG or U138 cells, the cells were selected by culturing for 2 days in selective medium containing 0.5 μg/mL puromycin. The doxycycline inducible plasmid, pTRIPZ Retroviral shRNA, to CK2α was purchased commercially (Thermo Scientific, Waltham, MA, USA). Retroviral infections were carried out as described above, but the packaging plasmids, psPAX2 and pMD2.G, were transfected into HEK293 cells in neurobasal medium. Thirty-six hours after infection, the cells were selected using 5μg/ml puromycin for 3 days.
Cell growth analysis
U87-MG- and U138-infected cells were plated in six-well plates (5 × 10⁵ cells per well) and cultured in DMEM supplemented with 10% fetal bovine serum, 2 mM L-glutamine, and 100 units per ml penicillin/streptomycin. The number of live cells was counted at the specified times by means of trypan blue exclusion assay. Four sets of cells were counted per time point. Upon treatment with CK2 inhibitors (CX-4945 and TBBz), DMSO was used as a vehicle control. The amount of DMSO that was added was equal to the highest concentration of the drug, resulting in a final DMSO concentration of 0.01%. Experiments were done in triplicate and results are expressed as mean ± SD. To determine if the growth was statistically significant we used the Mann-Whitney U test. Tumor spheres were plated in a 96-well plate (100 cells per well) and cultured as described previously. After 14 days the number of spheres that formed were counted per well. Experiments were done in triplicate and results are expressed as mean ± SD. The Mann–Whitney U test was conducted to determine statistical significance.
Soft agar assay
U87-MG-infected cells were plated in six-well plates (3 × 10⁵ cells per well) and suspended in DMEM as previously described (51). The presence of colonies was scored after 10 days using Genetools software (Syngene, Los Altos, CA, USA). Experiments were done in triplicate and results are expressed as mean ± SD. The Mann–Whitney U test was conducted to determine statistical significance.
Quantitative real-time-PCR analysis
All specimens were accrued and evaluated under institutional review board (IRB)-approved protocols. Total RNA from each cell line was extracted using Trizol reagent (Promega, Sunnyvale, CA, USA) according to the manufacturer's protocol. The reverse transcription and quantitative PCR (QPCR) were carried out using the Brilliant II Syber Green QRT–PCR Master Mix Kit according to the manufacturer's protocol (Stratagene, Santa Clara, CA, USA). Primers were designed specifically for the CK2 genes and the specificity was verified by sequencing. Their sequences were: CK2α (forward), 5′-GGTTGTATGCTGGCAAGTATGA-3′; CK2α (reverse), 5′-TCGAGAGTGTCTGCCCAAGAT-3′; CK2β (forward), 5′-TGAGCAGGTCCCTCACTACC-3′; CK2β (reverse), 5′-GTAGCGGGCGTGGATCAAT-3′; Nanog (forward), 5′-ACCAGAACTGTGTTCTCTTCCACC -3′; Nanog (reverse), 5′-CCATTGCTATTCTTCGGCCAGTTG-3′; and Oct4 (forward), 5′-GGAAGGTATTCAGCCAAACGACCA-3′; Oct4 (reverse), 5′-CTCACTCGGTTCTCGATACTGGTT -3′; glyceraldehyde 3-phosphate dehydrogenase (GAPDH) (forward) 5′-GTCCACCACCCTGTTGCTGTA-3′; GAPDH (reverse) 5′-ACCACAGTCCATGCCATC-3′. Relative copy number was determined using the comparative Ct method. GAPDH served as the normalizing control. The Mann–Whitney U test was conducted to determine statistical significance.
Sphere formation
Following digestion of primary tumor to single cells, the single cells were plated at limiting dilutions or at a density of 100 cells per well. Cells were cultured in neurobasal medium containing B27-A, epidermal growth factor, basic fibroblast growth factor, and heparin. For estimation of sphere initiating cell frequency, limiting dilution analysis (LDA) was done as described previously (53). Cultures were carried out for 14 days and scored for wells that did not have spheres. An extreme LDA algorithm was used to determine the frequency of sphere initiating cells (27). Each experiment was done in triplicate and analyzed using 2-sided t tests. To determine sphere growth, 100 cells per well were plated and the cultures were carried out for 14 days. The number of spheres per well was counted and analyzed using 2-sided t tests.
Tumor formation
Cells were resuspended in a 1:1 mixture of cold PBS and Matrigel (BD Biosciences, San Jose, CA, USA) and adjusted to the appropriate concentration. One hundred microliters of the cell suspension was injected into the cortex of 6- to 8-week-old NOD scid gamma mice. Mice were sacrificed at 10 and 40 days and the tumors were extracted. Tumor size after injection was analyzed by fixing the tumors in paraformaldehyde, sectioning, and staining with hematoxylin and eosin. The mice were sacrificed under approved Institutional Animal Care and Use Committee protocols.
CK2 inhibitors
TBB, TBBz, and CX-4945 (Sigma, St. Louis, MO, USA) were used in inhibitor studies at the following concentrations for the specified time: 10 to 100 μM (TBB), 6 to 25 μM (TBBz), and 1 to 10 μM (CX-4945). Typically, U87-MG and U138 cells were incubated for 5 days with each compound and then analyzed. Fifty percent of the medium was replaced every 3 days with fresh medium containing treatment compounds at the original concentrations. Controls were treated with the vehicle control, dimethyl sulfoxide (DMSO; Sigma, St. Louis, MO, USA). The amount of DMSO added was equal to the highest concentration of drug, resulting in a final concentration of 0.01%.
Flow cytometry
Before flow cytometry analysis or sorting, cells were dissociated as described above or washed and dissociated using TrypLE (Gibco, Carlsbad, CA, USA). Cells were resuspended in a 100μL staining volume of fluorescence activated cell sorting (FACS) buffer (Hanks' balanced salt solution + 0.1% bovine serum albumin) and kept on ice. The following antibodies were used: CD133/1, and CD133/2 biotin (Miltenyi Biotech, San Diego, CA, USA), CD90 (Biolegend, San Diego, CA, USA), CD15 (BD Bioscience, San Jose, CA, USA), CD49f (BD Bioscience, San Jose, CA, USA), AB25 (Miltenyi Biotech, San Diego, CA, USA) and PE-CY7 strep (BD Biosciences, San Jose, CA, USA). All analyses were conducted using a LSR II FACS machine (BD Biosciences, San Jose, CA, USA) or sorted on an ARIA-II (BD Biosciences, San Jose, CA, USA) at the Stanford University FACS facility. Appropriate isotype controls were used to control for nonspecific isotype background.
GBM Survival Curve
The Kaplan Meier survival curve for GBM was derived using the National Cancer Institute REMBRANDT and the TCGA data source. The GBM patients were separated into high or low CK2α expression and graphed according to patient survival. The survival curves were derived using the http://genepyramid.stanford.edu/microarray/Explore/ and the R2: microarray analysis and visualization platform (http://r2.amc.nl). A log-rank test was used to determine the p value.
Gene expression profiling from primary GBM samples
Two GBM tumor panels and one normal brain panel used the Affymetrix U133 Plus 2.0 Microarray analysis to analyze mRNA expression in primary samples. Hegi et al. (2008) analysis contained 84 GBM samples derived from primary tumors and Lee et al. (2006) contained 101 primary GBM samples (19;54). The normal brain gene expression profile contained 173 samples for different regions in the brain including the hippocampus, entorhinal cortex, superior frontal gyrus, and postcentral gyrus. The expression data were normalized with the MAS5.0 algorithm within the Affymetrix's GCOS program. All data were analyzed using the R2 bioinformatic tool (http://r2.amc.nl). The expression was transformed to 2log and graphed as a boxplot. The single factor analysis of variance (ANOVA) was used to compare the means of the different groups and determined the statistical significance.
Supplementary Material
Supplemental Figure 1. Expression of CK2α in GBM patients. A) Boxplot representing the relative expression of CK2α from three different microarray sources. The Mixed samples of GBM had 101 patient samples, while there were 72 samples from primary GBM patients. The control was a microarray derived from 172 samples of normal brain. B) The Survival curve from analysis of TCGA for three subtype of GBM patients (classical, neural, proneural) separated by high or low expression of CK2α.
Supplemental Figure 2. Reducing expression or inhibiting CK2α activity decreased GBM tumorigenesis in U138 cells. A, cell growth analysis of U138 cells transfected with siRNA. The cell lines were cultured in 10% fetal bovine serum and viable cells were counted daily. Results are from two separate experiments, each done in triplicate. B, cell growth analysis of U138 cells treated with CK2 inhibitors TBB or TBBz. C, QPCR analysis of β-catenin-responsive genes.
Supplemental Figure 3. Tumor spheres with elevated levels CK2α expression may lead to a worse prognosis for GBM patients. A, FACS analysis showing the sorted subpopulation of CD133+ and CD133− tumor spheres. B. FACS analysis for CD15+ and CD15− tumor spheres. C, QPCR analysis of sorted tumor spheres for CK2α or CK2β mRNA expression. *represents a statistically significant change from the control, P < 0.05, as measured by the Mann–Whitney U test
Supplemental Figure 4. Reducing CK2α expression decreases β-catenin expression and activity in a second tumor sphere line (TS #2) derived from GBM patients. A, Western blot showing protein expression after tumor spheres were treated with CX-4945. B, QPCR analysis of β-catenin-responsive genes after treatment with CK2 inhibitor. C, LDA of tumor spheres treated with varying concentrations of CX-4945. Red represents DMSO-treated spheres, black represents spheres treated with 10μM CX-4945 and green represents spheres treated with 25μM TBBz. D, tumor sphere formation capacity was monitored by plating 100 cells and counting the number of spheres that formed after 14 days. E, Left, tumor sphere size after treatment with 10uM of CX-4945. Right, representative image of tumor spheres. *represents a statistically significant change from the control, P < 0.05, as measured by the Mann–Whitney U test
Supplemental Figure 5. CK2α activity is important for maintaining the GBM stem cells. FACS analysis of CD133+, CD90+, CD49f+ cells in low passage (< 5) tumor spheres treated with 5μM and 10μM of CX-4945. Left, histogram of FACS profile. Right, Mean Fluorescence Intensity (MFI) of each treatment.
Acknowledgments
We would like to thank Albert Wong for the use of equipment and resources. We also thank Tim Bui for his useful discussions and Cheryl Christensen for her critical review of the paper. This work was supported by the K08 Mentored Research Grant (NIH-KNS085333A) as well as the generous donation from Mr. Keith Tsu and Ms. Carmelita Ko.
Footnotes
Disclosure of Potential Conflicts of Interest None
Reference List
- (1).Louis D, Ohgaki H, Wiestler O, Cavanee W. Glioblastoma. WHO Classification of Tumours of the Central Nervous System. 2007:33–49. doi: 10.1007/s00401-007-0243-4. Ref Type: Generic. [DOI] [PMC free article] [PubMed] [Google Scholar]
- (2).Stupp R, Mason WP, van den Bent MJ, Weller M, Fisher B, Taphoorn MJ, et al. Radiotherapy plus concomitant and adjuvant temozolomide for glioblastoma. 2005 Mar 10;352(10):987–96. doi: 10.1056/NEJMoa043330. [DOI] [PubMed] [Google Scholar]
- (3).Singh SK, Hawkins C, Clarke ID, Squire JA, Bayani J, Hide T, et al. Identification of human brain tumour initiating cells. Nature. 2004 Nov 18;432(7015):396–401. doi: 10.1038/nature03128. [DOI] [PubMed] [Google Scholar]
- (4).Bao S, Wu Q, McLendon RE, Hao Y, Shi Q, Hjelmeland AB, et al. Glioma stem cells promote radioresistance by preferential activation of the DNA damage response. Nature. 2006 Dec 7;444(7120):756–60. doi: 10.1038/nature05236. [DOI] [PubMed] [Google Scholar]
- (5).Litchfield DW. Protein kinase CK2: structure, regulation and role in cellular decisions of life and death. Biochem J. 2003 Jan 1;369(Pt 1):1–15. doi: 10.1042/BJ20021469. [DOI] [PMC free article] [PubMed] [Google Scholar]
- (6).Trembley JH, Chen Z, Unger G, Slaton J, Kren BT, Van WC, et al. Emergence of protein kinase CK2 as a key target in cancer therapy. 2010 May;36(3):187–95. doi: 10.1002/biof.96. [DOI] [PMC free article] [PubMed] [Google Scholar]
- (7).Prudent R, Moucadel V, Nguyen CH, Barette C, Schmidt F, Florent JC, et al. Antitumor activity of pyridocarbazole and benzopyridoindole derivatives that inhibit protein kinase CK2. Cancer Res. 2010 Dec 1;70(23):9865–74. doi: 10.1158/0008-5472.CAN-10-0917. [DOI] [PubMed] [Google Scholar]
- (8).Moucadel V, Prudent R, Sautel CF, Teillet F, Barette C, Lafanechere L, et al. Antitumoral activity of allosteric inhibitors of protein kinase CK2. Oncotarget. 2011 Dec;2(12):997–1010. doi: 10.18632/oncotarget.361. [DOI] [PMC free article] [PubMed] [Google Scholar]
- (9).Olsen BB, Issinger OG, Guerra B. Regulation of DNA-dependent protein kinase by protein kinase CK2 in human glioblastoma cells. Oncogene. 2010 Nov 11;29(45):6016–26. doi: 10.1038/onc.2010.337. [DOI] [PubMed] [Google Scholar]
- (10).Zheng Y, McFarland BC, Drygin D, Yu H, Bellis SL, Kim H, et al. Targeting Protein Kinase CK2 Suppresses Pro-survival Signaling Pathways and Growth of Glioblastoma. Clin Cancer Res. 2013 Sep 13; doi: 10.1158/1078-0432.CCR-13-0265. [DOI] [PMC free article] [PubMed] [Google Scholar]
- (11).Dixit D, Sharma V, Ghosh S, Mehta VS, Sen E. Inhibition of Casein kinase-2 induces p53-dependent cell cycle arrest and sensitizes glioblastoma cells to tumor necrosis factor (TNFalpha)-induced apoptosis through SIRT1 inhibition. Cell Death Dis. 2012;3:e271. doi: 10.1038/cddis.2012.10. [DOI] [PMC free article] [PubMed] [Google Scholar]
- (12).Dixit D, Sharma V, Ghosh S, Mehta VS, Sen E. Inhibition of Casein kinase-2 induces p53-dependent cell cycle arrest and sensitizes glioblastoma cells to tumor necrosis factor (TNFalpha)-induced apoptosis through SIRT1 inhibition. Cell Death Dis. 2012;3:e271. doi: 10.1038/cddis.2012.10. [DOI] [PMC free article] [PubMed] [Google Scholar]
- (13).Cheong JW, Min YH, Eom JI, Kim SJ, Jeung HK, Kim JS. Inhibition of CK2{alpha} and PI3K/Akt synergistically induces apoptosis of CD34+ 2010 Nov;30(11):4625–34. [PubMed] [Google Scholar]
- (14).Zhang S, Wang Y, Mao JH, Hsieh D, Kim IJ, Hu LM, et al. Inhibition of CK2alpha down-regulates Hedgehog/Gli signaling leading to a reduction of a stem-like side population in human lung cancer cells. PLoS One. 2012;7(6):e38996. doi: 10.1371/journal.pone.0038996. [DOI] [PMC free article] [PubMed] [Google Scholar]
- (15).Huillard E, Ziercher L, Blond O, Wong M, Deloulme JC, Souchelnytskyi S, et al. Disruption of CK2beta in embryonic neural stem cells compromises proliferation and oligodendrogenesis in the mouse telencephalon. Mol Cell Biol. 2010 Jun;30(11):2737–49. doi: 10.1128/MCB.01566-09. [DOI] [PMC free article] [PubMed] [Google Scholar]
- (16).Ji H, Wang J, Nika H, Hawke D, Keezer S, Ge Q, et al. EGF-induced ERK activation promotes CK2-mediated disassociation of alpha-Catenin from beta-Catenin and transactivation of beta-Catenin. Mol Cell. 2009 Nov 25;36(4):547–59. doi: 10.1016/j.molcel.2009.09.034. [DOI] [PMC free article] [PubMed] [Google Scholar]
- (17).Ponce DP, Yefi R, Cabello P, Maturana JL, Niechi I, Silva E, et al. CK2 functionally interacts with AKT/PKB to promote the beta-catenin-dependent expression of survivin and enhance cell survival. Mol Cell Biochem. 2011 Oct;356(1–2):127–32. doi: 10.1007/s11010-011-0965-4. [DOI] [PubMed] [Google Scholar]
- (18).Ponce DP, Maturana JL, Cabello P, Yefi R, Niechi I, Silva E, et al. Phosphorylation of AKT/PKB by CK2 is necessary for the AKT-dependent up-regulation of beta-catenin transcriptional activity. J Cell Physiol. 2011 Jul;226(7):1953–9. doi: 10.1002/jcp.22527. [DOI] [PubMed] [Google Scholar]
- (19).Murat A, Migliavacca E, Gorlia T, Lambiv WL, Shay T, Hamou MF, et al. Stem cell-related “self-renewal” signature and high epidermal growth factor receptor expression associated with resistance to concomitant chemoradiotherapy in glioblastoma. J Clin Oncol. 2008 Jun 20;26(18):3015–24. doi: 10.1200/JCO.2007.15.7164. [DOI] [PubMed] [Google Scholar]
- (20).Lee Y, Scheck AC, Cloughesy TF, Lai A, Dong J, Farooqi HK, et al. Gene expression analysis of glioblastomas identifies the major molecular basis for the prognostic benefit of younger age. BMC Med Genomics. 2008;1:52. doi: 10.1186/1755-8794-1-52. [DOI] [PMC free article] [PubMed] [Google Scholar]
- (21).Prudent R, Sautel CF, Moucadel V, Laudet B, Filhol O, Cochet C. In vitro and in vivo assays of protein kinase CK2 activity. Methods Enzymol. 2010;485:597–610. doi: 10.1016/B978-0-12-381296-4.00031-2. [DOI] [PubMed] [Google Scholar]
- (22).Grigoryan T, Wend P, Klaus A, Birchmeier W. Deciphering the function of canonical Wnt signals in development and disease: conditional loss- and gain-of-function mutations of beta-catenin in mice. Genes Dev. 2008 Sep 1;22(17):2308–41. doi: 10.1101/gad.1686208. [DOI] [PMC free article] [PubMed] [Google Scholar]
- (23).Nager M, Bhardwaj D, Canti C, Medina L, Nogues P, Herreros J. beta-Catenin Signalling in Glioblastoma Multiforme and Glioma-Initiating Cells. Chemother Res Pract. 2012;2012:192362. doi: 10.1155/2012/192362. [DOI] [PMC free article] [PubMed] [Google Scholar]
- (24).Lee J, Kotliarova S, Kotliarov Y, Li A, Su Q, Donin NM, et al. Tumor stem cells derived from glioblastomas cultured in bFGF and EGF more closely mirror the phenotype and genotype of primary tumors than do serum-cultured cell lines. 2006 May;9(5):391–403. doi: 10.1016/j.ccr.2006.03.030. [DOI] [PubMed] [Google Scholar]
- (25).Beier CP, Beier D. CD133 negative cancer stem cells in glioblastoma. Front Biosci (Elite Ed) 2011;3:701–10. doi: 10.2741/e280. [DOI] [PubMed] [Google Scholar]
- (26).He J, Liu Y, Lubman DM. Targeting glioblastoma stem cells: cell surface markers. Curr Med Chem. 2012;19(35):6050–5. [PubMed] [Google Scholar]
- (27).Hu Y, Smyth GK. ELDA: extreme limiting dilution analysis for comparing depleted and enriched populations in stem cell and other assays. J Immunol Methods. 2009 Aug 15;347(1–2):70–8. doi: 10.1016/j.jim.2009.06.008. [DOI] [PubMed] [Google Scholar]
- (28).D'Amour KA, Gage FH. Are somatic stem cells pluripotent or lineage-restricted? Nat Med. 2002 Mar;8(3):213–4. doi: 10.1038/nm0302-213. [DOI] [PubMed] [Google Scholar]
- (29).Singh SK, Clarke ID, Terasaki M, Bonn VE, Hawkins C, Squire J, et al. Identification of a cancer stem cell in human brain tumors. Cancer Res. 2003 Sep 15;63(18):5821–8. [PubMed] [Google Scholar]
- (30).Dalerba P, Clarke MF. Cancer stem cells and tumor metastasis: first steps into uncharted territory. 2007 Sep 13;1(3):241–2. doi: 10.1016/j.stem.2007.08.012. [DOI] [PubMed] [Google Scholar]
- (31).Reya T, Morrison SJ, Clarke MF, Weissman IL. Stem cells, cancer, and cancer stem cells. Nature. 2001 Nov 1;414(6859):105–11. doi: 10.1038/35102167. [DOI] [PubMed] [Google Scholar]
- (32).Ikushima H, Todo T, Ino Y, Takahashi M, Saito N, Miyazawa K, et al. Glioma-initiating cells retain their tumorigenicity through integration of the Sox axis and Oct4 protein. J Biol Chem. 2011 Dec 2;286(48):41434–41. doi: 10.1074/jbc.M111.300863. [DOI] [PMC free article] [PubMed] [Google Scholar]
- (33).Zbinden M, Duquet A, Lorente-Trigos A, Ngwabyt SN, Borges I, Altaba A. NANOG regulates glioma stem cells and is essential in vivo acting in a cross-functional network with GLI1 and p53. EMBO J. 2010 Aug 4;29(15):2659–74. doi: 10.1038/emboj.2010.137. [DOI] [PMC free article] [PubMed] [Google Scholar]
- (34).Song DH, Dominguez I, Mizuno J, Kaut M, Mohr SC, Seldin DC. CK2 phosphorylation of the armadillo repeat region of beta-catenin potentiates Wnt signaling. J Biol Chem. 2003 Jun 27;278(26):24018–25. doi: 10.1074/jbc.M212260200. [DOI] [PubMed] [Google Scholar]
- (35).Ponce DP, Yefi R, Cabello P, Maturana JL, Niechi I, Silva E, et al. CK2 functionally interacts with AKT/PKB to promote the beta-catenin-dependent expression of survivin and enhance cell survival. Mol Cell Biochem. 2011 Oct;356(1–2):127–32. doi: 10.1007/s11010-011-0965-4. [DOI] [PubMed] [Google Scholar]
- (36).Ponce DP, Maturana JL, Cabello P, Yefi R, Niechi I, Silva E, et al. Phosphorylation of AKT/PKB by CK2 is necessary for the AKT-dependent up-regulation of beta-catenin transcriptional activity. J Cell Physiol. 2011 Jul;226(7):1953–9. doi: 10.1002/jcp.22527. [DOI] [PubMed] [Google Scholar]
- (37).Ji H, Wang J, Nika H, Hawke D, Keezer S, Ge Q, et al. EGF-induced ERK activation promotes CK2-mediated disassociation of alpha-Catenin from beta-Catenin and transactivation of beta-Catenin. Mol Cell. 2009 Nov 25;36(4):547–59. doi: 10.1016/j.molcel.2009.09.034. [DOI] [PMC free article] [PubMed] [Google Scholar]
- (38).Clement V, Sanchez P, de TN, Radovanovic I, Altaba A. HEDGEHOG-GLI1 signaling regulates human glioma growth, cancer stem cell self-renewal, and tumorigenicity. Curr Biol. 2007 Jan 23;17(2):165–72. doi: 10.1016/j.cub.2006.11.033. [DOI] [PMC free article] [PubMed] [Google Scholar]
- (39).Abdouh M, Facchino S, Chatoo W, Balasingam V, Ferreira J, Bernier G. BMI1 sustains human glioblastoma multiforme stem cell renewal. J Neurosci. 2009 Jul 15;29(28):8884–96. doi: 10.1523/JNEUROSCI.0968-09.2009. [DOI] [PMC free article] [PubMed] [Google Scholar]
- (40).Adesina AM, Lopez-Terrada D, Wong KK, Gunaratne P, Nguyen Y, Pulliam J, et al. Gene expression profiling reveals signatures characterizing histologic subtypes of hepatoblastoma and global deregulation in cell growth and survival pathways. Hum Pathol. 2009 Jun;40(6):843–53. doi: 10.1016/j.humpath.2008.10.022. [DOI] [PMC free article] [PubMed] [Google Scholar]
- (41).Molofsky AV, Pardal R, Iwashita T, Park IK, Clarke MF, Morrison SJ. Bmi-1 dependence distinguishes neural stem cell self-renewal from progenitor proliferation. Nature. 2003 Oct 30;425(6961):962–7. doi: 10.1038/nature02060. [DOI] [PMC free article] [PubMed] [Google Scholar]
- (42).Scharenberg CW, Harkey MA, Torok-Storb B. The ABCG2 transporter is an efficient Hoechst 33342 efflux pump and is preferentially expressed by immature human hematopoietic progenitors. Blood. 2002 Jan 15;99(2):507–12. doi: 10.1182/blood.v99.2.507. [DOI] [PubMed] [Google Scholar]
- (43).Pierfelice TJ, Schreck KC, Eberhart CG, Gaiano N. Notch, neural stem cells, and brain tumors. Cold Spring Harb Symp Quant Biol. 2008;73:367–75. doi: 10.1101/sqb.2008.73.013. [DOI] [PMC free article] [PubMed] [Google Scholar]
- (44).Fan X, Matsui W, Khaki L, Stearns D, Chun J, Li YM, et al. Notch pathway inhibition depletes stem-like cells and blocks engraftment in embryonal brain tumors. Cancer Res. 2006 Aug 1;66(15):7445–52. doi: 10.1158/0008-5472.CAN-06-0858. [DOI] [PubMed] [Google Scholar]
- (45).Androutsellis-Theotokis A, Leker RR, Soldner F, Hoeppner DJ, Ravin R, Poser SW, et al. Notch signalling regulates stem cell numbers in vitro and in vivo. Nature. 2006 Aug 17;442(7104):823–6. doi: 10.1038/nature04940. [DOI] [PubMed] [Google Scholar]
- (46).Zhang S, Wang Y, Mao JH, Hsieh D, Kim IJ, Hu LM, et al. Inhibition of CK2alpha down-regulates Hedgehog/Gli signaling leading to a reduction of a stem-like side population in human lung cancer cells. PLoS One. 2012;7(6):e38996. doi: 10.1371/journal.pone.0038996. [DOI] [PMC free article] [PubMed] [Google Scholar]
- (47).Zhang S, Long H, Yang YL, Wang Y, Hsieh D, Li W, et al. Inhibition of CK2alpha down-regulates Notch1 signalling in lung cancer cells. J Cell Mol Med. 2013 Jul;17(7):854–62. doi: 10.1111/jcmm.12068. [DOI] [PMC free article] [PubMed] [Google Scholar]
- (48).Pagano MA, Bain J, Kazimierczuk Z, Sarno S, Ruzzene M, Di MG, et al. The selectivity of inhibitors of protein kinase CK2: an update. Biochem J. 2008 Nov 1;415(3):353–65. doi: 10.1042/BJ20080309. [DOI] [PubMed] [Google Scholar]
- (49).Son YH, Song JS, Kim SH, Kim J. Pharmacokinetic characterization of CK2 inhibitor CX-4945. Arch Pharm Res. 2013 Jul;36(7):840–5. doi: 10.1007/s12272-013-0103-9. [DOI] [PubMed] [Google Scholar]
- (50).Zheng Y, McFarland BC, Drygin D, Yu H, Bellis SL, Kim H, et al. Targeting Protein Kinase CK2 Suppresses Pro-survival Signaling Pathways and Growth of Glioblastoma. Clin Cancer Res. 2013 Sep 13; doi: 10.1158/1078-0432.CCR-13-0265. [DOI] [PMC free article] [PubMed] [Google Scholar]
- (51).Nitta RT, Del Vecchio CA, Chu AH, Mitra SS, Godwin AK, Wong AJ. The role of the c-Jun N-terminal kinase 2-alpha-isoform in non-small cell lung carcinoma tumorigenesis. Oncogene. 2011 Jan 13;30(2):234–44. doi: 10.1038/onc.2010.414. [DOI] [PMC free article] [PubMed] [Google Scholar]
- (52).Nitta RT, Badal SS, Wong AJ. Measuring the constitutive activation of c-Jun N-terminal kinase isoforms. Methods Enzymol. 2010;484:531–48. doi: 10.1016/B978-0-12-381298-8.00026-5. [DOI] [PMC free article] [PubMed] [Google Scholar]
- (53).Del Vecchio CA, Jensen KC, Nitta RT, Shain AH, Giacomini CP, Wong AJ. Epidermal growth factor receptor variant III contributes to cancer stem cell phenotypes in invasive breast carcinoma. Cancer Res. 2012 May 15;72(10):2657–71. doi: 10.1158/0008-5472.CAN-11-2656. [DOI] [PubMed] [Google Scholar]
- (54).Lee J, Kotliarova S, Kotliarov Y, Li A, Su Q, Donin NM, et al. Tumor stem cells derived from glioblastomas cultured in bFGF and EGF more closely mirror the phenotype and genotype of primary tumors than do serum-cultured cell lines. Cancer Cell. 2006 May;9(5):391–403. doi: 10.1016/j.ccr.2006.03.030. [DOI] [PubMed] [Google Scholar]
Associated Data
This section collects any data citations, data availability statements, or supplementary materials included in this article.
Supplementary Materials
Supplemental Figure 1. Expression of CK2α in GBM patients. A) Boxplot representing the relative expression of CK2α from three different microarray sources. The Mixed samples of GBM had 101 patient samples, while there were 72 samples from primary GBM patients. The control was a microarray derived from 172 samples of normal brain. B) The Survival curve from analysis of TCGA for three subtype of GBM patients (classical, neural, proneural) separated by high or low expression of CK2α.
Supplemental Figure 2. Reducing expression or inhibiting CK2α activity decreased GBM tumorigenesis in U138 cells. A, cell growth analysis of U138 cells transfected with siRNA. The cell lines were cultured in 10% fetal bovine serum and viable cells were counted daily. Results are from two separate experiments, each done in triplicate. B, cell growth analysis of U138 cells treated with CK2 inhibitors TBB or TBBz. C, QPCR analysis of β-catenin-responsive genes.
Supplemental Figure 3. Tumor spheres with elevated levels CK2α expression may lead to a worse prognosis for GBM patients. A, FACS analysis showing the sorted subpopulation of CD133+ and CD133− tumor spheres. B. FACS analysis for CD15+ and CD15− tumor spheres. C, QPCR analysis of sorted tumor spheres for CK2α or CK2β mRNA expression. *represents a statistically significant change from the control, P < 0.05, as measured by the Mann–Whitney U test
Supplemental Figure 4. Reducing CK2α expression decreases β-catenin expression and activity in a second tumor sphere line (TS #2) derived from GBM patients. A, Western blot showing protein expression after tumor spheres were treated with CX-4945. B, QPCR analysis of β-catenin-responsive genes after treatment with CK2 inhibitor. C, LDA of tumor spheres treated with varying concentrations of CX-4945. Red represents DMSO-treated spheres, black represents spheres treated with 10μM CX-4945 and green represents spheres treated with 25μM TBBz. D, tumor sphere formation capacity was monitored by plating 100 cells and counting the number of spheres that formed after 14 days. E, Left, tumor sphere size after treatment with 10uM of CX-4945. Right, representative image of tumor spheres. *represents a statistically significant change from the control, P < 0.05, as measured by the Mann–Whitney U test
Supplemental Figure 5. CK2α activity is important for maintaining the GBM stem cells. FACS analysis of CD133+, CD90+, CD49f+ cells in low passage (< 5) tumor spheres treated with 5μM and 10μM of CX-4945. Left, histogram of FACS profile. Right, Mean Fluorescence Intensity (MFI) of each treatment.