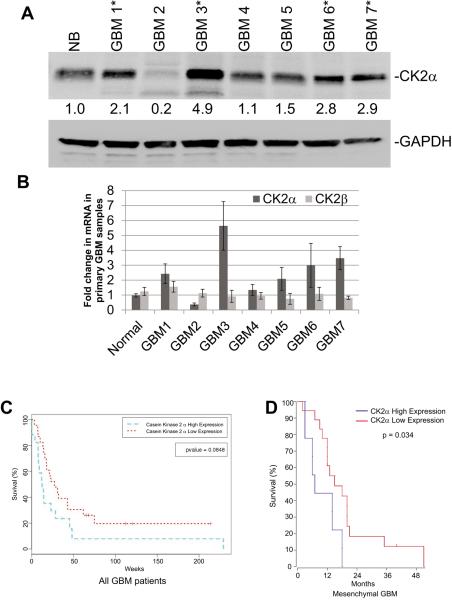
Figure 1.
Increased CK2α expression may lead to a worse prognosis for GBM patients. A, Western blot measuring the fold change in CK2α in seven primary GBM samples compared with normal brain (NB). GAPDH was used to control for protein load. B, QPCR analysis of primary GBM samples. *-represents samples with higher expression of CK2α. C. Survival curve for all GBM patients with high or low expression of CK2α using the REMBRANDT database. D. Survival curve for the mesenchymal subtype of GBM patients with high or low expression of CK2α using the TCGA.

