

Abstract
Drug-induced cholestasis is an important form of acquired liver disease and is associated with significant morbidity and mortality. Bile acids are key signaling molecules, but they can exert toxic responses when they accumulate in hepatocytes. This review focuses on the physiological mechanisms of drug-induced cholestasis associated with altered bile acid homeostasis due to direct (e.g. bile acid transporter inhibition) or indirect (e.g. activation of nuclear receptors, altered function/expression of bile acid transporters) processes. Mechanistic information about the effects of a drug on bile acid homeostasis is important when evaluating the cholestatic potential of a compound, but experimental data often are not available. The relationship between physicochemical properties, pharmacokinetic parameters, and inhibition of the bile salt export pump (BSEP) among seventy-seven cholestatic drugs with different pathophysiological mechanisms of cholestasis (i.e. impaired formation of bile vs. physical obstruction of bile flow) was investigated. The utility of in silico models to obtain mechanistic information about the impact of compounds on bile acid homeostasis to aid in predicting the cholestatic potential of drugs is highlighted.
Keywords: Drug-induced cholestasis, bile acid, transporters, physicochemical properties, pharmacokinetic parameters, in silico modeling
INTRODUCTION
The liver is the major organ responsible for the metabolism and excretion of endogenous and exogenous compounds, including drugs. The liver is predisposed to drug toxicity because of its anatomical location and the expression of uptake transporters that facilitate accumulation of drugs in hepatocytes. Drug-induced liver injury (DILI) is the most common cause of acute liver failure, 1 and is one of the primary reasons for the failure of pharmaceutical agents during drug development. Unfortunately, current in vitro screening approaches or in vivo preclinical studies do not adequately predict the likelihood of DILI. Even Phase III clinical trials that involve a few thousand patients often fail to detect DILI. In some cases, instances of severe liver injury and death only were observed after drug approval and administration to tens or hundreds of thousands of patients. These unexpected findings led to blackbox warnings, or in severe cases, withdrawal of the drug from the market. Recent examples include troglitazone and bromfenac (withdrawn), and bosentan and diclofenac (blackbox warnings).
DILI is classified into hepatocellular, mixed, or cholestatic injury based on the major underlying mechanism.2 Among 784 DILI cases reviewed by the Swedish adverse drug reactions advisory committee between 1970 and 2004, almost one-half of the cases had either cholestatic or mixed cholestatic hepatic toxicity.3 Acute cholestatic injury comprised approximately 16% of all hepatic adverse drug reactions in a Danish study of 1100 DILI cases from 1978 to 1987.4 In the United States, drugs were responsible for approximately 20% of cases of jaundice in the elderly population.5 However, reported reactions are thought to be only a small fraction of all the instances of drug-related cholestasis in the community because drug-induced cholestasis can present with asymptomatic disease where the only clinical manifestation is an elevation in liver enzymes, which often is not detected or reported. Therefore, the actual number of cases and medical costs associated with drug-induced cholestasis could exceed what has either been reported or estimated. In the present paper, the clinical presentation and mechanisms of bile-acid mediated drug-induced cholestasis are reviewed. In addition, we investigated whether the physicochemical properties or pharmacokinetic parameters of selected drugs, or the ability of these compounds to inhibit BSEP, influenced the type of cholestatic liver injury (impaired bile formation vs. obstruction of bile flow). Furthermore, existing in silico models developed to predict drug effects on bile acid transporters and nuclear receptors that are involved in bile acid homeostasis are reviewed.
CLINICAL FEATURES OF DRUG-INDUCED CHOLESTASIS
Diagnosis
Biochemical tests (liver function tests) typically are used to define drug-induced cholestasis. The Council of International Organizations of Medical Sciences (CIOMS) defines cholestatic injury as an elevation of serum alkaline phosphatase (AP) to greater than 2x the upper limit of normal (ULN) combined with a major elevation of γ-glutamyl transpeptiase (GGT) in the presence of a normal alanine transaminase (ALT) value. Alternatively, cholestasis is thought to be present when there is an increase in both ALT and AP, but with an ALT/AP ratio of < 2. In severe cases of cholestasis, an increase in serum conjugated bilirubin also is observed. Mixed hepatocellular/cholestatic injury is defined as an ALT/AP ratio of 2 – 5, whereas hepatocellular injury is defined as ALT > 2x ULN or ALT/AP ≥ 5.6 An accurate diagnosis of DILI also requires careful causality assessment, interpretation of clinical features and laboratory tests including liver biopsy findings, if available, and the exclusion of other potential causes for liver injury.
Clinical Presentation
Drug-induced cholestasis may present as an acute illness that promptly diminishes after withdrawal of the offending drug. Drug-induced cholestasis may present with or without jaundice, and symptoms may occur weeks or months after the start of treatment. Nonspecific symptoms such as nausea, malaise, anorexia, and fatigue may be elicited due to parenchymal liver injury. For some drugs (e.g., amoxicillin-clavulanate, erythromycin), abdominal pain or discomfort has been reported.7 Chronic drug-induced cholestasis can result in the development of xanthomas, pruritus, and melanoderma. Symptoms often resolve following withdrawal of the offending drug, but in some cases, if there is significant loss of the interlobular bile ducts, chronic liver disease may develop and even progress to liver failure.8 Rarely, drugs can induce cholelithiasis (gall stones) or mimic large duct sclerosing cholangitis, resulting in extrahepatic obstruction.9 Drug-induced cholestasis can be classified into the following categories:
Acute Drug-Induced Cholestasis without Hepatitis (Bland Cholestasis)
This is a rare type of drug-induced cholestasis that typically is produced by estrogens or anabolic steroids, and manifests histologically as pure canalicular cholestasis. Bland cholestasis causes abnormal biliary secretions without hepatocellular damage.
Acute Drug-Induced Cholestasis with Hepatitis (Cholestatic Hepatitis)
This type of drug-induced cholestasis is associated with concomitant hepatic parenchymal damage. Cholestatic hepatitis is characterized by portal inflammation and varying degrees of hepatocyte injury and necrosis.
Acute Drug-Induced Cholestasis with Bile Duct Injury
This type of drug-induced cholestasis involves bile duct injury (ductular, cholangiolar, or cholangiolytic) but minimal parenchymal liver cell injury.
Chronic Drug-Induced Cholangiopathies
These drug-induced cholestatic disorders vary from mild, nonspecific bile duct injury (mild elevation in AP or GGT) to vanishing bile duct syndrome (VBDS), sclerosing cholangitis, and cholelithiasis.10
PHYSIOLOGY OF BILE ACID HOMEOSTASIS
Cholestasis may occur if there is impaired formation of bile or if there is a physical obstruction to the flow of bile after it has been secreted from hepatocytes. To understand the pathogenesis of cholestasis, it is important to understand the physiological principles involved in bile flow.
Synthesis and Conjugation
Primary bile acids are synthesized from cholesterol in hepatocytes. Approximately 16 enzymes are involved in this process; the rate limiting step is 7α-hydroxylation by Cytochrome P450 7A1 (CYP7A1).11,12 Chenodeoxycholic acid (CDCA) and cholic acid (CA) are the most common primary bile acids in humans while rodents have high levels of muricholic acid (MCA) and hyocholic acid (HCA). Secondary bile acids are formed by gut bacteria-mediated dehydroxylation of primary bile acids. The most common secondary bile acids include lithocholic acid (LCA) and deoxycholic acid (DCA), which are formed by 7-dehydroxylation of CDCA and CA, respectively. Bile acids are conjugated extensively with glycine or taurine in the liver, and more than 98% of bile acids excreted from the liver are amidated. Bile acids also may undergo sulfation or glucuronidation. Conjugated bile acids are more water soluble and therefore, are excreted more readily into feces and urine. Bile acid synthesis has been comprehensively reviewed elsewhere.11,13
Hepatobiliary Transport
Bile acids undergo vectorial transport from sinusoidal blood across the basolateral membranes into hepatocytes, and across the canalicular membranes into bile. Bile acids are taken up from the sinusoidal blood into hepatocytes by the uptake transport proteins sodium taurocholate cotransporting polypeptide (NTCP) and organic anion transporting polypeptides (OATPs) (Figure 1A). NTCP is responsible for sodium-dependent bile acid uptake, while sodium-independent transport is mediated by OATPs. The efficiency of hepatic uptake varies depending on the bile acid structure: trihydroxy > dihydroxy bile acids, and conjugated > unconjugated bile acids.14 Individual bile acids may use different uptake transporters. The uptake of conjugated bile acids such as taurocholic acid (TCA) is mediated predominantly (>75%) by sodium-dependent NTCP. In contrast, sodium-dependent uptake accounts for less than half of the uptake of unconjugated bile acids.15–18 Within hepatocytes, bile acids are translocated by diffusion or undergo carrier-mediated transport after binding to cytosolic proteins such as glutathione S-transferases, liver fatty acid binding protein (L-FABP), and dehydrogenases.19 Vesicular transport of bile acids has been suggested, but confocal microscopy studies of fluorescent bile acid analogs in hepatocyte couplets showed no intracellular vesicular structure containing bile acids.20 However, characteristics and intracellular disposition of fluorescent bile acid analogs may differ between individual bile acids, and the significance of vesicular transport of bile acids in hepatocytes remains to be investigated. At the canalicular membrane, bile acids are excreted into bile predominantly via the bile salt export pump (BSEP) in an ATP-dependent manner (Figure 1A). Multidrug resistance-associated protein (MRP) 2, which is the main driving force for bile salt-independent bile flow through canalicular excretion of reduced glutathione, also transports glucuronide and sulfate conjugates of bile acids.21 The osmotic forces that are generated by bile acid secretion, coupled with the coordinated contraction of the actin filaments that surround the canaliculus, generate the pressure necessary to force bile to flow down the bile duct. The biliary tract itself is composed of a network of small to large ducts that are lined by cholangiocytes (bile duct epithelial cells). Cholangiocytes also express ion and organic anion transporters on the apical [i.e. apical sodium-dependent bile salt transporter (ASBT), OATP1A2] and basolateral [i.e. organic solute transporter (OST)α/β, MRP3] membranes that modify the composition of bile before it passes into the larger bile ducts.21–23 In humans, bile acids enter the gallbladder where they are stored and expelled into the duodenum in response to hormonal signals such as cholecystokinin. In addition to canalicular excretion, hepatocytes also are capable of effluxing bile acids across the basolateral membrane into sinusoidal blood via MRP3, MRP4, and a recently identified heteromeric organic solute transporter, OSTα-OSTβ (Figure 1A). Human MRP3 and rat Mrp3 transported glycocholic acid (GCA) and taurolithocholate 3-sulfate (TLC-S), whereas TCA was transported to a significant degree only by rat Mrp3.24 Unconjugated (CA, DCA) and conjugated bile acids [TCA, GCA, taurochenodeoxycholic acid (TCDCA), glycochenodeoxycholic acid (GCDCA)] were transported by MRP4 in the presence of glutathione with higher affinity than MRP3,25 suggesting that MRP4 may play an important role in basolateral efflux of bile acids in humans. OSTα-OSTβ transports glycine and taurine conjugated bile acid species by facilitated diffusion; OSTα-OSTβ mediates cellular efflux or uptake depending on the electrochemical gradient.26,27 The contribution of basolateral efflux to overall hepatic bile acid excretion is small under normal conditions, but expression of these transporters is up-regulated under cholestatic conditions as an important part of adaptive response to serve as a compensatory route of bile acid excretion.28–32 Assem et al. reported that Mrp4 and sulfotransferase (Sult) 2a1 are both upregulated during cholestasis suggesting that increased sulfation and hepatic basolateral efflux of sulfated bile acids leads to increased renal excretion as a compensatory excretion route.33 In healthy humans, the proportion of sulfated bile acids in the serum is less than 2% of bile acids, and the amount of total bile acids excreted in urine is minimal, whereas in patients with hepatobiliary/cholestatic disease, urinary excretion of bile acids increased more than 100-fold, with 25 – 80% of urinary bile acids excreted in the sulfated form.34 These studies demonstrate that sulfation and glucuronidation of bile acids are important detoxification pathways; conjugation increases the hydrophilicity of bile acids and, in most cases, decreases the toxicity and facilitates the urinary excretion of bile acids.
Figure 1.

Localization of bile acid transporters in human hepatocytes (A) and enterocytes (B).
Intestinal Transport
Bile acids undergo efficient enterohepatic recirculation. The bile acid pool size is only about 2 – 3 g in humans, but 12 – 18 g of bile acids are secreted into bile per day because the pool recycles several times after each meal.35 Just a small fraction of the bile acid pool is lost in the feces (0.2 – 0.6 g/day), and about 0.3 g/day of bile acids are synthesized in hepatocytes to replace the portion that is excreted.35 In the intestinal lumen, taurine- or glycine-conjugated bile acids are de-conjugated by gut bacteria. Bile acids are reabsorbed by ASBT in the terminal ileum (Figure 1B) or by passive diffusion.36 From the enterocyte, bile acids enter the mesenteric blood via basolateral transport proteins such as MRP3 and OSTα-OSTβ (Figure 1B),16,23,37–41 and return to the liver in portal blood followed by efficient uptake by hepatocyte transporters, as described above. It has been reported that MRP4 is expressed in the basolateral membrane of Caco-2 cells,42 but its expression and contribution to basolateral transport of bile acids in enterocytes remain to be investigated. Sulfate-conjugates of bile acids are not deconjugated readily and only a limited amount of sulfated bile acids are re-absorbed.34 Bile acids that are not absorbed from the colon are eliminated in the feces; fecal elimination is balanced by biosynthesis from cholesterol in the liver.
Bile Acid Toxicity
Bile acids are required for the digestion and absorption of fats and fat-soluble vitamins and they facilitate the excretion of bile pigments, cholesterol, and other medium-sized molecules by micellar solubilization. Bile acids induce biliary lipid secretion and solubilize cholesterol in bile, thereby promoting cholesterol elimination. Bile acids are potent activators of nuclear receptors such as farnesoid-X receptor (FXR) and pregnane X receptor (PXR), and they play an important role in the regulation of lipid homeostasis.43,44
However, bile acids can be cytotoxic when present in abnormally high concentrations in hepatocytes. Therefore, defects in bile acid excretion may lead to cholestasis. Defects in hepatocytes (especially at the canalicular membrane), altered fluidity of bile, impaired contraction of the actin filaments in the pericanalicular region, and changes in bile duct patency can reduce bile flow. Importantly, drugs also can affect bile flow at one or more of these steps, which will be discussed in more detail in the following sections. Bile acid toxicity is thought to be highly correlated with hydrophobicity; more hydrophobic bile acids are more cytotoxic. The rank order of bile acid cytotoxicity, from greatest to least is: LCA> CDCA, DCA > CA > ursodeoxycholic acid (UDCA).45 Under normal conditions, it is likely that the unbound concentration of bile acids in the cytosol of hepatocytes is low because bile acids are highly bound to cytosolic proteins. However, if hepatic concentrations exceed the binding capacity of the cytosolic proteins, unbound bile acid concentrations would be expected to increase markedly. Accumulation of bile acids in hepatocytes leads to mitochondrial damage and ultimately to apoptosis or necrosis.46,47 LCA has been shown to induce biliary tract injury; oral administration of LCA to mice resulted in cholangitis.48
MECHANISMS OF DRUG-INDUCED CHOLESTASIS
Cholestatic drugs may disrupt bile acid homeostasis by direct inhibition of bile acid transport (Figure 2A), or by indirect processes, which may include regulation of transporter localization (Figure 2B) or expression (Figure 2C). In the following section, the physiological mechanisms of drug-induced cholestasis that are associated with altered bile acid homeostasis are reviewed.
Figure 2. Mechanisms of altered bile acid transport by cholestatic drugs. (A) Direct inhibition of transport proteins.
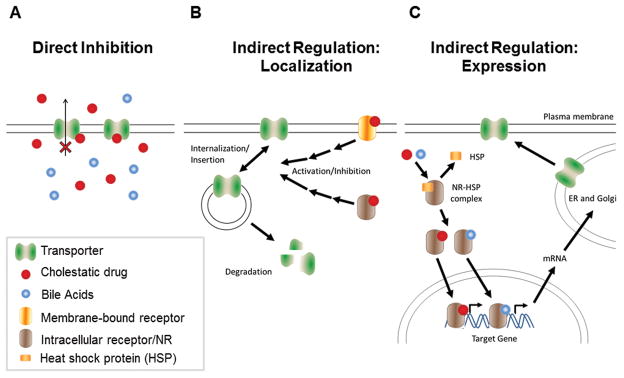
Cholestatic drugs might directly interfere with bile acid transport through inhibition of transporter function. (B) Altered localization of transport proteins. Certain cholestatic drugs can activate membrane-bound and intracellular receptors resulting in activation or inhibition of intracellular signal transduction and increased insertion into or internalization from the plasma membrane. Internalized proteins can be degraded or undergo recycling to the plasma membrane. (C) Altered transport protein expression. Bile acids and certain cholestatic drugs are activators of nuclear receptors (NR). Binding of ligands results in dissociation of heat-shock proteins from the NR, homo-dimerization and subsequent translocation to the nucleus where they bind to response elements of target genes and activate gene transcription.
Role of hepatic transport proteins in drug-induced cholestasis
Hepatic biliary and basolateral transport proteins regulate the physiologic/pathophysiologic effects of endogenous compounds such as bile acids as well as exogenous compounds. Increasing evidence supports the hypothesis that drug-mediated functional disturbances in hepatic bile acid transporters can lead to intracellular accumulation of potentially harmful bile acids and subsequent development of cholestatic hepatocyte damage. In an effort to avoid drug-induced cholestasis, an in vitro test for BSEP inhibition during drug development may prove beneficial to screen for hepatotoxic compounds. However, bile acid-drug interactions are more complicated. The intracellular accumulation of bile acids is dependent upon both uptake and efflux (basolateral and canalicular) processes. Furthermore, the sensitivity of each transport protein to administered drugs may differ. Thus, to predict the hepatic exposure to bile acids, inhibitory effects of drugs on each transport protein, as well as drug concentrations at the site of interaction should be considered when translating in vitro data to in vivo. For the inhibition of uptake transporters, systemic concentrations of drugs are important, whereas intracellular drug concentrations are important when considering the inhibitory effects of drugs on bile acid efflux. However, measurement of intracellular hepatocyte drug concentrations is challenging, and these data typically are not available, particularly in humans. Additionally, most major human bile acids are >80% bound to plasma proteins,49 so it is likely that bile acids are highly bound to cytosolic proteins in hepatocytes; total as well as unbound intracellular bile acid concentrations may be important in predicting drug-bile acid interactions.
Several transport proteins have been identified as potential loci for drug-induced cholestasis. These include the basolateral uptake transporters (NTCP and OATPs), canalicular efflux transporters (BSEP, MRP2, and MDR3), and basolateral efflux transporters (MRP3 and MRP4). The potential role(s) of each of these transport proteins in drug-induced cholestasis will be discussed in detail in the following paragraphs.
Hepatic Canalicular Efflux Transport Proteins
The rate-limiting step in bile formation is transport of biliary constituents across the canalicular membrane. This process is mediated predominantly by BSEP, a hepatic transport protein that is a member of the ATP-binding cassette (ABC) gene superfamily. Impaired BSEP function due to defects in gene coding or gene regulation can lead to inherited and acquired cholestatic disorders such as progressive familial intra-hepatic cholestasis type 2 (PFIC2), benign recurrent intrahepatic cholestasis type 2 (BRIC2), and intrahepatic cholestasis of pregnancy.50–52 Many drugs that cause either cholestatic or mixed hepatocellular/cholestatic liver injury (e.g., troglitazone, bosentan, cyclosporine, rifampin, sulindac, and glibenclamide) inhibit BSEP/Bsep-mediated biliary excretion of bile acids, potentially leading to increased hepatic exposure to cytotoxic bile acids.53–58 Two recent studies that systematically compared the potency of BSEP inhibition between cholestatic and non-cholestatic drugs revealed that drugs that caused cholestatic/mixed DILI in humans exhibited a markedly higher incidence and potency of BSEP inhibition compared to drugs that were non-cholestatic or caused hepatocellular liver damage.59,60 In these studies, the inhibitory effects of test compounds on TCA uptake into inside-out membrane vesicles prepared from insect cells over-expressing BSEP/Bsep were investigated, and BSEP inhibition was demonstrated to be one of the risk factors for drug-induced cholestasis. These studies also showed a close correlation between inhibition potency for human BSEP- and rat Bsep-mediated TCA transport.59,60 In most of the BSEP inhibition studies, including the above studies, TCA was used as a model bile acid. However, Kis et al. showed that troglitazone and glibenclamide inhibited the BSEP/Bsep-mediated transport of different bile acids (TCA, GCA, TCDCA, and GCDCA) with similar potencies (IC50), whereas cyclosporine A exhibited a 10-fold more potent inhibition of GCA and TCDCA transport compared to TCA and GCDCA.57 Thus, extrapolation of the results of transport inhibition from one bile acid to another may not be accurate. Also, one should note that membrane vesicles do not express metabolizing enzymes, thus inhibitory effects of metabolites cannot be detected unless the metabolite(s) are tested directly.
Whereas most of the BSEP inhibitors directly cis-inhibit BSEP, estradiol 17β-glucuronide and progesterone metabolites indirectly trans-inhibit Bsep after secretion into the bile canaliculus by Mrp2.61 Bosentan stimulated Mrp2-dependent bilirubin excretion and bile salt-independent bile flow, while phospholipid and cholesterol secretion were markedly inhibited and uncoupled from bile salt secretion.62 Inhibition of biliary lipid secretion was not observed in Mrp2-deficient TR- rats, which suggested that translocation of organic anions across the canalicular membrane is a prerequisite for the occurrence of the uncoupling effect.62
MDR3, an ATP-dependent phospholipid flippase, translocates phosphatidylcholine from the inner to the outer leaflet of the canalicular membrane.63 Subsequently, canalicular phospholipids are solubilized by canalicular bile salts to form mixed micelles, thereby protecting cholangiocytes from the detergent properties of bile salts. Mutations in MDR3 result in impaired biliary excretion of phosphatidylcholine and cause PFIC3, a severe pediatric liver disease that usually requires liver transplantation.64 Yoshikado et al. noted that two patients with itraconazole-induced cholestatic liver injury exhibited markedly high serum itraconazole concentrations.65 In itraconazole-treated rats, biliary phospholipids, rather than bile acids, were markedly decreased compared to control rats.65 Itraconazole decreased MDR3-mediated efflux of phosphatidylcholine in MDR3-overexpressing cells, but did not alter BSEP-mediated TCA transport.65 These results suggest that inhibition of MDR3-mediated biliary phospholipid secretion can be a risk factor for drug-induced cholestasis even if bile acid excretion is not altered. In vitro, MDR3 transported verapamil and cyclosporine, which could potentially lead to competitive inhibition of phospholipid flippase activity and cholestatic injury.66
Hepatic Basolateral Efflux Transport Proteins
As described above, BSEP inhibition is a risk factor for drug-induced cholestasis. However, not all drugs that inhibit BSEP cause cholestasis. This suggests that screening for BSEP inhibition alone cannot accurately predict the hepatotoxic potential of drugs. This might be due to compensatory mechanisms of bile acid transport. The basolateral efflux transporters, MRP3 and MPR4, play a minor role in bile acid efflux under normal conditions, but they are up-regulated under cholestatic conditions to compensate for impaired biliary excretion.67–72 Compensatory basolateral efflux prevents hepatic bile acid accumulation and enables subsequent renal elimination of bile acids. Thus, impaired function of MRP3 and MRP4 by drugs, or genetic polymorphisms resulting in reduced-function variants may result in accumulation of toxic bile acids in hepatocytes. Troglitazone sulfate (TS), a major metabolite of troglitazone and a potent BSEP inhibitor, also inhibits MRP4-mediated dehydroepiandrosterone (DHEAS) transport; potent inhibition of both canalicular and basolateral efflux of bile acids by TS may predispose hepatocytes to toxicity.73 Our group has investigated the inhibitory effects of 88 compounds on MRP3 and MRP4, and reported that MRP4 inhibition was associated with an increased risk of cholestatic potential for drugs that are not BSEP inhibitors.74,75 These results suggest that MRP4 inhibition also may represent a risk factor for the development of cholestatic DILI in humans.
Hepatic Uptake Transport Proteins
Basolateral uptake transporters are important in controlling hepatic and systemic exposure to drugs and toxins. The hepatic accumulation of bile acids is regulated by both uptake and efflux (basolateral and canalicular) processes, thus inhibition of hepatic bile acid uptake may exert protective effects by preventing the hepatic accumulation of bile acids. Bosentan, a potent inhibitor of human BSEP and rat Bsep, caused hepatic injury in humans, but bosentan-treated rats did not develop hepatotoxicity.54 Species difference in bosentan-induced hepatotoxicity might be explained by differential inhibition of human NTCP and rat Ntcp. Bosentan was a more potent inhibitor of sodium-dependent TCA uptake in rat (IC50 = 5.4 μM) than human (IC50 = 30 μM) suspended hepatocytes, resulting in less hepatocyte accumulation of TCA in rats after administration of bosentan.76 Drugs also may exert differential inhibitory effects on individual bile acids. Marion et al. reported that troglitazone differentially affected the uptake and accumulation of CDCA species (CDCA and metabolites) compared with TCA in rat SCH, causing an intracellular increase in CDCA species but not TCA.18 Troglitazone inhibited both uptake and biliary excretion of TCA in rat and human hepatocytes, leading to unchanged or even decreased intracellular accumulation.18,77–79 Hepatic accumulation of CDCA species was not altered after incubation with 10 μM troglitazone, but was significantly increased with 100 μM troglitazone suggesting that biliary excretion of CDCA species was inhibited to a greater extent than uptake processes by higher concentrations of troglitazone. CDCA is more abundant in humans, and is known to be more cytotoxic compared to TCA.80,81 These results suggest that one should consider species differences as well as differential inhibitory effects of drugs on individual bile acids when predicting hepatotoxicity in humans.
Role of intestinal transport proteins in drug-induced cholestasis
Bile acid concentrations in enterocytes are important in the bile acid regulatory loop. Once activated by bile acids, intestinal FXR induces an intestinal hormone, fibroblast growth factor 19 (FGF19; or Fgf15 in mice), which migrates to the liver and activates hepatic FGF receptor 4 (FGFR4) signaling to inhibit hepatic bile acid synthesis.13 Activation of hepatic FXR also down-regulates bile acid synthesis by activation of small heterodimer partner (SHP).13 In ASBT null mice, which were unable to absorb bile acids in the ileum, intestinal and hepatic FXR activity was impaired resulting in decreased Fgf15 and Shp in the ileum and liver, respectively.82 Because Fgf15 and Shp play important roles in the regulatory feedback loop of bile acid synthesis, mRNA levels of Cyp7a1and bile acid synthesis were increased in ASBT null mice compared to wild-type mice.82 Similarly, inhibition of bile acid absorption in the intestine by ASBT inhibitors or bile acid sequestrants interrupted the normal feedback inhibition of bile acid synthesis, leading to increased hepatic Cyp7a1 expression and bile acid synthesis.82 On the other hand, inhibition of basolateral bile acid transport in enterocytes of OSTα null mice increased intestinal Fgf15 expression and decreased bile acid synthesis in hepatocytes.40 Interruption of bile acid absorption by surgical procedures (i.e. partial external biliary diversion, partial ileal bypass) or bile acid sequestrants (i.e. cholestyramine, cholespitol) have been used to treat cholestasis and/or pruritus.83–85 Bile acid sequestrants are non-digestible resins that bind to intestinal bile acids and form an insoluble complex, reducing absorption of bile acids. They are used to treat primary hypercholesterolemia, and also as a second-line treatment for pruritus in patients with incomplete biliary obstruction. ASBT inhibitors have been investigated to treat hypercholesterolaemia, but the effects on cholestatic liver disease have not been evaluated fully. Reduced absorption of bile acids through the enterohepatic circulation may have therapeutic effects in certain types of cholestatic liver disease, but effects on the feedback loop of bile acid synthesis also must be considered.
Indirect Interactions: Effects on Expression/Activity/Localization of Transport Proteins and Enzymes Involved in Bile Acid Homeostasis
Due to the critical physiological and pathophysiological role of bile acids, homeostasis is tightly regulated through multiple nuclear receptors including FXR, the retinoid-X receptor (RXR), the liver receptor homologue-1 (LRH-1), the constitutive androstane receptor (CAR) and the liver-X-receptor (LXR), as well as the cell surface bile acid receptors including the G-protein coupled receptor TGR5. In addition, bile acid transporters undergo post-transcriptional regulation including insertion/retrieval of transporters into/from the plasma membrane. These mechanisms allow fine tuning of bile acid synthesis and transport and, under normal physiological conditions, maintain enterohepatic circulation and regulate intracellular concentrations of bile acids through repression of bile acid synthesis, induction of bile acid metabolism (e.g. induction of phase I and II hydroxylation, sulfation and conjugation) as well as inhibition of hepatic bile acid uptake, and stimulation of bile acid efflux. The importance of nuclear receptors in the adaptive response to bile acids has been demonstrated in numerous knockout rodent models. For example, PXR or CAR knockout mice are more susceptible to cholestatic liver injury than wild-type mice.31,86,87 Nuclear receptor-mediated adaptive changes are likely caused by compounds normally excreted into bile (e.g. bile acids, hormones, drugs, or bilirubin) that are retained during cholestasis and act as nuclear receptor ligands.88,89
Drugs that act as nuclear receptor activators (e.g. rifampicin, dexamethasone) can increase the clearance of other drugs or induce the formation of reactive metabolites that can cause hepatotoxicity. For example, acetaminophen liver toxicity was exacerbated by increased phase I-mediated oxidation to the reactive metabolite N-acetyl-p-benzoquinone-imine by CYP inducers.90,91
Several anticholestatic compounds such as UDCA, phenobarbital, and rifampicin are nuclear receptor agonists, which could explain their anticholestatic properties. In recent years, FXR agonists have been proposed as a treatment for cholestatic liver disease because they repress bile acid uptake and synthesis, and promote bile acid excretion by activation of canalicular bile acid transporters. However, the utility of FXR agonists in the treatment of cholestasis might depend on the type of cholestasis, and changes in the expression of transport proteins that are induced. For conditions that are characterized by bile duct destruction such as primary biliary cirrhosis (PBC) or primary sclerosing cholangitis (PSC), stimulation of canalicular bile acid excretion may worsen liver injury. Interestingly, FXR knockout mice but not wild-type mice adapted to bile duct obstruction by increasing expression of Mrp4 mRNA and were protected from liver injury after ligation of the common bile duct.92 It was suggested that FXR acts as a negative regulator of the basolateral bile acid transport protein MRP4, whose increased expression normally protects the liver from accumulation of potentially toxic bile acids through basolateral efflux and subsequent renal elimination. FXR competes with CAR for binding at the MRP4 promoter and represses MRP4 induction by CAR activation; activation of FXR could impair the MRP4-mediated basolateral efflux of bile acids.93 Because of this, FXR antagonists might be beneficial in certain types of cholestasis (e.g. total biliary obstruction) where increased renal bile acid excretion is desired. For more detail about FXR and PXR and their role as potential targets for cholestasis, see the review of Jonker et al.43
Estrogen-induced cholestasis
While decreased expression or impaired function of transport proteins can contribute to or cause cholestasis, most changes in transport protein expression observed in cholestatic patients or animal models represent compensatory mechanisms providing alternate routes of excretion in response to the retention of bile acids. There are only a few examples where changes in transport protein expression or localization (as opposed to inhibition) due to drug treatment or other cholestatic agents, such as hormones and proinflammatory cytokines, are the primary cause of cholestasis. The most prominent example of this type of cholestasis is estrogen- and C17-alkylated steroid-induced cholestasis, which causes a clinical picture that is similar to intrahepatic cholestasis of pregnancy in susceptible women who use oral contraceptives or postmenopausal estrogen replacement therapy. Estrogen-induced cholestasis can be induced experimentally in rodents with estradiol-17β-D-glucuronide (E217G) or the synthetic estrogen ethinylestradiol.94,95 Although trans-inhibition of BSEP-mediated bile acid transport by E217G has been demonstrated,61 the internalization of Bsep and Mrp2, which impairs the excretory function within minutes by reducing the amount of protein in the canalicular membrane, appears to be a key mechanism of cholestasis.96–98 E217G activates classical, Ca2+-dependent protein kinase C and phosphoinositol 3-kinase signaling pathways, which are cooperatively involved in internalization and intracellular retention of Bsep/Mrp2.99,100 Furthermore, E217G activates the estrogen receptor α (ERα) in isolated perfused rat liver.101 This might explain why chemical inhibition or knock-down of ERα partially prevented decreased Bsep/Mrp2 activity and reduced transporter internalization.101 This finding is substantiated further by the observation that Erα(−/−) mice are resistant to ethinylestradiol-induced hepatotoxicity.102 At the moment, it is not quite clear how the activation of the ERα leads to internalization of transporter proteins. Recent data suggest that phosphoinositol 3-kinase is not directly involved in this process, and it was shown that activation of protein kinase C actually precedes activation of ERα, suggesting that other yet unknown mediators are involved.101 Interestingly, the upregulation of Mrp3 expression and activity in rat liver after administration of ethinylestradiol was independent of cholestasis and required the estrogen receptor.103
Inflammation-induced cholestasis
Inflammation often contributes to liver injury during cholestasis. However, cholestasis also can be induced by inflammation itself. This phenomenon is common in patients with extrahepatic infections or inflammatory processes in which inflammatory cytokines or bacterial endotoxins lead to profound reductions in bile flow.104,105 The prototypical example of inflammation-induced cholestasis is sepsis-associated cholestasis. Lipopolysaccharide (LPS), an endotoxin from the cell wall of gram-negative bacteria, is a potent causal agent in inflammation. LPS often is released at extrahepatic sites and cleared from the systemic circulation by Kupffer cells in the liver, which respond by producing proinflammatory cytokines and/or nitric oxide (NO). These cytokines and NO activate membrane receptors and after intracellular signal transduction, they alter hepatic and renal transport protein expression and function.
Most of our knowledge about inflammation-induced changes in hepatic transport proteins is based on animal models; reduced expression of the bile acid uptake proteins Ntcp and Oatp, decreased expression of the canalicular bile acid efflux pumps Bsep and Mrp2, and downregulation of phase I and II metabolizing enzymes have been described. There is also some regulation through internalization of Bsep and/or Mrp2 from the canalicular membrane to intracellular vesicles.106,107 However, the key factor appears to be translational regulation resulting in reduced mRNA transcription and hence protein synthesis. Interestingly, signal transduction of inflammatory cytokines targets regulatory transcription factors (e.g. through phosphorylation or decreased binding of nuclear transcription factors) resulting in reduced nuclear quantities and function of these nuclear receptors. This has, for example, been demonstrated for RXRα, an important heterodimerization partner for numerous nuclear receptors such as FXR, RXR, PXR and CAR, in response to LPS or IL-1β treatment.108–110
So far, only a few studies have investigated the effects of inflammation-induced cholestasis in human disease. In PBC and PSC, cholestasis develops with a substantial inflammatory component; decreased expression of NTCP, OATP1B1, MRP2, and BSEP have been reported, whereas MRP3, MRP4, and OSTα/β expression were increased.30,32,111 Furthermore, in patients with advanced stage PBC, the canalicular localization of MRP2 was disrupted and the expression of the uptake transporters, OATP1B1, OATP1B3, and NTCP was decreased.112 In another study, an increase in the severity of inflammation and the fibrosis score in patients with viral hepatitis was associated with decreased hepatic MRP2, MDR1, and OATP1B1, but not MRP3, mRNA expression.113
ASSESSMENT OF PHYSICOCHEMICAL PROPERTIES AND PHARMACOKINETIC PARAMETERS OF DRUGS WITH DIFFERENT MECHANISMS OF CHOLESTASIS
In previous sections, direct and indirect mechanisms of drug-induced cholestasis mediated by interruption of bile acid homeostasis were reviewed. Since multiple processes are involved in bile acid homeostasis, an accurate prediction of the cholestatic potential of drugs mediated by these pathways is not straightforward. Several studies have investigated risk factors for the development of drug-induced pharmacokinetic parameters.59,60 In this type of analysis, it is critical to establish well-defined phenotypes (i.e. cholestasis). In general, there are two major mechanisms of drug-induced cholestasis: (1) impaired formation of bile due to drugs that interact with bile acid formation and/or hepatic bile acid transport (hepatic cholestasis), and (2) physical obstruction of bile flow after bile has been secreted from hepatocytes, which might be caused by drugs that damage the bile duct itself (ductular/ductal cholestasis). If cholestatic drugs with different mechanisms of cholestasis are all considered as one group, it may confound the study results and lead to inaccurate predictions of cholestatic potential. In the present investigation, we compared the physicochemical properties and pharmacokinetic parameters of 77 cholestatic drugs. The compounds selected for investigation included 50 drugs reported to cause cholestasis due to impaired bile acid formation (bland cholestasis or cholestatic hepatitis; classified into Group 1) and 27 drugs reported to cause cholestasis by obstruction of bile flow (classified into Group 2) (Table 1). 6,114–117 Eleven drugs, including glyburide and carbamazepine, were reported to cause both impaired bile formation and obstruction of bile flow; these drugs were classified into Group 3 (“Mixed Cholestasis”; Table 1), and were not included in the statistical analysis.6,114–117
Table 1.
Physicochemical and pharmacokinetic properties of drugs with different mechanisms of cholestasis.
| Drug | MW | logPa | logSa | PPBa (%) |
Cmaxb (μg/ml) |
Cmax,uc (uM) |
Std Daily Dosed, e (mg /day) |
Max Daily Dosed (mg/ day) |
Meta- bolismf |
Renal Excre- tionf |
Fecal/ biliary Excre- tionf |
BDD -CSg |
BSEP Inhibi- tionh |
IC50 for BSEP Inhibi- tion (μM) |
|---|---|---|---|---|---|---|---|---|---|---|---|---|---|---|
|
Group 1: Impaired Formation of Bile (n=50)
| ||||||||||||||
| 6-Mercapto-purine | 152.2 | −0.4 | −1.3 | 19.0 | 0.073 | 0.39 | 225 | 350 | H | I | L | 2 | - | - |
| Acitretin | 326.5 | 6.4 | −6.7 | 99.0 | 0.42 | 0.013 | 37.5 | 75 | I | I | I | 2 | Y | 1860 |
| Atorvastatin | 540.7 | 5.7 | −7.4 | 98.5 | 0.019 | 0.00053 | 45 | 80 | H | L | H | 2 | - | - |
| Azithromycin | 749.1 | 4.0 | −1.3 | 28.5 | 0.40 | 0.38 | 875 | 1500 | I | L | H | 3 | N | >1000121 |
| Bupropion | 239.8 | 3.6 | −2.9 | 84.0 | 0.14 | 0.093 | 300 | 450 | H | H | L | 1 | N | >1000121 |
| Captopril | 217.3 | 0.3 | −0.1 | 27.5 | 0.93 | 3.1 | 234 | 450 | I | H | L | 3 | - | - |
| Celecoxib | 381.4 | 3.9 | −4.9 | 97.0 | 1.2 | 0.091 | 400 | 600 | H | I | I | 2 | - | - |
| Cephalexin | 347.4 | −0.7 | −1.5 | 12.5 | 32 | 81 | 2500 | 4000 | L | H | L | 3 | - | - |
| Cetirizine | 388.9 | 1.7 | −3.6 | 93.0 | 0.31 | 0.056 | 7.5 | 10 | L | H | L | 3 | - | - |
| Chlorambucil | 304.2 | 3.3 | −1.4 | 99.0 | 492 | 16 | 15.0 | 28 | H | I | L | 1 | - | - |
| Clarithro-mycin | 748.1 | 3.2 | −2.6 | 50.5 | 3.7 | 2.4 | 1000 | 1500 | H | I | L | 3 | Y | <13121 |
| Cyclosporine | 1202.8 | 3.0 | −5.2 | 93.7 | 0.93 | 0.049 | 525 | 1260 | H | L | H | 2 | Y | 0.3–1059,60,121,150–152 |
| Danazol | 337.5 | 0.5 | −5.6 | 96.2* | 0.025 | 0.0028 | 450 | 800 | H | L | I | 2 | Y | <10121 |
| Dapsone | 248.3 | 1.0 | −3.1 | 75.3 | 0.93 | 0.93 | 175 | 300 | H | H | L | 2 | N | >100060,121 |
| Dextro-methorphan | 271.4 | 3.6 | −1.3 | 74.8* | 0.0077 | 0.0071 | 120 | 180 | H | H | L | 1 | - | - |
| Dicloxacillin | 470.4 | 2.9 | −5.1 | 96.9 | 91 | 6.0 | 1750 | 2000 | L | I | I | 3 | Y | <10121, 7060 |
| Fenofibrate | 360.9 | 5.3 | −5.7 | 99.0 | 4.4 | 0.12 | 100 | 160 | I | I | L | 2 | Y | 1559 |
| Fosinopril | 563.7 | 6.3 | −4.4 | 94.4 | 0.37 | 0.037 | 22.5 | 40 | I | I | I | 2 | Y | <13121 |
| Gabapentin | 171.3 | −1.1 | −1.2 | 1.5 | 2.5 | 14 | 2700 | 3600 | L | H | L | 3 | N | >1000121 |
| Gemcitabine | 263.2 | −1.4 | −1.2 | 6.4 | 7.0 | 25 | 1912.5 | 2125 | H | H | L | 1 | - | - |
| Glimepiride | 490.7 | 3.5 | −5.6 | 99.5 | 0.55 | 0.0056 | 4.5 | 8 | I | I | I | 2 | Y | <10121,1659 |
| Griseofulvin | 352.8 | 2.2 | −4.6 | 83.8* | 1.6 | 0.73 | 540 | 750 | H | I | I | 2 | - | - |
| Hydrochloro-thiazides | 297.8 | −0.1 | −2.7 | 67.9 | 0.49 | 0.53 | 56.25 | 100 | L | H | L | 3 | - | - |
| Isoniazid | 137.2 | −0.8 | 0.0 | 5.0 | 11 | 73 | 300 | 300 | H | H | L | 1 | N | >100060,121 |
| Itraconazole | 705.7 | 5.7 | −8.9 | 99.0 | 2.0 | 0.028 | 450 | 800 | H | I | L | 2 | Y | 1859 |
| Ketoconazole | 531.5 | 4.4 | −4.9 | 99.0 | 3.5 | 0.066 | 700 | 1200 | I | L | I | 2 | Y | 2.9–6559,60,121,153 |
| Loracarbef | 349.8 | 0.5 | −0.9 | 25.0 | 13 | 27 | 500 | 800 | L | H | L | 3 | - | - |
| Mesalamine | 153.2 | 1.2 | −2.2 | 43.0 | 5.0 | 19 | 3600 | 4800 | H | L | H | 2 | N | 381121 |
| Metformin | 129.2 | −0.5 | 0.0 | 2.5 | 1.0 | 7.5 | 1250 | 2550 | L | H | L | 3 | N | >1000121 |
| Methimazole | 114.2 | −0.3 | 0.4 | 0.0 | 0.21 | 1.9 | 37.5 | 60 | H | H | L | 1 | N | >100060,121 |
| Methyldopa | 211.2 | 0.4 | −1.3 | 20.0 | 3.1 | 12 | 1750 | 3000 | I | H | L | 3 | N | >100060 |
| Metolazone | 365.9 | 2.5 | −3.8 | 95.0 | 22 | 3.1 | 10.25 | 20 | L | H | L | 4 | - | - |
| Nevirapine | 266.3 | 1.8 | −3.4 | 60.0 | 2.3 | 3.4 | 300 | 400 | H | H | L | 2 | N | 295121 |
| Nifedipine | 346.4 | 2.2 | −4.8 | 96.0 | 0.094 | 0.011 | 45 | 180 | H | H | L | 2 | Y | 19–4060,121,154 |
| Nitro- furantoin | 238.2 | −0.1 | −3.1 | 60.0 | 0.50 | 0.84 | 300 | 400 | I | I | L | 4 | N | >100060,121 |
| Norfloxacin | 319.4 | −1.0 | −2.6 | 12.5 | 2.4 | 6.6 | 800 | 800 | L | I | L | 4 | - | - |
| Ofloxacin | 361.4 | −0.4 | −2.0 | 22.5 | 2.8 | 5.9 | 700 | 800 | L | H | L | 3 | N | >1000121 |
| Orlistat | 495.8 | 8.6 | −10.2* | 99.0 | 0.10 | 0.0020 | 270 | 360 | L | L | H | 4 | - | - |
| Oxacillin | 401.5 | 2.4 | −4.5 | 92.0 | 43 | 8.6 | 6750 | 12000 | I | H | L | 3 | - | - |
| Propafenone | 341.5 | 3.2 | −3.6 | 96.0 | 0.00028 | 0.000032 | 675 | 900 | H | I | I | 2 | Y | 54121 |
| Propyl-thiouracil | 170.3 | 0.4 | −2.2 | 80.0 | 6.5 | 7.6 | 500 | 900 | H | I | L | 1 | - | - |
| Repaglinide | 452.7 | 5.9 | −5.9* | 98.0 | 0.051 | 0.0023 | 8.5 | 16 | H | L | H | 2 | - | - |
| Risperidone | 410.5 | 3.0 | −3.2 | 89.0 | 0.033 | 0.0088 | 8.5 | 16 | H | H | L | 1 | Y | <10121 |
| Rofecoxib | 314.4 | 3.2 | −3.5 | 87.0 | 0.32 | 0.13 | 31.25 | 50 | H | H | L | 2 | Y | 95121 |
| Rosiglitazone | 357.5 | 2.4 | −4.0 | 99.8 | 0.37 | 0.0021 | 4 | 8 | I | I | L | 1 | Y | 4.4–6.456,57,118 |
| Roxithro-mycin | 837.2 | 2.8 | −3.9 | 86.0 | 12 | 2.0 | 387.5 | 600 | I | L | I | 4 | - | - |
| Tamoxifen | 371.6 | 7.1 | −6.3 | 99.0 | 0.060 | 0.0016 | 30 | 40 | H | L | I | 1 | Y | 10–23121,150,153 |
| Ticlopidine | 263.8 | 2.9 | 0.0 | 98.0 | 2.1 | 0.16 | 500 | 500 | I | I | L | 1 | Y | 27–7460,121 |
| Troglitazone | 441.6 | 3.6 | −5.9* | 99.0 | 2.8 | 0.064 | 400 | 600 | H | L | H | 4 | Y | 4–66121,153,154 |
| Warfarin | 308.4 | 2.6 | −4.2 | 99.5 | 1.5 | 0.026 | 6 | 10 | H | H | L | 2 | Y | 115121 |
|
| ||||||||||||||
|
Group 2: Obstruction of Bile Flow (n=27)
| ||||||||||||||
| Ajmaline | 326.5 | 1.8 | −2.8 | 46.0 | 1.5 | 2.4 | 42.5 | 50 | H | L | H | 1.5 | - | - |
| Allopurinol | 136.1 | −0.6 | −2.4 | 0.5 | 1.9 | 14 | 450 | 800 | H | H | L | 2 | - | - |
| Amineptine | 337.5 | 5.1* | −4.7* | 95.3* | 0.77 | 0.11 | 150 | 200 | - | H | L | - | - | - |
| Amitriptyline | 277.4 | 4.9 | −4.5 | 94.8 | 0.029 | 0.0054 | 187.5 | 300 | H | I | L | 1 | - | - |
| Ampicillin | 349.5 | 1.4 | −1.7 | 24.0 | 107 | 232 | 6500 | 12000 | L | H | L | 3 | - | - |
| Carmustine | 214.1 | 1.5 | −1.8 | 80.0 | 1.7 | 1.6 | 297.5 | 340 | I | I | L | 1 | N.D. | 97121, >100060 |
| Chloro-thiazide | 295.8 | −0.2 | −2.8 | 50.0 | 0.50 | 0.85 | 750 | 1000 | L | H | L | 4 | - | - |
| Cimetidine | 252.4 | 0.4 | −1.6 | 17.5 | 1.1 | 3.7 | 800 | 1600 | I | I | L | 3 | N | >1000121,153 |
| Ciprofloxacin | 331.4 | 0.3 | −3.3 | 30.0 | 3.8 | 8.0 | 1000 | 1500 | I | H | L | 4 | N | >1000121 |
| Clindamycin | 425.1 | 2.2 | −1.1 | 93.0 | 4.5 | 0.73 | 1600 | 2600 | H | L | H | 1 | - | - |
| Cromolyn | 468.4 | 1.9 | −0.4 | 69.5 | 0.0092 | 0.0060 | 440 | 800 | L | L | H | 3 | N | >100057,118 |
| Cypro-heptadine | 287.4 | 4.7 | −1.9 | 90.1* | 30 | 10 | 12 | 20 | H | I | I | 1 | - | - |
| Diazepam | 284.8 | 2.8 | −3.7 | 96.8 | 0.17 | 0.019 | 22 | 40 | H | H | L | 1 | - | - |
| D- penicillamine | 149.2 | −1.8 | −0.1 | 80.6 | 5.6 | 7.3 | 187.5 | 4000 | L | H | L | 3 | N | >100060 |
| Floxuridine | 246.2 | −1.4 | −1.3 | 7.7* | 3.3 | 12 | 24.5 | 42 | H | L | L | - | - | - |
| Haloperidol | 375.9 | 4.3 | −4.0 | 92.0 | 0.020 | 0.0043 | 1.25 | 15 | H | H | L | 2 | Y | 23121 |
| Ibuprofen | 206.3 | 4.0 | −3.7 | 99.0 | 57 | 2.8 | 1000 | 3200 | H | H | L | 2 | N | >790121,154, 59960 |
| Imipramine | 280.5 | 4.8 | −4.2 | 92.0 | 0.025 | 0.0070 | 162.5 | 300 | H | H | L | 1 | - | - |
| Methyl-testosterone | 302.5 | 3.5* | −4.8* | 98.0 | 0.032 | 0.0021 | 30 | 50 | H | H | L | 2 | - | - |
| Phenyl-butazone | 308.4 | 3.2 | −2.6 | 98.5 | 150 | 7.3 | 450 | 600 | I | I | L | 1 | - | - |
| Phenytoin | 252.3 | 2.5 | −4.1 | 90.0* | 5.5 | 2.2 | 450 | 600 | H | L | H | 2 | - | - |
| Prochlor-perazine | 374.0 | 4.9 | −3.6 | 95.2* | 0.0040 | 0.00051 | 27.5 | 40 | H | L | H | 1 | Y | <10121 |
| Tenoxicam | 337.4 | 1.9 | −2.6 | 98.5 | 2.0 | 0.089 | 30 | 40 | I | I | L | 1 | - | - |
| Tetracycline | 444.5 | −1.3 | −2.4 | 65.0 | 9.3 | 7.3 | 1125 | 2000 | L | I | L | 3 | N | >1000121 |
| Thiaben-dazole | 201.3 | 2.5 | −3.6 | 74.6* | 5.0 | 6.3 | 3000 | 3000 | H | H | L | 2 | N | 560121 |
| Tolbutamide | 270.4 | 2.3 | −3.4 | 96.0 | 100 | 14.8 | 1125 | 3000 | H | H | L | 2 | N | >100057,118 |
| Troleando-mycin | 814.1 | 4.2* | −5.7* | 61.6* | 2.0 | 0.94 | 1500 | 2000 | - | I | L | - | - | - |
|
| ||||||||||||||
|
Group 3: Mixed Cholestasis (n=11)
| ||||||||||||||
| Azathioprine | 277.3 | 0.1 | −1.4 | 30.0 | 1.0 | 2.5 | 192.5 | 350 | H | H | L | 1 | N | >100057,118 |
| Carbama-zapine | 236.3 | 2.5 | −3.0 | 74.0 | 12 | 13 | 1000 | 1600 | H | H | L | 2 | N | >1000121 |
| Chlor-promazine | 318.9 | 5.4 | −5.0 | 97.5 | 0.30 | 0.024 | 400 | 2000 | H | I | L | 1 | N.D. | 31–91121,153, 14860 |
| Chlor-propamide | 276.8 | 1.9 | −2.1 | 92.0 | 150 | 43 | 300 | 750 | L | H | L | 0 | N | >100057,118 |
| Erythromycin | 734.1 | 3.1 | −2.5 | 60.0 | 1.3 | 0.72 | 1000 | 1000 | L | L | H | 3 | N.D. | >983121, 4.1–1359,60 |
| Estradiol | 272.4 | 4.0 | −3.5 | 93.5* | 0.000043 | 0.00001 | 15.5 | 30 | H | H | L | 1 | - | - |
| Flucloxacillin | 453.9 | 2.6 | −5.8* | 94.0 | 8.0 | 1.1 | 3500 | 6000 | L | H | L | 4 | N.D. | <10121, 20960 |
| Glyburide | 494.1 | 4.7 | −5.1 | 99.0 | 0.22 | 0.0045 | 10.6 | 20 | H | I | I | 2 | Y | 5.3–6057,118,152–154 |
| Pioglitazone | 356.5 | 2.3 | −4.6* | 99.0 | 1.1 | 0.029 | 22.5 | 45 | H | L | H | 2 | Y | 0.356,57,118 |
| Propoxy-phene | 339.5 | 4.2 | −4.3 | 78.0 | 0.085 | 0.055 | 325 | 390 | H | L | H | 2 | - | - |
| Terbinafine | 291.5 | 6.0 | −6.4* | 99.0 | 1.0 | 0.034 | 625 | 1000 | H | H | L | 2 | - | - |
MW, molecular weight; PPB, plasma protein binding; BDDCS, biopharmaceutics drug disposition classification system;
Obtained from Dragon Ver.5.5, measured data if not stated otherwise (*calculated).
Retrieved from Thompson’s Micromedex DRUGDEX index and Lexicomp database if not stated otherwise.
Calculated using Cmax, MW, and PPB.
Retrieved from Thompson’s Micromedex DRUGDEX index and Lexicomp database. Administered orally if not stated otherwise.
If a dose range was recommended (e.g. for different indications), the average of minimum and maximum recommended daily dose was calculated. If dosing was given as mg/kg or mg/m2, the maximum and average doses were calculated based on a 70 kg adult with a body surface area of 1.7.
The extent of metabolism, renal excretion, and fecal/biliary excretion. H, High (≥70%); I, Intermediate (≥30% and <70%); L, Low (<30%). Retrieved from Thompson’s Micromedex DRUGDEX index and Lexicomp database if not stated otherwise.
Class 1, high solubility/extensive metabolism; class 2, low solubility/extensive metabolism; class 3, high solubility/poor metabolism; class 4, low solubility/poor metabolism.
Drugs with IC50 < 133 μM are defined as BSEP inhibitors.59
N.D: Inhibitory effects of chlorpromazine, erythromycin, flucloxacillin, and carmustin were not determined because reported IC50 values of these drugs spanned the cutoff value of 133 μM.
Relationship between Mechanism of Cholestasis and Physicochemical Properties of Drugs
To explore the relationship between the mechanism of cholestasis and physicochemical properties, we compared the molecular weight, lipophilicity, and solubility of the Group 1 and Group 2 cholestatic drugs. The physicochemical properties of the investigated compounds are summarized in Table 1; if experimentally determined logP and logS values were not available, then they were obtained from Dragon Ver.5.5 (Talete SRL, Milano, Italy). The molecular weight distribution of these compounds ranged from 114.2 to 1202.8 g/ml. The median (range) molecular weights for Group 1 and Group 2 cholestatic drugs were 346.9 (114.2 – 1202.8) and 295.8 (136.1 – 814.1) g/mol, respectively. The log P value, which is an indicator of lipophilicity, varied from −1.8 to 8.6, with median (range) values of 2.6 (−1.4 – 8.6) and 2.3 (−1.8 – 5.1) for Group 1 and Group 2, respectively. The solubility, indicated by logS, ranged from −10.2 to 0.4, with median (range) values of −3.5 (−10.2 – 0.4) and −2.8 (−5.7 – −0.1) for Group 1 and Group 2, respectively. There were no statistically significant differences between drugs from these two different cholestatic groups with regard to any of the physicochemical properties discussed above.
Relationship between Mechanism of Cholestasis and Plasma Concentrations of Drugs
To explore the relationship between the mechanism of cholestasis and systemic exposure, we investigated the maximum plasma concentrations (Cmax), maximum unbound plasma concentrations (Cmax,u), and standard and maximum daily doses of the cholestatic drugs in humans. Information about Cmax, standard and maximum daily doses were retrieved from Thompson’s Micromedex DRUGDEX index, Lexicomp database, and PubMed. The Cmax,u was calculated for each drug using the Cmax and experimentally determined plasma protein binding values available from published sources. If protein binding data were not available, estimated values were used118; estimated and experimentally determined protein binding values were comparable for the drugs with available protein binding data. The Cmax distribution ranged from 0.00004 to 492 μg/ml (Table 1). The median (range) Cmax values for Group 1 and Group 2 cholestatic drugs were 1.1 (0.00028 – 492) and 2.0 (0.004 – 150) μg/ml, respectively. Cmax,u values ranged from 0.00001 to 231.6 μM (Table 1), with median (range) values of 0.4 (0.00003 – 80.6) and 2.2 (0.0005 – 231.6) μM for Group 1 and Group 2, respectively. Plasma protein binding ranged from 0 to 99.8 %; median (range) values were 88 (0 – 99.8) and 90 (0.5 – 99) for Group 1 and Group 2, respectively. The median standard daily doses were 300 (4 – 6750) and 440 (1.3 – 6500) mg/day, whereas the maximum daily doses were 450 (8 – 12000) and 600 (15 – 12000) mg/day for Group 1 and Group 2, respectively. There were no significant differences in Cmax, Cmax,u, plasma protein binding, standard daily doses or maximum daily doses between the two groups of cholestatic drugs, indicating that these values, by themselves, were not predictive of the mechanism of cholestasis.
Relationship between Mechanism of Cholestasis and the Metabolism and Excretion of Drugs
To explore the relationship between the mechanism of cholestasis and drug disposition, we investigated the extent of metabolism, renal excretion and biliary excretion of cholestatic drugs. Drugs were categorized as high, intermediate or low, if the extent of metabolism/excretion was ≥ 70%, between 30% and 70%, and < 30%, respectively. The relationship between the mechanism of cholestasis and the biopharmaceutics drug disposition classification system (BDDCS) class also was investigated. The BDDCS categorizes drugs into four classes; class 1 represents drugs with high solubility and extensive metabolism, whereas class 2 drugs have low solubility and extensive metabolism. Drugs with high solubility and poor metabolism are categorized into class 3, and class 4 is composed of drugs with low solubility and poor metabolism.119 Information on metabolism, the routes of excretion, BDDCS class, and clinical parameters were retrieved from Thompson’s Micromedex DRUGDEX index, Lexicomp database, PubMed, and WOMBAT-PK 2007,120 and are presented in Table 1. Among the 50 cholestatic drugs categorized in Group 1, 26 (52%) drugs were classified as high with respect to the extent of metabolism. Among 27 cholestatic drugs categorized in Group 2, information about metabolism was available for 25 drugs; 60% (15 out of 25) of these were extensively metabolized. Drugs with high renal excretion accounted for 44% (22 out of 50) of Group 1 cholestatic drugs and 48% (13 out of 27) of Group 2 cholestatic drugs. 14% (7 out of 50) of Group 1 and 19% (5 out of 27) of Group 2 cholestatic drugs were excreted extensively into bile (≥70%). However, the classification of cholestatic drugs (Group 1 vs. 2) was not associated with the extent of metabolism or the extent of renal or biliary excretion when examined using the chi-square test (Table 2). Cholestatic drugs were categorized evenly as BDDCS class 1 – 3, with fewer drugs in BDDCS class 4. This is consistent with the previous report that only a small number of the approved drugs are categorized as BDDCS class 4.119 There was no significant association between BDDCS class and the type of cholestasis when examined using the chi-square test (Table 2).
Table 2. Relationship between mechanism of cholestasis (impaired formation of bile and obstruction of bile flow) and the extent of metabolism and excretion, BDDCS, and BSEP inhibition for 77 cholestatic compounds.
Drugs with no information were excluded from the analysis. P-values from chi-square tests are presented.
| Metabolism (n=75)a
| |||
|---|---|---|---|
| Group 1 (Impaired formation of bile) | Group 2 (Obstruction of bile flow) | P-value | |
| High | 26 | 15 | 0.7881 |
| Intermediate | 13 | 5 | |
| Low | 11 | 5 | |
| Renal Excretion (n=77)a
| |||
|---|---|---|---|
| Group 1 (Impaired formation of bile) | Group 2 (Obstruction of bile flow) | P-value | |
| High | 22 | 13 | 0.9186 |
| Intermediate | 17 | 8 | |
| Low | 11 | 6 | |
| Biliary Excretion (n=77)a
| |||
|---|---|---|---|
| Group 1 (Impaired formation of bile) | Group 2 (Obstruction of bile flow) | P-value | |
| High | 7 | 5 | 0.1065 |
| Intermediate | 11 | 1 | |
| Low | 32 | 21 | |
| BDDCS (n=73)b
| |||
|---|---|---|---|
| Group 1 (Impaired formation of bile) | Group 2 (Obstruction of bile flow) | P-value | |
| Class I | 11 | 9 | 0.503 |
| Class II | 20 | 7 | |
| Class III | 13 | 5 | |
| Class IV | 6 | 2 | |
| BSEP Inhibition (n=41)c
| |||
|---|---|---|---|
| Group 1 (Impaired formation of bile) | Group 2 (Obstruction of bile flow) | P-value | |
| Yes | 19 | 2 | 0.023 |
| No | 12 | 8 | |
High (≥70%); Intermediate (≥30% and <70%); Low (<30%)
Class 1, high solubility/extensive metabolism; class 2, low solubility/extensive metabolism; class 3, high solubility/poor metabolism; class 4, low solubility/poor metabolism.
Drugs with IC50 < 133 μM are defined as BSEP inhibitors.
Relationship between Mechanism of Cholestasis and Inhibition of Bile Acid Transport Proteins by Drugs
Inhibition of bile acid transport is one important mechanism of drug-induced cholestasis. Thus, the relationship between the mechanism of cholestasis and the ability of drugs to inhibit bile acid transport was investigated. BSEP is a major transport protein responsible for the biliary excretion of bile acids. Inhibition data for BSEP is relatively abundant compared to inhibition of other bile acid transport proteins based on recent publications describing high-throughput screening approaches to analyze for BSEP inhibition.59,60,121 Information about BSEP inhibition was available for 41 cholestatic drugs (Table 1). Drugs with IC50 values less than 133 μM were defined as BSEP inhibitors as reported previously.59 Chi-square analysis revealed that BSEP inhibitors are more abundant in Group 1 compared to Group 2 cholestatic drugs (61% vs 20%, p=0.023; Table 2); among the 31 Group 1 cholestatic drugs, 19 drugs (61%) were BSEP inhibitors. On the other hand, only 2 out of 10 Group 2 cholestatic drugs were BSEP inhibitors. Although this analysis was performed with only a limited number of drugs, the data suggest that BSEP inhibition might not play a major role in cholestasis that is caused by bile duct obstruction. Inhibition data for other bile acid transporters such as ASBT, NTCP, OATP and MRP4, as well as substrate information on major drug transporters such as OATP, MRP2, BCRP, and P-gp, might be necessary to understand the complex interplay of bile acid homeostasis, the pharmacokinetic behavior of drugs, and direct and indirect regulation of the pathogenesis of different types of cholestasis.
IN SILICO MODELING TO PREDICT DIRECT AND INDIRECT EFFECTS OF DRUGS ON BILE ACID HOMEOSTASIS
Interruption of bile acid homeostasis plays a key role in the development of cholestasis. Therefore, in order to improve the prediction of cholestatic potential, it is important to understand how drugs affect bile acid disposition. However, for a large number of drugs, experimental data documenting an interaction with bile acid transporters are not available; high-throughput screening methods to test the inhibition potential of drugs have not been available until recently.59,60,122 Data regarding drug effects on nuclear receptors involved in bile acid homeostasis are even more scarce because the role of nuclear receptors in bile acid homeostasis has been revealed only recently.123,124 In silico modeling can be used to fill this data gap; existing datasets can be used to build in silico models based on the structural properties of drugs, and these models can be used to predict drug effects on bile acid homeostasis. When large datasets are available and resulting in silico models are well-validated, they can help reduce the financial burden in early drug discovery and development by limiting the need for extensive laboratory experiments. In the following section, in silico models to predict drug effects on bile acid transporters and nuclear receptors such as PXR and FXR are reviewed.
In Silico Modeling to Predict Drug Interactions with Bile Acid Transport Proteins
The 3D structures of membrane transport proteins remain scarce. Thus, current computational transporter studies rely on a series of experimentally measured interactions of small molecules with membrane transporters and employ statistical learning approaches, such as quantitative structure-activity relationship (QSAR) and ligand-based pharmacophore construction. Available computational models of bile acid transporters (i.e., MRP2, MRP3, MRP4, BSEP, NTCP, ASBT, OATPs) are summarized in Table 3. Due to the great heterogeneity of experimental reports (e.g., from diverse assay types, test concentrations and experimental conditions), most of the computational studies present classification models (e.g., inhibitors vs. non-inhibitors). The few available quantitative models (such as for binding affinity or inhibition) usually are limited to small sets of compounds with the measurements from the same source.
Table 3.
Computational models of small molecule interactions with bile acid transporters
| Transporter | Model description | External Accuracya | Data sizeb (train/test) | Reference |
|---|---|---|---|---|
| BSEP | %inhibition at 100μM | R2=0.95 | 37/0 | Saito et al 2009125 |
| BSEP | Classification of inhibitors at 300μM | 87% | 437/187 | Warner et al 2012121 |
|
| ||||
| MRP2 | Binding affinity, Ki | R2=0.82 | 20/5 | Ng et al 2005129 |
| MRP2 | Classification of inhibitors at 80μM | 72% | 79/39 | Pedersen et al 2008126,127 |
| MRP2 | Classification of inhibitors | 74–77% | 257/61 | Zhang et al 2009127 |
| MRP2 | Classification of substrates | 87% | 150/38 | Sedykh et al 2013128 |
| MRP2 | Classification of inhibitors at 10μM | 89% | 77/19 | Sedykh et al 2013128 |
|
| ||||
| MRP3 | Classification of substrates | 98% | 50/12 | Sedykh et al 2013128 |
|
| ||||
| MRP4 | Classification of substrates | 92% | 74/18 | Sedykh et al 2013128 |
| MRP4 | Classification of inhibitors at 10μM | 70% | 51/13 | Sedykh et al 2013128 |
|
| ||||
| ASBT | Binding affinity, Ki | R2=0.73 | 29/1 | Gonzalez et al 2009137 |
| ASBT | Classification of inhibitors at 100μM | 54–88% | 38/19–30 | Zheng et al 2009133 |
| ASBT | Binding affinity, Ki | R2=0.68 | 23/4 | Zheng et al 2010134 |
| ASBT | Binding affinity, Ki | R2=0.89 | 32/1 | Rais et al 2010135,136 |
| Transport constraints, Km/Vmax | R2=0.68 | |||
| ASBT | Classification of substrates | 93% | 80/20 | Sedykh et al 2013128 |
| ASBT | Classification of inhibitors at 10μM | 92% | 120/30 | Sedykh et al 2013128 |
|
| ||||
| NTCP | Ligand-based 3D pharmacophore | 60% | 5/10 | Greupink et al 2012138 |
|
| ||||
| OATP1B1 | Classification of inhibitors at 20μM | 81–93% | 98/48 | Karlgren et al 2012132,155 |
| OATP1B1 | 79% | 134/67 | Karlgren et al 2012132 | |
| OATP1B3 | 92% | 125/62 | Karlgren et al 2012132 | |
| OATP2B1 | 75% | 118/60 | Karlgren et al 2012132 | |
| OATP2B1 | Classification of inhibitors at 100μM | 80% | 109/27 | Sedykh et al 2013128 |
| OATP2B1 | Classification of substrates | 75% | 42/11 | Sedykh et al 2013128 |
Accuracy of the model when evaluated on external data (i.e., data not known to the model)
Number of data points (i.e., distinct molecules) available for modeling
For the canalicular efflux transporters BSEP and MRP2 (Table 3), Warner et al. reported classification of BSEP inhibitors (defined by an IC50 threshold of 300μM) by a recursive partitioning QSAR for over 600 chemicals using molecular descriptors as covariates.121 An earlier study by Saito et al. reported a multiple linear regression model of BSEP inhibition (measured in % of taurocholate transport at 100μM test concentration) for 37 diverse drug-like compounds using chemical fragment descriptors, but this model has not been validated further.125 Several groups reported QSAR models for MRP2 inhibition at various potency thresholds (Table 3) using linear (e.g., PLS – partial least squares regression and discriminant analysis) and non-linear modeling methods (SVM – Support Vector Machine, kNN – k Nearest Neighbors, RF – Random Forest).126–128 The accuracy of these models on external data (judged by test sets) ranged from 70 to 90%. In addition, Ng et al. developed a QSAR model of binding affinity to rat Mrp2 for 25 methotrexate analogues as well as a pharmacophore for their binding model.129 Zhang et al. have constructed a pharmacophore for MRP2 inhibitors, which performed slightly worse than their SVM QSAR model.127
Due to lack of experimental measurements, very few computational studies exist for the basolateral bile acid efflux transporters MRP3 and MRP4 (Table 3). Sedykh et al. reported classification models of MRP4 inhibitors at a 10μM threshold with external accuracy of 70%, however, the modeling was based on a rather small set of 64 molecules.128 In a recent study, Akanuma et al. attempted structural analysis of MRP4 transport for several groups of β-lactam antibiotics.130
For the bile acid uptake transporters, there were appreciably more studies on ASBT and OATPs than on NTCP (Table 3), which reflects the importance of the former to the absorption, distribution, metabolism, excretion and toxicity of pharmaceuticals because they also are expressed in gut and kidney.131 Karlgren et al. reported classification models of OATP1B1, OATP1B3, and OATP2B1inhibitors at a 20μM potency threshold, with expected accuracy of 75–93%.132 Several QSAR models of ASBT binding affinity as well as pharmacophores were developed by Zheng et al., Rais et al., and Gonzalez et al. with squared correlation coefficient (R2) values of 0.68–0.89, albeit all were trained on small congeneric series of conjugated bile acid derivatives.133–137 Sedykh et al. and Zheng et al. reported classification QSARs of ASBT inhibitors based on 10μM and 100μM potency thresholds respectively.128,133 In a recent study, Greupink et al. developed a 3D-pharmacophore model based on five NTCP substrates, which were then applied to screen large chemical libraries. Several NTCP inhibitors were identified among the top selected hits.138
Based on the data presented in Table 3, the small size of the modeling data sets is the major limitation to accurate in silico prediction of drug interactions with bile acid transporters. Conformational flexibility of membrane transporters, their broad substrate specificity, as well as noisiness and limitations of experimental assays all require large and diverse sets of chemical structures for proper statistical learning. Large and diverse modeling sets also are necessary for the broad applicability of the resulting models, so that more structural classes of chemicals can be covered and reliably predicted. Presently, there are too few compounds with experimental data available for MRP3, MRP4 and NTCP transporters. Even though OSTα/β is essential for bile acid transport, adequate data for in silico modeling is not yet available.27
In Silico Models of Drug Interactions with the Nuclear Receptors, FXR and PXR
A number of the resolved 3D protein structures of FXR and PXR are publicly available (e.g., 1OSH, 1OSV for FXR, 3R8D, 2QNV for PXR at www.pdb.org), which allows for application of modeling techniques such as docking and structure-based pharmacophore construction. However, accurate characterization of a drug-protein interaction by structure-based methods can be difficult, which is the case for PXR with its large and flexible pocket leading to promiscuous binding and poor docking results.139,140 Therefore, statistical knowledge-inference methods, such as QSAR, are still applied widely. Currently available computational models of FXR and PXR are reviewed in Table 4. Although stand-alone docking yielded modest results (~60% accuracy), as demonstrated by Khandelwal et al., Kortagere et al., and Ekins et al., docking was used routinely to impute bound conformations of chemicals for the subsequent 3D-QSAR modeling studies.139,141–144 Most of the classification models of PXR agonists have external accuracy in the 70–85% range (Table 4). A few quantitative models for the potency of PXR activation (measured as EC50) also have been reported,139,145 although it is important to note that these do not take into account the extent of activation (i.e., efficacy), which can vary substantially among the agonists.
Table 4.
Computational models of PXR and FXR activation
| Model description | External Accuracya | Data sizeb (train/test) | Reference |
|---|---|---|---|
|
Pregnane X Receptor (PXR)
| |||
| Classification of agonists at 100 μM | 73–87% | 175/15 | Ung et al 2007156 |
| Classification of agonists at 100 μM | 63–67% | 177/145 | Khandelwal et al 2008141 |
| Classification of agonists at 100 μM | 72–81% | 168/130 | Kortagere et al 2009142 |
| Classification of agonists at 10μM | 77% | 95/20 | Ekins et al 2009139 |
| Activation, EC50 | R2=0.45 | ||
| Classification of agonists (0.5nM – 38.3μM) | 82–85% | 316/315 | Dybdahl et al 2012157 |
| Classification of agonists at 100μM | 85% | 405/29 | Matter et al 2012145 |
| 78% | 586/50 | ||
| Activation, EC50 | R2=0.45 | 273/33 | |
|
| |||
|
Farnesoid X Receptor (FXR)
| |||
| Activation by non-steroidal agonists, EC50 | R2=0.76 | 82/20 | Honorio et al 2005143,158 |
| Activation by non-steroidal agonists, EC50 | R2=0.77 | 77/20 | Honorio et al 2007143 |
| Activation by non-steroidal agonists, EC50 | R2=0.93 | 58/10 | Zhang et al 2007144 |
| Structure-Activity relationship analysis | - | 50/0 | Genet et al 2010159 |
| Classification of agonists at 100μM by structure-based pharmacophores | 73% | −/221 | Shuster et al 2011146 |
| Grienke et al 2011147 | |||
Accuracy of the model when evaluated on external data (i.e., data not known to the model)
Number of data points (i.e., distinct molecules) available for modeling
Relatively few in silico studies are available for FXR activation, likely due to the limited availability of experimental data. Several quantitative models of FXR activation (Table 4) achieve correlations in the 0.76–0.93 range (square of Pearson’s correlation coefficient), albeit on rather small data sets. Recent studies by Shuster and Grinke employed a set of pharmacophores for classification of FXR agonists with accuracy of ~70%.146,147 While diverse models for PXR activation currently are available (e.g., see the recent review by Kortagere et al.140) and further improvements are likely to be incremental, in the case of FXR, new models based on larger data samples definitely are needed for reliable use in drug design and risk assessment.
CONCLUSIONS AND FUTURE DIRECTIONS
Disruption of bile acid homeostasis is an important mechanism of drug-induced cholestasis. In order to accurately predict the cholestatic potential of drugs, an understanding of the molecule’s effects on the many processes involved in bile acid homeostasis appears to be necessary. In silico modeling, which will diminish the time and resources required for laboratory experiments, is a promising approach to obtain this mechanistic information. Drugs may inhibit bile acid transporters directly, or alter the expression, function and/or localization of transporters by indirect interactions mediated by nuclear receptors and intracellular signaling pathways. In addition, patient-specific factors including genetic polymorphisms, underlying disease, and pregnancy may alter the function of bile acid transporters and predispose individuals to cholestasis. These data can be integrated and incorporated into mechanistic, mathematical models to improve predictions. Multi-scale modeling approaches incorporating both drug disposition and physiological processes (i.e. systems biology) is an exciting, emerging area. Recent efforts using mechanistic, mathematical modeling approaches have successfully predicted the hepatotoxicity induced by drugs such as acetaminophen and methapyrilene.148,149 The same approach can be taken to predict drug-induced cholestatic injury, thereby allowing more accurate predictions during the early stages of drug development.
Acknowledgments
The research reported in this publication was supported by the National Institute of General Medical Sciences of the National Institutes of Health under award number R01 GM041935 [K.L.R.B], and by Deutsche Forschungsgemeinschaft under award number DFG Ko4186/1-1 [K.K.].
Footnotes
The content is solely the responsibility of the authors and does not necessarily represent the official views of the National Institutes of Health.
References
- 1.Lee WM. Drug-induced hepatotoxicity. N Engl J Med. 2003;349(5):474–485. doi: 10.1056/NEJMra021844. [DOI] [PubMed] [Google Scholar]
- 2.Benichou C. Criteria of drug-induced liver disorders. Report of an international consensus meeting. J Hepatol. 1990;11(2):272–276. doi: 10.1016/0168-8278(90)90124-a. [DOI] [PubMed] [Google Scholar]
- 3.Bjornsson E, Olsson R. Outcome and prognostic markers in severe drug-induced liver disease. Hepatology. 2005;42(2):481–489. doi: 10.1002/hep.20800. [DOI] [PubMed] [Google Scholar]
- 4.Friis H, Andreasen PB. Drug-induced hepatic injury: an analysis of 1100 cases reported to the Danish Committee on Adverse Drug Reactions between 1978 and 1987. J Intern Med. 1992;232(2):133–138. doi: 10.1111/j.1365-2796.1992.tb00562.x. [DOI] [PubMed] [Google Scholar]
- 5.Lewis JH. Drug-induced liver disease. Med Clin North Am. 2000;84(5):1275–1311. x. doi: 10.1016/s0025-7125(05)70287-x. [DOI] [PubMed] [Google Scholar]
- 6.Padda MS, Sanchez M, Akhtar AJ, Boyer JL. Drug-induced cholestasis. Hepatology. 2011;53(4):1377–1387. doi: 10.1002/hep.24229. [DOI] [PMC free article] [PubMed] [Google Scholar]
- 7.Viteri AL, Greene JF, Jr, Dyck WP. Erythromycin ethylsuccinate-induced cholestasis. Gastroenterology. 1979;76(5 Pt 1):1007–1008. [PubMed] [Google Scholar]
- 8.Moradpour D, Altorfer J, Flury R, Greminger P, Meyenberger C, Jost R, Schmid M. Chlorpromazine-induced vanishing bile duct syndrome leading to biliary cirrhosis. Hepatology. 1994;20(6):1437–1441. doi: 10.1002/hep.1840200610. [DOI] [PubMed] [Google Scholar]
- 9.Erlinger S. Drug-induced cholestasis. J Hepatol. 1997;26(Suppl 1):1–4. doi: 10.1016/s0168-8278(97)82326-4. [DOI] [PubMed] [Google Scholar]
- 10.Geubel AP, Sempoux C, Rahier J. Bile duct disorders. Clin Liver Dis. 2003;7(2):295–309. doi: 10.1016/s1089-3261(03)00028-x. [DOI] [PubMed] [Google Scholar]
- 11.Russell DW. The enzymes, regulation, and genetics of bile acid synthesis. Annu Rev Biochem. 2003;72:137–174. doi: 10.1146/annurev.biochem.72.121801.161712. [DOI] [PubMed] [Google Scholar]
- 12.Norlin M, Wikvall K. Enzymes in the conversion of cholesterol into bile acids. Curr Mol Med. 2007;7(2):199–218. doi: 10.2174/156652407780059168. [DOI] [PubMed] [Google Scholar]
- 13.Chiang JY. Bile acids: regulation of synthesis. J Lipid Res. 2009;50(10):1955–1966. doi: 10.1194/jlr.R900010-JLR200. [DOI] [PMC free article] [PubMed] [Google Scholar]
- 14.Hofmann AF. In The Liver: Biology and pathobiology. New York: Raven Press Limited; 1994. Bile Acids. [Google Scholar]
- 15.Reichen J, Paumgartner G. Uptake of bile acids by perfused rat liver. Am J Physiol. 1976;231(3):734–742. doi: 10.1152/ajplegacy.1976.231.3.734. [DOI] [PubMed] [Google Scholar]
- 16.Van Dyke RW, Stephens JE, Scharschmidt BF. Bile acid transport in cultured rat hepatocytes. Am J Physiol. 1982;243(6):G484–492. doi: 10.1152/ajpgi.1982.243.6.G484. [DOI] [PubMed] [Google Scholar]
- 17.Kouzuki H, Suzuki H, Ito K, Ohashi R, Sugiyama Y. Contribution of sodium taurocholate co-transporting polypeptide to the uptake of its possible substrates into rat hepatocytes. J Pharmacol Exp Ther. 1998;286(2):1043–1050. [PubMed] [Google Scholar]
- 18.Marion TL, Perry CH, St Claire RL, 3rd, Yue W, Brouwer KL. Differential disposition of chenodeoxycholic acid versus taurocholic acid in response to acute troglitazone exposure in rat hepatocytes. Toxicol Sci. 2011;120(2):371–380. doi: 10.1093/toxsci/kfr014. [DOI] [PMC free article] [PubMed] [Google Scholar]
- 19.Agellon LB, Torchia EC. Intracellular transport of bile acids. Biochim Biophys Acta. 2000;1486(1):198–209. doi: 10.1016/s1388-1981(00)00057-3. [DOI] [PubMed] [Google Scholar]
- 20.El-Seaidy AZ, Mills CO, Elias E, Crawford JM. Lack of evidence for vesicle trafficking of fluorescent bile salts in rat hepatocyte couplets. Am J Physiol. 1997;272(2 Pt 1):G298–309. doi: 10.1152/ajpgi.1997.272.2.G298. [DOI] [PubMed] [Google Scholar]
- 21.Pauli-Magnus C, Meier PJ. Hepatobiliary transporters and drug-induced cholestasis. Hepatology. 2006;44(4):778–787. doi: 10.1002/hep.21359. [DOI] [PubMed] [Google Scholar]
- 22.Rost D, Konig J, Weiss G, Klar E, Stremmel W, Keppler D. Expression and localization of the multidrug resistance proteins MRP2 and MRP3 in human gallbladder epithelia. Gastroenterology. 2001;121(5):1203–1208. doi: 10.1053/gast.2001.28648. [DOI] [PubMed] [Google Scholar]
- 23.Ballatori N, Christian WV, Lee JY, Dawson PA, Soroka CJ, Boyer JL, Madejczyk MS, Li N. OSTalpha-OSTbeta: a major basolateral bile acid and steroid transporter in human intestinal, renal, and biliary epithelia. Hepatology. 2005;42(6):1270–1279. doi: 10.1002/hep.20961. [DOI] [PubMed] [Google Scholar]
- 24.Akita H, Suzuki H, Hirohashi T, Takikawa H, Sugiyama Y. Transport activity of human MRP3 expressed in Sf9 cells: comparative studies with rat MRP3. Pharm Res. 2002;19(1):34–41. doi: 10.1023/a:1013699130991. [DOI] [PubMed] [Google Scholar]
- 25.Rius M, Hummel-Eisenbeiss J, Hofmann AF, Keppler D. Substrate specificity of human ABCC4 (MRP4)-mediated cotransport of bile acids and reduced glutathione. Am J Physiol Gastrointest Liver Physiol. 2006;290(4):G640–649. doi: 10.1152/ajpgi.00354.2005. [DOI] [PubMed] [Google Scholar]
- 26.Ballatori N. Biology of a novel organic solute and steroid transporter, OSTalpha-OSTbeta. Exp Biol Med (Maywood) 2005;230(10):689–698. doi: 10.1177/153537020523001001. [DOI] [PubMed] [Google Scholar]
- 27.Ballatori N, Li N, Fang F, Boyer JL, Christian WV, Hammond CL. OST alpha-OST beta: a key membrane transporter of bile acids and conjugated steroids. Front Biosci. 2009;14:2829–2844. doi: 10.2741/3416. [DOI] [PMC free article] [PubMed] [Google Scholar]
- 28.Akita H, Suzuki H, Sugiyama Y. Sinusoidal efflux of taurocholate is enhanced in Mrp2-deficient rat liver. Pharm Res. 2001;18(8):1119–1125. doi: 10.1023/a:1010918825019. [DOI] [PubMed] [Google Scholar]
- 29.Trauner M, Wagner M, Fickert P, Zollner G. Molecular regulation of hepatobiliary transport systems: clinical implications for understanding and treating cholestasis. J Clin Gastroenterol. 2005;39(4 Suppl 2):S111–124. doi: 10.1097/01.mcg.0000155551.37266.26. [DOI] [PubMed] [Google Scholar]
- 30.Zollner G, Wagner M, Fickert P, Silbert D, Gumhold J, Zatloukal K, Denk H, Trauner M. Expression of bile acid synthesis and detoxification enzymes and the alternative bile acid efflux pump MRP4 in patients with primary biliary cirrhosis. Liver Int. 2007;27(7):920–929. doi: 10.1111/j.1478-3231.2007.01506.x. [DOI] [PubMed] [Google Scholar]
- 31.Teng S, Piquette-Miller M. Hepatoprotective role of PXR activation and MRP3 in cholic acid-induced cholestasis. Br J Pharmacol. 2007;151(3):367–376. doi: 10.1038/sj.bjp.0707235. [DOI] [PMC free article] [PubMed] [Google Scholar]
- 32.Boyer JL, Trauner M, Mennone A, Soroka CJ, Cai SY, Moustafa T, Zollner G, Lee JY, Ballatori N. Upregulation of a basolateral FXR-dependent bile acid efflux transporter OSTalpha-OSTbeta in cholestasis in humans and rodents. Am J Physiol Gastrointest Liver Physiol. 2006;290(6):G1124–1130. doi: 10.1152/ajpgi.00539.2005. [DOI] [PubMed] [Google Scholar]
- 33.Assem M, Schuetz EG, Leggas M, Sun D, Yasuda K, Reid G, Zelcer N, Adachi M, Strom S, Evans RM, Moore DD, Borst P, Schuetz JD. Interactions between hepatic Mrp4 and Sult2a as revealed by the constitutive androstane receptor and Mrp4 knockout mice. J Biol Chem. 2004;279(21):22250–22257. doi: 10.1074/jbc.M314111200. [DOI] [PubMed] [Google Scholar]
- 34.Alnouti Y. Bile Acid sulfation: a pathway of bile acid elimination and detoxification. Toxicol Sci. 2009;108(2):225–246. doi: 10.1093/toxsci/kfn268. [DOI] [PubMed] [Google Scholar]
- 35.Hofmann AF. The continuing importance of bile acids in liver and intestinal disease. Arch Intern Med. 1999;159(22):2647–2658. doi: 10.1001/archinte.159.22.2647. [DOI] [PubMed] [Google Scholar]
- 36.Dietschy JM. Mechanisms for the intestinal absorption of bile acids. J Lipid Res. 1968;9(3):297–309. [PubMed] [Google Scholar]
- 37.Shneider BL. Intestinal bile acid transport: biology, physiology, and pathophysiology. J Pediatr Gastroenterol Nutr. 2001;32(4):407–417. doi: 10.1097/00005176-200104000-00002. [DOI] [PubMed] [Google Scholar]
- 38.Hagenbuch B, Dawson P. The sodium bile salt cotransport family SLC10. Pflugers Arch. 2004;447(5):566–570. doi: 10.1007/s00424-003-1130-z. [DOI] [PubMed] [Google Scholar]
- 39.Dawson PA, Hubbert M, Haywood J, Craddock AL, Zerangue N, Christian WV, Ballatori N. The heteromeric organic solute transporter alpha-beta, Ostalpha-Ostbeta, is an ileal basolateral bile acid transporter. J Biol Chem. 2005;280(8):6960–6968. doi: 10.1074/jbc.M412752200. [DOI] [PMC free article] [PubMed] [Google Scholar]
- 40.Rao A, Haywood J, Craddock AL, Belinsky MG, Kruh GD, Dawson PA. The organic solute transporter alpha-beta, Ostalpha-Ostbeta, is essential for intestinal bile acid transport and homeostasis. Proc Natl Acad Sci U S A. 2008;105(10):3891–3896. doi: 10.1073/pnas.0712328105. [DOI] [PMC free article] [PubMed] [Google Scholar]
- 41.Trauner M, Boyer JL. Bile salt transporters: molecular characterization, function, and regulation. Physiol Rev. 2003;83(2):633–671. doi: 10.1152/physrev.00027.2002. [DOI] [PubMed] [Google Scholar]
- 42.Ming X, Thakker DR. Role of basolateral efflux transporter MRP4 in the intestinal absorption of the antiviral drug adefovir dipivoxil. Biochem Pharmacol. 2010;79(3):455–462. doi: 10.1016/j.bcp.2009.08.029. [DOI] [PubMed] [Google Scholar]
- 43.Jonker JW, Liddle C, Downes M. FXR and PXR: potential therapeutic targets in cholestasis. J Steroid Biochem Mol Biol. 2012;130(3–5):147–158. doi: 10.1016/j.jsbmb.2011.06.012. [DOI] [PMC free article] [PubMed] [Google Scholar]
- 44.Claudel T, Staels B, Kuipers F. The Farnesoid X receptor: a molecular link between bile acid and lipid and glucose metabolism. Arterioscler Thromb Vasc Biol. 2005;25(10):2020–2030. doi: 10.1161/01.ATV.0000178994.21828.a7. [DOI] [PubMed] [Google Scholar]
- 45.Perez MJ, Briz O. Bile-acid-induced cell injury and protection. World J Gastroenterol. 2009;15(14):1677–1689. doi: 10.3748/wjg.15.1677. [DOI] [PMC free article] [PubMed] [Google Scholar]
- 46.Rodrigues CM, Fan G, Ma X, Kren BT, Steer CJ. A novel role for ursodeoxycholic acid in inhibiting apoptosis by modulating mitochondrial membrane perturbation. J Clin Invest. 1998;101(12):2790–2799. doi: 10.1172/JCI1325. [DOI] [PMC free article] [PubMed] [Google Scholar]
- 47.Roberts LR, Kurosawa H, Bronk SF, Fesmier PJ, Agellon LB, Leung WY, Mao F, Gores GJ. Cathepsin B contributes to bile salt-induced apoptosis of rat hepatocytes. Gastroenterology. 1997;113(5):1714–1726. doi: 10.1053/gast.1997.v113.pm9352877. [DOI] [PubMed] [Google Scholar]
- 48.Fickert P, Fuchsbichler A, Marschall HU, Wagner M, Zollner G, Krause R, Zatloukal K, Jaeschke H, Denk H, Trauner M. Lithocholic acid feeding induces segmental bile duct obstruction and destructive cholangitis in mice. Am J Pathol. 2006;168(2):410–422. doi: 10.2353/ajpath.2006.050404. [DOI] [PMC free article] [PubMed] [Google Scholar]
- 49.Salvioli G, Lugli R, Pradelli JM, Gigliotti G. Bile acid binding in plasma: the importance of lipoproteins. FEBS Lett. 1985;187(2):272–276. doi: 10.1016/0014-5793(85)81257-6. [DOI] [PubMed] [Google Scholar]
- 50.Davit-Spraul A, Gonzales E, Baussan C, Jacquemin E. Progressive familial intrahepatic cholestasis. Orphanet J Rare Dis. 2009;4:1. doi: 10.1186/1750-1172-4-1. [DOI] [PMC free article] [PubMed] [Google Scholar]
- 51.Dixon PH, van Mil SW, Chambers J, Strautnieks S, Thompson RJ, Lammert F, Kubitz R, Keitel V, Glantz A, Mattsson LA, Marschall HU, Molokhia M, Moore GE, Linton KJ, Williamson C. Contribution of variant alleles of ABCB11 to susceptibility to intrahepatic cholestasis of pregnancy. Gut. 2009;58(4):537–544. doi: 10.1136/gut.2008.159541. [DOI] [PubMed] [Google Scholar]
- 52.Kagawa T, Watanabe N, Mochizuki K, Numari A, Ikeno Y, Itoh J, Tanaka H, Arias IM, Mine T. Phenotypic differences in PFIC2 and BRIC2 correlate with protein stability of mutant Bsep and impaired taurocholate secretion in MDCK II cells. Am J Physiol Gastrointest Liver Physiol. 2008;294(1):G58–67. doi: 10.1152/ajpgi.00367.2007. [DOI] [PubMed] [Google Scholar]
- 53.Lee JK, Paine MF, Brouwer KL. Sulindac and its metabolites inhibit multiple transport proteins in rat and human hepatocytes. J Pharmacol Exp Ther. 2010;334(2):410–418. doi: 10.1124/jpet.110.165852. [DOI] [PMC free article] [PubMed] [Google Scholar]
- 54.Fattinger K, Funk C, Pantze M, Weber C, Reichen J, Stieger B, Meier PJ. The endothelin antagonist bosentan inhibits the canalicular bile salt export pump: a potential mechanism for hepatic adverse reactions. Clin Pharmacol Ther. 2001;69(4):223–231. doi: 10.1067/mcp.2001.114667. [DOI] [PubMed] [Google Scholar]
- 55.Bohme M, Muller M, Leier I, Jedlitschky G, Keppler D. Cholestasis caused by inhibition of the adenosine triphosphate-dependent bile salt transport in rat liver. Gastroenterology. 1994;107(1):255–265. doi: 10.1016/0016-5085(94)90084-1. [DOI] [PubMed] [Google Scholar]
- 56.Funk C, Pantze M, Jehle L, Ponelle C, Scheuermann G, Lazendic M, Gasser R. Troglitazone-induced intrahepatic cholestasis by an interference with the hepatobiliary export of bile acids in male and female rats. Correlation with the gender difference in troglitazone sulfate formation and the inhibition of the canalicular bile salt export pump (Bsep) by troglitazone and troglitazone sulfate. Toxicology. 2001;167(1):83–98. doi: 10.1016/s0300-483x(01)00460-7. [DOI] [PubMed] [Google Scholar]
- 57.Kis E, Ioja E, Nagy T, Szente L, Heredi-Szabo K, Krajcsi P. Effect of membrane cholesterol on BSEP/Bsep activity: species specificity studies for substrates and inhibitors. Drug Metab Dispos. 2009;37(9):1878–1886. doi: 10.1124/dmd.108.024778. [DOI] [PubMed] [Google Scholar]
- 58.Mano Y, Usui T, Kamimura H. Effects of bosentan, an endothelin receptor antagonist, on bile salt export pump and multidrug resistance-associated protein 2. Biopharm Drug Dispos. 2007;28(1):13–18. doi: 10.1002/bdd.527. [DOI] [PubMed] [Google Scholar]
- 59.Morgan RE, Trauner M, van Staden CJ, Lee PH, Ramachandran B, Eschenberg M, Afshari CA, Qualls CW, Jr, Lightfoot-Dunn R, Hamadeh HK. Interference with bile salt export pump function is a susceptibility factor for human liver injury in drug development. Toxicol Sci. 2010;118(2):485–500. doi: 10.1093/toxsci/kfq269. [DOI] [PubMed] [Google Scholar]
- 60.Dawson S, Stahl S, Paul N, Barber J, Kenna JG. In vitro inhibition of the bile salt export pump correlates with risk of cholestatic drug-induced liver injury in humans. Drug Metab Dispos. 2012;40(1):130–138. doi: 10.1124/dmd.111.040758. [DOI] [PubMed] [Google Scholar]
- 61.Stieger B, Fattinger K, Madon J, Kullak-Ublick GA, Meier PJ. Drug- and estrogen-induced cholestasis through inhibition of the hepatocellular bile salt export pump (Bsep) of rat liver. Gastroenterology. 2000;118(2):422–430. doi: 10.1016/s0016-5085(00)70224-1. [DOI] [PubMed] [Google Scholar]
- 62.Fouassier L, Kinnman N, Lefevre G, Lasnier E, Rey C, Poupon R, Elferink RP, Housset C. Contribution of mrp2 in alterations of canalicular bile formation by the endothelin antagonist bosentan. J Hepatol. 2002;37(2):184–191. doi: 10.1016/s0168-8278(02)00107-1. [DOI] [PubMed] [Google Scholar]
- 63.van Erpecum KJ. Biliary lipids, water and cholesterol gallstones. Biol Cell. 2005;97(11):815–822. doi: 10.1042/BC20040088. [DOI] [PubMed] [Google Scholar]
- 64.Gonzales E, Davit-Spraul A, Baussan C, Buffet C, Maurice M, Jacquemin E. Liver diseases related to MDR3 (ABCB4) gene deficiency. Front Biosci. 2009;14:4242–4256. doi: 10.2741/3526. [DOI] [PubMed] [Google Scholar]
- 65.Yoshikado T, Takada T, Yamamoto T, Yamaji H, Ito K, Santa T, Yokota H, Yatomi Y, Yoshida H, Goto J, Tsuji S, Suzuki H. Itraconazole-induced cholestasis: involvement of the inhibition of bile canalicular phospholipid translocator MDR3/ABCB4. Mol Pharmacol. 2011;79(2):241–250. doi: 10.1124/mol.110.067256. [DOI] [PubMed] [Google Scholar]
- 66.Smith AJ, van Helvoort A, van Meer G, Szabo K, Welker E, Szakacs G, Varadi A, Sarkadi B, Borst P. MDR3 P-glycoprotein, a phosphatidylcholine translocase, transports several cytotoxic drugs and directly interacts with drugs as judged by interference with nucleotide trapping. J Biol Chem. 2000;275(31):23530–23539. doi: 10.1074/jbc.M909002199. [DOI] [PubMed] [Google Scholar]
- 67.Denk GU, Soroka CJ, Takeyama Y, Chen WS, Schuetz JD, Boyer JL. Multidrug resistance-associated protein 4 is up-regulated in liver but down-regulated in kidney in obstructive cholestasis in the rat. J Hepatol. 2004;40(4):585–591. doi: 10.1016/j.jhep.2003.12.001. [DOI] [PubMed] [Google Scholar]
- 68.Wang R, Sheps JA, Ling V. ABC transporters, bile acids, and inflammatory stress in liver cancer. Curr Pharm Biotechnol. 2011;12(4):636–646. doi: 10.2174/138920111795163986. [DOI] [PubMed] [Google Scholar]
- 69.Keitel V, Burdelski M, Warskulat U, Kuhlkamp T, Keppler D, Haussinger D, Kubitz R. Expression and localization of hepatobiliary transport proteins in progressive familial intrahepatic cholestasis. Hepatology. 2005;41(5):1160–1172. doi: 10.1002/hep.20682. [DOI] [PubMed] [Google Scholar]
- 70.Chai J, Luo D, Wu X, Wang H, He Y, Li Q, Zhang Y, Chen L, Peng ZH, Xiao T, Wang R, Chen W. Changes of organic anion transporter MRP4 and related nuclear receptors in human obstructive cholestasis. J Gastrointest Surg. 2011;15(6):996–1004. doi: 10.1007/s11605-011-1473-2. [DOI] [PubMed] [Google Scholar]
- 71.Soroka CJ, Lee JM, Azzaroli F, Boyer JL. Cellular localization and up-regulation of multidrug resistance-associated protein 3 in hepatocytes and cholangiocytes during obstructive cholestasis in rat liver. Hepatology. 2001;33(4):783–791. doi: 10.1053/jhep.2001.23501. [DOI] [PubMed] [Google Scholar]
- 72.Donner MG, Keppler D. Up-regulation of basolateral multidrug resistance protein 3 (Mrp3) in cholestatic rat liver. Hepatology. 2001;34(2):351–359. doi: 10.1053/jhep.2001.26213. [DOI] [PubMed] [Google Scholar]
- 73.Yang K, Yue W, Koeck K, Pfeifer ND, Brouwer KLR. Interaction of Troglitazone Sulfate with Hepatic Basolateral and Canalicular Transport Proteins. 2011 AAPS Annual Meeting and Exposition; Washington, DC. 2011. p. M1301. [Google Scholar]
- 74.Köck K, Ferslew B, Netterberg I, Yang K, Urban T, Swaan P, Brouwer KLR. Inhibition of the hepatic basolateral bile acid transporter MRP4 predicts cholestatic drug-induced liver injury (DILI). AASLD Liver meeting; Boston, MA. 2012. [DOI] [PMC free article] [PubMed] [Google Scholar]
- 75.Köck K, Ferslew BC, Yang K, Brouwer KLR. Inhibition of hepatic bile acid transporter MRP4: a potential risk factor for drug-induced liver injury (DILI). SOT Annual Meeting and ToxExpo; San Francisco, CA. 2011. p. 495. [Google Scholar]
- 76.Leslie EM, Watkins PB, Kim RB, Brouwer KL. Differential inhibition of rat and human Na+-dependent taurocholate cotransporting polypeptide (NTCP/SLC10A1)by bosentan: a mechanism for species differences in hepatotoxicity. J Pharmacol Exp Ther. 2007;321(3):1170–1178. doi: 10.1124/jpet.106.119073. [DOI] [PubMed] [Google Scholar]
- 77.Marion TL, Leslie EM, Brouwer KL. Use of sandwich-cultured hepatocytes to evaluate impaired bile acid transport as a mechanism of drug-induced hepatotoxicity. Mol Pharm. 2007;4(6):911–918. doi: 10.1021/mp0700357. [DOI] [PubMed] [Google Scholar]
- 78.Ansede JH, Smith WR, Perry CH, St Claire RL, 3rd, Brouwer KR. An in vitro assay to assess transporter-based cholestatic hepatotoxicity using sandwich-cultured rat hepatocytes. Drug Metab Dispos. 2010;38(2):276–280. doi: 10.1124/dmd.109.028407. [DOI] [PubMed] [Google Scholar]
- 79.Kemp DC, Zamek-Gliszczynski MJ, Brouwer KL. Xenobiotics inhibit hepatic uptake and biliary excretion of taurocholate in rat hepatocytes. Toxicol Sci. 2005;83(2):207–214. doi: 10.1093/toxsci/kfi020. [DOI] [PubMed] [Google Scholar]
- 80.Trottier J, Caron P, Straka RJ, Barbier O. Profile of serum bile acids in noncholestatic volunteers: gender-related differences in response to fenofibrate. Clin Pharmacol Ther. 2011;90(2):279–286. doi: 10.1038/clpt.2011.124. [DOI] [PMC free article] [PubMed] [Google Scholar]
- 81.Miyazaki K, Nakayama F, Koga A. Effect of chenodeoxycholic and ursodeoxycholic acids on isolated adult human hepatocytes. Dig Dis Sci. 1984;29(12):1123–1130. doi: 10.1007/BF01317087. [DOI] [PubMed] [Google Scholar]
- 82.Jung D, Inagaki T, Gerard RD, Dawson PA, Kliewer SA, Mangelsdorf DJ, Moschetta A. FXR agonists and FGF15 reduce fecal bile acid excretion in a mouse model of bile acid malabsorption. J Lipid Res. 2007;48(12):2693–2700. doi: 10.1194/jlr.M700351-JLR200. [DOI] [PubMed] [Google Scholar]
- 83.Hollands CM, Rivera-Pedrogo FJ, Gonzalez-Vallina R, Loret-de-Mola O, Nahmad M, Burnweit CA. Ileal exclusion for Byler’s disease: an alternative surgical approach with promising early results for pruritus. J Pediatr Surg. 1998;33(2):220–224. doi: 10.1016/s0022-3468(98)90435-3. [DOI] [PubMed] [Google Scholar]
- 84.Emond JC, Whitington PF. Selective surgical management of progressive familial intrahepatic cholestasis (Byler’s disease) J Pediatr Surg. 1995;30(12):1635–1641. doi: 10.1016/0022-3468(95)90440-9. [DOI] [PubMed] [Google Scholar]
- 85.Whitington PF, Whitington GL. Partial external diversion of bile for the treatment of intractable pruritus associated with intrahepatic cholestasis. Gastroenterology. 1988;95(1):130–136. doi: 10.1016/0016-5085(88)90301-0. [DOI] [PubMed] [Google Scholar]
- 86.Stedman CA, Liddle C, Coulter SA, Sonoda J, Alvarez JG, Moore DD, Evans RM, Downes M. Nuclear receptors constitutive androstane receptor and pregnane X receptor ameliorate cholestatic liver injury. Proc Natl Acad Sci U S A. 2005;102(6):2063–2068. doi: 10.1073/pnas.0409794102. [DOI] [PMC free article] [PubMed] [Google Scholar]
- 87.Beilke LD, Aleksunes LM, Holland RD, Besselsen DG, Beger RD, Klaassen CD, Cherrington NJ. Constitutive androstane receptor-mediated changes in bile acid composition contributes to hepatoprotection from lithocholic acid-induced liver injury in mice. Drug Metab Dispos. 2009;37(5):1035–1045. doi: 10.1124/dmd.108.023317. [DOI] [PMC free article] [PubMed] [Google Scholar]
- 88.Zollner G, Marschall HU, Wagner M, Trauner M. Role of nuclear receptors in the adaptive response to bile acids and cholestasis: pathogenetic and therapeutic considerations. Mol Pharm. 2006;3(3):231–251. doi: 10.1021/mp060010s. [DOI] [PubMed] [Google Scholar]
- 89.Geier A, Wagner M, Dietrich CG, Trauner M. Principles of hepatic organic anion transporter regulation during cholestasis, inflammation and liver regeneration. Biochim Biophys Acta. 2007;1773(3):283–308. doi: 10.1016/j.bbamcr.2006.04.014. [DOI] [PubMed] [Google Scholar]
- 90.Madhu C, Maziasz T, Klaassen CD. Effect of pregnenolone-16 alpha-carbonitrile and dexamethasone on acetaminophen-induced hepatotoxicity in mice. Toxicol Appl Pharmacol. 1992;115(2):191–198. doi: 10.1016/0041-008x(92)90323-k. [DOI] [PubMed] [Google Scholar]
- 91.Seo KW, Park M, Kim JG, Kim TW, Kim HJ. Effects of benzothiazole on the xenobiotic metabolizing enzymes and metabolism of acetaminophen. J Appl Toxicol. 2000;20(6):427–430. doi: 10.1002/1099-1263(200011/12)20:6<427::aid-jat707>3.0.co;2-#. [DOI] [PubMed] [Google Scholar]
- 92.Stedman C, Liddle C, Coulter S, Sonoda J, Alvarez JG, Evans RM, Downes M. Benefit of farnesoid X receptor inhibition in obstructive cholestasis. Proc Natl Acad Sci U S A. 2006;103(30):11323–11328. doi: 10.1073/pnas.0604772103. [DOI] [PMC free article] [PubMed] [Google Scholar]
- 93.Renga B, Migliorati M, Mencarelli A, Cipriani S, D’Amore C, Distrutti E, Fiorucci S. Farnesoid X receptor suppresses constitutive androstane receptor activity at the multidrug resistance protein-4 promoter. Biochim Biophys Acta. 2011;1809(3):157–165. doi: 10.1016/j.bbagrm.2011.01.008. [DOI] [PubMed] [Google Scholar]
- 94.Vore M, Liu Y, Huang L. Cholestatic properties and hepatic transport of steroid glucuronides. Drug Metab Rev. 1997;29(1–2):183–203. doi: 10.3109/03602539709037580. [DOI] [PubMed] [Google Scholar]
- 95.Eurenius K, Dalton TV, Lokey HJ, McIntyre OR. The mechanism of glucocorticoid action on the phytohemagglutinin-stimulated lymphocyte. I. In vitro binding of corticosteroids to lymphoid tissue. Biochim Biophys Acta. 1969;177(3):572–578. doi: 10.1016/0304-4165(69)90321-3. [DOI] [PubMed] [Google Scholar]
- 96.Crocenzi FA, Mottino AD, Cao J, Veggi LM, Pozzi EJ, Vore M, Coleman R, Roma MG. Estradiol-17beta-D-glucuronide induces endocytic internalization of Bsep in rats. Am J Physiol Gastrointest Liver Physiol. 2003;285(2):G449–459. doi: 10.1152/ajpgi.00508.2002. [DOI] [PubMed] [Google Scholar]
- 97.Mottino AD, Crocenzi FA, Pozzi EJ, Veggi LM, Roma MG, Vore M. Role of microtubules in estradiol-17beta-D-glucuronide-induced alteration of canalicular Mrp2 localization and activity. Am J Physiol Gastrointest Liver Physiol. 2005;288(2):G327–336. doi: 10.1152/ajpgi.00227.2004. [DOI] [PubMed] [Google Scholar]
- 98.Mottino AD, Cao J, Veggi LM, Crocenzi F, Roma MG, Vore M. Altered localization and activity of canalicular Mrp2 in estradiol-17beta-D-glucuronide-induced cholestasis. Hepatology. 2002;35(6):1409–1419. doi: 10.1053/jhep.2002.33327. [DOI] [PubMed] [Google Scholar]
- 99.Dawson ER, Platt BS. The Phosphate Ion and Hydrolysis by Pancreatic Lipase. J Gen Physiol. 1928;11(4):357–360. doi: 10.1085/jgp.11.4.357. [DOI] [PMC free article] [PubMed] [Google Scholar]
- 100.Boaglio AC, Zucchetti AE, Sanchez Pozzi EJ, Pellegrino JM, Ochoa JE, Mottino AD, Vore M, Crocenzi FA, Roma MG. Phosphoinositide 3-kinase/protein kinase B signaling pathway is involved in estradiol 17beta-D-glucuronide-induced cholestasis: complementarity with classical protein kinase C. Hepatology. 2010;52(4):1465–1476. doi: 10.1002/hep.23846. [DOI] [PubMed] [Google Scholar]
- 101.Barosso IR, Zucchetti AE, Boaglio AC, Larocca MC, Taborda DR, Luquita MG, Roma MG, Crocenzi FA, Sanchez Pozzi EJ. Sequential Activation of Classic PKC and Estrogen Receptor alpha Is Involved in Estradiol 17ss-D-Glucuronide-Induced Cholestasis. PLoS One. 2012;7(11):e50711. doi: 10.1371/journal.pone.0050711. [DOI] [PMC free article] [PubMed] [Google Scholar]
- 102.Yamamoto Y, Moore R, Hess HA, Guo GL, Gonzalez FJ, Korach KS, Maronpot RR, Negishi M. Estrogen receptor alpha mediates 17alpha-ethynylestradiol causing hepatotoxicity. J Biol Chem. 2006;281(24):16625–16631. doi: 10.1074/jbc.M602723200. [DOI] [PubMed] [Google Scholar]
- 103.Ruiz ML, Rigalli JP, Arias A, Villanueva S, Banchio C, Vore M, Mottino AD, Catania VA. Induction of Hepatic Multidrug Resistance Associated Protein 3 by Ethynylestradiol is Independent of Cholestasis and Mediated by Estrogen Receptor. Drug Metab Dispos. 2012 doi: 10.1124/dmd.112.047357. [DOI] [PMC free article] [PubMed] [Google Scholar]
- 104.Trauner M, Fickert P, Stauber RE. Inflammation-induced cholestasis. J Gastroenterol Hepatol. 1999;14(10):946–959. doi: 10.1046/j.1440-1746.1999.01982.x. [DOI] [PubMed] [Google Scholar]
- 105.Moseley RH. Sepsis-associated cholestasis. Gastroenterology. 1997;112(1):302–306. doi: 10.1016/s0016-5085(97)70250-6. [DOI] [PubMed] [Google Scholar]
- 106.Zinchuk V, Zinchuk O, Okada T. Experimental LPS-induced cholestasis alters subcellular distribution and affects colocalization of Mrp2 and Bsep proteins: a quantitative colocalization study. Microsc Res Tech. 2005;67(2):65–70. doi: 10.1002/jemt.20184. [DOI] [PubMed] [Google Scholar]
- 107.Kubitz R, Wettstein M, Warskulat U, Haussinger D. Regulation of the multidrug resistance protein 2 in the rat liver by lipopolysaccharide and dexamethasone. Gastroenterology. 1999;116(2):401–410. doi: 10.1016/s0016-5085(99)70138-1. [DOI] [PubMed] [Google Scholar]
- 108.Denson LA, Auld KL, Schiek DS, McClure MH, Mangelsdorf DJ, Karpen SJ. Interleukin-1beta suppresses retinoid transactivation of two hepatic transporter genes involved in bile formation. J Biol Chem. 2000;275(12):8835–8843. doi: 10.1074/jbc.275.12.8835. [DOI] [PubMed] [Google Scholar]
- 109.Ghose R, Zimmerman TL, Thevananther S, Karpen SJ. Endotoxin leads to rapid subcellular re-localization of hepatic RXRalpha: A novel mechanism for reduced hepatic gene expression in inflammation. Nucl Recept. 2004;2(1):4. doi: 10.1186/1478-1336-2-4. [DOI] [PMC free article] [PubMed] [Google Scholar]
- 110.Trauner M, Arrese M, Lee H, Boyer JL, Karpen SJ. Endotoxin downregulates rat hepatic ntcp gene expression via decreased activity of critical transcription factors. J Clin Invest. 1998;101(10):2092–2100. doi: 10.1172/JCI1680. [DOI] [PMC free article] [PubMed] [Google Scholar]
- 111.Zollner G, Fickert P, Silbert D, Fuchsbichler A, Marschall HU, Zatloukal K, Denk H, Trauner M. Adaptive changes in hepatobiliary transporter expression in primary biliary cirrhosis. J Hepatol. 2003;38(6):717–727. doi: 10.1016/s0168-8278(03)00096-5. [DOI] [PubMed] [Google Scholar]
- 112.Kojima H, Nies AT, Konig J, Hagmann W, Spring H, Uemura M, Fukui H, Keppler D. Changes in the expression and localization of hepatocellular transporters and radixin in primary biliary cirrhosis. J Hepatol. 2003;39(5):693–702. doi: 10.1016/s0168-8278(03)00410-0. [DOI] [PubMed] [Google Scholar]
- 113.Congiu M, Mashford ML, Slavin JL, Desmond PV. Coordinate regulation of metabolic enzymes and transporters by nuclear transcription factors in human liver disease. J Gastroenterol Hepatol. 2009;24(6):1038–1044. doi: 10.1111/j.1440-1746.2009.05800.x. [DOI] [PubMed] [Google Scholar]
- 114.Levy C, Lindor KD. Drug-induced cholestasis. Clin Liver Dis. 2003;7(2):311–330. doi: 10.1016/s1089-3261(03)00032-1. [DOI] [PubMed] [Google Scholar]
- 115.Mohi-ud-din R, Lewis JH. Drug- and chemical-induced cholestasis. Clin Liver Dis. 2004;8(1):95–132. vii. doi: 10.1016/S1089-3261(03)00124-7. [DOI] [PubMed] [Google Scholar]
- 116.Chitturi S, Farrell GC. Drug-induced cholestasis. Semin Gastrointest Dis. 2001;12(2):113–124. [PubMed] [Google Scholar]
- 117.Hamilton JP, Laurin JM. Drug-induced cholestasis. Totowa, NJ: Humana Press Inc; 2008. [Google Scholar]
- 118.Zhu X, Sedykh A, Zhu H, Liu S, Tropsha S. The Use of Pseudo-equilibrium Constant Affords Improved QSAR Models of Human Plasma Protein Binding (Accepted) Pharm Res. 2012 doi: 10.1007/s11095-013-1023-6. [DOI] [PMC free article] [PubMed] [Google Scholar]
- 119.Benet LZ, Broccatelli F, Oprea TI. BDDCS applied to over 900 drugs. AAPS J. 2011;13(4):519–547. doi: 10.1208/s12248-011-9290-9. [DOI] [PMC free article] [PubMed] [Google Scholar]
- 120.Olah M, Rad R, Ostopovici L, Bora A, Hadaruga R, Hadaruga D, Moldovan R, Fulias A, Mracec M, Opre TI. WOMBAT and WOMBAT-PK: Bioactivity Databases for Lead and Drug Discovery. In: Schreiber SL, Kapoor TM, Wess G, editors. Chemical Biology: From Small Molecules to Systems Biology and Drug Design. New York: Wiley-VCH; 2007. pp. 760–786. [Google Scholar]
- 121.Warner DJ, Chen H, Cantin LD, Kenna JG, Stahl S, Walker CL, Noeske T. Mitigating the inhibition of human bile salt export pump by drugs: opportunities provided by physicochemical property modulation, in silico modeling, and structural modification. Drug Metab Dispos. 2012;40(12):2332–2341. doi: 10.1124/dmd.112.047068. [DOI] [PubMed] [Google Scholar]
- 122.van Staden CJ, Morgan RE, Ramachandran B, Chen Y, Lee PH, Hamadeh HK. Membrane vesicle ABC transporter assays for drug safety assessment. Curr Protoc Toxicol. 2012;Chapter 23(Unit 23):25. doi: 10.1002/0471140856.tx2305s54. [DOI] [PubMed] [Google Scholar]
- 123.Modica S, Gadaleta RM, Moschetta A. Deciphering the nuclear bile acid receptor FXR paradigm. Nucl Recept Signal. 2010;8:e005. doi: 10.1621/nrs.08005. [DOI] [PMC free article] [PubMed] [Google Scholar]
- 124.Goodwin B, Kliewer SA. Nuclear receptors. I. Nuclear receptors and bile acid homeostasis. Am J Physiol Gastrointest Liver Physiol. 2002;282(6):G926–931. doi: 10.1152/ajpgi.00044.2002. [DOI] [PubMed] [Google Scholar]
- 125.Saito H, Osumi M, Hirano H, Shin W, Nakamura R, Ishikawa T. Technical pitfalls and improvements for high-speed screening and QSAR analysis to predict inhibitors of the human bile salt export pump (ABCB11/BSEP) AAPS J. 2009;11(3):581–589. doi: 10.1208/s12248-009-9137-9. [DOI] [PMC free article] [PubMed] [Google Scholar]
- 126.Pedersen JM, Matsson P, Bergstrom CA, Norinder U, Hoogstraate J, Artursson P. Prediction and identification of drug interactions with the human ATP-binding cassette transporter multidrug-resistance associated protein 2 (MRP2; ABCC2) J Med Chem. 2008;51(11):3275–3287. doi: 10.1021/jm7015683. [DOI] [PubMed] [Google Scholar]
- 127.Zhang H, Xiang ML, Zhao YL, Wei YQ, Yang SY. Support vector machine and pharmacophore-based prediction models of multidrug-resistance protein 2 (MRP2) inhibitors. Eur J Pharm Sci. 2009;36(4–5):451–457. doi: 10.1016/j.ejps.2008.11.014. [DOI] [PubMed] [Google Scholar]
- 128.Sedykh A, Fourches D, Duan J, Hucke O, Garneau M, Zhu H, Bonneau P, Tropsha A. Human Intestinal Transporter Database: QSAR Modeling and Virtual Profiling of Drug Uptake, Efflux and Interactions. Pharm Res. 2012 doi: 10.1007/s11095-012-0935-x. [DOI] [PMC free article] [PubMed] [Google Scholar]
- 129.Ng C, Xiao YD, Lum BL, Han YH. Quantitative structure-activity relationships of methotrexate and methotrexate analogues transported by the rat multispecific resistance-associated protein 2 (rMrp2) Eur J Pharm Sci. 2005;26(5):405–413. doi: 10.1016/j.ejps.2005.07.008. [DOI] [PubMed] [Google Scholar]
- 130.Akanuma S, Uchida Y, Ohtsuki S, Kamiie J, Tachikawa M, Terasaki T, Hosoya K. Molecular-weight-dependent, anionic-substrate-preferential transport of beta-lactam antibiotics via multidrug resistance-associated protein 4. Drug Metab Pharmacokinet. 2011;26(6):602–611. doi: 10.2133/dmpk.DMPK-11-RG-063. [DOI] [PubMed] [Google Scholar]
- 131.Giacomini KM, Huang SM, Tweedie DJ, Benet LZ, Brouwer KL, Chu X, Dahlin A, Evers R, Fischer V, Hillgren KM, Hoffmaster KA, Ishikawa T, Keppler D, Kim RB, Lee CA, Niemi M, Polli JW, Sugiyama Y, Swaan PW, Ware JA, Wright SH, Yee SW, Zamek-Gliszczynski MJ, Zhang L. Membrane transporters in drug development. Nat Rev Drug Discov. 2010;9(3):215–236. doi: 10.1038/nrd3028. [DOI] [PMC free article] [PubMed] [Google Scholar]
- 132.Karlgren M, Vildhede A, Norinder U, Wisniewski JR, Kimoto E, Lai Y, Haglund U, Artursson P. Classification of inhibitors of hepatic organic anion transporting polypeptides (OATPs): influence of protein expression on drug-drug interactions. J Med Chem. 2012;55(10):4740–4763. doi: 10.1021/jm300212s. [DOI] [PMC free article] [PubMed] [Google Scholar]
- 133.Zheng X, Ekins S, Raufman JP, Polli JE. Computational models for drug inhibition of the human apical sodium-dependent bile acid transporter. Mol Pharm. 2009;6(5):1591–1603. doi: 10.1021/mp900163d. [DOI] [PMC free article] [PubMed] [Google Scholar]
- 134.Zheng X, Pan Y, Acharya C, Swaan PW, Polli JE. Structural requirements of the ASBT by 3D-QSAR analysis using aminopyridine conjugates of chenodeoxycholic acid. Bioconjug Chem. 2010;21(11):2038–2048. doi: 10.1021/bc100273w. [DOI] [PMC free article] [PubMed] [Google Scholar]
- 135.Rais R, Acharya C, Mackerell AD, Polli JE. Structural determinants for transport across the intestinal bile acid transporter using C-24 bile acid conjugates. Mol Pharm. 2010;7(6):2240–2254. doi: 10.1021/mp100233v. [DOI] [PMC free article] [PubMed] [Google Scholar]
- 136.Rais R, Acharya C, Tririya G, Mackerell AD, Polli JE. Molecular switch controlling the binding of anionic bile acid conjugates to human apical sodium-dependent bile acid transporter. J Med Chem. 2010;53(12):4749–4760. doi: 10.1021/jm1003683. [DOI] [PMC free article] [PubMed] [Google Scholar]
- 137.Gonzalez PM, Acharya C, Mackerell AD, Jr, Polli JE. Inhibition requirements of the human apical sodium-dependent bile acid transporter (hASBT) using aminopiperidine conjugates of glutamyl-bile acids. Pharm Res. 2009;26(7):1665–1678. doi: 10.1007/s11095-009-9877-3. [DOI] [PMC free article] [PubMed] [Google Scholar]
- 138.Greupink R, Nabuurs SB, Zarzycka B, Verweij V, Monshouwer M, Huisman MT, Russel FG. In silico identification of potential cholestasis-inducing agents via modeling of Na(+)-dependent taurocholate cotransporting polypeptide substrate specificity. Toxicol Sci. 2012;129(1):35–48. doi: 10.1093/toxsci/kfs188. [DOI] [PubMed] [Google Scholar]
- 139.Ekins S, Kortagere S, Iyer M, Reschly EJ, Lill MA, Redinbo MR, Krasowski MD. Challenges predicting ligand-receptor interactions of promiscuous proteins: the nuclear receptor PXR. PLoS Comput Biol. 2009;5(12):e1000594. doi: 10.1371/journal.pcbi.1000594. [DOI] [PMC free article] [PubMed] [Google Scholar]
- 140.Kortagere S, Krasowski MD, Ekins S. Ligand- and structure-based pregnane X receptor models. Methods Mol Biol. 2012;929:359–375. doi: 10.1007/978-1-62703-050-2_15. [DOI] [PubMed] [Google Scholar]
- 141.Khandelwal A, Krasowski MD, Reschly EJ, Sinz MW, Swaan PW, Ekins S. Machine learning methods and docking for predicting human pregnane X receptor activation. Chem Res Toxicol. 2008;21(7):1457–1467. doi: 10.1021/tx800102e. [DOI] [PMC free article] [PubMed] [Google Scholar]
- 142.Kortagere S, Chekmarev D, Welsh WJ, Ekins S. Hybrid scoring and classification approaches to predict human pregnane X receptor activators. Pharm Res. 2009;26(4):1001–1011. doi: 10.1007/s11095-008-9809-7. [DOI] [PMC free article] [PubMed] [Google Scholar]
- 143.Honorio KM, Garratt RC, Polikarpov I, Andricopulo AD. 3D QSAR comparative molecular field analysis on nonsteroidal farnesoid X receptor activators. J Mol Graph Model. 2007;25(6):921–927. doi: 10.1016/j.jmgm.2006.09.003. [DOI] [PubMed] [Google Scholar]
- 144.Zhang T, Zhou JH, Shi LW, Zhu RX, Chen MB. 3D-QSAR studies with the aid of molecular docking for a series of non-steroidal FXR agonists. Bioorg Med Chem Lett. 2007;17(8):2156–2160. doi: 10.1016/j.bmcl.2007.01.079. [DOI] [PubMed] [Google Scholar]
- 145.Matter H, Anger LT, Giegerich C, Gussregen S, Hessler G, Baringhaus KH. Development of in silico filters to predict activation of the pregnane X receptor (PXR) by structurally diverse drug-like molecules. Bioorg Med Chem. 2012;20(18):5352–5365. doi: 10.1016/j.bmc.2012.04.020. [DOI] [PubMed] [Google Scholar]
- 146.Schuster D, Markt P, Grienke U, Mihaly-Bison J, Binder M, Noha SM, Rollinger JM, Stuppner H, Bochkov VN, Wolber G. Pharmacophore-based discovery of FXR agonists. Part I: Model development and experimental validation. Bioorg Med Chem. 2011;19(23):7168–7180. doi: 10.1016/j.bmc.2011.09.056. [DOI] [PMC free article] [PubMed] [Google Scholar]
- 147.Grienke U, Mihaly-Bison J, Schuster D, Afonyushkin T, Binder M, Guan SH, Cheng CR, Wolber G, Stuppner H, Guo DA, Bochkov VN, Rollinger JM. Pharmacophore-based discovery of FXR-agonists. Part II: identification of bioactive triterpenes from Ganoderma lucidum. Bioorg Med Chem. 2011;19(22):6779–6791. doi: 10.1016/j.bmc.2011.09.039. [DOI] [PMC free article] [PubMed] [Google Scholar]
- 148.Diaz Ochoa JG, Bucher J, Pery AR, Zaldivar Comenges JM, Niklas J, Mauch K. A multi-scale modeling framework for individualized, spatiotemporal prediction of drug effects and toxicological risk. Front Pharmacol. 2012;3:204. doi: 10.3389/fphar.2012.00204. [DOI] [PMC free article] [PubMed] [Google Scholar]
- 149.Howell BA, Yang Y, Kumar R, Woodhead JL, Harrill AH, Clewell HJ, 3rd, Andersen ME, Siler SQ, Watkins PB. In vitro to in vivo extrapolation and species response comparisons for drug-induced liver injury (DILI) using DILIsym: a mechanistic, mathematical model of DILI. J Pharmacokinet Pharmacodyn. 2012;39(5):527–541. doi: 10.1007/s10928-012-9266-0. [DOI] [PubMed] [Google Scholar]
- 150.Lecureur V, Sun D, Hargrove P, Schuetz EG, Kim RB, Lan LB, Schuetz JD. Cloning and expression of murine sister of P-glycoprotein reveals a more discriminating transporter than MDR1/P-glycoprotein. Mol Pharmacol. 2000;57(1):24–35. [PubMed] [Google Scholar]
- 151.Noe J, Hagenbuch B, Meier PJ, St-Pierre MV. Characterization of the mouse bile salt export pump overexpressed in the baculovirus system. Hepatology. 2001;33(5):1223–1231. doi: 10.1053/jhep.2001.24171. [DOI] [PubMed] [Google Scholar]
- 152.Byrne JA, Strautnieks SS, Mieli-Vergani G, Higgins CF, Linton KJ, Thompson RJ. The human bile salt export pump: characterization of substrate specificity and identification of inhibitors. Gastroenterology. 2002;123(5):1649–1658. doi: 10.1053/gast.2002.36591. [DOI] [PubMed] [Google Scholar]
- 153.Wang EJ, Casciano CN, Clement RP, Johnson WW. Fluorescent substrates of sister-P-glycoprotein (BSEP) evaluated as markers of active transport and inhibition: evidence for contingent unequal binding sites. Pharm Res. 2003;20(4):537–544. doi: 10.1023/a:1023278211849. [DOI] [PubMed] [Google Scholar]
- 154.Hirano H, Kurata A, Onishi Y, Sakurai A, Saito H, Nakagawa H, Nagakura M, Tarui S, Kanamori Y, Kitajima M, Ishikawa T. High-speed screening and QSAR analysis of human ATP-binding cassette transporter ABCB11 (bile salt export pump) to predict drug-induced intrahepatic cholestasis. Mol Pharm. 2006;3(3):252–265. doi: 10.1021/mp060004w. [DOI] [PubMed] [Google Scholar]
- 155.Karlgren M, Ahlin G, Bergstrom CA, Svensson R, Palm J, Artursson P. In vitro and in silico strategies to identify OATP1B1 inhibitors and predict clinical drug-drug interactions. Pharm Res. 2012;29(2):411–426. doi: 10.1007/s11095-011-0564-9. [DOI] [PMC free article] [PubMed] [Google Scholar]
- 156.Ung CY, Li H, Yap CW, Chen YZ. In silico prediction of pregnane X receptor activators by machine learning approaches. Mol Pharmacol. 2007;71(1):158–168. doi: 10.1124/mol.106.027623. [DOI] [PubMed] [Google Scholar]
- 157.Dybdahl M, Nikolov NG, Wedebye EB, Jonsdottir SO, Niemela JR. QSAR model for human pregnane X receptor (PXR) binding: screening of environmental chemicals and correlations with genotoxicity, endocrine disruption and teratogenicity. Toxicol Appl Pharmacol. 2012;262(3):301–309. doi: 10.1016/j.taap.2012.05.008. [DOI] [PubMed] [Google Scholar]
- 158.Honorio KM, Garratt RC, Andricopulo AD. Hologram quantitative structure-activity relationships for a series of farnesoid X receptor activators. Bioorg Med Chem Lett. 2005;15(12):3119–3125. doi: 10.1016/j.bmcl.2005.04.017. [DOI] [PubMed] [Google Scholar]
- 159.Genet C, Strehle A, Schmidt C, Boudjelal G, Lobstein A, Schoonjans K, Souchet M, Auwerx J, Saladin R, Wagner A. Structure-activity relationship study of betulinic acid, a novel and selective TGR5 agonist, and its synthetic derivatives: potential impact in diabetes. J Med Chem. 2010;53(1):178–190. doi: 10.1021/jm900872z. [DOI] [PubMed] [Google Scholar]