Abstract
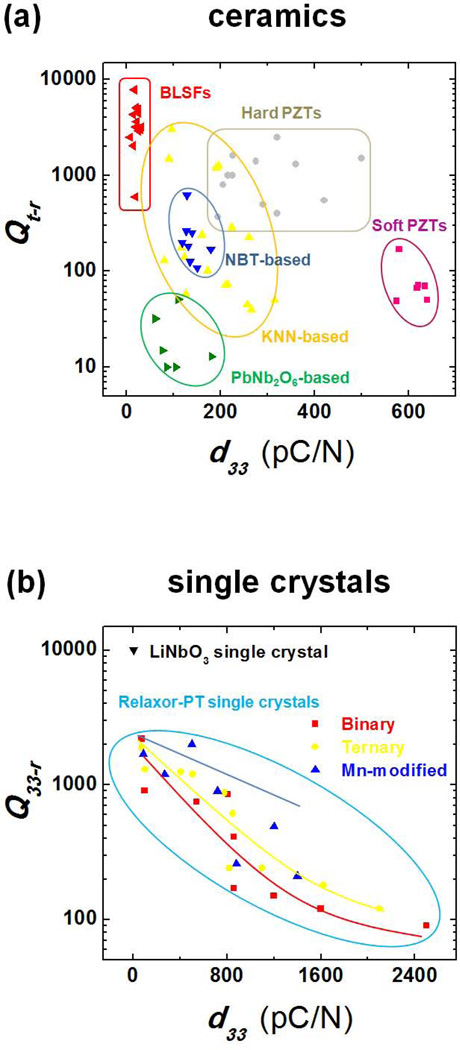
Ferroelectric materials are the best dielectric and piezoelectric materials known today. Since the discovery of barium titanate in the 1940s, lead zirconate titanate ceramics in the 1950s and relaxor-PT single crystals (such as lead magnesium niobate-lead titanate and lead zinc niobate-lead titanate) in the 1980s and 1990s, perovskite ferroelectric materials have been the dominating piezoelectric materials for electromechanical devices, and are widely used in sensors, actuators and ultrasonic transducers. Energy losses (or energy dissipation) in ferroelectrics are one of the most critical issues for high power devices, such as therapeutic ultrasonic transducers, large displacement actuators, SONAR projectors, and high frequency medical imaging transducers. The losses of ferroelectric materials have three distinct types, i.e., elastic, piezoelectric and dielectric losses. People have been investigating the mechanisms of these losses and are trying hard to control and minimize them so as to reduce performance degradation in electromechanical devices. There are impressive progresses made in the past several decades on this topic, but some confusions still exist. Therefore, a systematic review to define related concepts and clear up confusions is urgently in need. With this objective in mind, we provide here a comprehensive review on the energy losses in ferroelectrics, including related mechanisms, characterization techniques and collections of published data on many ferroelectric materials to provide a useful resource for interested scientists and engineers to design electromechanical devices and to gain a global perspective on the complex physical phenomena involved. More importantly, based on the analysis of available information, we proposed a general theoretical model to describe the inherent relationships among elastic, dielectric, piezoelectric and mechanical losses.
For multi-domain ferroelectric single crystals and ceramics, intrinsic and extrinsic energy loss mechanisms are discussed in terms of compositions, crystal structures, temperature, domain configurations, domain sizes and grain boundaries. The intrinsic and extrinsic contributions to the total energy dissipation are quantified. In domain engineered ferroelectric single crystals and ceramics, polarization rotations, domain wall motions and mechanical wave scatterings at grain boundaries are believed to control the mechanical quality factors of piezoelectric resonators. We show that a thorough understanding on the kinetic processes is critical in analyzing energy loss behavior and other time-dependent properties in ferroelectric materials. At the end of the review, existing challenges in the study and control of losses in ferroelectric materials are analyzed, and future perspective in resolving these issues is discussed.
Keywords: Energy dissipation, energy loss, quality factor, ferroelectrics, piezoelectric, dielectric
1. Introduction
1.1 Ferroelectricity
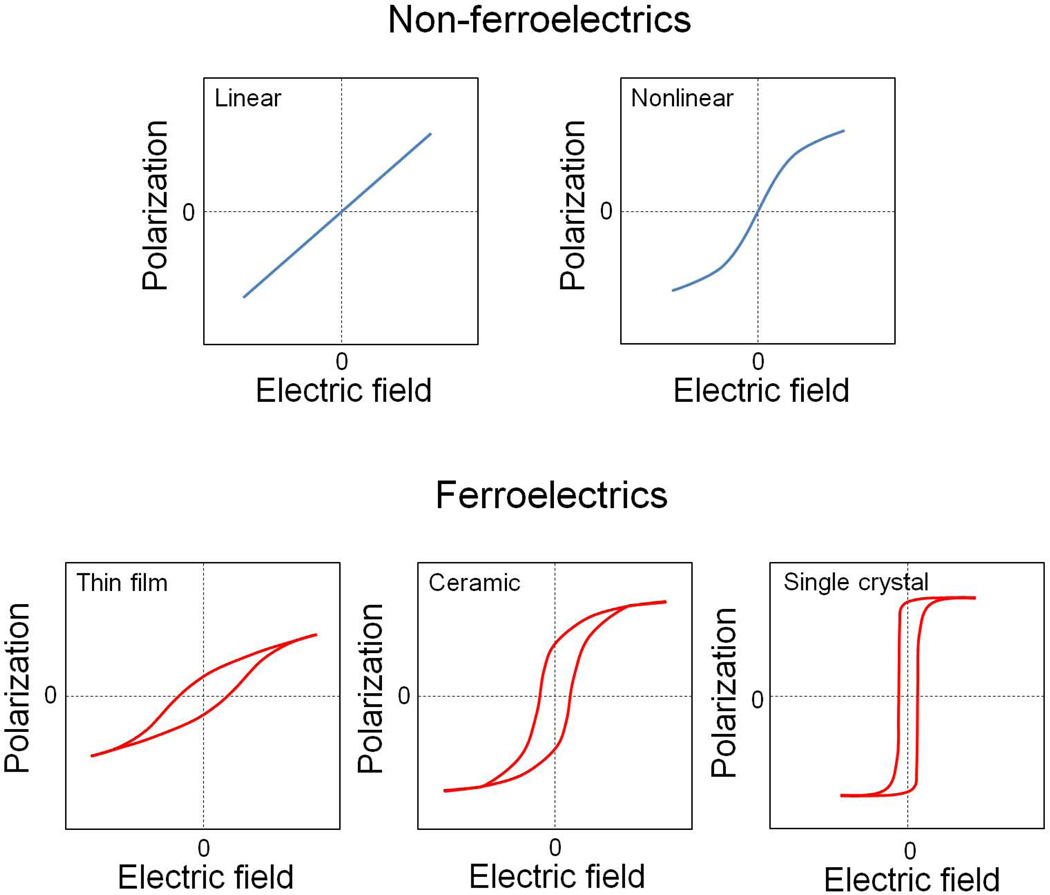
Ferroelectricity is the property of certain materials with a spontaneous electric polarization (Ps). There are more than one energetically degenerate states in the ferroelectric phase and it is possible to switch polarization between these energetically degenerate states when a suitably strong electric field (E) is applied [1–3]. The energy degeneracy of these polarization states could be broken under a bias (electric or elastic) field, but polarization switching can still be induced by electric field between these ferroelastic states. In general, materials that have switchable spontaneous electric polarization are called ferroelectric materials. For ferroelectric materials, except those melt before transforming into non-polar crystalline phase, a permanent non-zero polarization is usually formed at a particular temperature, namely the Curie temperature (or Curie point) TC. This is associated with a paraelectric-ferroelectric phase transition and reflected in terms of a softening of an optical mode at the Brillion zone center, which produces the separation of positive and negative charge centers below the Curie temperature. Such non-zero spontaneous polarization is the common characteristic of ferroelectrics, resulting in the nonlinear polarization-electric field (P-E) hysteresis loops showing the variation of electric polarization with electric field and the polarization switching behavior. The hysteresis nature of the P-E relationship in ferroelectrics demonstrates that the polarization is dependent not only on the applied field, but also on the history. In principle, from P-E loops ferroelectricity can be identified directly and the ferroelectric parameters, including spontaneous polarization (Ps), remnant polarization (Pr) and coercive field (Ec), can be determined. The general features of the P-E curves in non-ferroelectrics and ferroelectrics are illustrated in Fig. 1. One can see that among various ferroelectrics, the maximum achievable polarization is the largest for single crystals and smallest for thin films. Such obvious difference can be understood from the fact that for polycrystalline ceramics the intergranular interactions leads to a strain restriction on polarization switching, while for thin films the substrate interface further limits the poling ability of the ferroelectric materials [2].
Figure 1.
Schematic illustration of P-E curves for various dielectric materials that included linear and nonlinear non-ferroelectrics, as well as ferroelectric thin films, ceramics and single crystals.
1.2 Ferroelectric materials and their applications
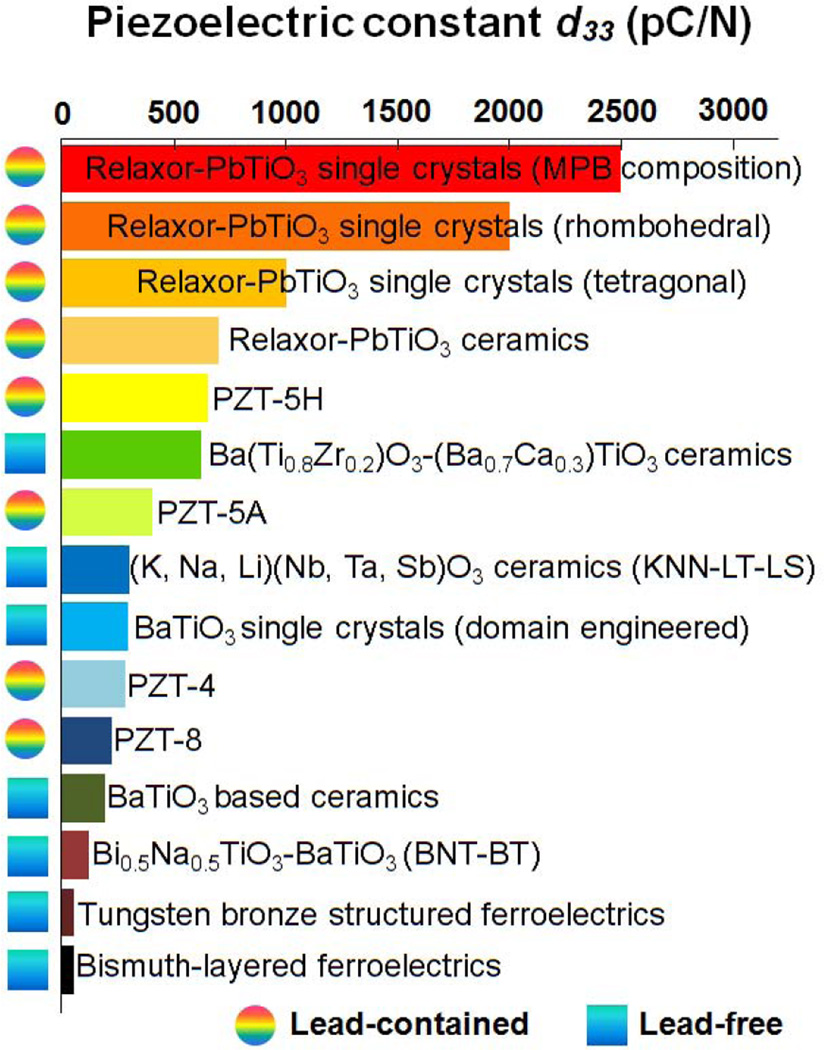
In 1920, the ferroelectric phenomenon was discovered in Rochelle salt by J. Valasek, who demonstrated for the first time that ‘permanent polarization is the natural state’ of Rochelle salt and published the first hysteresis loop of a ferroelectric material [4–5]. After that, it was not until the 1940s, the discovery of ferroelectricity in barium titanate (BaTiO3) forwarded the study of ferroelectricity to practical application research from pure scientific curiosity [6–8]. In 1950s, the discovery of lead zirconate titanate ceramics (Pb(Zr1−xTix)O3, PZT for short) is believed to be a milestone in ferroelectric research [9–10]. The investigations on this binary system clearly demonstrated the importance of composition-induced ferroelectric-ferroelectric phase transitions, emphasizing on the concept of morphotropic phase boundary (MPB) that benefits piezoceramic research [9–12]. In 1980s and 1990s, ultrahigh piezoelectricity and superior electromechanical coupling properties were reported in relaxor-PbTiO3 (relaxor-PT) ferroelectric single crystal systems [13–14]. These materials exhibit a piezoelectric effect that is three to ten times larger than that of conventional piezoelectric ceramics, and the research on this new generation of single-crystal ferroelectrics has progressed tremendously in the past two decades [14–22]. The giant piezoelectric coefficient and high electromechanical coupling factors of relaxor-PT single crystals have been extensively studied, which are closely associated to engineered domain configurations [14, 23–32]. The relaxor-PT crystals have cubic perovskite structure in the paraelectric phase, while ferroelectric state can be either in rhombohedral (R), monoclinic (M), orthorhombic (O), or tetragonal (T) phases, depending on the PT content and poling process [25–27]. Various artificial domain configurations can be formed in the ferroelectric state by poling the crystals along different crystallographic directions, which produces very different piezoelectric, electromechanical and mechanical properties, as listed in Table 1 [28–30]. For example, the highest longitudinal piezoelectric coefficient d33 can be achieved in the engineered ‘4R’ (where ‘4’ means four equivalent domain variants and ‘R’ denotes the rhombohedral phase crystals, as listed in Table 1) domain configuration, while the highest shear piezoelectric coefficient d15 was observed in the ‘1R’ single domain configuration. In addition, the mechanical quality factor (the parameter evaluating energy loss, detailed in later) was reported to be on the order of ~80 for the longitudinal mode in the ‘4R’ domain state, increased to about 600 in the ‘2R’ domain state and further enhanced to over 1000 in the single domain ‘1R’ state. Fig. 2 shows the piezoelectric activity of typical ferroelectrics that included both lead-containing and lead-free materials. It is clear that the lead-based ferroelectrics with ABO3 perovskite structure are still the best piezoelectric materials known today.
Table 1.
| Crystal phase | Polar direction | Poling direction | Polar directions for the resultant set of equivalent domain variants |
Symmetry | Domain configuration |
|---|---|---|---|---|---|
| Rhombohedral (R) | <111>c | [111]c | [111]c | 3m | 1R |
| [011]c | [−111]c, [111]c | mm2 | 2R | ||
| [001]c | [111]c, [−111]c, [1–11]c, [−1–11]c | 4mm | 4R | ||
| Orthorhombic(O)/Monoclinic (M) | <011>c | [111]c | [101]c, [011]c, [110]c | 3m | 3O |
| [011]c | [011]c | mm2 | 1O | ||
| [001]c | [101]c, [011]c, [−101]c, [0–11]c | 4mm | 4O | ||
| Tetragonal (T) | <001>c | [111]c | [001]c, [010]c, [100]c | 3m | 3T |
| [011]c | [001]c, [010]c | mm2 | 2T | ||
| [001]c | [001]c | 4mm | 1T | ||
Figure 2.
Longitudinal piezoelectric coefficient d33 of typical ferroelectrics. Data are from Refs. [33–36].
Ferroelectric materials have been extensively used for a wide range of applications, including resonators, actuator, transducers, transformers, sensors, non-volatile FeRAM, capacitors, etc. [37–40] The main feature of ferroelectric materials is the presence of spontaneous polarization, which can be reoriented by applying an external field, including electrical and stress fields. The regions with uniform polarization are called ferroelectric domains, and the interface boundary between two adjacent coherent domains is called a domain wall, which is often a crystal plan with discrete orientations allowed by the strain compatibility relation in a given symmetry. Both polarization rotation/elongation and domain wall motions were thought to be the dominant factors controlling the macroscopic properties of ferroelectrics [15, 41–43].
Innovations in electromechanical devices continue to be the driving force for the development of new ferroelectric materials, and the understanding of external field induced behavior, including piezoelectric response and energy loss (or dissipation) behavior. For a piezoelectric material, the total loss can be separated into three parts: elastic, dielectric and piezoelectric losses [23, 44–47]. These losses are associated with non-equilibrium thermodynamics. Investigations on the energy loss of ferroelectrics are critically important, which can lead to a better understanding on anelasticity, dielectric relaxation and piezoelectric hysteresis [48–51]. From a practical application viewpoint, energy loss may cause significant heat generation in electromechanical devices under strong field driving condition, leading to device failure, especially in high-power transducers and ultrasonic motors [23, 44, 47, 52–54]. Although high mechanical loss is associated with broader bandwidth in sensors and transducers, but it will reduce device sensitivity [47]. For very high frequency ultrasonic transducers, the dimensions of each element may be down to micrometers so that the sensitivity is very important. High attenuation at high frequencies will significantly affect the performance of high frequency transducers [55–56].
1.3 Motivation to study losses
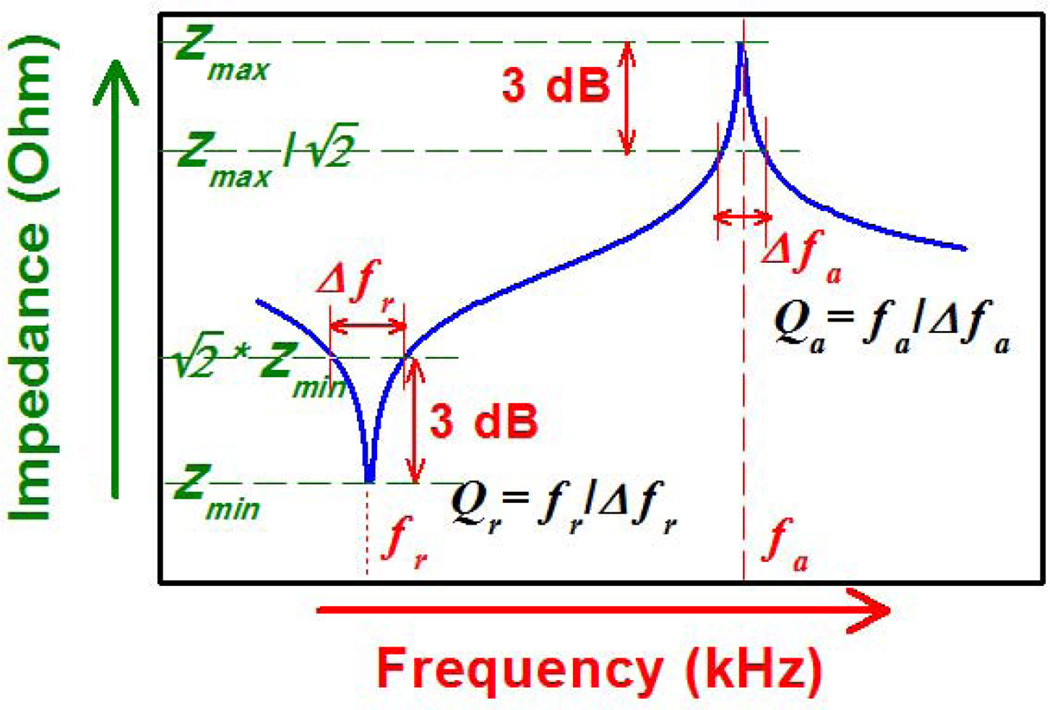
Up to date, the complex energy loss behavior in ferroelectrics is far from being fully understood, especially in ferroelectric perovskite materials with high electromechanical coupling factors, such as soft Pb(Zr,Ti)O3 (PZT) ceramics (k33 ~ 0.75) and relaxor-PbTiO3 single crystals (k33 ~ 0.90) [23–24, 47]. In practice, the Butterworth Van Dyke equivalent circuit and the ‘half power point’ measurements (3 dB method, see Fig. 3) have been extensively used to measure the mechanical quality factor Qm of a piezoelectric resonator [57]. Nevertheless, such approaches produce some confusion due to the difference between values measured at resonance and antiresonance frequencies, and could not bridge those engineering parameters to the origin of energy loss in ferroelectrics, which are strongly associated with various material characteristics, such as piezoelectric response, polarization switching, and ferroelectric/ferroelastic domain microstructures [24, 58]. In addition, the measured mechanical quality factor Qm is easily affected by measurement conditions, including but not limited to, frequency, vibration mode, sample surface condition and adhesion of the electrode. [23] Thus, it is necessary to systematically study the energy loss behavior in ferroelectric materials, explore the origin of these energy dissipations/losses and understand their correlation with material composition, crystal phase, domain state and external conditions, such as temperature, field, frequency, etc.
Figure 3.
Calculation method for quality factors at resonance (Qr) and antiresonance frequencies (Qa), derived from Butterworth Van Dyke equivalent circuit and 3dB method.
The intension of this review is to survey the current status of research on different losses in ferroelectric materials, analyze available data to clear some confusions and more importantly, to clarify the inherent energy loss mechanisms and propose reliable methods for the characterization of dielectric, elastic and piezoelectric losses to provide a resource for researchers and engineers interested in high power electromechanical devices.
1.4 Scope of this article
The article will be divided into 7 sections. In Section 1, the background of ferroelectricity is briefed, and the motivation in the study of energy losses in ferroelectric materials is given. In Section 2, theories on energy losses in ferroelectrics will be surveyed, with the emphasis on the relationship between mechanical Qm and experimentally measured quality factors Qr or Qa. Then, a universal method describing various losses in ferroelectrics is proposed. In Section 3, various methods for ferroelectric materials characterization, especially those for evaluating the loss behavior, will be surveyed and discussed. In Sections 4 and 5, the mechanisms of energy loss will be investigated in terms of intrinsic and extrinsic contributions, which correspond to polarization elongation/rotation (lattice deformation), and ferroelectric domain and/or grain effects. In Section 6, loss behavior of selected ferroelectric materials, including perovskite ferroelectric ceramics, relaxor-PbTiO3 single crystals, as well as lead-free piezoelectric single crystals, are analyzed. Finally, in Section 7, a summary and future perspective will be given and emerging future topics are suggested.
2. Theories on energy losses
2.1 Basic concepts
2.1.1 Elastic, dielectric and piezoelectric losses
The material constants reported in the literature usually do not include energy losses, while in reality, materials constants of the ferroelectrics are complex quantities, which could be expressed in the following form [47, 59–62]:
| (1a) |
| (1b) |
| (1c) |
where tan γ, tan δ and tan θ are the elastic, dielectric and piezoelectric losses, respectively. These imaginary parts reflect delayed responses under corresponding external stimuli. Please note that the power dissipation of a passive material must always be positive, however, the piezoelectric loss tan θ might either positive or negative and there are many constraints on the permitted values of the elastic, dielectric, and piezoelectric losses [51, 59]. Some of these “losses” only represent the time shifted response, may not be real “energy loss”
2.1.2 Mechanical quality factor
The mechanical loss of the material is generally described by its reciprocal quantity, i.e., the mechanical quality factor Qm, which is proportional to the ratio of the total stored mechanical energy over the energy loss within one complete vibration cycle,
| (2) |
where Wm is the total stored mechanical energy and wm is the loss of the mechanical energy.
In general, Qm is associated with the spatial amplitude attenuation coefficient α of the mechanical waves [63–64],
| (3) |
where λ, v, f are the wavelength, wave velocity and frequency of mechanical wave, respectively. For a mechanical vibrator, Qm can be characterized by the bandwidth of the resonance peak, i.e. [26],
| (4) |
where f0 is the center frequency of the vibrator, Δf is the 3 dB or half power bandwidth. Thus, the mechanical quality factor Qm of a piezoelectric material can be derived either from the measurement of the spatial amplitude attenuation coefficient α of the propagating mechanical waves, or from the half power bandwidth of the piezoelectric vibrator.
2.2 Vibration modes of piezoelectric resonators
Piezoelectric vibration modes can be categorized to stiffened and unstiffened modes. Here the terms ‘stiffened’ and ‘unstiffened’ refer to whether the mechanical vibrations of the resonators are coupled to electric polarization through piezoelectric effect.
2.2.1 Stiffened modes
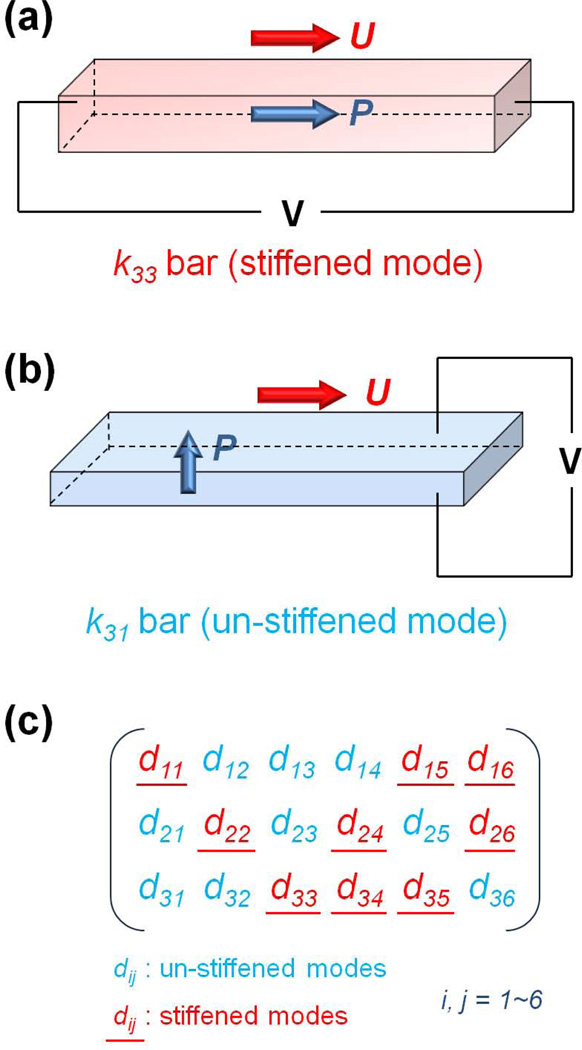
For example, the particle vibration displacement u of k33 and kt bar resonators is parallel to the direction of polarization (P), as shown in Fig. 4(a). When the resonators vibrate, the polarization amplitude will be modulated. In this case, the electric field or the gradient of electric potential generated through piezoelectric effect is a function of spatial coordinates and time. As a consequence, the mechanical motion is coupled to electric charge generation, so that the relevant elastic constants involved in the wave equation are those under constant electric displacement D, i.e., or , etc. Generally, the stiffened elastic constants are larger, i.e., and .
Figure 4.
Schematic of piezoelectric resonators for (a) stiffened k33-mode and (b) unstiffened k31-mode. The particle vibration displacement is parallel to the direction of polarization in stiffened modes, while for unstiffened modes the particle vibration displacement is perpendicular to the polarization. The red arrows denote the direction of particle vibration displacement u and the blue ones denote the macroscopic polarization P of piezoelectric materials. A 3×6 schematic matrix describing vibration modes is given in (c), where the stiffened modes are underlined and marked as red while the blue ones are unstiffened modes.
2.2.2 Unstiffened modes
On the contrary, the particle vibration displacement of k36-plate, k31- and k32-bar resonators is perpendicular to the polarization, as shown in Fig. 4(b). Thus, the polarization will not change with the vibration of the resonator. In this case, there are no electric charges generated along the vibration direction through the piezoelectric effect, where the electric field is equal to the externally applied electric field and maintains the same, so that the relevant elastic constants are those under constant electric field, i.e., and , etc. These transverse and face shear vibrations are in unstiffened modes. All stiffened and unstiffened modes are summarized in Fig. 4(c).
It should be noted that the discrepancy between elastic loss tan γ and mechanical loss 1/Qm exists in some vibration modes. For the ‘stiffened’ modes, such as k33-, k15-, and kt-modes, the mechanical energy is not always the same as the elastic energy, but is a coupled result of the elastic and electric energies due to the piezoelectric effect [52]. Thus, in these stiffened modes, the mechanical loss comes from elastic, dielectric and piezoelectric losses, and they reflect the energy loss characteristics of piezoelectric devices.
2.3 Electromechanical quality factor
For a piezoelectric vibrator, there exist two characteristic frequencies: resonance and antiresonance frequencies, from which two mechanical quality factors can be defined, as shown in Fig. 3,
| (5a) |
| (5b) |
where fr and fa are the resonance and antiresonance frequencies of the resonator, respectively, Δfr and Δfa are the corresponding 3 dB bandwidths. People usually use Qr as the parameter for energy loss in piezoelectric materials, the importance of Qa has also been demonstrated [65–67]. Moreover, it was reported that the calculated values of Qr and Qa using Eq. (5) can be much different from each other [47, 52], leading to the confusion of choosing which one as the actual mechanical Qm factor. Thus, it is necessary to understand the relationship between Qr (or Qa) and Qm.
In order to clarify confusions in stiffened and unstiffened modes, longitudinal k33-mode and transverse (lateral) k31-mode are selected as examples in the following analysis. k33-mode is a classic stiffened mode, while k31-mode is a typical unstiffened mode. In addition, both k33-mode and k31-mode are the lowest frequency modes, which do not suffer interference with other vibrations.
For a k33 bar, the complex electric impendence Zn can be written as
| (6) |
Here, fa is the antiresonance frequency, l = v/2fa is the length of the k33 bar, is the static capacitance, wt is the cross section area of the bar, κ* = κ − jα is the complex wave number, in which the real part is κ = 2π f/v. Based on Eq. (3) we have
| (7) |
Generally, the attenuation coefficient is frequency-dependent, i.e.,
| (8) |
Then, Eq. (7) can be rewritten as
| (9) |
Here, the superscript ‘*’ indicates complex constant and Qm (ωa) is the mechanical quality factor of the k33 bar at its antiresonance frequency.
Considering the losses are small, the complex electromechanical coupling factor can be written as
| (10) |
Here, we set tan μ = (tan γ + tan δ − 2 tan θ), where tan γ is the loss factor of , while tan δ and tan θ are the loss factors of and , respectively. Substituting Eqs. (9) and (10) into Eq. (6), the complex electric impendence Zn can be expressed as
| (11) |
Thus, we can see that the magnitudes and bandwidths of Zn at resonance and antiresonance frequencies are dependent on the Qm, tanμ and k33.
In order to clarify the effects of Qm and tanμ on the impedance spectrum, simulations are performed. In this simulation, a random value is first assigned to Qm, then the complex impedance curves are calculated based on the assumed values of tanμ (N = 2 was set in all calculations, based on the experimental results of the attenuation of longitudinal wave in relaxor-PT crystals) according to Eq. (11). Subsequently, the values of Qr and Qa are derived from the 3 dB bandwidth of the calculated impedance curves. This process is repeated for different Qm values, thus, the relation between Qr, Qa, Qm, tanμ and k33 can be established.
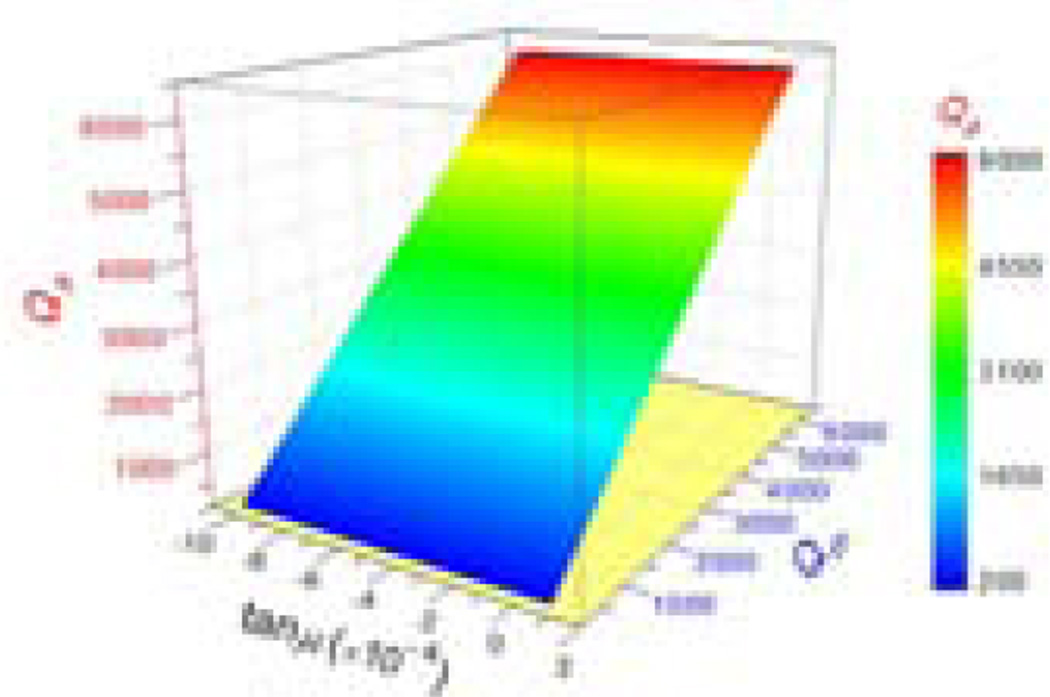
A typical simulation result is shown in Fig. 5. It is interesting to note that Qa calculated based on Eq. (5) showed the same value of the assigned mechanical quality factor Qm, regardless of tanμ and k33 values. It is worthy to remember that for stiffened modes, the mechanical loss of piezoelectric materials are associated with elastic, dielectric and piezoelectric losses, thus, it is reasonable to expect that Qm depends on tanμ. On the other hand, the calculated Qa was found to be equal to Qm no matter for what values of tanμ and k33, as shown in Fig. 5. The logical conclusion is that the Qm and Qa are the same this mode:
| (12) |
Figure 5.
Antiresonance quality factor Q33−a as functions of mechanical quality factor Qm and tanμ. For stiffened k33-mode, Q33−a = Qm, as given by Eq. (11) in Section 2.3.1.
It was observed from the simulations that the Qr factor calculated by Eq. (5), i.e., from the 3 dB bandwidth of the impedance curve in the vicinity of the minimum impedance frequency or resonance frequency, exhibited different behavior from Qa, as shown in Fig. 6. The Qr value is not always the same as Qm but similar to Qa, it strongly depends on the values of tan μ and k33. To see the difference between Qa and Qr more clearly, the contour maps of Qr /Qa as functions of tan μ and k33 are plotted in Fig. 7. One can see that Qr is almost equal to Qa, or Qm when electromechanical coupling factor is low (k33 = 0.4). On the contrary, when k33 is high (~ 0.9), the value of Qr /Qa changes rapidly. It can be concluded that the strong electromechanical coupling (k33 ~ 0.9) introduces additional effect on the energy loss in the vicinity of the resonance frequency, leading to an obvious difference between the values of Qr and Qa (mechanical quality factor Qm). This phenomena had also been reported for PZT ceramics (k33 ~ 0.7) [47], confirming that Qr < Qa (Qm) in the k33-mode. Similarly, one can show that this is true also in other stiffened vibrations (k15-, k24- and kt-mode), especially for materials with high electromechanical coupling factors, such as relaxor-PT crystals.
Figure 6.
Resonance quality factor Q33−r as functions of mechanical quality factor Qm, and tanμ for various k33 values: (a) k33 = 0.4; (b) k33 = 0.7; (c) k33 = 0.9. It can be observed that Q33−r value strongly depends on the values of Qm, tanμ and k33. Furthermore, for high k33 case, Q33−r value shows drastic changes as tanμ varies, attributed to the complex form of electromechanical coupling factor.
Figure 7.
Comparison of the Q33−r /Q33−a value in the Qm - tanμ region for various k33 values: (a) k33 = 0.4; (b) k33 = 0.7; (c) k33 = 0.9. The strong electromechanical coupling effect introduces an obvious difference between the values of Q33−r and Q33−a, as confirmed by the dark blue (Q33−r << Q33−a) and red areas (Q33−r >> Q33−a) shown in (c).
For a k31 bar, the complex electric admittance Yn can be written as
| (13) |
Here, fr is the resonance frequency, l = v/2fr is the length of the k31 bar, is the static capacitance, wt is the electroded cross section area of the bar, κ* =κ − jα is the complex wave number, in which the real part is κ = 2π f/v. The attenuation coefficient is frequency-dependent, which can be derived as
| (14) |
Here, the superscript ‘*’ indicates complex constants and Qm (ωr) is the mechanical quality factor of the k31 bar at the resonance frequency.
Considering the losses are small, the complex electromechanical coupling factor can be written as
| (15) |
Here, tan μ = (tan γ + tan δ − 2 tan θ), where tan γ is the loss factor of , while tan δ and tan θ are the loss factors of and , respectively. Substituting Eqs. (14) and (15) into Eq. (13), the normalized complex electric admittance Yn can be written as
| (16) |
Thus, one can see that the magnitude and bandwidth of Zn at resonance and antiresonance frequencies are dependent on Qm, tanμ and k31. The values of Qr and Qa can be derived from the 3 dB bandwidth of the calculated impedance curves, and the relation between Qr, Qa, Qm, tanμ and k31 can be established.
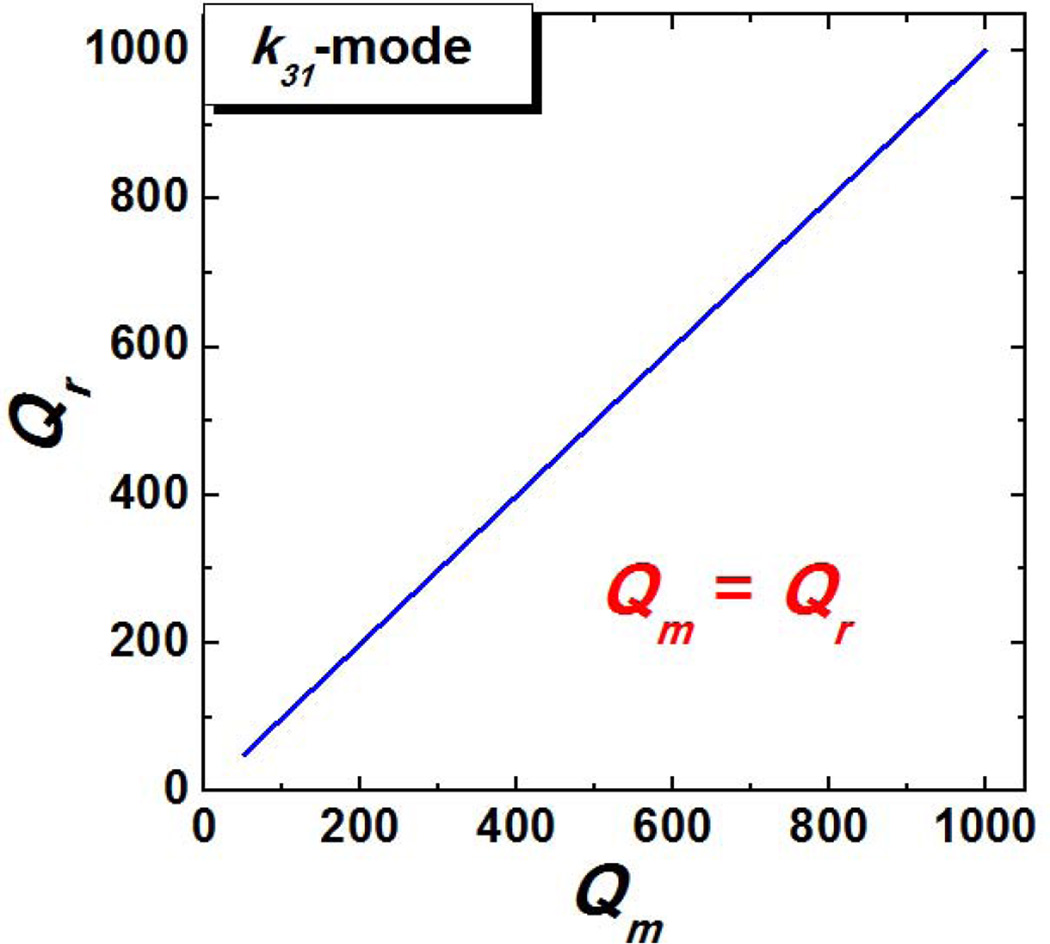
Fig. 8 shows a typical calculated result of Qr − Qm relationship. Note that for unstiffened k31-mode, Qr showed the same value as the mechanical quality factor Qm, regardless of the values of tanμ and k31. This result is different from Eq. (12) for the k33-mode. Furthermore, for unstiffened k31-mode, the amplitude spatial attenuation coefficient α for the longitudinal wave propagating along a k31 bar can be expressed as,
| (17) |
Then,
| (18) |
Thus, it can be concluded that for unstiffened modes, there is no discrepancy between elastic loss tan γ and mechanical loss 1/Qm.
Figure 8.
Typical theoretical result of resonance quality factor Q31−r as a function of mechanical quality factor Qm. For unstiffened k31-mode, Q31−r was found to equal to Qm and independent of tanμ and k31, as given by Eq. (17) in Section 2.3.2.
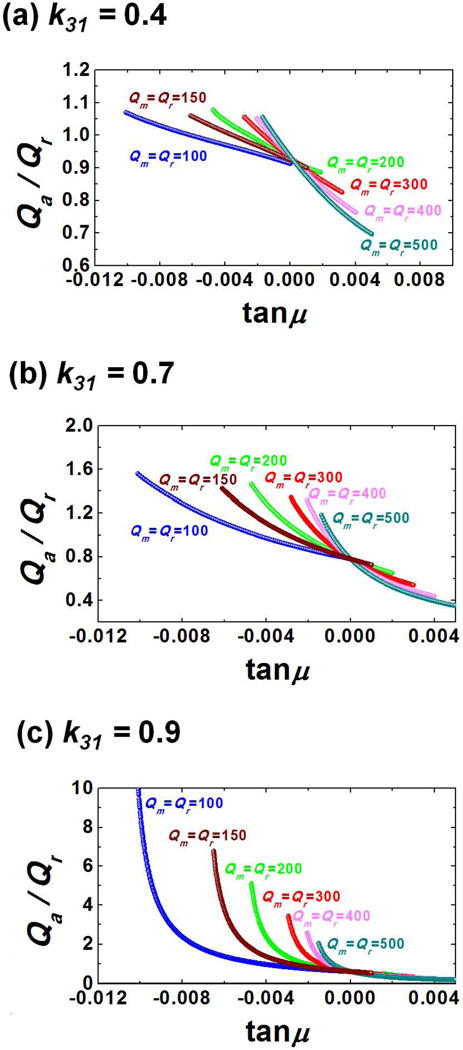
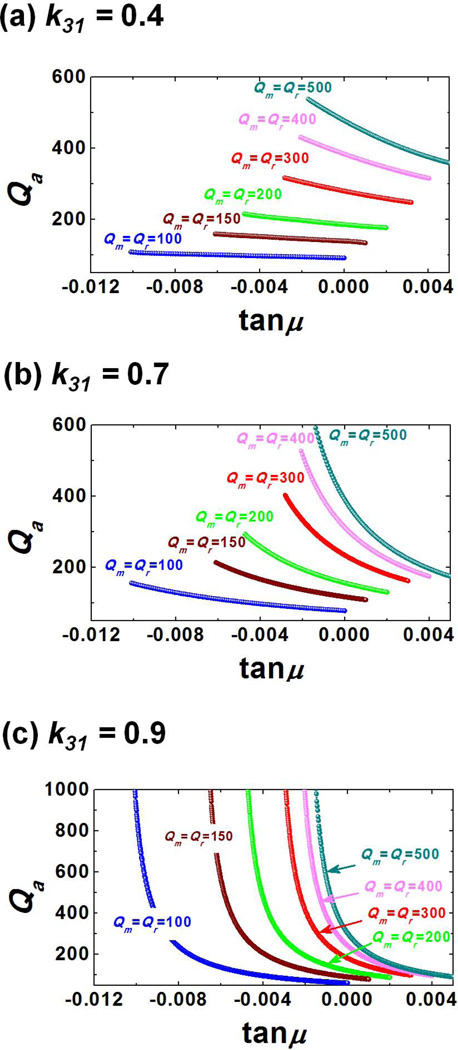
It was observed that the factor Qa exhibited different behavior from Qr for the k31 mode. The Qa value is not always the same as Qm, but strongly depends on the values of tan μ and k31, as shown in Fig. 9. Figure 10 shows the Qr/Qa value as functions of tan μ and k31. It is clear that for the case of high k31 (~ 0.9), Qr/Qa changes rapidly. Thus, it can be concluded that higher electromechanical coupling (k31 ~ 0.9) introduces additional energy loss in the vicinity of the antiresonance frequency, leading to an obvious difference between the values of Qr and Qa.
Figure 9.
Antiresonance quality factor Q31−a as a function of tanμ and selected Qm for various k31 values: (a) k31 = 0.4; (b) k31 = 0.7; (c) k31 = 0.9. It can be observed that Q31−a value strongly depends on the values of Qm, tanμ and k31. Q31−a value changes rapidly as tanμ varies for the high k31 case.
Figure 10.
Comparison of the Q33−r /Q33−a value for various k31 values: (a) k31 = 0.4; (b) k31 = 0.7; (c) k31 = 0.9. For unstiffened k31-mode, the strong electromechanical coupling effect also introduces an obvious difference between the values of Q31−r and Q31−a, similar as the stiffened k33-mode.
As suggested by Eqs. (12) and (18), Qa in stiffened modes and Qr in unstiffened modes have the same values as the mechanical quality factor Qm. To distinguish Qr in stiffened mode and Qa in unstiffened mode from actual mechanical quality factor Qm, we define them as ‘Electromechanical quality factor’ due to their strong electromechanical coupling dependence.
2.4 Theoretical determination of elastic, dielectric, and piezoelectric losses
As mentioned above, the elastic, dielectric and piezoelectric losses are coupled to each other via piezoelectric effects in ferroelectric materials. It is necessary to investigate the individual loss for better understanding the energy dissipation behavior in ferroelectric materials. In experiments, only the combined effect can be obtained from either the ultrasonic attenuation or resonance bandwidth measurements. There are limited reports in the literature trying to separate these three losses [47]. In addition, those quasi-static measurements may not reflect the dynamic behavior of the resonator, because the losses are usually frequency dependent. As can be seen from the above theoretical analysis, Qr of the k33-mode and Qa of the k31-mode are very sensitive to the value of tanμ, which may offer an approach to separate the elastic and piezoelectric losses.
Let us take k33-mode as an example to analyze the situation. It is reasonable to make the following assumptions:
The investigated vibrator is a perfect insulator to exclude the effect of space charges.
Clamped dielectric loss is much higher than the free dielectric loss. Thus free dielectric loss tan δ can be directly measured using an LCR meter at the frequency far below the mechanical resonance of the studied samples.
On the other hand, the amplitude spatial attenuation coefficient α for the longitudinal wave propagating along a k33 bar can be expressed as,
| (19) |
where . By combining Eqs. (19) and (3), we have
| (20) |
Now Qa can be determined by Eq. (5) from the measured impedance curve of k33 bar resonator, which equals to Qm according to Eq. (12). Then the impedance curves can be calculated by Eq. (6) based on the measured k33 and Qm, with tanμ as a variable parameter. The value of tanμ can be extracted by matching its value to the Qr value determined by Eq. (5). The elastic loss tan γ can be calculated based on Eq. (20) with known Qm and tanμ. Finally, the piezoelectric loss can be determined from the measured dielectric loss tan δ and the following relationship
| (21) |
For the k31-mode, the elastic loss tan γ can be obtained from the measured Qr value and Eq. (18). Then, the value of tanμ can be extracted by fitting its value to Qa. The piezoelectric loss tan θ can be determined from Eq. (21).
2.5 Relaxation process and energy losses
Various relaxation/hysteresis mechanisms have been proposed to explain energy loss in ferroelectrics [23, 48, 50, 68–76]. The concept of relaxation was introduced by Debye to describe the frequency dependent time delay in the response of dipoles to an external applied field, considering the reorientation of the non-interacting dipoles in a purely viscous environment without an elastic restoring force. Based on the assumption, the expression for the complex permittivity was given as [77–78],
| (22) |
where τ is the relaxation time and ωτ = 2π/τ is the relaxation frequency or loss peak frequency. ε0 is the permittivity at low frequency (ω << ωτ) and ε∞ is the permittivity at high frequency (ω >> ωτ). Then, the separated real and imaginary parts of the permittivity are:
| (23a) |
| (23b) |
where χ' (ω) and χ"(ω) are the real and imaginary parts of the dielectric susceptibility, respectively.
An assumption in the Debye’s model is that all dipoles have the same relaxation time, which needs a correction for real ferroelectric materials, thus, the following equation was proposed by K.S. Cole and R.H. Cole [49, 79],
| (24) |
where the empirical parameter β represents the deviation from ideal Debye model and a distribution of the relaxation time. Then, the produced loss spectrum can be described by
| (25) |
A.K. Jonscher proposed the concept of ‘universal dielectric response’ [80–83], in which the normalized dielectric loss χ"/χ"m and the normalized frequency ω/τ obey the general relationship
| (26) |
where χ"m is the value at loss peak. Also, useful extensions were made,
| (27) |
and
| (28) |
Later, D.C. Salter discussed the ‘frequency domain’ and ‘time domain’ responses of dielectric loss for the three types of relaxation processes (Debye’s, Cole-Cole’s and Jonscher’s) [84], as shown in Figs. 11 and 12, respectively. Obviously, lower energy loss requires shorter relaxation time or faster response. Also, it can be concluded that such energy loss is time-dependent and a kinetic process. Here, the term ‘energy loss’ can also be extended to elastic and piezoelectric losses, as well as mechanical losses, since they were all treated as relaxation processes in ferroelectrics.
Figure 11.
Frequency domain response of dielectric loss for (a) Debye, (b) Cole-Cole, and (c) Jonscher models. The symbols show the slopes of the line to which the loss peaks are asymptotic. Adapted from Ref. [68].
Figure 12.
Time domain response of dielectric loss for (a) Debye, (b) Cole-Cole, and (c) Jonscher models. The symbols show the slopes of the line to which the loss peaks are asymptotic. Adapted from Ref. [68].
3. Experimental methods for characterization of ferroelectric materials
In this Section, the ways to determine the fundamental ferroelectric physical properties, including Curie temperature, coercive field as well as piezoelectric coefficients, will be reviewed. Then, the methods for loss characterization of ferroelectric materials will be discussed.
3.1 Determination of the Curie temperature
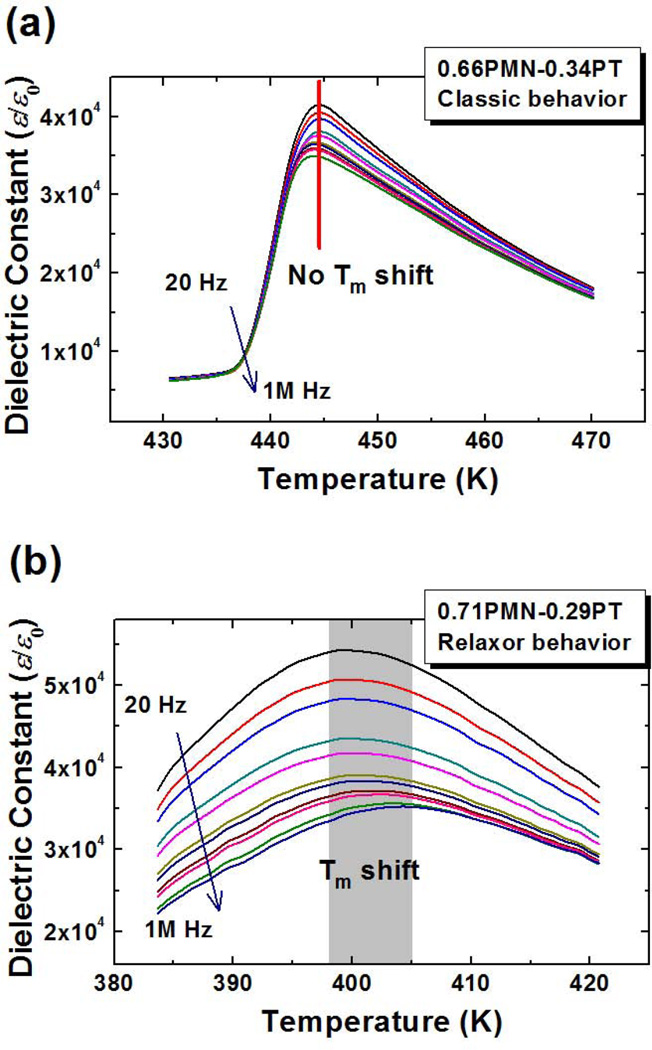
Ferroelectric phase transitions are always associated with a dielectric anomaly, thus from the measured temperature-dielectric permittivity relationship, the Curie temperature TC can be determined to be the temperature of the permittivity maximum Tm. The above method is reliable for typical ferroelectrics, such as BaTiO3 (BT) and PbTiO3 (PT), however, it should be used with caution for relaxor ferroelectrics since polar-glass systems are characterized by a strong frequency dispersion of the dielectric maxima [85–91]. It is commonly accepted that all polar-glass systems possess two key features: 1) disordered clusters; 2) a competition of interactions among clusters leading to the freezing of polarization fluctuations. For a polar-glass system, the frequency dependence of the dielectric maximum temperature can be described by the Vogel-Fulcher relationship [92–95],
| (29) |
where Ea is the activation energy, TVF is the Vogel-Fulcher temperature or static freezing temperature, Tm is the temperature of the permittivity maximum, kB is the Boltzmann constant, and fD is the Debye frequency. Fig. 13 shows the temperature and frequency dependent dielectric behavior of [001]c cut relaxor-PT single crystals. For the measured frequency range (from 20 Hz to 1MHz), there is no ‘Tm shift’ or relaxor behavior observed in tetragonal 0.66PMN-0.34PT single crystals with rich PT content (see Fig. 13(a)). On the contrary, the rhombohedral 0.71PMN-0.29PT single crystals exhibit typical relaxor behavior, for which the magnitude of the dielectric constant decreases and the dielectric maximum shifts to higher temperature with increasing frequency, as shown in Fig. 13(b).
Figure 13.
Temperature and frequency dependent dielectric behavior of [001]c cut (nonpoled) relaxor-PT single crystals: (a) 0.66PMN-0.34PT; (b) 0.71PMN-0.29PT. ‘Tm shift’ denotes the shift of temperature of the dielectric maximum with frequency from 20 Hz to 1M Hz. Classic and relaxor-like ferroelectric behaviors were observed in 0.66PMN-0.34PT and 0.71PMN-0.29PT single crystals, respectively.
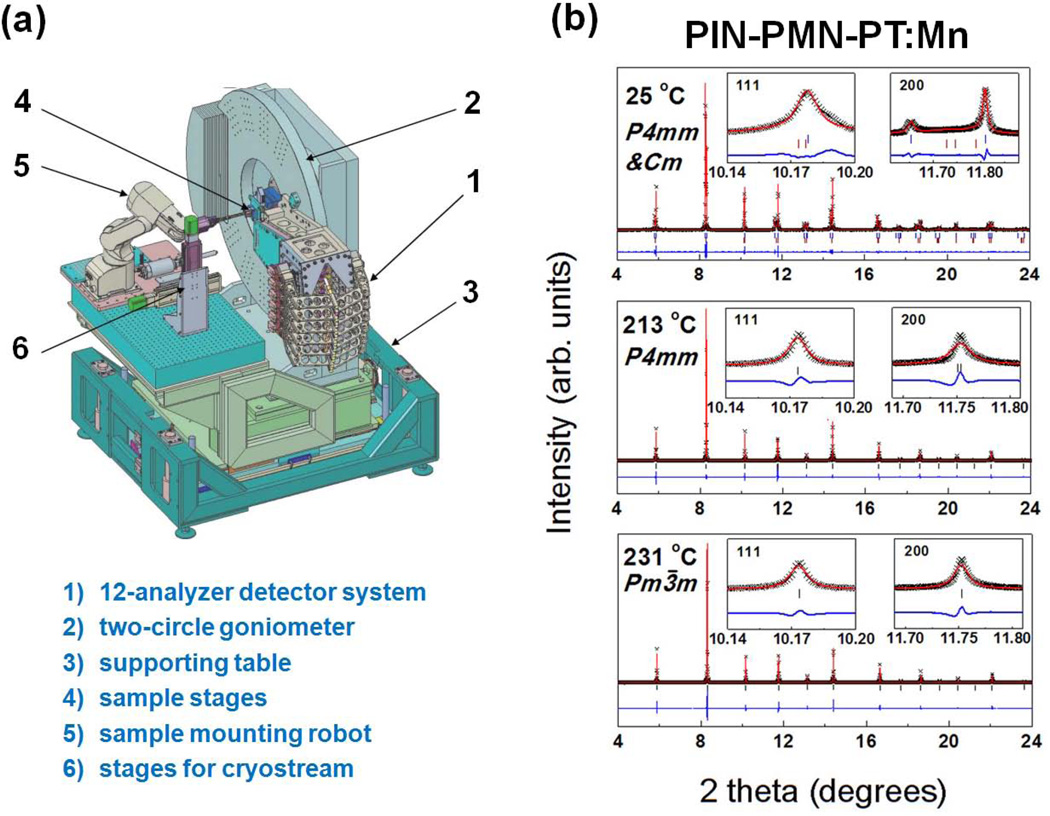
The Curie temperature can be also determined from the XRD analysis. But for ferroelectrics with a composition close to a phase boundary, the lattice parameters of R, O, M, and T phases are similar and very difficult to distinguish [96–101]. Therefore, high energy XRD methods, especially those synchrotron-based XRD with ultrahigh angular resolution have been applied to investigate the crystal structures and determine the phase transition temperatures. Fig. 14(a) gives the schematic drawing of a three-dimensional model of 12-analyzer detector system, which is the core instrument of the 11BM beamline, a dedicated high-resolution high-throughput X-ray powder diffraction beamline at the Advanced Photon Source (APS) [102]. The results in Fig. 14(b) for Mn doped PIN-PMN-PT single crystal showed the presence of mix-phases (both the monoclinic and tetragonal phases) can be clearly distinguished [103].
Figure 14.
High resolution synchrotron-based x-ray diffraction: (a) schematic drawing of a 3D model of 12-analyzer detector system, employed by 11BM beamline, Advanced Photon Source (APS), Argonne National Laboratory (ANL); (b) experimental and refinement results of Mn doped PIN-PMN-PT single crystal. Adapted from Refs. [102–103].
3.2 Determination of the coercive field
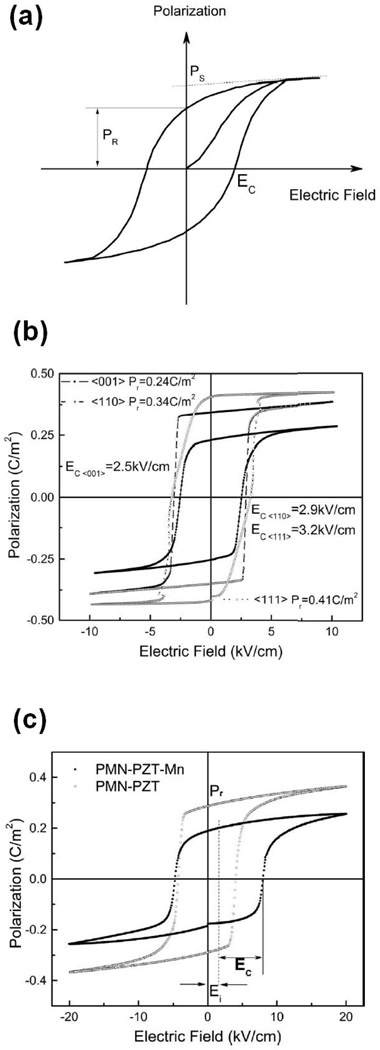
Coercive field of ferroelectrics can be obtained from the polarization-electric field (P-E) hysteresis loop, which is demonstrated as the ‘fingerprint’ of these ferroic materials [104]. Fig. 15(a) is a typical P-E loop, from which the coercive field (Ec), spontaneous polarization (Ps) and remnant polarization (Pr) can be directly extracted. Note that for ferroelectric single crystals with crystalline anisotropy, the remnant polarization and coercive field were found to be dependent on the orientation, as shown in Fig. 15(b) [105]. Furthermore, for some acceptor (such as manganese) modified ferroelectric ceramics and/or crystals, one can observe the internal bias field (Eint) [53]. To obtain the real coercive field, Eint should be subtracted from the value of positive applied field where the data line crosses zero polarization, as shown in Fig. 15(c).
Figure 15.
(a) A typical P-E loop, from which the coercive field (Ec) together with other ferroelectric parameters can be obtained. (b) P-E loops for 0.7PMN-0.3PT single crystals along [001]c, [011]c, and [111]c, from which anisotropic behavior was observed. (c) P-E loops of pure and Mn modified 0.40Pb(Mg1/3Nb2/3)O3–0.25PbZrO3–0.35PbTiO3 (PMN-PZT) single crystals, measured at 20 kV cm−1 Field. The internal bias field (Eint), being on the order of 1.6 kV cm−1, was observed in Mn doped crystals. Adapted from Refs. [53, 105].
3.3 Characterization of piezoelectric coefficients
There are at least four ways that can be used to determine piezoelectric coefficients, i.e., Berlincourt d33 meter, measuring the slope of strain-electric field (S-E), electrical impedance spectrum method and resonance ultrasonic spectroscopy (RUS) method. Berlincourt d33 meter and the slope of S-E curve give quasi-static values, in which the testing frequencies are much lower than the fundamental resonance frequencies of piezoelectric resonators, while the electrical impedance spectrum method and RUS are dynamic methods.
The Berlincourt d33 meter is commonly used for testing piezoelectric materials. In manufacturing process, PZT products are almost 100% tested by d33 meter [106]. Note that although d33 meter is usually employed in measuring the longitudinal piezoelectric coefficient d33, it is also be used to determine lateral and shear piezoelectric constants d31 and d15 [107]. However, possible errors can be generated from some sources. First, the misfit between the size of jaws of the d33 meter and the sample makes the mechanical boundary conditions not well defined; second, it is not always pressed the sample disc with fully electrode faces in the center, which is recommended in the IEEE Standard [57]; third, the standard sample geometry was not used in most cases. It is a common knowledge that the d33 value measured by the d33 meter is often larger than values obtained from the impedance method.
Measuring the slope of S-E curve is another quasi-static method determining piezoelectric coefficients. From the S-E measurement, the piezoelectric coefficient d may be determined by
| (30) |
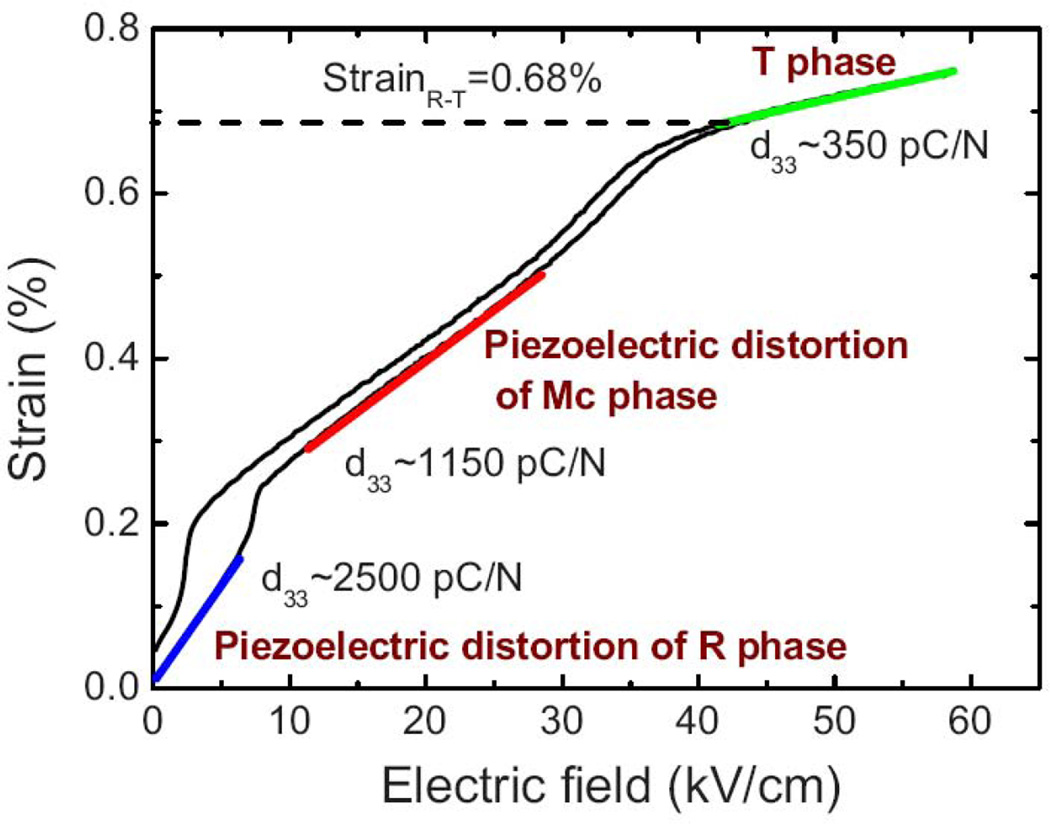
Note that ferroelectric-ferroelectric phase transitions could be induced by high enough electric fields, thus, the measured piezoelectric coefficient d should be the value at small E field. Fig. 16 shows the strain vs. electric field behavior for [001]c oriented 0.7PMN-0.3PT single crystal [108]. At room temperature under zero bias conditions, [001]c oriented 0.7PMN-0.3PT has rhombohedral crystal symmetry with ‘4R’ domain configuration. When an electric field is applied along [001]c, the polarization is expected to incline towards the electric field direction in each domain, resulting in lattice distortion that produces average longitudinal strain along [001]c. As the applied electric field increases, rhombohedral-monoclinic and monoclinic-tetragonal phase transitions occurred sequentially, which was confirmed by high-energy x-ray-diffraction [109].
Figure 16.
S-E hysteresis for 0.7PMN-0.3PT single crystals measured at 1 Hz, from which electric field-driven phase transition was observed and piezoelectric coefficient was determined based on Eq. (29). Adapted from Ref. [108].
Measuring the S-E slope is generally used to determine the piezoelectric coefficients d33, d31 and d32 for ferroelectrics. To determine the full matrix piezoelectric constants, especially those shear parameters, such as d15 and d24, impedance/ultrasonic pulse-echo method was suggested [36]. By using samples with required aspect ratios, the elastic constants and electromechanical coupling factors for a certain piezoelectric mode may be calculated by measuring the resonance and antiresonance frequencies of the piezoelectric resonator, from which the piezoelectric coefficients can be derived.
3.4 Rayleigh method and polarization hysteresis loops
For the case that piezoelectric response is approximately a linear function of the driving-electric field amplitude, the piezoelectric or dielectric nonlinearity and hysteresis can be well described by the Rayleigh equations [50, 110–113],
| (31a) |
| (31b) |
| (31c) |
| (31d) |
| (31e) |
| (31f) |
where αd and βε are the Rayleigh coefficients for the converse piezoelectric effect, and dielectric polarization, respectively, and dint and εint are the zero-field values of the converse piezoelectric coefficient and permittivity, where the subscript ‘int’ means intrinsic effects. Eqs. (31a) and (31d) describe the piezoelectric and dielectric hysteresis, respectively, with the ‘+’ and ‘−’sign solutions corresponding to the descending and ascending electric fields, respectively.
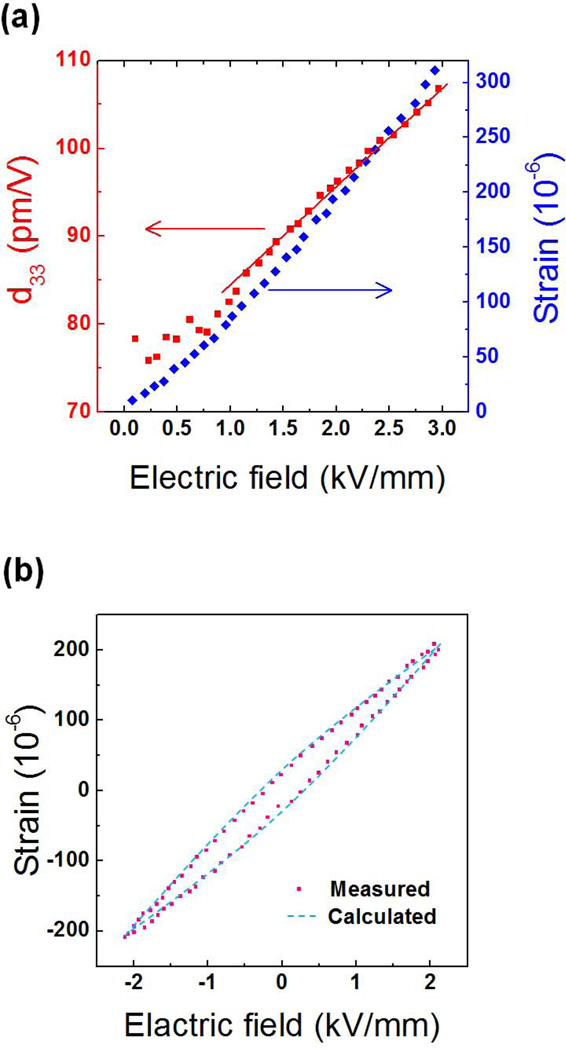
Fig. 17(a) shows the ac field dependent converse piezoelectric effect for a PZT film [48, 114]. Then, by fitting Eq. (31c), the Rayleigh parameter α and intrinsic piezoelectric coefficient dint could be obtained. Consequently, from the obtained dint and α, the S-E loop can be calculated using Eq. (31a), which agrees very well with the experimental results, as shown in Fig. 17(b). Rayleigh method has been widely employed to investigate the intrinsic contribution ratio to the total piezoelectric activity and hysteresis behavior in various ferroelectric materials, including thin films, polycrystalline ceramics and single crystals.
Figure 17.
(a)Field dependence of the strain S and longitudinal piezoelectric coefficient d33. (b) S-E loops in a PZT thin film. In (a) and (b) circles and triangles represent experimental data and solid lines are obtained using Rayleigh relations Eq. (30). Adapted from Refs. [50, 114].
3.5 Characterization of dielectric, mechanical and piezoelectric losses
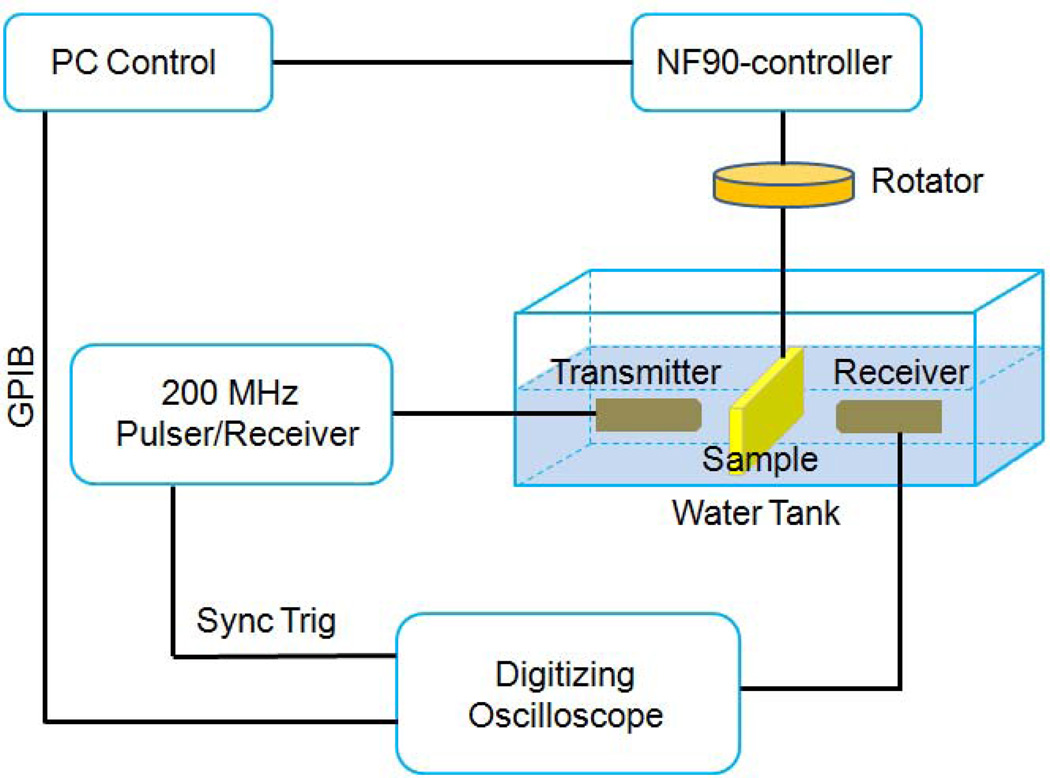
The dielectric loss can be directly measured using an LCR meter, while the mechanical loss can be determined by two methods: the 3 dB bandwidth (as discussed in Section 2.3 and shown in Fig. 3) and ultrasonic attenuation measurements. Fig. 18 gives an experimental setup of ultrasonic spectroscopy measurements [115]. Using the measured amplitude and phase spectra of input and output signals, the phase velocity and attenuation coefficients in the sample can be derived from the damped ultrasonic wave theory. Then elastic constants and mechanical loss can be determined. One of the advantages of ultrasonic spectroscopy technique is that the elastic properties can be investigated at high frequency beyond 100 MHz so that elastic property-frequency relationship can be obtained. Furthermore, ultrasonic technique can be applied not only to study ferroelectrics but also all other solid materials without piezoelectric effect. However, it should be noted that dedicated operation and analysis are required when ultrasonic measurement is employed since the elastic properties, especially the attenuation behavior, are strongly affected by many factors, including sample quality, coupling between transducer and sample, media of acoustic wave propagation, temperature, stress, and so on.
Figure 18.
Experimental setup for high frequency ultrasonic measurement. Adapted from Ref. [115].
There are impedance methods that allow for the determination of the piezoelectric loss [116–119]. However, it also has been suggested that some inconsistent results may be generated [61–62, 120–122]. The difficulties and errors come from at least three contributions: 1) the piezoelectric loss is much smaller than the real part, especially for the high electromechanical coupling case so that it is hard to be measured accurately; 2) random errors will be the same order of magnitude as the piezoelectric loss; 3) there may be cancelations between piezoelectric loss and elastic or dielectric losses.
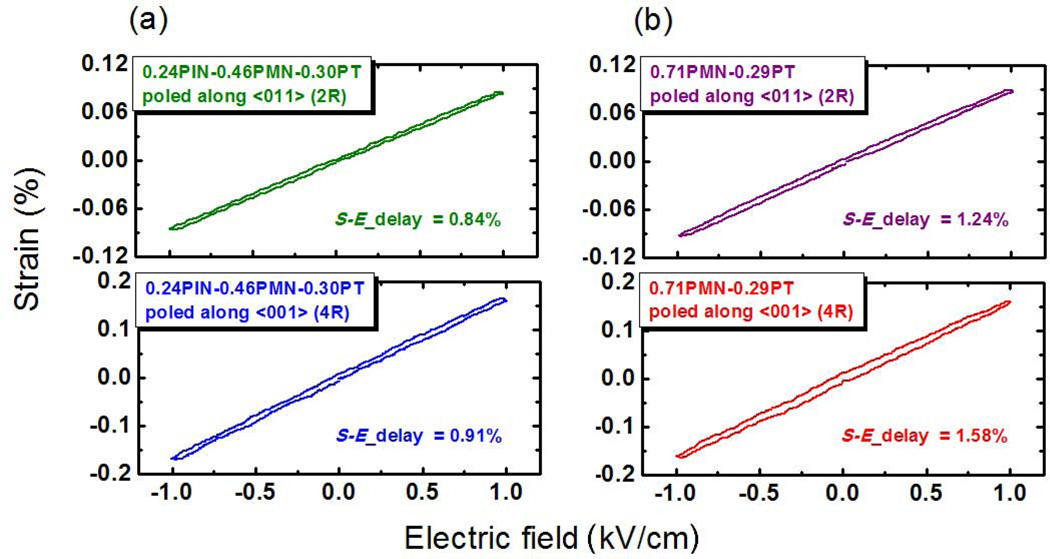
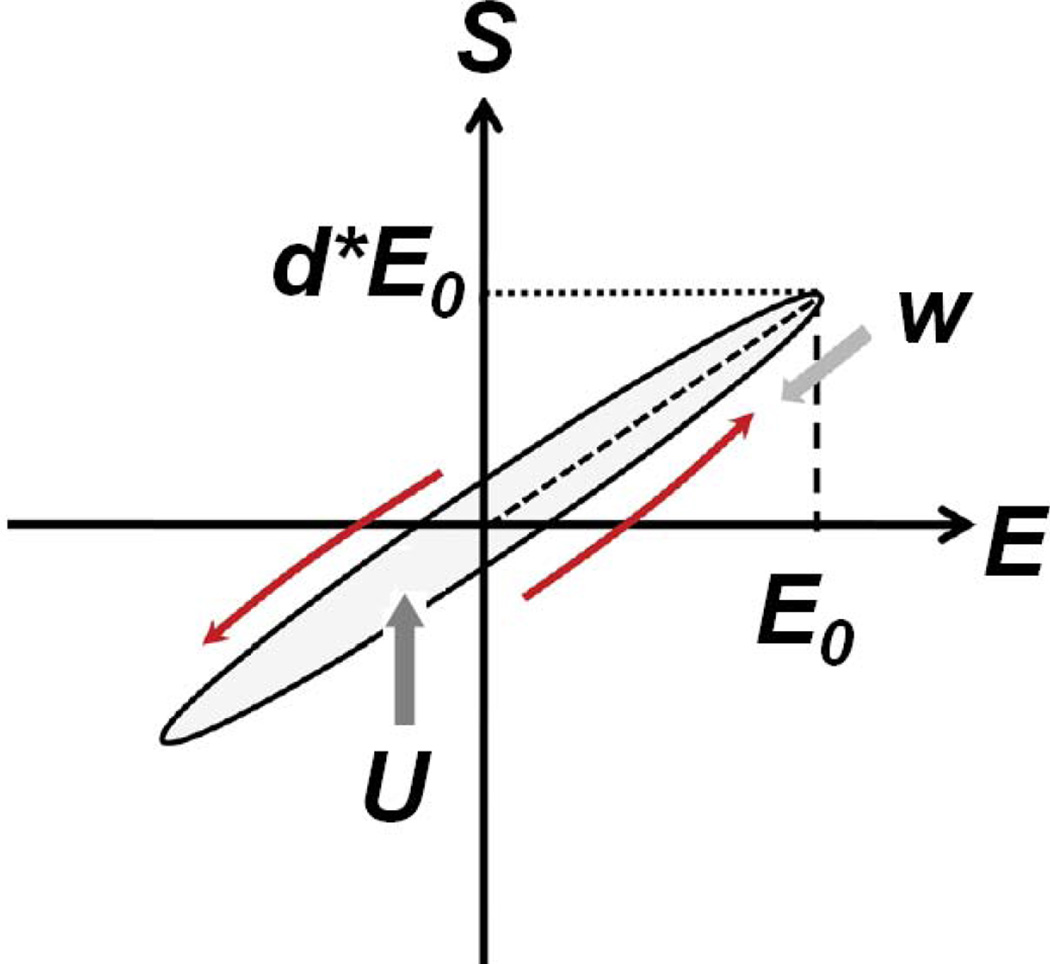
Another method that could determine piezoelectric loss is to measure the S-E hysteresis loop. Fig. 19 shows a schematic S-E loop that can be obtained from Rayleigh measurement. In principle, the phase delay of the strain response under an electric field, S-E_delay, can be calculated using the following equation [47],
| (32a) |
where w is the area integral of the S-E loop, and U is given by
| (32b) |
Considering the fact that all losses are much smaller than 1, we also have
| (33) |
Then, the dielectric loss tan θ can be determined [47]. It should be noted: 1) the loss is sometime electric field-dependent. In order to obtain an obvious hysteresis loop, Rayleigh measurements are usually performed at a relatively high applied electric field compared to the operation field of devices; 2) the loss is frequency-dependent, but the Rayleigh measurement is a quasi-static method, which cannot reflect the dynamic characteristic of a piezoelectric resonator; 3) it is difficult to accurately obtain shear strain as a function of applied electric field. Thus, the piezoelectric loss factor derived from Eq. (32) should be employed with caution.
Figure 19.
Schematic plot for S-E loop.
4. Intrinsic loss mechanisms
Generally speaking, the properties of ferroelectric materials are determined by the intrinsic and extrinsic contributions [19, 68]. The complex materials constants, including dielectric permittivity ε, piezoelectric coefficient d, and elastic compliance s, can be written as a summation of two contributions, considering energy dissipation:
| (34a) |
| (34b) |
| (34c) |
Here, the subscripts in and ex denote the intrinsic and extrinsic contributions, respectively. In other words, not only the real parts, but also the imaginary parts of these material coefficients can be divided into intrinsic and extrinsic contributions.
4.1 Intrinsic effects
For functional responses in ferroelectrics, intrinsic contribution is associated with piezoelectric lattice-deformation while extrinsic contribution mainly comes from the following sources: domain wall motions, grain boundaries, interphase boundaries and defects [123]. The nature of the (converse) piezoelectric effect is closely related to the occurrence of electric dipole moments in piezoelectric/ferroelectric materials, in which the application of an electrical field creates mechanical deformation, or vice versa. Thus, piezoelectric lattice-deformation is inevitably associated with polarization variations. The intrinsic effect may be categorized into polarization rotation and polarization elongation/compression. The intrinsic dielectric loss mechanism has been comprehensively reviewed. It is believed that the intrinsic dielectric loss is due to the anharmonic interaction of electric field with the phonon system of the crystal, and the loss is sensitive to frequency, temperature and crystal symmetry [76].
4.1.1 Polarization rotation
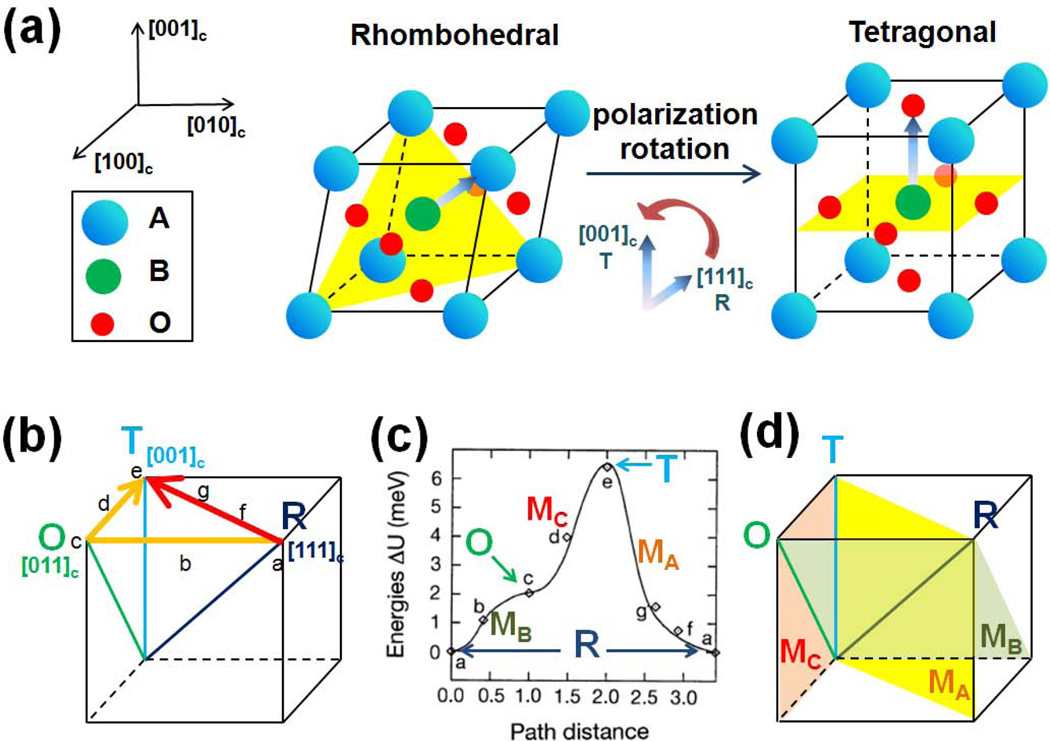
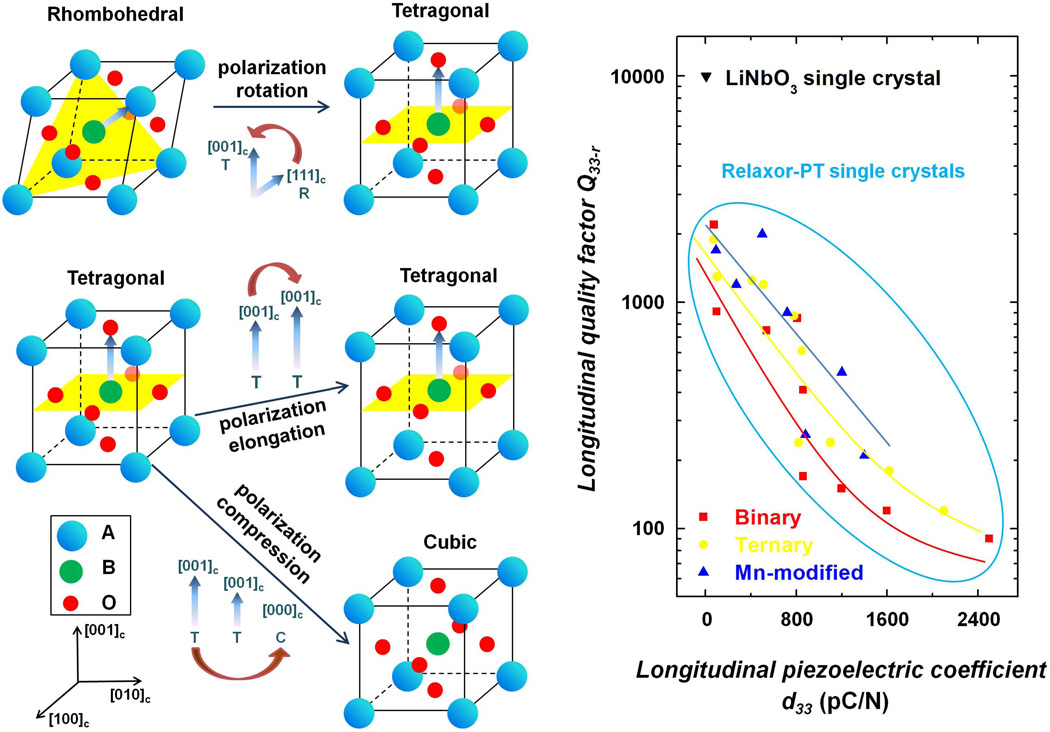
Previous experiments [14, 124–125] confirmed that phase transition from rhombohedral to tetragonal phase can be induced by external electric field in perovskite ferroelectrics, associated with the spontaneous polarization reorientation from [111]c to [001]c direction, as shown in Fig. 20(a). Lattice-deformation associated with such polarization rotation can contribute to the piezoelectric effect. In 2000, Fu and Cohen calculated the free energy profile of BaTiO3 as a function of polarization direction, as shown in Figs. 20(b) and 20(c) [15]. It was found that the free energy profile along the a-f-g path is much flatter than that of the a-b-c-d path, suggesting an easier polarization rotation and more favored lattice-deformation in that fashion. For all symmetries with defined polar directions, including rhombohedral, orthorhombic and tetragonal phases, polarization rotation induces monoclinic structural distortions. Fig. 20(d) shows the mirror planes of monoclinic phases MA, MB, and MC [29, 126]. Position of the polar axis in the monoclinic plane is not fixed, and according to symmetry the polarization may lie anywhere within their mirror planes. Please note that such an unfixed position with respect to the M symmetry does not mean that polarization is freely rotatable by an external field. In general, the permittivity perpendicular to the polar direction is much larger than that along the polar direction. Hence, polarization rotation is much easier than polarization elongation. Currently, easy polarization rotation is believed to be the dominant mechanism for the ultrahigh longitudinal piezoelectric activity in multi-domain relaxor-PT crystals, which is consistent with the high shear piezoelectric response observed in single domain configurations [23–24, 34].
Figure 20.
Polarization rotation. (a) Schematic polarization rotation process in a perovskite unit cell ABO3, from rhombohedral (R) to tetragonal (T) phase, whereby the polarizations are represented by arrows. (b) Two possible rotation paths from R to T: a-b-c-d-e (yellow line) and a-f-g-e (red line). The former is a relatively direct path from R to T, while the later passes through a bridged orthorhombic (O) phase. Spontaneous polarizations of R, T, and O phases are marked as dark blue, light blue, and green, respectively. (c) Related Gibbs free energy for the two rotation paths: a-b-c-d-e and a-f-g-e. Note that a-f path was much flatter than a-b path, meaning a facilitated polarization rotation path. There are three types of monoclinic phases (M) in rotation paths: MA (between R and T), MB (between R and O), and MC (between O and T). (d) Mirror planes of three monoclinic phases MA, MB, and MC, which are marked as yellow, light green and pink, respectively. Adapted from Refs. [15, 29, 127].
4.1.2 Polarization elongation/compression
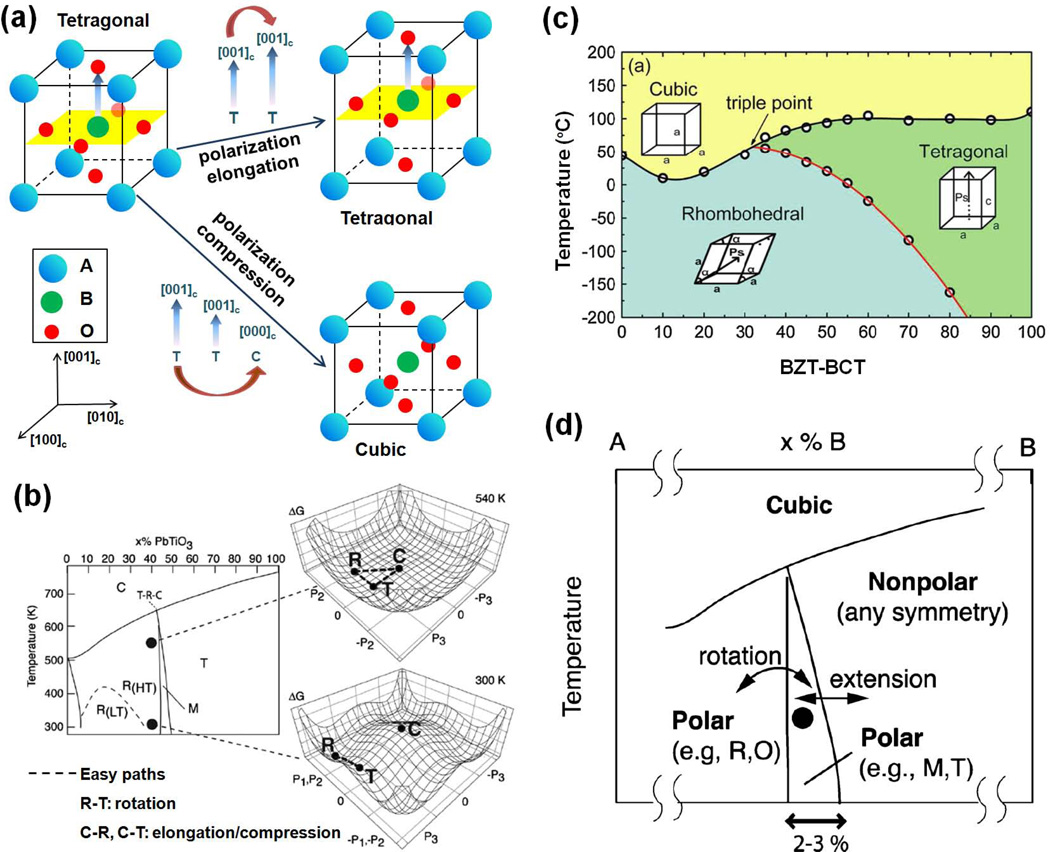
Besides polarization rotation, another mechanism of functional property enhancement is associated with easy paths for polarization elongation/compression (namely polarization extension/contraction) in anisotropically flattened free energy profile [20, 127–133]. Polarization elongation/compression can be induced by temperature, electric field, or composition. For electric field-driven cases, when the dipoles are subject to external field along the polar direction or opposite direction, it will be elongated or compressed, respectively. Polarization elongation will not induce any phase transition or symmetry change, while polarization compression may be associated with ferroelectric-paraelectric phase transitions, as shown in Fig. 21(a). In 2010, Damjanovic calculated the Gibbs free energy profile for PZT with Zr/Ti ratio 60/40 using Landau-Ginsburg-Devonshire theory [127]. As shown in Fig. 21(b), the flattening of energy profile favors both easier polarization rotation (R-T path) and polarization elongation/compression (R-C and T-C paths) at a higher temperature of 540 K than at room the temperature of 300 K. At 540 K, PZT 60/40 is close to the Curie point (R-C transition, polarization elongation/compression) and the MPB (R-T transition, polarization rotation). In fact, both are close to the tricritical point at which T-R-C three phase degenerate. Easier polarization rotation and polarization elongation/compression means weaker structural-stability, which produces enhanced piezoelectric properties. Two well-practiced doping strategies to improve the piezoelectric activity of ferroelectrics at room temperature are: shifting the composition to the morphotropic phase boundary and lowering the Curie temperature to room temperature. The former makes it easier for polarization rotation while the later aims at an easier polarization elongation. A representative case is the high piezoelectric activity of d33 ~ 620 pC N−1 observed in lead-free ceramic system Ba(Ti0.8Zr0.2)TiO3-(Ba0.7Ca0.3)TiO3 (BZT-BCT) at the optimal composition, where the Curie point is less than 50 °C, as depicted in its composition-temperature phase diagram (see Fig. 21(c)) [33]. Note that the temperature-driven ferroelectric-paraelectric phase transition may lead to temperature instability and enhanced functional properties. However, it has disadvantages for practical applications. Therefore, a designed system that that exhibits compositionally driven-phase transitions with easy paths for both polarization rotation and polarization extension is preferred, as shown in Fig. 21(d) [127], where the non-polar part is more like a parent phase and polarization elongation/compression can be easily induced in polar/non-polar phase boundary regions.
Figure 21.
Polarization elongation and polarization compression. (a) Schematic polarization elongation and polarization compression in a perovskite unit cell ABO3 with rhombohedral (R) phase, whereby the polarizations are represented by arrows. When polarization compression is strong enough, ferroelectric-paraelectric phase transition may be induced. (b). Gibbs free energy profile for PZT with Zr/Ti ratio 60/40 at 540 K and 300 K. An easier polarization elongation process can be expected at a higher temperature 540 K, which is closed to the Curie temperature where ferroelectric-paraelectric phase transition. (c) A lead-free piezoelectric ceramic system, BZT-BCT. High piezoelectric activity was observed for optimal composition at room temperature, accounting for the facilitated composition-driven-polarization-rotation and temperature-driven-polarization-elongation/compression. (d) A designed system that exhibits compositionally driven-phase transitions with easy paths for both polarization rotation and polarization elongation/compression. Adapted from Refs. [33, 127].
4.2 Intrinsic loss in single domain ferroelectric crystals
To date, energy dissipation behavior in ferroelectric crystals has not been comprehensively investigated. The lack of such data hinders the optimization of electromechanical devices made of these materials. It has been demonstrated that various domain configurations can be formed in the ferroelectric state by poling the crystals along different crystallographic directions due to the presence of energetically degenerate domain states [29–30]. For relaxor-PT single crystals, 9 domain configurations can be formed, as list in Table 1. Such a rich phase/domain states provide flexibility for us to explore the energy dissipation behavior in ferroelectric crystals, since the formation of domain states can be controlled by applying and electric field. Therefore, we use relaxor-PT single crystals as a model system to investigate the mechanisms of loss behavior in ferroelectric single crystals (detailed in Sections 4.2, 4.3, 4.5, and 5.2). Table 2 gives the longitudinal and thickness shear electromechanical properties of single domain relaxor-PT single crystals (poled along spontaneous polarization direction), from which the intrinsic contributions to various losses were studied. In order to understand the energy loss behavior, both the stability under external driving field and the magnitude of relaxation time are analyzed.
Table 2.
Longitudinal and thickness shear electromechanical properties of relaxor-PT single crystals in single domain state.
| Materials | Vibration mode | Domain configuration | Qr | Qa | d [pC N−1] | k | ψ angle |
|---|---|---|---|---|---|---|---|
| 0.71PMN-0.29PT | k33-mode | 1R | 910 | 950 | 102 | 0.43 | 0° |
| 0.74PMN-0.26PT† | k33-mode | 1R | 2200 | - | 76 | 0.37 | 0° |
| 0.24PIN-0.46PMN-0.30PT | k33-mode | 1R | 1300 | 1600 | 102 | 0.43 | 0° |
| 0.24PIN-0.49PMN-0.27PT | k33-mode | 1R | 1900 | 2100 | 75 | 0.40 | 0° |
| PIN-PMN-PT:Mn (R) | k33-mode | 1R | 1700 | 1820 | 90 | 0.4 | 0° |
| PMN-PT(T) | k33-mode | 1T | 750 | 1450 | 540 | 0.82 | 0° |
| PIN-PMN-PT(T) | k33-mode | 1T | 1200 | 2200 | 510 | 0.83 | 0° |
| PIN-PMN-PT:Mn (T) | k33-mode | 1T | 2000 | 4200 | 500 | 0.82 | 0° |
| PMN-PT(R) | k15-mode | 1R | 20 | 100 | 2300 | 0.93 | 90° |
| PIN-PMN-PT(R) | k15-mode | 1R | 30 | 100 | 3500 | 0.93 | 90° |
| PIN-PMN-PT(T)‡ | k15-mode | 1T | 20 | - | 2200 | 0.85 | 90° |
| PIN-PMN-PT:Mn (O)§ | k15-mode | 1O | 60 | 220 | 3100 | 0.94 | 90° |
4.2.1 Correlation between low losses and difficult polarization elongation
Let us first consider the longitudinal vibration mode (k33-mode) for the [111]c poled rhombohedral phase crystals. It was found that the mechanical quality Qa and electromechanical quality Qr factors (> 1000) of single domain crystals are much higher than those of multi-domain configurations. For the longitudinal vibration k33-mode, it has been experimentally confirmed that the single domain rhombohedral crystals exhibit low levels of longitudinal responses, which can be explained by the Landau-Ginsburg-Devonshire model [29, 134]. For example, the [111]c poled 0.72PMN-0.28PT with single domain state was found to possess lower values of elastic compliance, dielectric and piezoelectric coefficients (, d33 = 97 pC N−1) compared to those of [001]c poled crystals with ‘4R’ multi-domain configuration (, d33 = 1180 pC N−1) [135], exhibiting hard feature under external driving field. Here, the term ‘hard feature under external drive field’ means smaller/lower responsivity to external excitations, such as electric- and stress-field. In addition, in a relaxor system, the structure relaxation time can be expressed by the Maxwell equation [136–137],
| (35) |
where η is the viscosity and G∞ is the elastic modulus at infinite frequency. For a k33 piezoelectric bar, infinite frequency means that the polarization cannot follow the vibration of the acoustic wave, thus the electric displacement D is a constant and . Compared with [011]c and [001]c poled crystals, [111]c poled crystal has a higher elastic constant . In addition, these single-domain crystals have much lower viscosity compared to that of multi-domain crystals due to the absence of domain wall motions. Such phenomenon was also observed in other ferroelectric materials, such as potassium dihydrogen phosphate (KDP) [138–139], triglycine sulfate (TGS) [138], La1−xNdxP5O14 [140], and 0.8PMN-0.2PT [139]. Thus, a shorter relaxation time (higher relaxation frequency) can be expected. Together with the hard feature under external driving field, single-domain rhombohedral crystals exhibit low energy loss, resulting in high quality factors in the longitudinal vibration mode.
On the other hand, [001]c poled tetragonal crystals (with ‘1T’ single domain configuration) were found to possess much higher piezoelectric/electromechanical responses (, d33 ~ 500 pC N−1, k33 ~ 0.8), which can be interpreted by the flatter Gibbs free energy well calculated by Landau-Ginsburg-Devonshire model [29, 134]. On the other hand, these ‘1T’ crystals exhibit comparable mechanical quality factors (> 1400) as those of single-domain rhombohedral (‘1R’) crystals. Compared with the rhombohedral phase, tetragonal phase crystals has much lower [141], leading to a longer relaxation time and lower quality factors (or enhanced energy dissipation) if the viscosity η of the rhombohedral and tetragonal single domain crystals are similar. Considering the mechanical quality factors of these two crystals are comparable, one reasonable explanation is the inferior stability of single domain state in rhombohedral crystals, which can be understood by the presence of a few domain walls residually in [111]c poled rhombohedral crystals [135, 142–145]. In other word, the domain state is not a perfect ‘1R’ configuration. This domain wall viscosity induced energy loss gives rise to decreased quality factors.
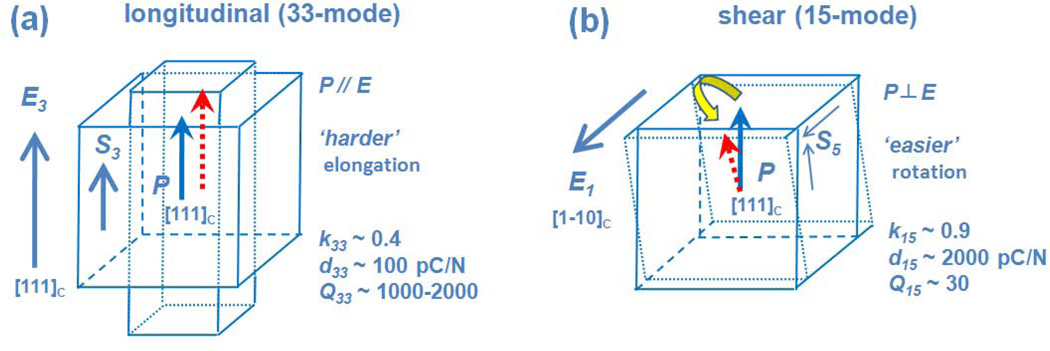
For all single domain ferroelectric crystals, the polarization will elongate/contract to minimize the Gibbs free energy when they are subject to external electric field, leading to a longitudinal deformation of the lattice through electromechanical coupling, as shown in Fig. 22(a). Evidently, the polarization in these crystals is confined along a fixed crystallographic direction and the polarization elongation/compression (namely polarization extension/contraction) mechanism is deemed to be the origin of the intrinsic piezoelectric response [20, 127, 146]. Thus, there is little elastic energy dissipation. Consequently, the low loss behavior of single-domain relaxor-PT crystals in the longitudinal vibration mode and the high quality factors Q33−r and Q33−a can be attributed to the difficulty in polarization elongation/compression.
Figure 22.
(a) Longitudinal and (b) shear deformations of lattice of relaxor-PT single crystals in single domain state, under parallel and perpendicular electric field, respectively. The longitudinal piezoelectric deformation denotes the k33-mode or polarization elongation, while the shear one means the k15-mode or polarization rotation. Easier polarization rotation and harder polarization elongation have been demonstrated (see Refs. [13, 21, 39]), which constitute the thermodynamic base for the piezoelectric activity as well as the energy loss behavior. From typical properties of relaxor-PT crystals shown in (a) and (b), it is clear that easier polarization rotation leads to the higher piezoelectric activity and increased energy dissipation, while harder polarization elongation in single domain state produced smaller piezoelectric activity and lower loss.
It should be noted that for both PMN-PT and PIN-PMN-PT crystals, the quality factors with compositions near the MPB are much lower than those far away from the MPB. This is due to the fact that in single domain state the structural instability will increase as the composition approaches the MPB, so that an easier polarization elongation/compression can be expected.
4.2.2 Relationship between high losses and easy polarization rotation
Contrary to the longitudinal mode, the thickness shear-mode in single domain crystals were reported to possess significantly lower quality factors, usually < 100 for PMN-PT systems, increasing to ~ 220 for Mn-doped PIN-PMN-PT systems, as listed in Table 2 [23]. The thickness shear vibration mode (k15-mode or k24-mode) requires the applied electric field perpendicular to its polar direction, thus the polarization in these crystals will rotate under field, leading to a shear deformation of the lattice through electromechanical coupling, as shown in Fig. 22(b). Consequently, the thickness shear piezoelectric response and energy loss are associated with polarization rotation.
For single-domain relaxor-PT crystals, shear piezoelectric coefficient d15 was found to be 2000 pC N−1 to 5000 pC N−1, attributed to a much flatter potential well, which further facilitates the polarization rotation process [19, 24, 134]. Analogous to longitudinal k33-mode, the relaxation time can be evaluated for the thickness shear piezoelectric k15-mode. For a k15 piezoelectric plate, elastic modulus G∞ at infinite frequency is approximately equal to the value of , which is much lower than that of (for a case of 0.72PMN-0.28PT, and ) in single domain crystals [135]. In addition, it was reported that for a highly structure-disordered system, the values of shear viscosity are much higher than those of volume viscosity, which were confirmed in Na2Si2O5 glasses [136], liquid argon and liquid lead [147–148]. Therefore, based on Eq. (35), lower elastic modulus G∞ and higher viscosity make the relaxation time longer in shear vibration mode than in longitudinal vibration mode. Together with the structural instability under transverse external field, single domain crystals exhibit higher energy loss and lower quality factors in the thickness shear vibration mode than in thickness longitudinal mode. This high loss characteristic can be attributed to an easy polarization rotation process.
4.3 Intrinsic loss in multi-domain ferroelectric crystals
In contrast to piezoelectric ceramics, high piezoelectric activities in multi-domain (domain engineered) relaxor-PT crystals are believed to be intrinsic in nature. In the following discussions on losses, we will focus on polarization rotation but neglect polarization elongation/compression process for the following two reasons: 1) Polarization rotation is believed to be the origin of high piezoelectric response and high dielectric permittivity in domain engineered relaxor-PT single crystals; 2) As discussed in 4.2, the quality factors of shear-modes are only about 1/20 ~ 1/60 of the longitudinal quality factors, i.e., loss from polarization rotation is the dominate contributor to the total energy dissipation.
4.3.1 Rotation angle of electric dipoles
When an electric field is applied on poled multi-domain crystals, the angle between the spontaneous polarization (Ps) and electric field (E) is represented by ψ. For these systems, the torque per unit volume for the rotation is given by
| (36) |
Here, q is the charge of polarization, l is the effective distance from negative charge point to the positive one, and V is the unit cell volume. One can see that a larger angle between polarization and field favors the rotation process, leading to a higher intrinsic response, including higher piezoelectric coefficient, stronger electromechanical coupling and larger energy loss.
4.3.2 Domain configurations
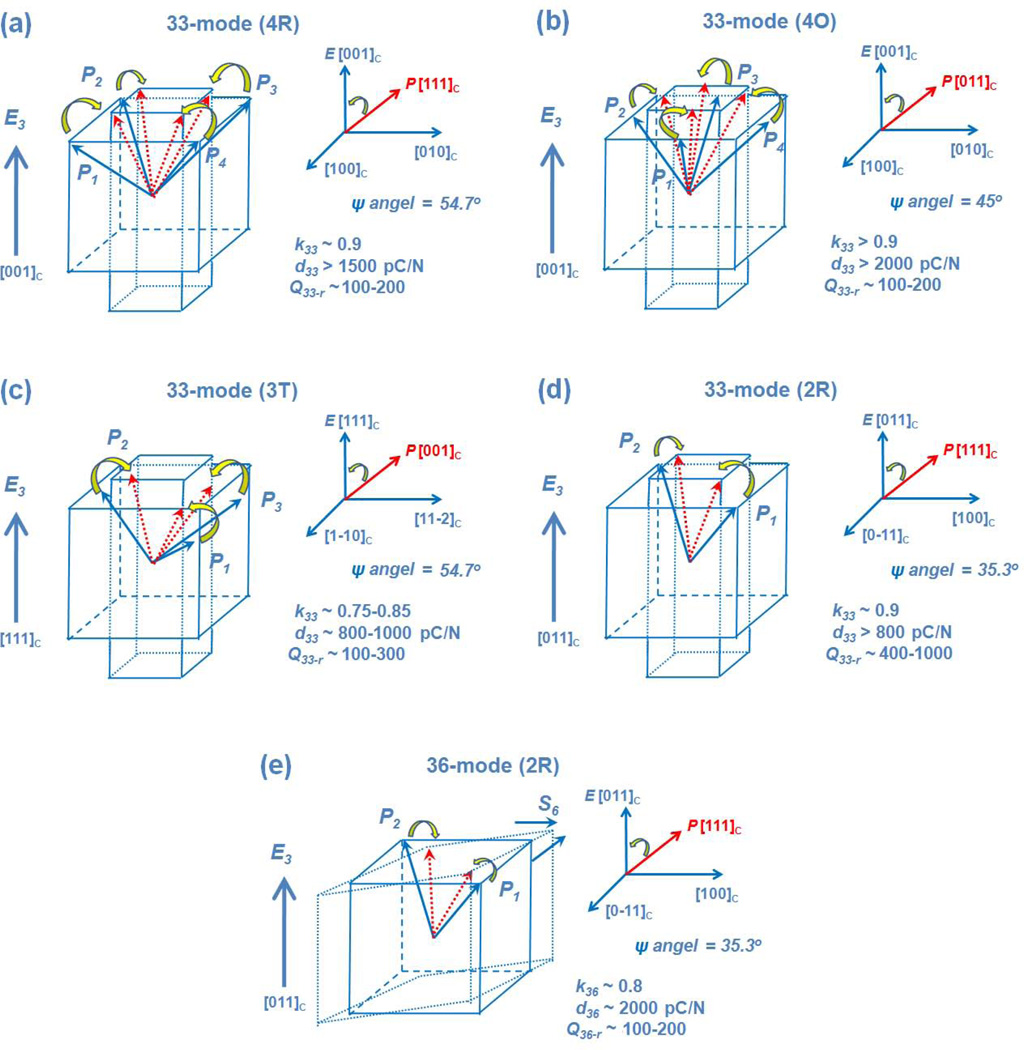
Fig. 23 illustrates the polarization rotation process and related structural deformation of relaxor-PT single crystals with various engineered domain configurations. The angle ψ, typical piezoelectric coefficient, electromechanical coupling factor and quality factor of PMN-PT single crystals are also listed in the figure. It was found that domain engineered crystals with large ψ angle, such as ‘4R’ (ψ = 54.7°), ‘3T’ (ψ = 54.7°) and ‘4O’ (ψ = 45°), exhibited low Qr values, generally < 300, whereas domain configuration with smaller rotation angle, such as ‘2R’ (ψ = 35.3°), possessed lower loss, with Qr values range from 400 to 1000. The quality factors and three types of losses for 0.71PMN-0.29PT single crystals are summarized in Table 3 as a function of ψ angle. As expected, an obvious trend was displayed in terms of energy loss vs. ψ angle, i.e., the loss was found to increase with the ψ angle [23]. An interesting exception is that the quality factor for face shear vibration mode in ‘2R’ domain configuration is much smaller compared to that of the longitudinal mode, with the same ψ angles (ψ = 35.3°), as shown in Fig. 23(e). This is due to the fact that (~ 4 × 10¹⁰ N m−2) is much smaller than (~ 20 × 1010 N m−2), leading to a longer relaxation time, accounts for the lower quality factor. A summary of ψ angle values in various domain configurations for different piezoelectric vibration modes is given in Table 4.
Figure 23.
Piezoelectric deformation of crystal lattice of relaxor-PT single crystals with various engineered domain configurations and ψ angles in different modes: (a) k33-mode, ‘4R’; (b) k33-mode, ‘4O’; (c) k33-mode, ‘3T’; (d) k33-mode, ‘2R’; (e) k36-mode, ‘2R’. The solid blue and dash red arrows denote polarizations of crystals before and after applying the electric fields, respectively, and the solid yellow arrows represent related polarization rotation processes. From the typical properties as shown in (a)–(e), one can see that large ψ angle facilitates polarization rotation process, resulting in the higher piezoelectric activity and increased energy dissipation.
Table 3.
Electromechanical coupling factors and energy losses of 0.71PMN-0.29PT single crystals as a function of the ψ angle.
| Domain Configuration | k33 | ψ angle | Q33-r | Q33-a | Dielectric loss | Elastic loss | Piezoelectric loss |
|---|---|---|---|---|---|---|---|
| 1R | 0.43 | 0° | 910 | 950 | 0.002 | 0.0012 | 0.0019 |
| 2R | 0.90 | 35.3° | 410 | 720 | 0.003 | 0.0032 | 0.0033 |
| 4R | 0.91 | 54.7° | 120 | 420 | 0.004 | 0.0114 | 0.0087 |
Table 4.
Summary of ψ angles in various domain configurations for different piezoelectric vibration modes.
| Domain configuration | ψ angle in k1j-mode (j=1–6) | ψ angle in k2j-mode (j=1–6) | ψ angle in k3j-mode (j=1–6) |
|---|---|---|---|
| 1R | 90° | 90° | 0° |
| 2R | 90°, 90° | 54.7°, 125.3° | 35.3°, 35.3° |
| 4R | 54.7°, 54.7°, 125.3°, 125.3° | 54.7°, 54.7°, 125.3°, 125.3° | 54.7°, 54.7°, 54.7°, 54.7° |
| 3O | 60°, 90°, 120° | 54.7°, 106.8°, 106.8° | 35.3°, 35.3°, 35.3° |
| 1O | 90° | 90° | 0° |
| 4O | 45°, 90°, 90°, 135° | 45°, 90°, 90°, 135° | 45°, 45°, 45°, 45° |
| 3T | 45°, 90°, 135° | 65.9°, 65.9°, 144.7° | 54.7°, 54.7°, 54.7° |
| 2T | 45°, 135° | 90°, 90° | 45°, 45° |
| 1T | 90° | 90° | 0° |
4.4 Intrinsic loss in ferroelectric ceramics
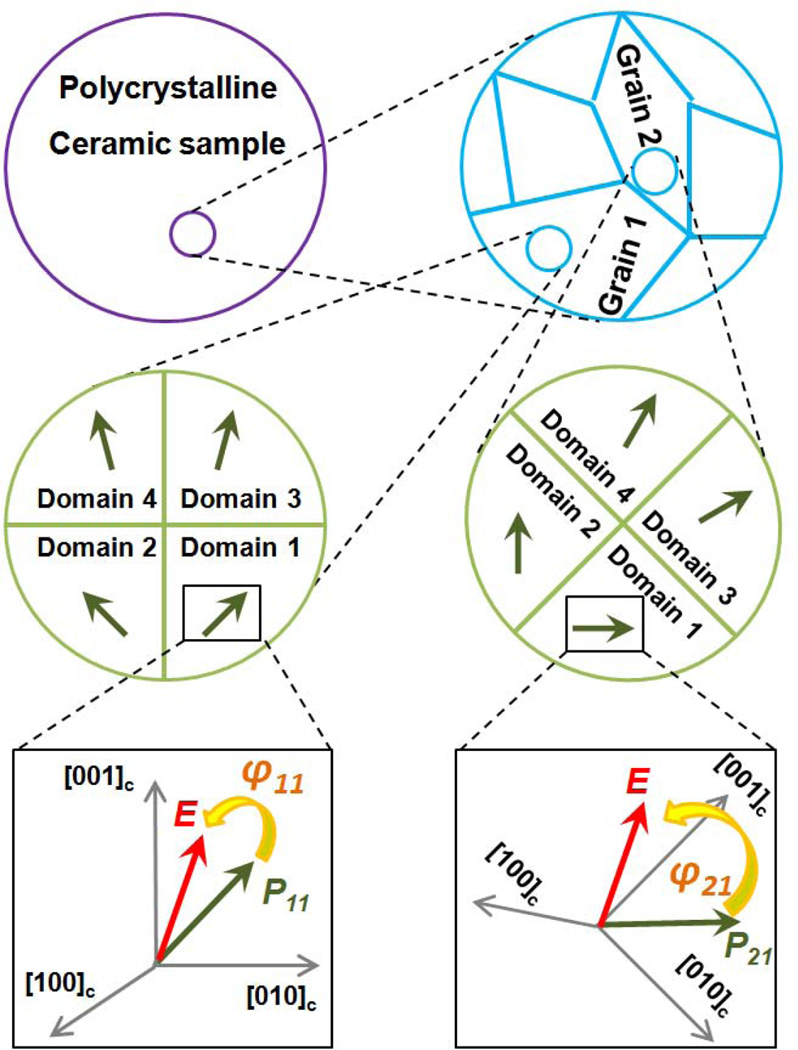
All ferroelectric ceramics are polycrystalline materials and have ∞mm symmetry after poling under an applied electric field larger than their coercive fields. As shown in Fig. 24, at the macroscale, the ceramic specimen has numerous grains and every grain is a small single crystal. At the mesoscale, there are a few grains with multiple domains. At the microscale, there are a few domains oriented along the allowed crystallographic directions. Every grain in the ceramic specimen is a small single crystal. Thus, the mechanisms controlling the intrinsic loss of single crystals can be applied to individual grain in ceramic. Unfortunately, these small single crystals have different crystallographic orientations and cannot be switched to a single direction under electric field due to the intergranular constraints [2, 149]. Then, the rotation angles of dipoles in grains are not the same and may be described as
| (37) |
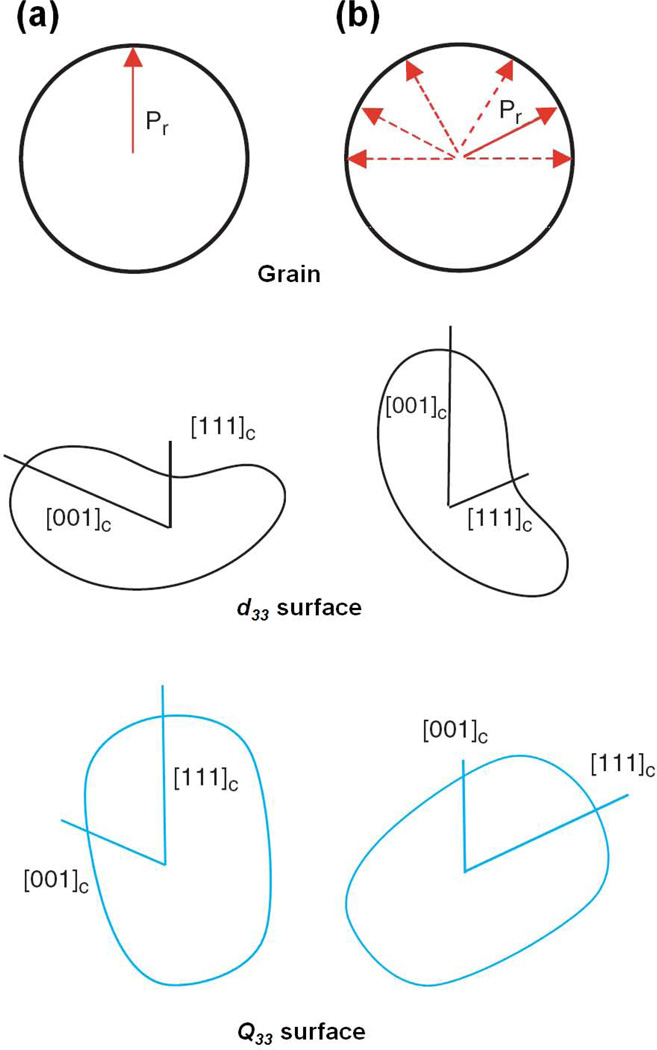
Here, the subscript ‘1n’ and ‘2m’ means domain n in grain 1 and domain m in grain 2, respectively. Based on Eq. (37) and results of Section 4.3, it is clear that each grain exhibits its individual energy loss behavior and the final intrinsic loss of polycrystalline ceramic is the sum of contributions from all grains. Fig. 25 shows a rhombohedral ceramic sample with randomly oriented grains. For grains with remnant Pr perpendicular to the electric field shown in Fig. 25(a), their exhibited piezoelectric coefficient d33 is much smaller than that of misoriented grains shown in Fig. 25 (b) [19], which can be understood by the smaller rotation angle of dipoles. Thus, one can observe a high quality factor Q33 (lower loss behavior) for the oriented grains shown in Fig. 25(a). The Q33 surface for different grain rotations can be expected as shown in Fig. 25(b), resulting in the relatively low Q33.
Figure 24.
The multi-scale behavior of a polycrystalline ceramic sample. The sample has many grains (small single crystals) and every grain has many domains. For a given electric field E, the rotation angle in domain 1 of grain 1, ψ11, is different from ψ21 (the rotation angle in domain 1 of grain 2).
Figure 25.
Grain rotation effect for rhombohedral ceramic. For the grains whose polar axis is perpendicular to electrodes (rotation angle of ψa is zero) as shown in (a), the longitudinal piezoelectric response is much smaller than that in rotated grains (b). Meantime, one also can expect a much higher quality factor Q33 in grains shown in (a). Adapted from Ref. [19].
4.5 Dependence of intrinsic losses on composition, crystal structure and temperature
Since intrinsic losses have strong relationship with the structural instability of ferroelectrics, their increase can be induced by fields, composition and/or temperature. Table 5 summarized the quality factors Qa and Qr together with elastic, dielectric and piezoelectric losses for PIN-PMN-PT single crystals with different PT contents. Considering the rhombohedral crystals, for a given engineered domain configuration, such as ‘2R’ or ‘4R’, the quality factors or the inverse of losses decreases with increasing the PbTiO3 content, but decreases drastically when the composition passes the MPB going to the tetragonal side. This composition dependent energy loss behavior in ternary crystals also appear in the binary PMN-PT crystals, which can be interpreted by the increased structure/phase instability as composition approaching MPB phase boundary due to the easier polarization rotation process near the compositional driven phase transition.
Table 5.
Composition dependent electromechanical coupling factors and energy losses of PIN-PMN-PT single crystals.
| Materials | Domain configuration | k33 | Q33-r | Q33-a | Dielectric loss | Elastic loss | Piezoelectric loss |
|---|---|---|---|---|---|---|---|
| 0.24PIN-0.46PMN-0.27PT | 2R | 0.86 | 870 | 1140 | 0.002 | 0.0016 | 0.0019 |
| 0.24PIN-0.49PMN-0.30PT | 2R | 0.89 | 610 | 820 | 0.002 | 0.0029 | 0.0023 |
| 0.24PIN-0.46PMN-0.27PT | 4R | 0.88 | 240 | 560 | 0.004 | 0.0052 | 0.0051 |
| 0.24PIN-0.49PMN-0.30PT | 4R | 0.92 | 180 | 500 | 0.004 | 0.0068 | 0.0059 |
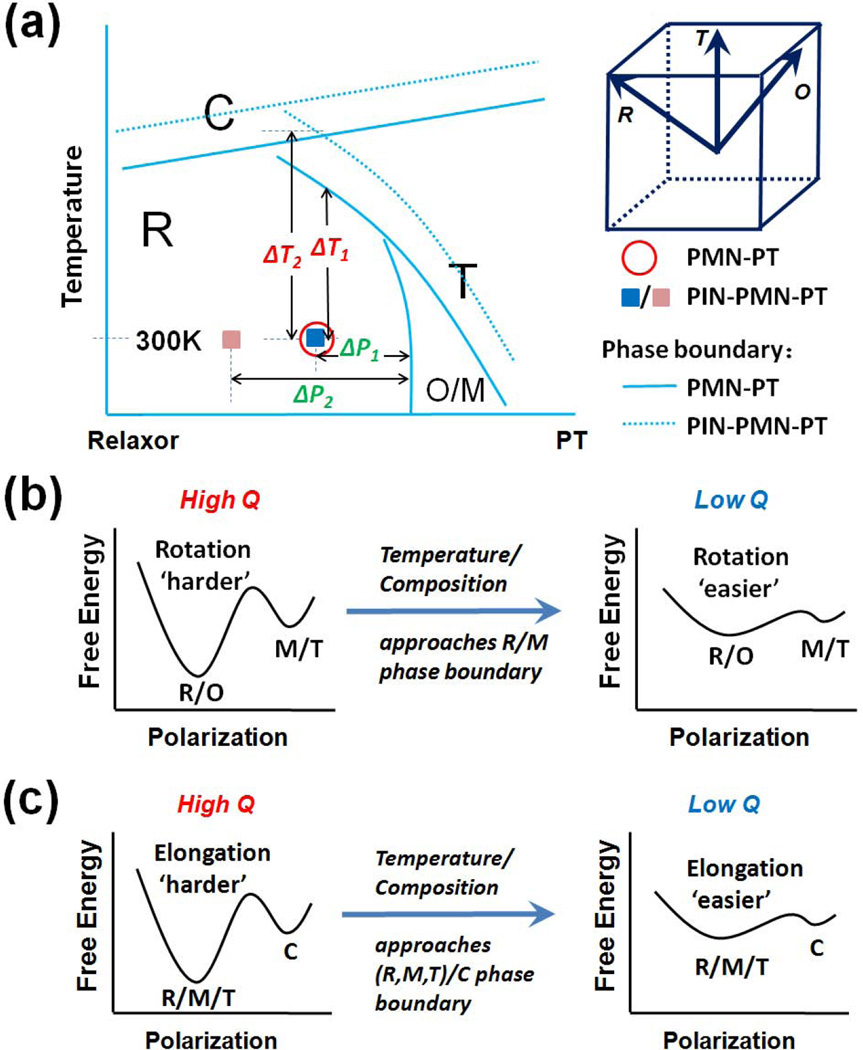
Fig. 26(a) shows a schematic phase diagram for relaxor-PT crystals, showing R, M/O, and T ferroelectric phases and paraelectric phase (C), where Δx1 (or Δx2) denotes the composition width between current states to R/M boundary and ΔT1 (or ΔT2) means the temperature difference from room temperature (~ 300 K) to R/T phase transition temperature. Based on thermodynamic calculations for perovskite ferroelectric crystals [19–20, 24, 134], the thickness shear piezoelectric coefficients generally exhibit corresponding maximum values near the ferroelectric polymorphic phase transitions (PPT), due to the easier polarization rotation and the increased structural instability, as shown in Fig. 26(b). As listed in Table 5, facilitated polarization rotations by phase transition processes lead to the enhanced dielectric/piezoelectric responses and also the increased energy losses. As shown in Fig. 26(c), the polarization elongation/compression also becomes easier as the temperature approaching PPT or the composition approaching the MPB, which contributes to the increased piezoelectric properties and reduced Qm [19, 127].
Figure 26.
Intrinsic energy loss. (a) Schematic phase diagram of relaxor-PbTiO3 system. Δx1 (or Δx2) and ΔT1 (or ΔT2) denote the composition and temperature intervals from current state to related phase transition boundaries, respectively. (b)–(c) Thermodynamic bases for the flat free energy profiles as well as the increased energy losses driven by composition or temperature approaching phase boundaries, which makes the polarization rotation or elongation easier, producing larger piezoelectric and dielectric effects, but also increases losses.
5. Extrinsic loss mechanisms
Extrinsic contributions to the energy loss in ferroelectrics can be defined as contributions originated from activities beyond unit cell level. Typical extrinsic effects include but not limit to domain wall motions and grain boundary effects, which are responsible for the nonlinearity, hysteretic behaviors, and mechanical energy loss in ferroelectrics [19, 68, 151]. Extrinsic contributions also include the diffusion of defects, space charges and interfaces [11]. In this Section, the extrinsic losses in ferroelectrics are investigated with regard to domain wall activity, crystal phase, grain boundary effects, temperature, and doping effect in single crystals and polycrystalline ceramics.
5.1 Extrinsic effects
5.1.1 Domains, domain walls and domain wall motions
In ferroelectricity, regions with uniform polar vector are called domains and the boundary between two domains is called a domain wall. Domain formation can be understood from the structural change in ferroelectrics under external stimuli [152]. A simple example is illustrated in Fig. 27. At a certain phase transition temperature, the structure SG with central symmetry undergoes changes of a shift of central ions along the vertical c-axis to form the new ferroelectric structure SF, which has lower symmetry. Note that the shift of the central ion can be up or down so that two ferroelectric structures SF (A) and SF (B) have equal probability to form, denoted as SA and SB. It is unpredictable which of them will appear during the phase transition in a sample, usually both of them exist if no external fields are applied. As shown in Fig. 27, the direction of the dipole in structure SA is positive while in the structure SB is negative, they called two different domains and the boundary between two domains (red line in Fig. 27) is the domain wall.
Figure 27.
Two ferroelectric domain states (SA and SB) and domain wall (marked as red) formed in a crystal lattice. Adapted from Ref. [152].
At the mesoscopic scale, domain wall will move to a new position if an electric field is applied, which is not parallel to the domain wall, and domain wall motion will cause global shape deformation. At the microscopic scale, domain wall motion is the result of the switching of some polar vectors near the wall. To minimize the free energy of the system, some polar vectors will switch their polarization state under electric and/or mechanical fields. Depending on the orientation of the applied field, some domains grow and others shrink. As shown in Fig. 28, the dipoles in region II are switched to more favorable positions under an upward electric field and the global shape deformation could be substantial as shown in the figure. Also, the domain wall moves to the left but the whole region II moves up relative to region I [153].
Figure 28.
Domain wall movement in a ferroelectric twin structure under an external electric field. The old and new positions of domain walls are marked as blue and red, respectively. Adapted from Ref. [153].
The switching of dipoles and the global shape change caused by the domain wall movement gives the extrinsic contributions to the dielectric and piezoelectric responses [153]. Domains in ferroelectrics can be categorized into two types, i.e., 180° ferroelectric domains and non-180° ferroelastic-ferroelectric domains [154–158]. A strain inside non-180° domain walls is expected due to the deformation of lattice structure [159]. However, the transformation strain is the same in the twin pair divided by a 180° domain wall, there is no distinction for the twins in terms of elastic energy [154], which can only be removed by the application of an electric field. On the other hand, non-180° twins have different transformation strain. Hence, non-180° domain wall motion can induce elastic, dielectric and piezoelectric responses, whereas the 180° domain wall motion only affects the dielectric behavior.
Not all applied electric fields can cause domain wall motion. In real materials, domain wall is not a strict plane without width, but a region with some distorted lattices, as shown in Fig. 29. If the applied electric field is parallel to the domain wall, it will not induce domain wall motion but the domain wall region will become broad or narrow, depending on if the applied field along or against the dipole direction. These changes of domain wall region are associated with the rotation of dipoles in the lattices in the domain wall region. Such domain wall activity is also called “breather mode”.
Figure 29.
Variations of domain wall region. If the applied electric field is along a charged domain wall, the domain wall region will show broadening, while narrowing occurs when the applied field is against the polarization direction. The domain wall regions are marked as red.
Although both domain wall motion and polarization rotation are related to the polarization variation, they should be distinguished from each other because: 1) during domain wall motion, only parts of dipoles are switched and others are unchanged, while in polarization rotation, all dipoles participated [50]; 2) polarization rotation means a lattice distortion associated with symmetry change, while the result of domain wall motion (or dipole switching) is a global lattice motion in space without any crystal symmetry change; 3) polarization rotation cause enhanced piezoelectric activity, while some domain wall motions do not contribute to piezoelectricity [23]. However, it should be noted that all domain wall motions contribute to extrinsic losses in ferroelectrics due to the hysteretic effect and the time lagging in domain wall motions with respect to the applied electric and/or stress fields (detailed in Section 5.1.3 and 5.2). Also, domain wall region broadening and/or narrowing generate energy losses since they also reflect local lattice deformation.
5.1.2 Other extrinsic effects
Besides domain wall motions, other extrinsic effects include interphase boundaries, grain boundaries, defects, and so on. Interphase boundary is the spatial interface when two phase structures meet. Two types of important interphase boundary are the composition-driven MPB and temperature-driven PPT that separating two phases in a composition-temperature phase diagram. Ideally, the free energies of two co-existing phases are the same so that they form an interface boundary. Enhanced piezoelectric activity can be expected at the interphase boundary because of the structural instability [15, 19]. Also, energy loss is increasing as the system approaches to the phase boundary. On the one hand, it has been demonstrated that the polarization rotation and polarization elongation/compression become easier as the temperature approaching the PPT or as the composition approaching the MPB, leading to increased intrinsic energy loss, as discussed in Section 4.5. On the other hand, interphase boundary plays an important role similar to that of domain walls, thus extrinsic losses will be increased by interphase boundary activities (detailed in Section 5.2). Interphase boundaries have coherent and incoherent types, coherent type can move like a domain wall, while incoherent type could not move because it is a composition boundary, which is similar to immobile grain boundary. It should be noticed that the movement of interphase boundary will introduce energy loss abruptly, as demonstrated in the dielectric loss peak at Curie temperature TC and at the ferroelectric-ferroelectric phase transition points.
Domain walls, interphase boundaries, and grain boundaries are special kinds of structural defects. For example, domain walls create localized stress gradient and/or electric field gradient that can strongly interact with other defects, such as dislocations, space charge and vacancies [153, 160]. Another important defect type to generate energy loss in ferroelectrics is impurity dopants, such as Nb5+ ions in soft PZT. Defect doping can either facilitate domain wall motions, which increase mechanical loss, or provide pinning to domain walls, which decreases mechanical loss. The quality factor of manganese doped PMN-PZT crystals was found to be much higher than pure PMN-PZT crystals, so that the manganese doping actually reduced extrinsic activities [53]. The effects of grain boundary and doping on the loss behavior will be discussed in more detail in Sections 5.3 and 5.4, respectively.
5.1.3 Energy losses induced by extrinsic effects
Energy losses induced by extrinsic effects can be understood phenomenologically. For energy loss deduced by domain wall motions, G. Arlt and co-workers [46, 51, 119, 161–163] attributed the dominative mechanism to the damped domain wall motions and relaxation process. The vibration of a 90° domain wall may be described as
| (38) |
Here, meff is the effective mass of the domain wall, ηdomain is the damping constant of domain wall vibration, kforce is the restoring force constant, meff, ηdomain and kforce denote the physical quantities per domain-wall unit area. WE and WM are electric and elastic energy densities of the displaced wall, respectively. Δl is the displacement of domain wall perpendicular to the wall plane. As shown in Eq. (38), domain wall oscillation and relaxation are described as the second order term meffΔl and first order term ηdomainΔl, respectively. When ηdomain is large enough, the system becomes over-damped, the first term could be ignored so that the system may be described by a relaxation process. This phenomenological theory can also be extended to include nonlinear contributions [68]. Experimentally, relaxation process of domain dynamics during switching has been observed directly [3, 164]. The experimental result obtained from time-resolved transmission electron microscopy (TEM) confirmed that the domain wall motion is a relaxation process [3].
It is widely accepted that domain wall motions can contribute to functional responses in ferroelectrics and there has been some experimental evidence for these extrinsic effects revealed by neutron diffraction and high-frequency dielectric measurements [165–167]. Considering the domain wall motion is a relaxation process, frequency related loss behavior could provide some quantified measurements for the relaxation coefficient, so that high frequency ultrasonic spectroscopy should be a powerful tool to evaluate the extrinsic loss in ferroelectrics. Here we give a directly experimental evidence of energy loss induced by domain wall motions.
To investigate the energy attenuation induced by domain wall motions, un-poled and poled relaxor-PT single crystals were characterized in the frequency range of 10–40 MHz by ultrasonic spectroscopy. Fig. 30 shows the measured attenuations as a function of frequency for both longitudinal and shear waves in [001]c- and [011]c-poled 0.71PMN-0.29PT single crystal plates. It was found that for un-poled samples, the attenuation dispersions in the [001]c-cut PMN-PT samples are similar to those of [011]c-cut plates, suggesting a strong extrinsic behavior induced by non-aligned domains in relaxor-PT system. On the other hand, for both longitudinal and shear waves, the attenuation dispersions of [011]c poled samples were lower than those of [001]-poled single crystals [168], revealing that the ‘4R’ multi-domain structure does have higher contribution to the energy loss compared to the ‘2R’ structure. Recent results of local re-poling experiments demonstrated that the domain state in [011]c poled single crystals was more stable than that in [001]c poled single crystals [157], implying less extrinsic contributions to piezoelectric responses and energy losses. By comparing the attenuation dispersions of the same crystal plate before and after poling, one can see much smaller attenuation in the poled sample due to the fact that part of the non-180° and almost all 180° domain walls have been eliminated after poling [169]. Thus, the obviously reduced energy loss in poled samples can be attributed to the decrease of the domain wall density. In general, for most solid materials, the attenuation obeys the power law with respect to frequency as expressed in Eq. (8), where N is a number between 1 and 2. As shown in Fig. 30 (b), the N value for the shear attenuation in un-poled crystals is 1.5, which means a significant deviation from the ideal Debye relaxation and can be understood by the strong coupling between the shear wave and the ferroelastic-ferroelectric domain walls in these crystals.
Figure 30.
Frequency dependence of ultrasonic attenuation of 0.71PMN-0.29PT single crystals for (a) longitudinal and (b) shear waves, in which the ‘prop. dir.’ and ‘pol. dir’ denote the propagation direction and polarization direction of the shear waves, respectively.
5.2 Extrinsic loss in ferroelectric crystals
Experimentally, it is difficult to quantitatively extract extrinsic loss from the total energy dissipation. In ferroelectric single crystals, domain wall motion is the most important extrinsic effect since there are no grain boundaries, so that extrinsic losses can be attributed to viscous movements of domain walls. One can evaluate extrinsic contributions to the energy loss by correlating it with the domain wall activities. In this section, we will use relaxor-PT single crystal as model system to investigate the extrinsic loss in ferroelectric crystals and analyze the domain wall activities for different crystal phases and domain sizes.
5.2.1 Crystal phases and morphotropic phase boundary
The field dependent piezoelectric behavior of [001]c poled PMN-PT crystals was studied at room temperature using the Rayleigh approach. As shown in Fig. 31(a) [170], αE0/(αE0+dint) represents the degree of irreversible contributions and related domain wall activity. Due to the stable engineered domain configuration, domain wall contributions in relaxor-PT single crystals are generally low (< 10%) compared to that in polycrystalline ferroelectric ceramics (> 40%) [171]. Of particular interest is that domain wall motions become easier as composition approaching the MPB, similar to the behavior of intrinsic polarization rotation/extension, which can be interpreted in term of facilitated motions of interface boundaries near the MPB under external stress or electric field. As demonstrated in Ref. [170], two structurally different ferroelectric phases co-exist near the MPB, which are energetically degenerate and easy to transform from one to the other, leading to unstable interphase boundaries and enhanced domain wall activities, thus higher extrinsic contributions to the functional properties and dissipations.
Figure 31.
Domain wall activity as a function of the composition for [001]c poled relaxor-PT single crystals. (a) The ratio of irreversible contribution to piezoelectric response and related domain wall activity, studied using the Rayleigh approach at room temperature. Reproduced from Ref. [160]. (b) The ratio of extrinsic contribution to total piezoelectric response dext /d for binary PMN-PT (red squares) and ternary PIN-PMN-PT (blue squares) single crystals, based on the measured piezoelectric coefficients of crystals with single-and multi-domain configurations. The dash lines are eye-guided lines. Data are from Refs. [16, 135, 142, 172–173] and this work.
The orientation dependence of piezoelectric constants can be calculated based on the measured full matrix single-domain data. These calculated results are intrinsic part of piezoelectric constants dint, one can obtain the extrinsic part of piezoelectric constant dext by subtracting the calculated dint from the measured multi-domain piezoelectric constant d, and the ratio dext/d reflects the degree of domain wall activity. Fig. 31(b) shows the dext/d as a function of PT content for binary PMN-PT and ternary PIN-PMN-PT single crystals. For both binary and ternary single crystal systems, dext/d was found to increase as the composition approaching the MPB, also associated with the unstable interphase boundaries and flattened free-energy well. One can see that the extrinsic piezoelectric activity ratio of PIN-PMN-PT single crystals is generally lower than that of PMN-PT, associated with lower domain wall activities and higher quality factors in PIN-PMN-PT crystals.
5.2.2 Domain size effects
R. Ahluwalia and co-workers investigated the domain size dependence of the piezoelectric properties of ferroelectrics using a continuum Ginzburg-Landau model [174]. A two dimensions (2D) ferroelectric transition was used for simplicity to illustrate the basic principles, but three dimensions (3D) parameters for BaTiO3 were used in the model calculation. Firstly, the free-energy functional F for a 2D ferroelectric system is written as
| (39) |
Here, Fl is the local free energy. Fem and Fes are the electromechanical and electrostatic contributions to the total free energy, respectively. Then, the dynamics of the polarization fields is governed by the relaxational time-dependent Ginzburg-Landau equation
| (40) |
where γ is a dissipation coefficient and i = x, y represents the polarization components. Using the solution Pi, the average strain components were obtained as
| (41) |
| (42) |
| (43) |
where Qij are the electrostrictive coefficients. Finally, piezoelectric coefficients d33 can be calculated from the slope of longitudinal strain vs. Electric field curve. For a multi-domain 2D ferroelectric system, if the polar direction and the applied electric field direction are [01] and [11], respectively, the resulted domain state is the multi-domain (engineered) state, and the longitudinal strain is given by
| (44) |
Fig. 32(a)–(c) shows the evolution of domains when an electric field is applied along the [11] direction to the multi-domain state with various domain sizes. It is clear that for system with smaller domain size (L0 = 4.5 nm), the domain contribution can be changed more easily under lower electric field level, indicating that the domain walls are easily moved. This means smaller domains will lead to higher domain wall activity and larger functional responses under external fields. Thus, piezoelectric coefficients are enhanced, as shown in Fig. 32(d). At the same time, higher energy dissipations (or lower Q) are expected.
Figure 32.
Evolution of domains in a two dimensions (2D) model for an electric field applied along the [11] direction to the multi-domain state with the following domain size L: (a) 22.6, (b) 11.3, and (c) 4.5nm. The corresponding electric field levels are indicated at the top of each snapshot. (d): Variation of (the longitudinal piezoelectric constant along [11]) with E[11]. The lines with yellow diamonds correspond to the multi-domain state in (a) where the domain size is 22.6 nm; lines with blue squares correspond to the multi-domain state in (b) where domain size is 11.3 nm; and lines with red circles correspond to the multi-domain state in (c) where domain size is 4.5 nm. Green solid lines correspond to the single domain state. Adapted from Ref. [174].
The high piezoelectric activity and high energy loss (or low Q) have been experimentally confirmed in domain-engineered BaTiO3 single crystals [175–176], rhombohedral and tetragonal relaxor-PT crystals with reduced domain size [58, 177], as shown in Fig. 33(a) and (b), respectively.
Figure 33.
Domain structure and properties of relaxor-PT crystals with various domain sizes: (a) tetragonal PIN-PMN-PT single crystals; (b) rhombohedral 0.94PZN-0.06PT single crystals. Adapted from Refs. [58, 177].
It should be noted that this conclusion is only true for a material with fixed chemical composition. For example, for rhombohedral relaxor-PT crystals, the average domain size is much larger for compositions near the MPB compared to compositions far away from the MPB [85–86], but with much enhanced properties due to the flattened potential well. However, when the composition is relatively far away from the MPB, crystals with lower PT content and smaller domain size were found to possess lower domain wall activities and higher quality factors, as discussed in Section 5.2.1. In addition, PIN-PMN-PT crystals exhibit decreased loss values compared to PMN-PT, with domain size being on the order of ~ 1 µm, which is much smaller than that of PMN-PT crystals (10–30 µm) [178]. Thus, the criterion ‘smaller domains induce larger functional responses’ should not be used when the chemical composition is fixed.
5.3 Extrinsic loss in ceramic ferroelectrics
In polycrystalline ceramic ferroelectrics, the properties are strongly influenced by the microstructure, defects, external fields and domain wall motions [38]. Among these extrinsic factors, the most unique characteristic for polycrystalline materials is their microstructure due to the existence of grains and grain boundaries. Subsequently, the effects originated from grains and grain boundaries may control functional responses and induce very different performance from ferroelectric single crystals. In this Section, we will focus on two grain effects, i.e., the effects of grain boundary and grain size, and discuss their roles in global loss behavior.
5.3.1 Grain boundary effects
Grain boundaries may either increase or decrease losses. On the one hand, grain boundaries are helpful to stabilize domain walls, making domain switching harder [179–181], thus decreases the extrinsic energy loss induced by domain wall motions. On the other hand, ultrasonic attenuation originated from grain boundary scattering has been confirmed in various polycrystalline materials, including ferroelectrics, metals and glasses [182–183], so that the mechanical loss is greatly increased at high frequencies. Ultrasonic attenuation can be described by the Rayleigh’s scattering formula in some cases and is strongly associated with grain size and wave frequency [184].
Ferroelectric domains can be stabilized by defects and they also influence defect distributions [179]. The extrinsic effect in polycrystalline ferroelectrics appears to be strongly dependent on the interaction between ferroelectric domains and defects, such as grain boundaries, interphase boundaries, space charges, dislocations, defect dipoles and so on. Various models has been proposed to describe domain stabilization, including grain boundary theory [180–181], surface layer model [185–187], domain wall theory [188–189], and theory for volume effects [188, 190–191]. In ferroelectric bulk ceramic, especially in single phase ferroelectrics, grain boundaries are important sources to pin domain walls. Calculations resulted from first-principles density functional theory demonstrated that at grain boundaries the pining of domain walls is facilitated [192], which has been experimentally confirmed by various research groups using different methods [193–196].
Based on grain boundary theory, the electric depolarization energy should gradually diminish by the diffusion of charged point defects to grain boundaries [179]. From topography and current-voltage curve measurements for BiFeO3 film, grain boundary was found to be essentially conductive so that a bias is required for polarization switching (see Fig. 34) [195]. The conductivity at grain boundaries reduces the effective potential acting on the wall and minimizes the depolarization energy for a domain wall pinned at the grain boundaries [195], these observations agree well with the proposed grain boundary theory. Domain wall pining at grain boundary can induce a decrease in the nonlinear piezoelectric response, which was confirmed in PZT thin film by TEM and band excitation piezoresponse force microscopy (BE-PFM) observations (see Fig. 35) [196]. It is interesting that the study by J.Y. Li and co-workers [149] on domain switching indicates that based on the compatibility of elastic strain across the grain boundary, non-180° domain cannot switch in some ceramics with rhombohedral or tetragonal crystal structures, but are switchable in those with MPB composition, for which the tetragonal and rhombohedral phases co-exist or a monoclinic phase exist. This phenomenon provides another mechanism for the enhanced domain wall activity and increased energy loss in ferroelectric ceramics with the MPB composition.
Figure 34.
Topography and transport properties of the interface of BiFeO3 thin films probed by conductive atomic force microscope (AFM). (a) Topography, where the dash line indicates the position of grain boundary. (b) Current image, where the dark contrast is indicative of increased leakage; (c) Selected current-voltage curves. Adapted from Ref. [195].
Figure 35.
Influence of a single grain boundary on domain wall motion in PZT films. (a) Nonlinear response quadratic/linear maps measured across the grain boundary for the 425 nm thick sample. (b) Nonlinear response quadratic/linear for maps averaged where corresponds to map shown in (a). (c) Topography of domain structure near the grain boundary, revealing a cross-hatched domain structure typical of a tetragonal ferroelectric phase (obtained along the [001] zone axis). Adapted from Ref. [196].
In contrast to the decreased loss due to domain wall pining at grain boundaries, mechanical and elastic losses could be induced at grain boundaries because wave velocity and acoustic impedance are different in anisotropic grains [182–183]. Here, grain boundary act as a scattering source for ultrasonic attenuation. The mechanisms of ultrasonic attenuation have been extensively studied [182–184, 197–200]. It is believed that at low frequencies (usually lower than 1 MHz), the adapted Rayleigh’s scattering formula can be applied to describe the scattering of ultrasound by grains and the attenuation follows a power law dependence on frequency with an exponent of 4 [184]. At high frequencies, the losses induced by grain boundary scattering are described by other two models, i.e., the Stochastic model and Geometrical model [201]. These models could be useful for analyzing loss behavior in very small size ferroelectric device, corresponding to their ultrahigh operating frequency.
5.3.2 Grain size effects
For polycrystalline ferroelectrics, grain size plays an important role in controlling material performances, including dielectric/mechanical/piezoelectric properties, microwave properties, aging, nonlinear hysteresis, phase transition, as well as loss behavior. One of the well investigated examples is grain size dependence of the dielectric permittivity in barium titanate (BaTiO3) ceramics and thin films [202–208]. As shown in Fig. 36, dielectric constant appears to be a strong function of grain size, and dielectric properties are maximized at intermediate grain size in the order of 1 µm. To understand the physical origin of the anomalously high permittivity and high piezoelectricity, various mechanisms have been proposed [202–216]. Recently, by employing in situ high energy XRD under electric fields [207], the theory [202, 205, 215] of attributing the enhanced properties to the displacement of domain walls was validated.
Figure 36.
Grain size dependent dielectric constant of BaTiO3 ceramics and thin films. Data are from Refs. [204–205, 207].
Analogous to permittivity, dielectric loss is also increased due to enhanced domain wall motions. This means that the dielectric constant and dielectric loss could have the same or similar relationship with grain size, which has been confirmed in ferroelectric BiVO5.5 and (Ba, Ca)(Zr, Ti)O3 (BCZT) ceramics [217–218]. However, in PZT ceramics, an increase in dielectric constant together with a decrease in dielectric loss was also observed as grain size increasing [211], as shown in Fig. 37. The opposite grain size effects on dielectric loss and dielectric constant in different ceramics suggest different mechanisms could affect the loss behavior, and the appeared loss performance is controlled by the dominating mechanism in each case. For the case of BiVO5.5, the increase in loss with increasing grain size can be understood from the fact that, in small-grained ceramics, a larger number of grain boundaries provide a great deal of domain wall pinning, so that the energy loss induced by domain wall motions will be reduced. Meanwhile, it has been demonstrated that larger domains are favorable in ceramics with coarse grains, while fine grains is helpful to obtain smaller domains [206, 219] (see Fig. 38). As discussed in Section 5.2.2, smaller domains will lead to higher domain wall activities and increased losses, which can explain the grain size effects on dielectric loss behavior in PZT ceramics. Note that based on E. P. Papadakis’s works [199–200], the effect of one large grain on the scattering is greater than the sum of the effects by many small grains in the same volume. Thus, for those cases, grain boundary scattering dominates the loss behavior so that lower loss should exist in fine-grain ceramic materials.
Figure 37.
Grain size dependent dielectric constant and dielectric loss for selected ferroelectrics. Dielectric constant and loss may exhibit similar or contrary tendencies as grain size varies. Data are from Refs. [211, 217].
Figure 38.
Grain size vs. domain size relationships for PZT, Nb-doped PZT, and BaTiO3 ceramics. Data are from Refs. [206, 219].
5.4 Doping effects on losses
The loss properties in ferroelectric materials can be modified by doping of various defect ions. Up to now, one of the most well investigated and successful samples is using acceptor manganese ions (Mn2+ and/or Mn3+) to replace B-site Ti4+ in perovskite ferroelectrics that has been practiced in various ceramics and single crystals. It has been confirmed that in these Mn-doped materials, dielectric loss were significantly decreased and mechanical quality factor were greatly increased.
Let us first consider the case of single crystals with single domain configuration. As listed in Table 2 and Table 6, compared with undoped crystals, Mn-doped PIN-PMN-PT and PZN-PT crystals were found to possess higher thickness shear quality factors (Q15-r ~ 60, Q15-a > 200), demonstrating that the acceptor dopant plays an important role in controlling the loss behavior, in which Mn3+, 2+ substitute Ti4+, leading to an internal bias, consequently restrict the polarization rotation.
Table 6.
The energy loss performance comparison between undoped and manganese doped relaxor-PT single crystals with various engineered domain states for different vibration modes. (k31-mode (45°) in ‘4R’ domain configuration denotes that crystals are poled along [001]c, but Zt ±45° cut).
| Materials | Vibration mode | Domain configuration | k | d | Qr | Qa |
|---|---|---|---|---|---|---|
| 0.88PZN-0.12PT† | k31-mode | 1T | 0.55 | −207 | 450 | - |
| 0.88PZN-0.12PT:Mn‡ | k31-mode | 1T | 0.58 | −230 | 880 | - |
| 0.88PZN-0.12PT† | k33-mode | 1T | 0.88 | 541 | 440 | - |
| 0.88PZN-0.12PT:Mn‡ | k33-mode | 1T | 0.89 | 568 | 600 | - |
| 0.88PZN-0.12PT† | kt-mode | 1T | 0.50 | - | 50 | - |
| 0.88PZN-0.12PT:Mn‡ | kt-mode | 1T | 0.52 | - | 233 | - |
| 0.40PMN-0.25PZ-0.35PT§ | k33-mode | 4O | 0.93 | 1530 | 100 | - |
| 0.40PMN-0.25PZ-0.35PT:Mn§ | k33-mode | 4O | 0.92 | 1140 | 1050 | - |
| 0.71PMN-0.29PT□ | kt-mode | 2R | 0.66 | - | 60 | - |
| 0.71PMN-0.29PT:Mn□ | kt-mode | 2R | 0.64 | - | 77 | - |
| 0.71PMN-0.29PT□ | kt-mode | 4R | 0.62 | - | 56 | - |
| 0.71PMN-0.29PT:Mn□ | kt-mode | 4R | 0.59 | - | 132 | - |
| 0.24PIN-0.46PMN-0.27PT | k33-mode | 2R | 0.86 | 780 | 870 | 1140 |
| 0.24PIN-0.49PMN-0.30PT | k33-mode | 2R | 0.89 | 850 | 610 | 820 |
| PIN-PMN-PT:Mn | k33-mode | 2R | 0.89 | 720 | 900 | 1700 |
| PIN-PMN-PT:Mn (low PT%)Δ | k33-mode | 2R | 0.86 | 810 | 1000 | - |
| PIN-PMN-PT:Mn (high PT%)Δ | k33-mode | 2R | 0.90 | 1050 | 1000 | - |
| 0.24PIN-0.46PMN-0.27PT | k33-mode | 4R | 0.88 | 1100 | 240 | 560 |
| 0.24PIN-0.49PMN-0.30PT | k33-mode | 4R | 0.92 | 1620 | 180 | 500 |
| PIN-PMN-PT:Mn | k33-mode | 4R | 0.91 | 1200 | 490 | 1200 |
| PIN-PMN-PT | k31-mode (45°) | 4R | 0.70 | −550 | 150 | 400 |
| PIN-PMN-PT:Mn (low PT%) | k31-mode (45°) | 4R | 0.60 | −460 | 550 | 1250 |
| PIN-PMN-PT:Mn (high PT%) | k31-mode (45°) | 4R | 0.73 | −650 | 280 | 290 |
| PIN-PMN-PT | k31-mode | 2R | 0.66 | −460 | 145 | 380 |
| PIN-PMN-PT:MnΔ | k31-mode | 2R | 0.64 | −455 | 220 | - |
| PIN-PMN-PT | k36-mode | 2R | 0.81 | 2000 | 130 | 280 |
| PIN-PMN-PT:Mn | k36-mode | 2R | 0.82 | 2100 | 1000 | 600 |
In engineered domain configurations it has been demonstrated that Mn-doped relaxor-PT single crystals also possess improved quality factors or decreased losses compared to their undoped counterparts, with minor decrease in dielectric and piezoelectric coefficients [23, 53, 150, 223]. As listed in Table 6, compared with undoped crystals, Mn-doped PMN-PT, PMN-PZT, and PIN-PMN-PT crystals exhibited much higher quality factors with comparable piezoelectric coefficients in engineered domain configurations for both stiffened (k15-, k33-, kt-) and unstiffened (k31-, k36-) modes. These results suggest that for Mn-doped domain engineered crystals, the internal bias clamps domain walls and restricts the polarization rotation, leading to improved quality factors. For unstiffened modes, the value of Qr may not be always lower than that of Qa, especially in Mn-doped crystals, revealing a wide distribution of tan μ values and a significant change in the Qa/Qr ratio.
For electromechanical device applications, high electromechanical coupling k and large piezoelectric coefficient d allow for increased transducer bandwidth and sensitivity, while high quality factor Q (measured at resonant frequency) reduces heat generation under high power drive conditions. Both Q and k are critical for practical applications, so that a figure of merit was defined, which is the product of k and Q (or the product of Q and d) [224–228]. The Mn-doped PIN-PMN-PT crystals possess superior quality factors and ultrahigh figures of merit, making them the most promising piezoelectric material for next generation high power ultrasonic transducers. In addition, it was reported that high quality factors and high electromechanical coupling can be simultaneously achieved in Mn-modified relaxor-PT crystals with engineered domain configurations. As shown in Fig. 39, for the Mn-doped crystals, the electromechanical quality factors Q33−r can be improved from 100 to 1100, while maintaining the high electromechanical coupling k33 (> 88%) [18, 23]. Of particular interest is the face shear vibration (k36-mode in ‘2R’ domain configuration) of PIN-PMN-PT single crystals poled along [011]c direction, which is very promising for low frequency, broadband and high power sonar transducer applications [229–233].
Figure 39.
The relationship between electromechanical quality factor Q33−r and electromechanical coupling k33 for various Mn-doped relaxor-PT crystals and PZT ceramics. Adapted from Refs. [18, 23].
Besides ferroelectric single crystals, various ceramics, including PZN-PZT [234], 0.8Pb(Sn0.46Ti0.54)O3-0.2Pb(Mg1/3Nb2/3)O3 [235], (Bi0.5Na0.5)TiO3-based [236], and PMN-PT [237], are also acceptor doped to achieve low loss behavior. In all acceptor doped ferroelectrics discussed above, it has been well accepted that the dipolar defects are the acceptor ion-oxygen vacancy dipoles. After poling, these defect dipoles realign themselves along a preferential direction with spontaneous polarization and diffuse to the high stress area of domain walls, leading to an internal bias to pin domain walls, and restricting polarization rotation [53, 191, 238–240]. An interesting study on the dielectric loss of TiO2 indicates that only the acceptor doping with ionic radii in the range of 0.5 ~ 0.95 Å could enhance the quality factor (see Fig. 40). This can be understood from the fact that even low level reduction is sufficient to cause a severe deterioration in the dielectric loss [241, 243], and the reduction of the Ti4+ ion can be prevented by a favorable compensation mechanism when the TiO2 is doped with divalent or trivalent ions having similar ionic radii to Ti4+ (~ 0.605 Å) [241]. Although TiO2 is not ferroelectrics, this result may shed some light on the mechanism of doping effects on loss, and Zn-, Cu-, Fe-, Mn-doped ferroelectrics are promising candidates for high power and broad bandwidth transducers applications if these ions will replace B-site Ti4+. Up to now, the complex behavior of dopants and defects, and their influence on the energy losses are far from being fully understood. There are still many important topics need to be studied, such as the role of anisotropy of internal bias, defect chemistry and related electronic structures, and growth of novel modified-crystals.
Figure 40.
Dielectric quality value Qdielectric (the inverse of dielectric loss factor) versus ionic radii of dopant cations for doped TiO2 ceramics. The low losse regions are marked as red. The high loss region indicates that the quality factors are too low to measure, and this region is marked as green. Adapted from Ref. [241]. The effective octahedral ionic radii employed were obtained from Ref. [242].
5.5 Temperature dependence of extrinsic losses
Temperature plays an important role in domain wall activity in ferroelectrics, thus can significantly affect the extrinsic losses. For various ferroelectrics, such as KDP [139], TGS [139], La1−xNdxP5O14 [140], Bi4Ti3O12 [244], BaTiO3 [245–246], PZT [247], RbH2PO3 [248], CsH2PO4 [248], RbH2AsO4 [248], Sr0.4(Na0.5Bi0.5)TiO3 [249], PbZrO3 [250–251], CdNa2O7 [252–253], PIN [254], LiKSO4 [255], Pb(Sc0.5Ta0.5)O3 [256], and 0.8PMN-0.2PT [139], it was found that the internal friction peak and dielectric loss peak appeared at several degrees below the Curie point. Such typical temperature dependent energy loss behavior is believed to be universal for materials with second- or weakly first-order ferroelectric and/or ferroelastic phase transitions, and is associated with viscous movements of domain walls, which is related to domain wall density (domain size) and the stability of interphase boundaries. At temperatures a few degrees below the Curie temperature, continuous change of order parameter, such as Ps, will lead to fast temperature induced variations of domain size, viscosity of domain wall motion, and the interaction of domains [138–139]. Then, the loss peak can be described using the theory proposed by Y.N. Huang and co-workers [138], which agrees well with experimental data of various materials, as shown in Fig. 41.
Figure 41.
The comparison between the theory (solid lines) and the experimental data (symbols) in the temperature dependent dielectric losses for various ferroelectrics. The temperature dependence of the density and the viscosity of domain walls, the order parameter and the interaction among domain walls were taken into account in the theory, which was proposed by Y.N. Huang and co-workers. Adapted from Refs. [138, 246, 248, 250, 256].
At low temperatures, the freezing of charge defects within domain walls could pin their motions, causing greatly reduced contributions to functional responses from domain wall motions. This lower level domain wall activity will also lead to a decreased mechanical loss, which has been observed in PMN-PT single crystals at 5 K [257]. Then, the mechanical quality factor was found to decrease abruptly at ~ 100 K, which can be explained by the mechanical relaxation of freezing induced by temperature [257–258].
6. Loss behavior of selected ferroelectrics
Choosing suitable materials is crucial for electromechanical devices that aim at different practical applications. The salient properties for various applications are summarized in Table 7. In the following, we will introduce the loss behavior together with other properties for some important ferroelectric materials.
Table 7.
Required materials performance for selected applications.
| Applications | Salient material properties |
|---|---|
| Actuators and high-precision positioning systems | High strain with high force |
| Sensors | High longitudinal piezoelectric activity |
| Single-element transducers | Low permittivity, large thickness coupling coefficient kt |
| Broadband transducers | High loss |
| Array transducers | Large longitudinal coupling coefficient k33 and large permittivity |
| Accelerometers, medical diagnostic, ferroelectric memory elements | High piezoelectric activity, high electromechanical coupling |
| Piezoelectric step-down transformers | Large electromechanical coupling, low loss, large dielectric constant |
| Piezoelectric servo-motor | Large lateral piezoelectric constant, low loss, large Young’s modulus |
| High power applications | High coercive field, low loss |
| High intensity focused ultrasound (HIFU) | High permittivity, high electromechanical coupling, low loss |
6.1 Ferroelectric ceramics
6.1.1 Ferroelectric ceramics with perovskite structure
6.1.1.1 Pb(Zr,Ti)O3-based ceramics
Pb(Zr,Ti)O3-based ceramics (PZTs) have been the mainstay in piezoelectric material markets over the past 60 years [259–266]. Crystalline structure and material properties of PZTs are strongly dependent on their compositions. Fig. 42(a) shows the phase diagram of PZT, where different regions correspond to different crystalline structures, and the MPB composition is located at zirconate-to-titanate ratio of 52:48 [267]. Around the MPB composition, anomalous material properties have been observed, as given in Fig. 42(b), where the piezoelectric coefficient, electromechanical coupling factor and dielectric constant (relative permittivity) were found to approach their maximum values [268]. However, the peak values are generally accompanied by large losses (including dielectric loss, mechanical loss and piezoelectric loss) near the MPB composition, which can be explained by the facilitated intrinsic polarization rotation and extrinsic domain wall motions in the structurally less-stable region.
Figure 42.
(a) Schematic phase diagram of PZT ceramic. (b) Composition versus various electrophysical parameters for PZT ceramics in the vicinity of MPB, where εT is the free permittivity; d is piezoelectric strain constant; k is electromechanical coupling factor; g is piezoelectric voltage constant; γp is pyroelectric constant; Q is mechanical quality factor; QT is mechanical quality factor under non-zero stress; k2QT is piezoelectric quality; εTk2QT is power density of the piezoelectric transformer; Δfr/Δf is relative change of the resonance frequency. Adapted from Refs. [267–268].
To meet specific application requirements, chemical composition of PZT could be modified by dopants, such as donor (Nb5+ on B site, La3+ on the A site) and acceptor (Fe3+,2+, Mn3+,2+, etc. on the B site), which give the wide range of piezoelectric properties in PZT family, as listed in Table 8. These doped PZT ceramics are usually categorized into two categories: ‘hard’ and ‘soft’ PZTs. Soft PZTs have been used for transducer applications due to their high dielectric and piezoelectric properties, while hard PZTs are good for high power applications because they can endure high electrical field and mechanical stresses. Of particular interest is the quality factor Q (for PZT based ceramics, quality factor Q is usually measured at the resonance frequency using a kp-plate, the Q values are supposed to be on the same order for different vibration modes in polycrystalline ceramics) of hard PZTs can reach as high as 2500, 30 times higher than that of soft PZTs. As discussed in Section 5.4, the low loss characteristic was believed to be associated with domain wall pining. The reduced domain wall activity also leads to lower extrinsic piezoelectric activity, thus the piezoelectric coefficients of hard PZTs are much smaller than that of soft PZTs.
Table 8.
Principle properties of PZT-based ceramics.
| Materials | TC [°C] | εr | d33 [pC N−1] | k33 | kp | Dielectric loss | Qp-r | Ref. |
|---|---|---|---|---|---|---|---|---|
| SoftPZTs | ||||||||
| PZT5A | 365 | 1770 | 400 | 0.72 | 0.60 | 0.020 | 75 | [259] |
| PZT5H | 195 | 3300 | 618 | 0.75 | 0.64 | 0.021 | 67 | [259] |
| Pz29 | 235 | 2870 | 574 | 0.75 | 0.64 | 0.016 | 49 | [260] |
| N-10 | 145 | 5440 | 635 | 0.68 | 0.50 | 0.010 | 70 | [261] |
| APC856 | 150 | 4100 | 620 | 0.73 | 0.65 | 0.027 | 72 | [262] |
| Vibrit 1100 | 177 | 4500 | 640 | 0.71 | 0.70 | 0.025 | 50 | [263] |
| K500 | 240 | 3000 | 580 | 0.73 | 0.63 | 0.020 | 170 | [264] |
| Hard PZTs | ||||||||
| PZT4 | 320 | 1300 | 290 | 0.71 | 0.58 | 0.004 | 500 | [259] |
| PZT8 | 300 | 1100 | 225 | 0.64 | 0.51 | 0.004 | 1000 | [259] |
| Pz24 | 330 | 407 | 194 | 0.67 | 0.50 | 0.002 | 370 | [260] |
| Pz52 | 250 | 1900 | 420 | 0.73 | 0.60 | 0.003 | 550 | [260] |
| Pz54 | 225 | 2500 | 500 | 0.71 | 0.60 | 0.004 | 1500 | [260] |
| APC841 | 320 | 1350 | 275 | 0.68 | 0.60 | 0.004 | 1400 | [262] |
| APC880 | 310 | 1000 | 215 | 0.62 | 0.50 | 0.004 | 1000 | [262] |
| K300 | 300 | 1500 | 320 | 0.71 | 0.56 | 0.004 | 400 | [264] |
| PZT:Mn,F | 282 | 1600 | 360 | 0.70 | 0.60 | 0.002 | 1300 | [269–270] |
| Fuji-C213 | 318 | 1500 | 320 | 0.68 | 0.58 | 0.003 | 2500 | [265] |
| N-8 | 320 | 900 | 226 | 0.67 | 0.56 | 0.004 | 1600 | [261] |
| Vibrit 202 | 330 | 1000 | 205 | 0.60 | 0.50 | 0.007 | 800 | [263] |
| PZT-PSM-Yb | 250 | 1900 | 420 | 0.73 | 0.70 | 0.003 | 550 | [271] |
PZT5A, PZT5H, PZT4, and PZT8 are trademarks of Morgan Crucible Company (UK);
Pz24, Pz29, Pz52, and Pz54 are trademarks of Ferroperm Piezoceramics A/S (Denmark);
N-8 and N-10 are trademarks of Tokin (Japan);
APC841, APC856, and APC880 are trademarks of American Piezo Ceramics International, Ltd. (USA);
Vibrit 202 and Vibrit 1100 are trademarks of Johnson Matthey Piezoproducts (Germany);
K300 and K500 are trademarks of Piezo Technologies (USA);
Fuji-C213 is trademark of Fuji Ceramics (Japan).
6.1.1.2 Lead-free ferroelectric ceramics with perovskite structure
In the past, innovations in electromechanical devices have been the driving force for new development in piezoelectric ceramics. Currently, the driving force also comes from environmental regulations, such as the draft directives on waste from electrical and electronic equipment (WEEE) and restriction of hazardous substances (RoHS), which require the replacement of lead contained ferroelectric materials because of their toxicity, hence, an enormous surge in the research on lead free ferroelectric ceramics occurred in the past decade [272–275].
Up to now, perovskite-type lead free ferroelectrics were believed to be promising materials to replace PZTs due to their relatively high dielectric and piezoelectric properties, in which potassium sodium niobate (KNN) and bismuth sodium titanate (Na1/2Bi1/2TiO3, NBT for short) based materials are two lead-free piezoelectric ceramics received a lot of attentions [274–277].
KNN is a solid solution of NaNbO3 (NN) and KNbO3 (KN) compounds. It was found that the functional properties of KNN solid solution were affected by the Na/K ratio, with MPB being formed by two adjacent orthorhombic ferroelectric phases, however, the properties are not markedly improved at MPB region [278]. One of the main obstacles in the development of KNN-based ceramics is the difficulty to achieve dense ceramics because of the evaporation of the alkali components at high temperature. By employing hot pressing or spark plasma sintering methods, the density of KNN ceramics can be increased from 4250 to 4460 kg m−3, giving rise to enhanced dielectric, piezoelectric, and electromechanical properties, as well as the improved quality factor from 130 to 240 [279–280]. In addition, the piezoelectric properties were found to be greatly enhanced by adding some dopants, due to the downward shift of the polymorphic phase transition close to room temperature, but with deteriorated thermal and field stabilities [281–282]. The relatively large d33 of 265 pC N−1 was obtained in KNN-LiSbO3 system [283], and can be further improved to 490 pC N−1 in (1−x)(K1−yNay)(Nb1−zSbz)O3-xBi0.5(Na1−wKw)0.5ZrO3 systems [276, 284–285]. Of particular interest is that the tetragonal-orthorhombic transition temperature in KNN-LiSbO3 system can be further shifted downward by a small amount CaTiO3 modification, leading to greatly improved temperature stability with less than 10% change in thickness shear piezoelectric constant d15 over the temperature range of −50 ~ 200 °C [282]. It was reported that the quality factor of various KNN-based ceramics is less than 300, limiting their applications in high power devices. To overcome this drawback, KNN-based ceramics are usually modified by copper-contained dopants, such as K4CuNb8O23, with the quality factor Q being increased to 1200 ~ 3000 [286–289]. Analogous to Mn doped hard PZTs, the enhanced quality factor in Cu modified KNN ceramics can be also understood by the defect dipoles of acceptor cations and oxygen vacancies, which pin the domain wall motions. Typical properties of various KNN-based ceramics are summarized in Table 9.
Table 9.
Principle properties of KNN-based ceramics.
| Materials | TC [°C] | εr | d33 [pC N−1] | kp | Ec [kV cm−1] | Dielectric loss | Qp-r | Ref. |
|---|---|---|---|---|---|---|---|---|
| KNN | 420 | 290 | 80 | 0.35 | - | 0.04 | 130 | [279] |
| KNN (Hot pressing) | 420 | 420 | 160 | 0.45 | 5.0 | 0.02 | 240 | [280] |
| KNN-Ca | - | 495 | 95 | - | - | 0.12 | - | [290] |
| KNN-Sr | - | 500 | 95 | - | - | 0.04 | - | [291] |
| KNN-Zn | 410 | 500 | 123 | 0.40 | 11.0 | 0.03 | 140 | [292] |
| KNN-CaTiO3 | 397 | 411 | 116 | 0.39 | 8.0 | 0.024 | 176 | [293] |
| KNN-LiSbO3 | 368 | 1380 | 265 | 0.50 | 17.2 | 0.02 | 40 | [283] |
| KNN-LiTaO3 | 323 | 540–1256 | 200–230 | 0.36–0.51 | 12.5 | - | 73 | [294–295] |
| KNN-Li0.5Bi0.5TiO3 | 381 | 1480 | 172 | 0.37 | - | 0.015 | 102 | [296] |
| KNN-BiScO3-Cu | 331 | 1100 | 224 | 0.40 | 15.0 | 0.017 | 288 | [297] |
| KNN-BiFeO3-LiSbO3 | 365 | 1556 | 257 | 0.52 | - | 0.02 | 45 | [298] |
| KNN-LiTaO3-LiSbO3 | 265–290 | 665–1865 | 315 | 0.48 | 8.2 | 0.01-0.035 | 50 | [301–302] |
| KNN-LiTaO3-LiSbO3-Ba | 266 | 1173 | 210 | 0.35 | 9.8 | 0.026 | 72 | [301] |
| KNN-LiTaO3-LiSbO3-Cu | 264 | 1230 | 260 | 0.48 | 6.9 | 0.008 | 225 | [299] |
| KNN-K4CuNb8O23 (KCN) | 410 | 292 | 90 | 0.36 | 11.6 | 0.006 | 1500 | [286] |
| KNN-K1.94Zn1.06Ta5.19O15 (KZT) | 390 | 590 | 126 | 0.42 | 10.0 | - | 58 | [300] |
| KNN-K5.4Cu1.3Ta10O29 (KCT) | 390 | - | 190 | 0.42 | 9.8 | 0.003 | 1200 | [287] |
| KNN-KCT-LiNbO3 | 415 | 340 | 196 | 0.43 | 16.0 | - | 1270 | [288] |
| KNN-KCT-Cu | - | 297 | 96 | 0.38 | 12.0 | 0.002 | 3053 | [289] |
NBT is another important perovskite lead-free ferroelectric material, exhibiting high Curie temperature Tc ~ 320 °C and high coercive field Ec ~ 73 kV cm−1 [303–304]. The most attractive binary NBT-based systems with relatively high piezoelectric activities are (1−x)Na1/2Bi1/2TiO3-xBaTiO3 (NBT-BT) and (1−x)Na1/2Bi1/2TiO3-xk1/2Bi1/2TiO3 (NBT-KBT) solid solutions, in which the MPBs separating monoclinic and tetragonal phases are located at x ~ 6 mol% and x ~ 20 mol%, respectively [304–306]. Analogous to KNN-based ceramics, NBT-based ceramics have also been chemically modified to obtain increased mechanical quality factor. It was observed that in some acceptor (Mn2+, 3+, Co3+) modified NBT-based systems, the quality factors Q can be substantially increased from 100 to 1000 [307–309]. Of particular significance is that the quality factor of acceptor-modified NBT-based ceramics was found to possess high field stability at high vibration velocity (or applied high electric field at resonance frequency) [309], as shown in Fig. 43. Such a stability of low loss behavior at resonance frequency is associated with the high coercive field and internal bias, demonstrating that NBT-based ceramics are promising candidates for high power applications. The main properties of various NBT-based ceramics are summarized in Table 10.
Figure 43.
Change in the mechanical quality factor as a function of vibration velocity for NBT-based, BT-based ceramics, compared to PZT4 and PZT8 ceramics. Adapted from Ref. [309].
Table 10.
Principle properties of NBT-based ceramics.
| Materials | TC [°C] | εr | d33 [pC N−1] | kp | Ec [kV cm−1] | Dielectric loss | Qp-r | Ref. |
|---|---|---|---|---|---|---|---|---|
| 0.94NBT-0.06BT | 288 | 580 | 125 | 0.30 | - | 0.013 | - | [306] |
| 0.84NBT-0.16KBT | - | 635 | - | 0.31 | - | - | 195 | [305] |
| 0.80NBT-0.20KBT | 280 | 1030 | 150 | 0.27 | 27 | - | 109 | [305] |
| NBT-BT-La | 273 | 1651 | 131 | 0.24 | 31 | 0.046 | 182 | [310] |
| NBT-BT-Nb | - | 1614 | 118 | 0.20 | - | 0.046 | 199 | [311] |
| NBT-BT-Co | - | 1200 | 139 | 0.27 | - | 0.023 | 253 | [311] |
| NBT-BT-Ta | 273 | 1861 | 171 | 0.33 | - | 0.058 | - | [312] |
| NBT-BT-La-Nb | - | 1664 | 135 | 0.19 | - | 0.044 | 127 | [311] |
| NBT-BT-La-Co | - | 1284 | 127 | 0.25 | - | 0.021 | 263 | [311] |
| NBT-BT-Ca-Mn | 278 | 1137 | 179 | 0.37 | 28 | 0.025 | 170 | [313] |
| NBT-BT-Ce-La | 285 | 831 | 162 | - | 38 | 0.020 | - | [314] |
| NBT-KBT-BT-Co | 285 | 580 | 128 | 0.22 | 34 | 0.010 | 620 | [308] |
| NBT-KBT-LBT-Mn | 272 | - | - | 0.23 | - | 0.035 | 700 (Qp-r); 400 (Q33-r) | [307] |
6.1.2 Non-perovskite ferroelectric ceramics
There is a wide range of non-perovskite ferroelectrics, such as bismuth layer structured ferroelectric (BLSF) and tungsten bronze families. BLSF has crystal structure in which the bismuth oxide layers are interleaved with the pseudo-perovskite blocks along the pseudo-tetragonal [001] direction.
The general formula of BLSF is (Bi2O2)2+(Am−1BmO3m+1)2−, where A is mono-, di-, or trivalent ions; B is tetra-, penta-, or hexavalent ions, and m is the number of BO6 octahedra in the pseudo-perovskite block that usually lying in the range of 1 ~ 5. Part of the crystal structure of BLSF is shown schematically in Fig. 44.
Figure 44.
Schematic diagrams of BLSF (left) and tungsten bronze (right) crystal structures. Adapted from Refs. [315–316].
Compared with perovskite ferroelectric ceramics, BLSFs usually have low dielectric constant, low piezoelectric activity but high Curie temperature and ultrahigh quality factors. For various BLSF ceramics with different TC, it was found that intermediate-TC range offered a good balance between increase of Q with TC and decrease of d due to hindered polarization switching [317]. To obtain ultrahigh quality factors up to 10000, BLSF ceramics with high-TC compositions should be poled at high temperatures since sufficient polarization inversion is needed to remove all 180° domain walls and construct stable domain configurations [317]. Meanwhile, the intrinsically high coercive field Ec (~ 40 kVcm−1) of BLSF ceramics also play an important role in their high quality factors since the domain configuration are stable and domain wall motions are not energetically facilitated.
Currently, BLSF ceramics have been studied for ceramic oscillator and high-temperature sensor applications. In addition, textured BLSF ceramics were demonstrated to possess improved piezoelectric activity [318–322]. As shown in Fig. 45, for textured BLSF ceramics Sr0.9Nd0.1Bi2Nb2O9 and Ca0.8Bi4.2Ti4O15, the vibration velocities increased proportionally to the applied electric field with the resonant frequencies being maintained at the same values [322]. Meanwhile, the energy dissipation power density of these ceramics is much lower than those of PMN-PZT ceramics [322]. Here, energy power can be evaluated by the product of the effective value of the applied voltage and the electric current, while the energy dissipation power can be obtained by subtracting the output electric power from the input one. Then, the electric power dissipation of transducers was assessed for the unit volume of transducers. Note that although non-textured BLSF ceramics exhibit lower piezoelectric activity than those of their textured counterparts, they possess higher quality factors > 10000 [317]. The typical properties of textured and non-textured BLSF ceramics are summarized in Table 11.
Figure 45.
High-power piezoelectric characteristics of textured BLSF ceramics, compared to PZT and PMN-PZT ceramics. (a) Applied electric field dependence of vibration velocity. (b) Vibration velocity dependence of resonant frequency change. (c) Vibration velocity dependence of dissipation power density (SBN: Sr0.9Nd0.1Bi2Nb2O9 + 0.5 wt% MnCO3; CBT: Ca0.8Bi4.2Ti4O15 + 0.5 wt% MnCO3; BLT: Bi3.25La0.75Ti2.97Nb0.03O12 + 0.3 wt% MnCO3). Adapted from Refs. [318, 322].
Table 11.
Principle properties of selected BLSF ceramics.
| Materials | TC [°C] | k33 | d33 [pC N−1] | εr | Q33-r | Ref. |
|---|---|---|---|---|---|---|
| Textured BLSF ceramics | ||||||
| Bi4Ti3O12 | 650 | 0.09 | 18.0 | 120 | 600 | [260] |
| CaBi4Ti4O15 | 790 | 0.05 | 7.0 | 141 | 2500 | [323] |
| CaBi4Ti4O15+ MnCO3 | 800 | 0.08 | 14.0 | 148 | 4300 | [323] |
| Ca0.8Bi4.2Ti4O15 + 0.5 wt% MnCO3 | - | 0.34 | 30.4 | 128 | 3200 | [322] |
| Bi3.25La0.75Ti2.97Nb0.03O12 + 0.3 wt% MnCO3 | - | 0.27 | 29.7 | 185 | 3000 | [322] |
| Bi4Ti3O12−SrBi4Ti4O15 | - | 0.17 | 19.7 | - | 3190 | [324] |
| Bi4Ti3O12−SrBi4Ti4O15 + 0.4 wt% MnCO3 | - | 0.22 | 24.4 | - | 4480 | [324] |
| Bi4Ti3O12−SrBi4Ti4O15 + 0.8 wt% MnCO3 | - | 0.20 | 21.4 | - | 3630 | [324] |
| Sr0.9Nd0.1Bi2Nb2O9 + 0.5 wt% MnCO3 | - | 0.33 | 30.8 | 125 | 3200 | [322] |
| Sr0.9Nd0.1Bi2Nb2O9 + 0.5 wt% MnCO3 | - | 0.17 (k15) | 27.0 (d15) | 125 | 2300 (Q15-r) | [325] |
| Nontextured BLSF ceramics | ||||||
| Sr0.25Bi2.75Ti0.75Ta1.25O9 | 710 | 0.16 | 16.6 | 119 | 7800 | [318] |
| Bi4Ti2.98V0.02O12 | 534 | 0.25 | 25.0 | 72 | 2900 | [318] |
| Bi4Ti3O12−SrBi4Ti4O15 + 0.2 wt% MnCO3 | 534 | 0.22 | 24.1 | 120 | 4900 | [318] |
| Sr1.4Ca0.6Bi4Ti15O18 + 0.2 wt% MnCO3 | 413 | 0.16 | 20.2 | 103 | 5100 | [318] |
| Sr0.9Nd0.1Bi2Nb2O9 + 0.5 wt% MnCO3 | - | 0.17 | 14.0 | 100 | 2030 | [326] |
| Sr0.9Nd0.1Bi2Nb2O9 + 0.5 wt% MnCO3 | - | 0.12 (k15) | 12.0 (d15) | 100 | 1000 (Q15-r) | [325] |
Another important case in non-perovskite ferroelectrics is lead metaniobate PbNb2O6 with tungsten bronze structure. Tungsten bronze is a very large family of oxygen octahedral ferroelectrics possessing the general formula (A12A24C4)(B12B28)O30, with the crystal structure illustrated in Fig. 44. For PbNb2O6, five out of the available six A sites are occupied by Pb2+ and the B sites by Nb5+. PbNb2O6 ceramics exhibit high Curie temperature above 500 °C, strong anisotropic piezoelectric behavior and ultra-low quality factor Q, thus have been employed in nondestructive evaluation applications at high temperatures, where low Q is required [327–330]. The fabrication of high density PbNb2O6 ceramics is very difficult because of exaggerated grain growth due to the phase transformation from rhombohedral to tetragonal structures during sintering [328–330]. Various techniques, such as hot-press and chemical modification [328–332], have been used to obtain dense PbNb2O6-based ceramics, which was found to dominate the piezoelectric activity and energy dissipation. As shown in Fig. 46, an increase in the quality factor Q from 6 to 32 was observed with the relative density increasing since energy loss is easily induced by the presence of porosity in the ceramic [334]. Note that the stability of the pure ferroelectric-phase in PbNb2O6 solid solution is limited [328–330, 335]. Thus, the phase boundaries separating various polymorphs such as rhombohedral/tetragonal, together with charged defects, such as oxygen vacancies [336], also lead to the high loss characteristic of PbNb2O6-based ceramics. The principle properties of PbNb2O6-based ceramics are summarized in Table 12.
Figure 46.
Relative density dependence of quality factor Q for PbNb2O6 ceramics, in which the theoretical density of 6700 kg m−3 was used [333]. Data are from Refs. [328–331].
Table 12.
Principle properties of lead metaniobate (PbNb2O6) based ceramics.
| Materials | Density [kg m−3] | TC [°C] | εr | d33 [pC N−1] | kp | kt | k33 | Qp-r | Ref. |
|---|---|---|---|---|---|---|---|---|---|
| PbNb2O6 | - | 517 | 227 | - | - | - | 0.35 | 6 | [329] |
| PbNb2O6 | 5820 | 550 | 280 | 76 | 0.04 | 0.26 | - | 15 | [330] |
| PbNb2O6 | 5900 | 534 | 340 | 104 | 0.05 | 0.35 | - | 10 | [330] |
| PbNb2O6 | 6360 | 540 | 430 | 60 | 0.04 | 0.23 | - | 32 | [330] |
| PbNb2O6 | 6000 | - | 190 | 85 | - | 0.38 | - | 10 | [331] |
| PbNb2O6-Ti | - | 537 | 165 | - | - | - | 0.36 | 13 | [329] |
| PbNb2O6-Mn-Ca | 6200 | 540 | 503 | - | - | 0.34 | - | 22 | [328] |
| Pb0.75Ba0.25Nb2O6 | - | 363 | 622 | - | - | - | 0.34 | 16 | [329] |
| Pb0.6Ba0.4Nb2O6-La | 5950 | - | 1610 | 110 | 0.15 | 0.30 | - | 51 | [331] |
| Pb0.62Ba0.38Nb2O6-La | 6050 | - | 1700 | 180 | 0.10 | 0.49 | - | 13 | [331] |
| Pb0.6Ba0.4Nb2O6-La | - | 380 | - | - | 0.23 | 0.18 | - | 45 | [332] |
6.2 Ferroelectric single crystals
6.2.1 Relaxor based ferroelectric single crystals
In the past 20 years, relaxor-PT single crystals have been actively studied for high performance ultrasonic transducer applications, which can be categorized into three generations, as proposed by W. A. Smith [337]. High performance binary PMN-PT crystals belong to the first generation, while PIN-PMN-PT crystals with higher Curie temperature and larger coercive field were categorized into the second generation, with expanded usage range of temperature, electric field and mechanical stress; while the third generation crystals refers to ternary relaxor-PT systems with minor dopants to further tailor their electromechanical parameters, such as manganese modified PIN-PMN-PT, which possesses much higher mechanical quality factor with comparable piezoelectric properties. Interestingly, these three crystal generations possess different energy dissipation behavior.
The longitudinal properties of relaxor-PT crystals are listed in Table 13, including dielectric, piezoelectric constants and quality factors of the rhombohedral, monoclinic (or orthorhombic), and tetragonal phases for relaxor-PT crystals, properties for PMN-PT ceramics are also listed for comparison. As shown in Table 13, for a given engineered domain configuration, such as ‘4R’, both PMN-PT and PIN-PMN-PT single crystals exhibit high longitudinal electromechanical coupling k33 and piezoelectric coefficient d33, being on the order of 0.9 and > 1600 pC N−1, respectively. The electromechanical quality factor Q33−r of ternary PIN-PMN-PT crystals, being ~ 200 (for ‘4R’), is about 40% higher than that of binary PMN-PT crystals. Of particular significance is that the Mn-modifield PIN-PMN-PT single crystals exhibit the highest quality factors, being on the order of 500 ~ 1000, while maintaining the ultrahigh electromechanical coupling k33 ~ 0.9 [223]. In addition, the piezoelectric loss of relaxor-PT single crystals at high electric field was reported to be small compared to their ceramic counterpart, due to the high stability of the engineered domain configuration [169, 338].
Table 13.
Longitudinal property comparison among various relaxor-PT crystals and ceramics.
| Materials | TC [°C] | Ec/Eint [kV cm−1] | Poling direction | Domain configuration | εr | d33 [pC N−1] | k33 | Q33-r | Q33-a |
|---|---|---|---|---|---|---|---|---|---|
| Binary Crystals | |||||||||
| 0.74PMN-0.26PT† | 118 | 2.0/- | [111]c | 1R | 730 | 76 | 0.37 | 2200 | - |
| [011]c | 2R | 3320 | 810 | 0.88 | 850 | - | |||
| [001]c | 4R | 4400 | 1200 | 0.88 | 150 | - | |||
| 0.71PMN-0.29PT | 133 | 2.3/- | [111]c | 1R | 670 | 100 | 0.41 | 910 | 950 |
| [011]c | 2R | 4050 | 860 | 0.90 | 410 | 720 | |||
| [001]c | 4R | 5700 | 1600 | 0.91 | 120 | 420 | |||
| 0.67PMN-0.33PT | 155 | 2.8/- | [001]c | 4O | 7700 | 2500 | 0.94 | 90 | 330 |
| 0.63PMN-0.37PT | 172 | 5.8/- | [001]c | 1T | 1200 | 540 | 0.82 | 750 | 1450 |
| [111]c | 3T | 7500 | 860 | 0.77 | 170 | 320 | |||
| Ternary Crystals | |||||||||
| 0.24PIN-0.49PMN-0.27PT | 160 | 4.8/- | [111]c | 1R | 650 | 75 | 0.40 | 1900 | 2100 |
| [011]c | 2R | 3100 | 780 | 0.86 | 870 | 1140 | |||
| [001]c | 4R | 4200 | 1100 | 0.88 | 240 | 560 | |||
| 0.24PIN-0.46PMN-0.30PT | 171 | 5.2/- | [111]c | 1R | 680 | 102 | 0.43 | 1300 | 1600 |
| [011]c | 2R | 4170 | 850 | 0.89 | 610 | 820 | |||
| [001]c | 4R | 5400 | 1620 | 0.92 | 180 | 500 | |||
| PIN-PMN-PT(M) | 194 | 5.7/- | [011]c | 1O | 1900 | 410 | 0.73 | 1250 | 2100 |
| [001]c | 4O | 6320 | 2100 | 0.94 | 120 | 400 | |||
| PIN-PMN-PT(T) | 212 | 7.9/- | [001]c | 1T | 1000 | 510 | 0.83 | 1200 | 2200 |
| [111]c | 3T | 7400 | 820 | 0.80 | 240 | 410 | |||
| Mn doped Crystals | |||||||||
| PIN-PMN-PT:Mn (R) | 192 | 5.4/0.6 | [111]c | 1R | 700 | 90 | 0.40 | 1700 | 1820 |
| [011]c | 2R | 2900 | 720 | 0.89 | 900 | 1700 | |||
| [001]c | 4R | 3800 | 1200 | 0.91 | 490 | 1200 | |||
| PIN-PMN-PT:Mn (M) | 204 | 7.0/0.9 | [011]c | 1O | 1200 | 270 | 0.68 | 1200 | 2320 |
| [001]c | 4O | 4100 | 1400 | 0.94 | 210 | 470 | |||
| PIN-PMN-PT:Mn (T) | 225 | 9.5/1.0 | [001]c | 1T | 960 | 500 | 0.82 | 2000 | 4200 |
| [111]c | 3T | 7000 | 880 | 0.79 | 260 | 390 | |||
| Polycrystalline ceramics | |||||||||
| PMN-PT | 150 | 5.0/- | - | - | 5800 | 800 | 0.73 | 65 | 90 |
: Ref. [105]
Note that for single domain configurations, including ‘1R’, ‘1O’ and ‘1T’, all crystals exhibit ultrahigh longitudinal mechanical quality factors [Qm (Q33−a) is up to 2000] due to the absence of domain walls and the lack of polarization rotation, indicating that domain configuration and domain walls play an important role in controlling the energy dissipation in ferroelectric materials. For the PMN-PT ceramics, on the other hand, the piezoelectric and electromechanical properties were found to be inferior to their single crystal counterparts. In particular, the electromechanical quality factor, Q33−r ~ 65, is lower than that of PMN-PT crystals, due to the additional energy loss induced by domain walls and grain boundaries. For [001]c oriented tetragonal crystals with ‘1T’ single domain state, the ternary PIN-PMN-PT single crystals were found to exhibit higher mechanical quality factor, while possessing comparable dielectric and piezoelectric properties to those of binary PMN-PT single crystals with the same PT content. As listed in Table 13, the values of Q33−r (1200) and Q33−a (2200) of PIN-PMN-PT crystals are 60% and 50% higher than those of corresponding PMN-PT single crystals, respectively. Such difference in loss behavior between PMN-PT and PIN-PMN-PT crystals was also observed in [111]c poled rhombohedral crystals (‘1R’ single domain state) with composition in the vicinity of the MPB, where the values of Q33−r (1300) and Q33−a (1600) of 0.24PIN-0.46PMN-0.30PT crystals are 40% and 70% higher than those of 0.71PMN-0.29PT crystals. Considering the composition-dependent loss behavior as discussed in Section 4.5, the above difference will be enlarged between PIN-PMN-PT and PMN-PT crystals with the same PT content, such as 0.24PIN-0.46PMN-0.30PT versus 0.70PMN-0.30PT, or 0.24PIN-0.47PMN-0.29PT versus 0.71PMN-0.29PT. Such a ‘hard’ behavior for polarization elongation in ternary PIN-PMN-PT crystals is associated with their higher Curie temperature and higher coercive field compared to their binary counterparts, suggesting a more stable polarization state. Of particular interest is that for rhombohedral crystals with compositions away from the MPB, the divergence in loss behavior of ternary PIN-PMN-PT and binary PMN-PT systems is not evident, where the 0.27PIN-0.49PMN-0.27PT crystals were found to possess similar quality factors Q33−r as those of corresponding 0.74PMN-0.26PT single crystals, being on the order of 2000. This can be understood from the fact that both PIN-PMN-PT and PMN-PT rhombohedral crystals with compositions away from MPB possess stable single domain state when poled along [111] direction [135, 172]. On the other hand, the ternary PIN-PMN-PT crystals show much higher coercive fields (Ec ~ 5–6 kV cm−1) than those of PMN-PT (Ec ~ 2–3 kV cm−1). Thus, as the composition approaching the MPB, stable single domain state in ternary PIN-PMN-PT system is more favorable through proper poling procedure when compared to binary PMN-PT, accounts for their enhanced mechanical Q.
It should be noted that for both binary and ternary relaxor-PT single crystals, high level shear piezoelectric activity, d15 > 2000 pC N−1, was observed in single domain rhombohedral, orthorhombic and tetragonal samples. All these single domain samples have ultra low shear electromechanical quality factors Q15-r (only ~ 30), as listed in Table 2. Based on the discussion in Section 4.2, such low Q-values may be attributed to the easy polarization rotation under a perpendicular electric field in these single domain crystals, being related to the large torque M (see Eq. (30)), low and long relaxation time τ (see Eq. (35)).
It is clear that for relaxor-PT crystals with single domain configuration, the functional properties, including elastic, dielectric and piezoelectric coefficients, are dominated by the intrinsic effect, exhibiting no obvious difference in PIN-PMN-PT and PMN-PT crystals. Thus, the difference in energy dissipation between PMN-PT and PIN-PMN-PT crystals is mainly attributed to the extrinsic effect, as mentioned above regarding the less stable single domain states.
For domain engineered relaxor-PT crystals, on the other hand, [011]c poled rhombohedral 0.24PIN-0.46PMN-0.30PT single crystals possesses a high Q33−r value of 610, 50% higher than that of 0.71PMN-0.29PT (Q33−r = 410). Meanwhile, both longitudinal piezoelectric coefficient and electromechanical coupling factor of these two crystals were found to be on the same order (d33 = 850 pC N−1 and k33 = 0.89 versus d33 = 860 pC N−1 and k33 = 0.90). Similar properties were also observed in ‘4R’ domain engineered single crystals, as summarized in Table 14.
Table 14.
The energy loss performance comparison between PMN-PT and PIN-PMN-PT single crystals with engineered domain state.
| Materials | Domain configuration | k33 | d33 [pC N−1] | Q33-r | Q33-a | Dielectric loss | Elastic loss | Piezoelectric loss |
|---|---|---|---|---|---|---|---|---|
| 0.71PMN-0.29PT | 2R | 0.90 | 860 | 410 | 720 | 0.003 | 0.0032 | 0.0033 |
| 0.24PIN-0.49PMN-0.30PT | 2R | 0.89 | 850 | 610 | 820 | 0.002 | 0.0029 | 0.0023 |
| 0.71PMN-0.29PT | 4R | 0.91 | 1600 | 120 | 420 | 0.004 | 0.0114 | 0.0087 |
| 0.24PIN-0.49PMN-0.30PT | 4R | 0.92 | 1620 | 180 | 500 | 0.004 | 0.0068 | 0.0059 |
It was concluded that in domain engineered crystals, intrinsic polarization rotation inevitably coexists with the extrinsic domain wall motions and these two factors cooperatively contribute to both piezoelectric activity and energy dissipation. Note that the high piezoelectric activity in rhombohedral relaxor-PT based crystals is believed to be intrinsic in nature (the extrinsic contribution is < 10%, due to the high stability of the engineered domain). Such strong intrinsic effect (polarization rotation) also plays an important role in the energy dissipation behavior for a given relaxor-PT crystal, which leads to the ultra low quality factors for thickness shear k15-mode in single domain samples. However, as discussed above, for crystals involving domain wall motions, including crystals with unstable single-domain state and domain engineered crystals, the difference in energy dissipation between PMN-PT and PIN-PMN-PT is attributed to extrinsic effects, namely, domain wall activities, which can be regarded as a relaxation process.
Owing to the lower domain wall activity, PIN-PMN-PT crystals exhibit higher quality factors Q33−r and Q33−a, also, lower elastic and piezoelectric losses are expected compared to PMN-PT crystals. Based on the calculations proposed in Section 2.4, elastic and piezoelectric losses were derived and given in Table 14. For a specified domain configuration, such as ‘4R’, calculated elastic and piezoelectric losses of 0.24PIN-0.46PMN-0.30PT crystals were 0.0068 and 0.0059, respectively, much lower than those of 0.71PMN-0.29PT crystals, being on the order of 0.011 and 0.0068, respectively. The trends were confirmed by experimental results as shown in Fig. 47, where the zero bias micro-strains versus stress for [001] poled 0.70PMN-0.30PT and 0.26PIN-0.44PMN-0.30PT single crystals were compared [126–127]. Considering the stress induced phase transitions, the discussions here are limited to low stress range, as indicated in the inset of Fig. 47. Obviously, low level of elastic strain-stress hysteresis was observed in PIN-PMN-PT, suggesting a low elastic loss. In addition, Rayleigh analyses for PMN-PT and PIN-PMN-PT crystals with different domain configurations are given in Fig. 48. For a given domain configuration, either ‘2R’ or ‘4R’, 0.24PIN-0.46PMN-0.30PT and 0.71PMN-0.29PT crystals exhibit almost the same piezoelectric coefficients d33, which are calculated from the slopes of strain-field curves, but different S-E hysteresis, which is calculated using Eq. (32).
Figure 47.
Zero bias micro-strain versus stress for [001]c poled 0.70PMN-0.30PT (blue solid line) and 0.26PIN-0.44PMN-0.30PT single crystals (red solid line), whereby the inset shows the magnified strain-stress curves of two crystals under low stress field. Data are from Refs. [339–340].
Figure 48.
Comparison of the low-field piezoelectric hysteresis of (a) 0.24PIN-0.46PMN-0.30PT and (b) 0.71PMN-0.29PT single crystals with ‘2R’ and ‘4R’ domain configurations. Piezoelectric loss (S-E_delay) was calculated by Eq. (32) in Section 3.5.
Based on the above results and discussions, the following conclusions can be reached:
High piezoelectric activity in relaxor-PT based crystals is dominated by intrinsic effect (> 90%);
Extrinsic contribution to the piezoelectric activity (~ 5%) for PIN-PMN-PT crystals is generally lower than that (~ 10%) of PMN-PT crystals (see Fig. 30(b)).
Compared with binary PMN-PT crystals, ternary PIN-PMN-PT crystals exhibit lower loss values but similar piezoelectric properties;
These results suggest that the lower loss behavior in PIN-PMN-PT is attributed to the decreased loss from extrinsic contributions, namely, domain wall motions. Therefore, it can be concluded that lower domain wall activity in ternary PIN-PMN-PT crystals plays an important role in the energy loss difference observed in PMN-PT and PIN-PMN-PT crystals, leading to the increased quality factors without sacrificing the piezoelectric activity. The reason is that the piezoelectric properties are dominated by the intrinsic polarization rotation (strong anisotropic characteristics) [23].
6.2.2 Lead-free ferroelectric single crystals
Analogous to their ceramic forms, KNN- and NBT-based single crystals have been actively studied in the past decade [341–349]. Table 15 lists typical properties of various KNN- and NBT- single crystals. It was found that good dielectric and piezoelectric properties of these materials were achieved at MPB compositions, which can be further improved by chemical modifications. However, there are limited data on quality factors of KNN and NBT based single crystals, with dielectric loss of 0.004 being reported for Mn-modifield KNN single crystals [343]. The microcracks in crystals strongly affect the loss behavior, thus measured mechanical quality factors in small-sized crystals with relative poor quality could be very low and unrealistic. Although the domain wall pining induced by the acceptor-oxygen vacancy defect dipoles was believed to be the origin of the low loss, the impact of crystal quality will greatly affect the measured results.
Table 15.
Principle properties of NBT- and KNN-based single crystals.
| Materials | TC [°C] | εr | d33 [pC N−1] | kt | k33 | Dielectric loss | Ref. |
|---|---|---|---|---|---|---|---|
| NBT-based single crystals] | |||||||
| 0.96NBT-0.04BT | 282 | 1230 | 283 | 0.50 | - | 0.018 | [348] |
| 0.95NBT-0.05BT | 286 | 1100 | 420 | 0.67 | - | 0.027 | [341] |
| 0.94NBT-0.06BT | 288 | 1040 | 400 | 0.69 | - | 0.019 | [341] |
| 0.93NBT-0.07BT | 283 | 993 | 373 | 0.66 | - | 0.027 | [341] |
| 0.95NBT-0.05BT-Mn | 282 | 1090 | 483 | 0.56 | - | 0.019 | [349] |
| KNN-based single crystals | |||||||
| KNN | 393 | 240 | 160 | 0.45 | - | 0.020 | [346] |
| KNN-Li | - | 164 | - | 0.70 | - | 0.025 | [347] |
| KNN-Mn | 407 | 424 | 161 | - | 0.64 | 0.004 | [344] |
| KNN-Li-Ta | 276 | 500 | 255 | 0.65 | 0.88 | 0.010 | [342] |
| KNN-K-Ta | 295 | 267 | 162 | 0.65 | 0.83 | 0.004 | [343] |
LiNbO3 is another important lead-free material with corundum structure, which has been widely employed in electromechanical and optical applications. The crystal structure of LiNbO3 is illustrated in Fig. 49, in which the cations occupy octahedral sites in the order Nb, vacancy, Li, vacancy, etc. [350–351] Of particular interest is that the mechanical quality factor of poled LiNbO3 reaches an ultrahigh value of 10000. Below the Curie temperature, the structure of LiNbO3 transforms from 3̅m to 3m symmetry. Thus LiNbO3 is a uniaxial ferroelectric, in which the polarization can only be positive or negative, so that only 180° ferroelectric domains exist in unpoled crystals while single domain configuration can be achieved after poling [352]. Thus, the origin of low loss behavior in LiNbO3 single crystals is attributed to the following: 1) hard polarization elongation effect (confirmed by the weak piezoelectric activity of d33 = 6 pC N−1); 2) no non-180° domain walls, revealing the absence of extrinsic energy loss.
Figure 49.
Positions of the lithium and niobium ions with respect to the oxygen octahedron in the paraelectric and ferroelectric phases of lithium niobate crystals. Adapted from Refs. [350–351]. Single domain lithium niobate single crystals can be grown under applied field. Together with the hard polarization elongation, lithium niobate single crystals exhibit very high mechanical quality factor ~ 10000.
7. Summary and future perspective
7.1 Summary
Losses in ferroelectrics that are essential for theoretical studies and engineered applications have been reviewed. A general theoretical model has been proposed to correlate elastic, dielectric, piezoelectric, and mechanical losses. In addition, the relationship between the mechanical Qm and experimentally measured quality factors Qr (and Qa) has been clarified. For all piezoelectric resonators, the resonance state corresponds to the minimum impedance under constant electric field (E), while the antiresonance state is associated with the maximum impedance at constant electric displacement (D). For stiffened resonators, such as k33-bar, the mechanical response is associated with related elastic constants under constant (or zero) D, whereas the mechanical response of unstiffened resonators, such as k31-bar, corresponds to elastic constants under constant (or zero) E. Consequently, the mechanical Qm is equal to Qa in stiffened modes but to Qr in unstiffened modes. Furthermore, for systems with giant piezoelectric coefficients, such as relaxor-PT crystals, strong electromechanical coupling effect introduces an obvious difference between the values of Qr and Qa. A method has been proposed to obtain individual elastic, dielectric, piezoelectric losses for such systems.
Loss mechanisms in ferroelectric single crystals and ceramics have been investigated. Easy polarization variations (rotation, elongation, compression) and domain wall motions, being related to the intrinsic and extrinsic contributions, respectively, are thought to be responsible for the enhanced functional properties and decreased quality factors in ferroelectric single crystals. The phase boundary region (either by temperature or composition) and related structural instability are thought to be the critical factors for the easy polarization variations, leading to decreased quality factors but enhanced piezoelectric properties. For polycrystalline piezoceramics, it is believed that the effects of grain boundaries and grain size also play critical roles in dominating the loss behavior in these materials.
Loss behavior in various ferroelectric materials, including PZTs, KNN-, NBT- based ceramics, BLSFs, PbNb2O6-based ceramics, LiNbO3 single crystals, and relaxor-PT single crystals, have been summarized together with their piezoelectric activities. As shown in Fig. 50, the piezoelectric activity and the quality factors (inverse of loss) cannot be enhanced at the same time since the enhancement factors contributing to superior functional responses also contribute to the loss generation. Of particular interest is the energy loss behavior in relaxor-PT crystals, which exhibits a highly tunable characteristic. A wide range of mechanical quality factor values spanning two orders of magnitude has been achieved in relaxor-PT crystals, which depends on the domain structures, domain size, crystal phase, crystal orientation, composition and doping defects. It was demonstrated that the high dielectric and piezoelectric activities in relaxor-PT based crystals are mostly intrinsic in nature. However, the energy dissipation behavior is strongly affected by the extrinsic contributions.
Figure 50.
The relationship between electromechanical quality factor Q and longitudinal piezoelectric constant d33 for various ferroelectrics: (a) ferroelectric ceramics and (b) single crystals. Data are form the Refs listed in Tables 9–14.
7.2 Future perspective
There are still some challenging questions to be answered in order to thoroughly understand the loss behavior in ferroelectric materials:
In contrast to the well-studied material constants, such as dielectric and piezoelectric, limited studies have been conducted on the energy loss behavior due to the lack of kinetic data. For designing next generation functional materials, it is important to pay more attention to the kinetic process so that the loss characteristics can be fully understood.
It should be noted that most of the reported properties on losses in ferroelectric materials are usually determined under small stimuli without offering high-power characteristics under high driving fields. It was found that for hard PZTs the mechanical quality factor is significantly decreased with increasing electric field, but NBT based hard materials exhibited promising behavior under hard drive conditions [353]. Thus, it is desirable to understand the loss behavior under high fields, including electric and mechanical fields, which will greatly benefit practical designs of electromechanical devices.
It has been concluded that both of the intrinsic and extrinsic effects contribute to piezoelectric activity and loss behavior in ferroelectrics. However, the intrinsic contribution is the dominant factor to improve the piezoelectric activity of domain engineered ferroelectric crystals, while both polarization variations and domain wall activities strongly affects the mechanical quality factor and loss related properties. Therefore, understanding the relationship between polarization rotation and domain switching, and tuning them separately are of particular interest for developing next generation high-performance electromechanical materials.
For relaxor-PT single crystals, it is clear that the loss behavior can be controlled by employing domain-engineering and acceptor doping strategies, leading to a wide range of mechanical quality factor values from < 100 to > 4000. Similar approaches can be used in lead-free ferroelectric single crystals, such as KNN and NBT families. For such domain engineering, high quality crystals with large sizes are required.
Experimental methods
The relaxor-PT single crystals used for the experiments were grown by the modified Bridgman method and each sample was cut and polished into a rectangular parallelepiped. Several piezoelectric resonators were prepared, including k33-, k31-, k32-, k36-bars and kt-plates. The resonators with 3m, mm2, and 4mm symmetries correspond to the rhombohedral, orthorhombic, and tetragonal coordinates, respectively. For the rhombohedral coordinate system, 1-, 2-, and 3-directions correspond to [1-10]c, [11-2]c, and [111]c of the pseudo-cubic directions, respectively; [0-11]c, [100]c, and [011]c for the orthorhombic coordinate system; and [100]c, [010]c, and [001]c for the tetragonal coordinate system. The crystals were oriented by a real-time Laue x-ray machine with an accuracy of ±0.5°. The dimensions and aspect ratios of the resonators were specified by the IEEE standards on piezoelectricity [57]. Gold electrodes were sputtered onto the surfaces of these samples, and the samples were poled at room temperature with an electric field of 10–20 kV cm−1 to form stable engineered-domain configurations or at elevated temperatures under an electric field of 2 ~ 4 kV cm−1 by field-cooling poling method to obtain the single domain states [25]. The resonance and antiresonance frequencies of the resonator were measured by an HP4294A impedance-phase gain analyzer. The values of quality factors at resonance and antiresonance frequencies were obtained using the 3 dB method, as illustrated in Fig. 3 and Eq. (5). The frequency dispersions of ultrasonic attenuation of relaxor-PT crystals were measured using the ultrasonic spectroscopy technique [115, 354–356]. In order to obtain the dispersions from 10 MHz to 40 MHz, transducers with a center frequency of 20 MHz were used, which were driven by a 200 MHz pulser/receiver (Panametrics 5900PR). The temperature dependence of the dielectric constant was determined from 20 Hz to 1 MHz using a kt-plate by HP4284A precision LCR meter connected to a computer controlled high temperature chamber. The electric-field-induced strains were measured using a linear variable differential transducer (LVDT) driven by a lock-in amplifier (Stanford Research system, Model SR830). For the Rayleigh analysis, the maximum amplitude of the applied electric field was selected to be 1 kV cm−1, which is smaller than half of the coercive fields of relaxor-PT crystals.
Figure 51.
Acknowledgements
This work was supported by the National Key Basic Research Program of China (973 Program) under Grant No. 2013CB632900 and the NIH under Grant No. P41-EB2182. One of the authors Gang Liu would like to acknowledge the support for oversea studies from Chinese Scholarship Council of China. We are also grateful to H. C materials, Corp. and TRS Technologies, Inc. for supplying high quality relaxor-PT crystals.
Nomenclatures
- ABO3
perovskite structure
- BCZT
(Ba, Ca)(Zr, Ti)O3
- BE-PFM
band excitation piezoresponse force microscopy
- BLST
bismuth layer structured ferroelectrics
- BT
BaTiO3
- C0
static capacitance
elastic stiffness constant under constant electric displacement
elastic stiffness constant under constant electric field
- D
electric displacement
- dij
piezoelectric strain constant
- E
electric field
- Ea
activation energy
- Ec
coercive field
- Eint
internal bias field
- f
frequency
- f0
central frequency
- fa
antiresonance frequency
- fD
Debye frequency
- fr
resonance frequency
- g
piezoelectric voltage constant
- G∞
elastic modulus at infinite frequency
- IEEE
Institute of Electrical and Electronics Engineers
- kB
Boltzmann constant
- kij
electromechanical coupling factor
- KDP
potassium dihydrogen phosphate
- KN
KNbO3
- KNN
(1−x)KNbO3-xNaNbO3
- LVDT
linear variable differential transducer
- M
torque per unit volume
- M phase
monoclinic phase
- MPB
morphotropic phase boundary
- NBT
Na1/2Bi1/2TiO3
- NN
NaNbO3
- NBT-BT
(1−x)Na1/2Bi1/2TiO3-xBaTiO3
- NBT-KBT
(1−x)Na1/2Bi1/2TiO3-xK0.5Bi0.5TiO3
- O phase
orthorhombic phase
- P
polarization
- Pr
remnant polarization
- Ps
spontaneous polarization
- PIN-PMN-PT
(1−x−y)Pb(In1/2Nb1/2)O3-yPb(Mg1/3Nb2/3)O3-xPbTiO3
- PMN-PT
(1−x)Pb(Mg1/3Nb2/3)O3-xPbTiO3
- PMN-PZT
(1−x-y)Pb(Mg1/3Nb2/3)O3-yPbZrO3-xPbTiO3
- PT
PbTiO3
- PZT
Pb(Zr1−xTix)O3
- PZTs
Pb(Zr, Ti)O3-based ceramics
- Q
quality factor
- Qm
mechanical quality factor
- Qr
quality factor measured at resonance frequency
- Qa
quality factor measured at antiresonance frequency
- Qij-r
quality factor measured at resonance frequency (kij-mode)
- Qij-a
quality factor measured at antiresonance frequency (kij-mode)
- QT
quality factor under non-zero stress
- R phase
rhombohedral phase
- RoHS
restriction of hazardous substances
- RUS
resonance ultrasonic spectroscopy
- S
strain
elastic compliance coefficient under constant electric displacement
elastic compliance coefficient under constant electric field
- Subscript ‘c’
cubic coordinates
- T phase
tetragonal phase
- TC
Curie temperature
- Td
depolarization temperature
- Tm
the temperature of the permittivity maximum
- TVF
Vogel-Fulcher temperature or static freezing temperature
- tan γ
elastic loss
- tan δ
dielectric loss
- tan θ
piezoelectric loss
- TEM
transmission electron microscopy
- TGS
triglycine sulfate
- v
wave velocity
- Wm
total stored mechanical energy
- wm
loss of the mechanical energy
- WEEE
waste from electrical and electronic equipment
- XRD
X-ray diffraction
- Yn
complex electric admittance
- Zn
complex electric impendence
- α
spatial amplitude attenuation coefficient
- αd
Rayleigh coefficients for the converse piezoelectric effect
- βε
Rayleigh coefficients for the dielectric polarization
- γp
pyroelectric constant
dielectric constant (permittivity) under constant strain
dielectric constant (permittivity) under constant stress
- ε0
permittivity of the vacuum
- εr
relative permittivity
- η
viscosity
- κ*
complex wave number
- λ
wavelength
- τ
relaxation time
- ψ
the angle between the spontaneous polarization and electric field
- ωτ
relaxation frequency
- 2D
two dimensional
- 3D
three dimensional
Appendices
A1. Theory of the piezoelectric resonators with losses
A1.1 Basic equations
- Piezoelectric equation
(A1-1)
Here, S, T, E and D denote strain, stress, electric field and electric displacement, respectively, while sE, d, cE, e, εS, εT are related materials constants. All materials constants are complex with the imaginary part representing the loss.(A1-2) - Equation of motion
On the right hand side, Tij,i means derivative of Tij with respect to spatial coordinate xi, while üj is the second derivative of uj with respect to time, ρ is the density of the material.(A1-3) - Equation of electrical charge conservation
(A1-4) - The gradient equations
(A1-5)
Here, φ is the electric potential and φ,k is the rate of change in φ along k direction.(A1-6) - Boundary conditions
- Free tractions
(A1-7) - Electrical potential continuity at surface of the electrodes
(A1-8) - Electrical current continuity at surface
(A1-9)
A1.2 Stiffened mode resonators
Basic equations
| (A1-10) |
| (A1-11) |
The gradient equations
| (A1-12) |
| (A1-13) |
Then
| (A1-14) |
From electric charge conservation
| (A1-15) |
We have
| (A1-16) |
| (A1-17) |
| (A1-18) |
| (A1-19) |
Considering
| (A1-20) |
| (A1-21) |
| (A1-22) |
We have
| (A1-23) |
| (A1-24) |
| (A1-25) |
| (A1-26) |
Now the equations of motion is written as
| (A1-27) |
Let the solution of the equation be
| (A1-28) |
Then we have
| (A1-29) |
| (A1-30) |
| (A1-31) |
| (A1-32) |
| (A1-33) |
| (A1-34) |
| (A1-35) |
| (A1-36) |
Let , the velocity dispersion can be written as
| (A1-37) |
The attenuation is given by
| (A1-38) |
or
| (A1-39) |
Let the electrical potential be φ =[B sin(κ*z)+Cz]ejωt, substituting the solution into electrical charge conservation equation we have
| (A1-40) |
Here,
| (A1-41) |
We also have
| (A1-42) |
Then,
| (A1-43) |
| (A1-44) |
| (A1-45) |
| (A1-46) |
| (A1-47) |
| (A1-48) |
The solutions u3 and φ should fulfill the boundary conditions so that
| (A1-49) |
| (A1-50) |
From the first boundary condition
| (A1-51) |
| (A1-52) |
We have
| (A1-53) |
From the second boundary condition
| (A1-54) |
or
| (A1-55) |
We have
| (A1-56) |
Substituting , then
| (A1-57) |
| (A1-58) |
| (A1-59) |
Substituting then
| (A1-60) |
The total electric current
| (A1-61) |
| (A1-62) |
| (A1-63) |
| (A1-64) |
| (A1-65) |
Finally the electrical admittance is given by
| (A1-66) |
Here,
| (A1-67) |
| (A1-68) |
Set
| (A1-69) |
| (A1-70) |
We have,
| (A1-71) |
and,
| (A1-72) |
A1.3 Unstiffened mode resonators
Basic equations
| (A1-73) |
| (A1-74) |
The gradient equations
| (A1-75) |
| (A1-76) |
Then
| (A1-77) |
Since the electrical field and stress are uniform along 3-direction, the electric charge conservation will be automatically satisfied, i.e.,
| (A1-78) |
The equation of motion is written as
| (A1-79) |
Let the solution be
| (A1-80) |
| (A1-81) |
| (A1-82) |
Thus the velocity dispersion can be written as
| (A1-83) |
The attenuation is given by
| (A1-84) |
or
| (A1-85) |
Thus, there is no contribution of dielectric or piezoelectric losses to ultrasonic attenuation.
Since the electric field is uniform along the 3-direction, the electrical potential can be written as
| (A1-86) |
φ and u1 = A sin(k*x)ejωt should fulfill the boundary conditions:
| (A1-87) |
| (A1-88) |
From the latter condition we have
| (A1-89) |
and from the first boundary condition we have
| (A1-90) |
| (A1-91) |
The total electric current density is
| (A1-92) |
| (A1-93) |
The total electrical current is
| (A1-94) |
Substituting Eq. (A1-89) and Eq. (A1-91) into Eq. (A1-94),
| (A1-95) |
The electrical admittance is given by
| (A1-96) |
Here,
| (A1-97) |
Considering
| (A1-98) |
| (A1-99) |
| (A1-100) |
We have
| (A1-101) |
Set
| (A1-102) |
We have
| (A1-103) |
and
| (A1-104) |
A2. Resonance and antiresonance of piezoelectric resonators
When a piezoelectric vibrator is at ‘resonance’, its vibration amplitude will reach the maximum (infinite for lossless) while its mechanical impedance will be the minimum (zero for lossless).
Let us take a thin elastic bar as an example. Under the assumption that only the compression stress along length direction of the bar is non-zero. In this case the stress equation of motion can be written as
| (A2-1) |
when the length of the bar is assumed to be along 1-axis.
From the constitutive and gradient equations, S1 = s11T1 and S1 = u1,1, it is obtained that
| (A2-2) |
Also, the traction-free boundary condition demands that
| (A2-3) |
Here, l is length of the bar. Let solution of (A2-2) be
| (A2-4) |
Substituting the solution into equation (A2-3), the dispersion relation can be derived,
| (A2-5) |
From the boundary conditions (A2-3) the following equations are given
| (A2-6a) |
| (A2-6b) |
This is a set of homogeneous equations for unknown A and B. In order for A and B to have non-trivial solutions the coefficient determinate should vanish, i.e.,
| (A2-6c) |
or
| (A2-6d) |
When cos(κl/2) = 0, κl/2 = nπ/2 (n=1, 3, 5….), so
| (A2-7a) |
are the frequencies of asymmetric modes.
Similarly, when sin(κl/2) = 0,
| (A2-7b) |
are the frequencies of symmetric modes. Here, .
At those frequencies the ratio
| (A2-8) |
A (asymmetric mode) or B (symmetric mode) will reach infinite if there is no loss.
Meanwhile it can be seen that the mechanical impedance, defined as
| (A2-9) |
will be the zero for lossless case. It can be seen that has the dimension of the mechanical impedance. Here F is force, u̇ = jωu is particle vibration velocity.
Let
| (A2-10) |
Then,
| (A2-11) |
Here, v is velocity of wave propagation. This is also called the acoustic characteristic impedance.
For the electromechanical coupling vibrations, the normal modes can be excited through piezoelectric effect by applying an electric field. In this case the mechanical vibration will be coupled to electrical ones. The applied electric field brings the resonator into vibration while the mechanical vibration will also affect the applied field. Equivalently, there are mechanical as well as electrical ports in a piezoelectric resonator. The interaction strength between the two ports depends on the coupling strength between the mechanical displacement and electric field. Now let us take the piezoelectric bar resonators as an example.
It is known that the mechanical vibration of a k31-bar is not coupled to electric field whereas that of the k33-bar does. Thus the equations of motion for displacements of the k31-bar can be written as,
| (A2-12) |
while for the k33-bar,
| (A2-13) |
The mechanical boundary conditions are the same for the two modes, i.e.,
| (A2-14a) |
| (A2-14b) |
Then from the traction-free condition Eq. (A2-14) and relevant constitutive equations, we have
| (A2-15a) |
| (A2-15b) |
for the k31-bar.
And,
| (A2-16a) |
| (A2-16b) |
for the k33-bar.
The mechanical resonance frequency is still decided by Eq. (A2-6c), but from Eq. (A2-15a) and Eq. (A2-16a),
| (A2-17) |
for the k31-bar.
And,
| (A2-18) |
for the k33-bar. B=0 for both cases.
This is to say that the symmetric vibration modes cannot be excited electrically. Thus the resonance frequencies for the mechanically asymmetric modes are decided by
| (A2-19) |
for the k31-bar.
And,
| (A2-20) |
for the k33-bar.
It is seen from Eq. (A2-14) and Eq. (A2-15) that the amplitude of mechanical vibration goes to the maximum (infinite) at the resonance frequency if the loss is absent. Also the mechanical impedance will go to the minimum (zero for lossless case). The difference between Eq. (A2-17) and Eq. (A2-18) originates from the difference in the electrical boundary conditions for the two modes. E3 is constant for the k31-mode whereas D3 is constant for the k33-mode. In this case, the responses at the electric ports of the two resonators will be different. The electric admittance for the two modes can be written as Eq. (A1-96) for the k31-bar and Eq. (A1-66) for the k33-bar.
At mechanical resonance fmr, the mechanical vibration amplitudes of both k31- and k33-bars will go to infinity. But the electrical impedance goes to zero (electrical current goes to infinite) for the k31-bar whereas the electrical impedance becomes infinite (electrical current goes to zero) for the k33-bar. Usually when the impedance of a system becomes the maximum at a particular frequency the system is said to be at antiresonance. The mechanical and electrical resonance frequencies are coincident for the k31-bar, but the mechanical resonance corresponds to the electrical antiresonance for the k33-bar. Physically, the condition of constant electric field for the k31-bar and the condition of the electric displacement for the k33-bar correspond to short (electric current goes to infinite) and open (electric goes to zero) circuit cases, respectively.
In summary, the mechanical resonance frequency is decided by the traction-free boundary condition for both piezoelectrically unstiffened and stiffened modes. But for unstiffened modes, the mechanical resonance frequency is coincident with the electrical resonance frequency due to the constant electric field condition (short circuit). For the stiffened modes the mechanical resonance frequency corresponds to electric antiresonance frequency due to the constant electric displacement condition (open circuit).
Footnotes
Publisher's Disclaimer: This is a PDF file of an unedited manuscript that has been accepted for publication. As a service to our customers we are providing this early version of the manuscript. The manuscript will undergo copyediting, typesetting, and review of the resulting proof before it is published in its final citable form. Please note that during the production process errors may be discovered which could affect the content, and all legal disclaimers that apply to the journal pertain.
References
- 1.Scott JF, Paz de Araujo CA. Science. 1989;246:1400. doi: 10.1126/science.246.4936.1400. [DOI] [PubMed] [Google Scholar]
- 2.Cao WW. Nat. Mater. 2005;4:727. doi: 10.1038/nmat1506. [DOI] [PubMed] [Google Scholar]
- 3.Gao P, Nelson CT, Jokisaari JR, Baek SH, Bark CW, Zhang Y, Wang EG, Schlom DG, Eom CB, Pan XQ. Nat. Commun. 2011;2:591. doi: 10.1038/ncomms1600. [DOI] [PubMed] [Google Scholar]
- 4.Valasek J. presented at the meeting of the American Physical Society in Washington. 1920 Apr 23–24; [Google Scholar]
- 5.Valasek J. Phy. Rev. 1921;17:475. [Google Scholar]
- 6.Wainer E, Salomon N. National Lead Co. Reports No. 8, 9, 10. 1938–1943 [Google Scholar]
- 7.Ogawa S. J. Phys. Soc. Jpn. 1946;1:32. [Google Scholar]
- 8.Wul BM, Goldman IM. Akad. Nauk. SSSR. 1945;46:154. (in Russian). [Google Scholar]
- 9.Sawaguchi E. J. Phys. Soc. Jpn. 1953;8:615. [Google Scholar]
- 10.Jaffe B, Roth RS, Marzullo S. J. Appl. Phys. 1954;25:809. [Google Scholar]
- 11.Jaffe B, Roth RS, Marzullo S, Res J. Natl. Bur. Stand. 1955;55:239. [Google Scholar]
- 12.Cross LE, Newnham RE. In: History of Ferroelectrics, in Ceramics and Civilization, Vol. III, High Technology Ceramics – Past, Present, and Future. Kingery WD, Lense E, editors. Westerville, OH: American Ceramic Society; 1986. p. 289. [Google Scholar]
- 13.Kuwata J, Uchino K, Nomura S. Jpn. J. Appl. Phys. 1982;21:1298. [Google Scholar]
- 14.Park SE, Shrout TR. J. Appl. Phys. 1997;82:1804. [Google Scholar]
- 15.Fu H, Cohen RE. Nature. 2000;403:281. doi: 10.1038/35002022. [DOI] [PubMed] [Google Scholar]
- 16.Zhang R, Jiang B, Cao WW. J. Appl. Phys. 2001;90:3471. [Google Scholar]
- 17.Zhang R, Jiang B, Jiang WH, Cao WW. Mater. Lett. 2003;57:1305. [Google Scholar]
- 18.Zhang SJ, Shrout TR. IEEE Trans. Ultrasonics, Ferroelectrics. Frequency Control. 2010;57:2138. doi: 10.1109/TUFFC.2010.1670. [DOI] [PMC free article] [PubMed] [Google Scholar]
- 19.Damjanovic D. J. Am. Ceram. Soc. 2005;88:2663. [Google Scholar]
- 20.Damjanovic D. IEEE Trans. Ultrasonics, Ferroelectrics, Frequency Control. 2009;56:1574. doi: 10.1109/TUFFC.2009.1222. [DOI] [PubMed] [Google Scholar]
- 21.Fang BJ, Shan YJ, Xu HQ, Luo HS, Yin ZW. Adv. Funct. Mater. 2004;14:169. [Google Scholar]
- 22.Marsilius M, Frederick J, Hu W, Tan XL, Granzow T, Han PD. Adv. Funct. Mater. 2004;22:797. [Google Scholar]
- 23.Zhang SJ, Li F. J. Appl. Phy. 2012;111:031301. [Google Scholar]
- 24.Li F, Zhang SJ, Xu Z, Wei XY, Shrout TR. Adv. Funct. Mater. 2011;21:2118. doi: 10.1002/adfm.201002711. [DOI] [PMC free article] [PubMed] [Google Scholar]
- 25.Ye Z-G, Noheda B, Dong M, Cox DE, Shirane G. Phy. Rev. B. 2001;64:184114. [Google Scholar]
- 26.La-Orauttapong D, Noheda B, Ye Z-G, Gehring PM, Toulouse J, Cox DE, Shirane G. Phy. Rev. B. 2002;65:144101. [Google Scholar]
- 27.Noheda B, Cox DE, Shirane G, Gao J, Ye Z-G. Phy. Rev. B. 2002;66:054104. [Google Scholar]
- 28.Yin JH, Jiang B, Cao WW. IEEE Trans. Ultrasonics, Ferroelectrics, Frequency Control. 2000;47:285. doi: 10.1109/58.818772. [DOI] [PubMed] [Google Scholar]
- 29.Davis M. Ph.D. dissertation. Switzerland: Swiss Federal Institute of Technology-EPFL, Lausanne; 2006. Phase Transitions, Anisotropy and Domain Engineering: The Piezoelectric Properties of Relaxor-ferroelectric Single Crystals. [Google Scholar]
- 30.Davis M, Damjanovic D, Hayem D, Setter N. J. Appl. Phys. 2005;98:014102. [Google Scholar]
- 31.Liu D, Li JY. Appl. Phys. Lett. 2004;84:3930. [Google Scholar]
- 32.Liu T, Lynch CS. Acta Mater. 2003;51:407. [Google Scholar]
- 33.Liu WF, Ren XB. Phy. Rev. Lett. 2009;103:257602. doi: 10.1103/PhysRevLett.103.257602. [DOI] [PubMed] [Google Scholar]
- 34.Sun EW, Cao WW. Prog. Mater. Sci. 2014;65:124. doi: 10.1016/j.pmatsci.2014.03.006. [DOI] [PMC free article] [PubMed] [Google Scholar]
- 35.Wada S, Suzuki S, Noma T, Suzuki T, Osada M, Kakihana M, Park SE, Cross LE, Shrout TR. Jpn. J. Appl. Phys. 1999;38:5505. [Google Scholar]
- 36.Cao WW. Full-set Material Properties and Domain Engineering Principles of Ferroelectric Single Crystals. In: Ye Z-G, editor. Handbook of Advanced Dielectric, Piezoelectric and Ferroelectric Materials – Synthesis, Characterization and Applications. Cambridge, England: Woodhead; 2008. p. 235. [Google Scholar]
- 37.Scott JF. Science. 2007;315:954. doi: 10.1126/science.1129564. [DOI] [PubMed] [Google Scholar]
- 38.Damjanovic D. Rep. Prog. Phy. 1998;61:1267. [Google Scholar]
- 39.Gruverman A, Kholkin A. Rep. Prog. Phy. 2006;69:2443. [Google Scholar]
- 40.Hackenberger W, Luo J, Jiang XN, Snook KA, Rehrig PW, Zhang SJ, Shrout TR. Recent Developments and Applications of Piezoelectric Crystals in Handbook of Advanced Dielectric. In: Ye Z-G, editor. Piezoelectric and Ferroelectric Materials – Synthesis, Characterization and Applications. Cambridge, England: Woodhead; 2008. p. 73. [Google Scholar]
- 41.Guo R, Cross LE, Park SE, Noheda B, Cox DE, Shirane G. Phy. Rev. Lett. 2000;84:5423. doi: 10.1103/PhysRevLett.84.5423. [DOI] [PubMed] [Google Scholar]
- 42.Seidel J, Martin LW, He Q, Zhan Q, Chu Y-H, Rother A, Hawkridge ME, Maksymovych P, Yu P, Gajek M, Balke N, Kalinin SV, Gemming S, Wang F, Catalan G, Scott JF, Spaldin NA, Orenstein J, Ramesh R. Nat. Mater. 2009;8:229. doi: 10.1038/nmat2373. [DOI] [PubMed] [Google Scholar]
- 43.Sluka T, Tagantsev AK, Damjanovic D, Gureev M, Setter N. Nat. Commun. 2012;3:748. doi: 10.1038/ncomms1751. [DOI] [PMC free article] [PubMed] [Google Scholar]
- 44.Uchino K. Acta Mater. 1998;46:3745. [Google Scholar]
- 45.Smits JG. Ph.D. dissertation. The Netherlands: Technical Univ. Enschede, Twente, Netherland; 1978. Eigenstates of Coupling Factor and Loss Factor of Piezoelectric Ceramics. [Google Scholar]
- 46.Arlt G, Dederichs H. Ferroelectrics. 1980;29:47. [Google Scholar]
- 47.Uchino K, Hirose S. IEEE Trans. Ultrasonics, Ferroelectrics, Frequency Control. 2001;48:307. doi: 10.1109/58.896144. [DOI] [PubMed] [Google Scholar]
- 48.Knopoff L, MacDonald Gordon JF. Rev. Mod. Phys. 1958;30:1178. [Google Scholar]
- 49.Cole KS, Cole RH. J. Chem. Phy. 1941;9:341. [Google Scholar]
- 50.Damjanovic D. Hysteresis in Piezoelectric and Ferroelectric Materials. In: Mayergoyz I, Bertotti G, editors. Science of Hysteresis. Ch. 4. Vol. 3. Amsterdam: Elsevier; 1996. p. 337. [Google Scholar]
- 51.Arlt G. Ferroelectrics. 1982;40:149. [Google Scholar]
- 52.Mezheritsky Alex V. IEEE Trans. Ultrasonics, Ferroelectrics, Frequency Control. 2004;51:695. [PubMed] [Google Scholar]
- 53.Zhang SJ, Lee S, Kim D, Lee H, Shrout TR. Appl. Phys. Lett. 2008;93:122908. doi: 10.1063/1.2992081. [DOI] [PMC free article] [PubMed] [Google Scholar]
- 54.Zhang SJ, Li F, Luo J, Sahul R, Shrout TR. IEEE Trans. Ultrasonics, Ferroelectrics, Frequency Control. 2013;60:1572. doi: 10.1109/TUFFC.2013.2737. [DOI] [PMC free article] [PubMed] [Google Scholar]
- 55.Lee HJ, Zhang SJ, Luo J, Li F, Shrout TR. Adv. Funct. Mater. 2010;20:3154. doi: 10.1002/adfm.201000390. [DOI] [PMC free article] [PubMed] [Google Scholar]
- 56.Lee HJ, Zhang SJ, Shrout TR. J. Appl. Phy. 2010;107:124107. doi: 10.1063/1.3437068. [DOI] [PMC free article] [PubMed] [Google Scholar]
- 57.IEEE Standard on Piezoelectricity, IEEE Standard on Piezoelectricity. Vol. 176. ANSI/IEEE Std; 1987. [Google Scholar]
- 58.Lin DB, Zhang SJ, Li ZR, Li F, Xu Z, Wada S, Shrout TR. J. Appl. Phy. 2011;110:084110. doi: 10.1063/1.3654137. [DOI] [PMC free article] [PubMed] [Google Scholar]
- 59.Holland R. IEEE Trans, Sonics Ultrasonics, su-14. 1967:18. [Google Scholar]
- 60.Wang Z, Zhang R, Sun EW, Cao WW. J. Appl. Phys. 2010;107:014110. doi: 10.1063/1.3273484. [DOI] [PMC free article] [PubMed] [Google Scholar]
- 61.Du XH, Wang QM, Uchino K. IEEE Trans. Ultrasonics, Ferroelectrics, Frequency Control. 2004;51:227. [PubMed] [Google Scholar]
- 62.Du XH, Wang QM, Uchino K. IEEE Trans. Ultrasonics, Ferroelectrics, Frequency Control. 2004;51:238. [PubMed] [Google Scholar]
- 63.San Emeterio JL, Ramos A, Sanz PT, Cegarra M. Ultrasonics. 2000;38:140. doi: 10.1016/s0041-624x(99)00178-x. [DOI] [PubMed] [Google Scholar]
- 64.Mason WP. Physical Acoustics and the Properties of Solids. New York, USA: Van Nostrand; 1958. p. 190. [Google Scholar]
- 65.Hirose S, Aoyagi M, Tomikawa Y, Takahashi S, Uchino K. Ultrasonics. 1996;34:213. [Google Scholar]
- 66.Mezheritsky AV. Ferroelectrics. 2002;266:277. [Google Scholar]
- 67.Mezheritsky AV. IEEE Trans. Ultrasonics, Ferroelectrics, Frequency Control. 2002;49:484. doi: 10.1109/58.996567. [DOI] [PubMed] [Google Scholar]
- 68.Li SP, Cao WW, Cross LE. J. Appl. Phys. 1991;69:7219. [Google Scholar]
- 69.Nowick AS, Heller WR. Adv. Phys. 1963;12:251. [Google Scholar]
- 70.Nowick AS, Heller WR. Adv. Phys. 1965;12:101. [Google Scholar]
- 71.Litov E, Uehling EA. Phy. Rev. Lett. 1968;21:809. [Google Scholar]
- 72.Litov E, Uehling EA. Phy. Rev. B. 1970;1:3713. [Google Scholar]
- 73.Vaughan WE. Ann. Rev. Phys. Chem. 1979;30:103. [Google Scholar]
- 74.Harrison RJ, Redfern Simon AT, Salje Ekhard KH. Phy. Rev. B. 2004;69:144101. [Google Scholar]
- 75.Frohlich H, Platzman RL. Phy. Rev. 1953;92:1152. [Google Scholar]
- 76.Gurevich VL, Tagantsev AK. Adv. Phys. 1991;40:719. [Google Scholar]
- 77.Debye P. Polar Molecules. New York, USA: Chemical Catalogue Company; 1929. p. 94. [Google Scholar]
- 78.Elissalde C, Ravez J. J. Mater. Chem. 2001;11:1957. [Google Scholar]
- 79.Cole KS, Cole RH. J. Chem. Phy. 1942;10:98. [Google Scholar]
- 80.Jonscher AK. Nature. 1975;253:717. [Google Scholar]
- 81.Jonscher AK. Nature. 1975;256:566. [Google Scholar]
- 82.Jonscher AK. Nature. 1977;267:673. [Google Scholar]
- 83.Jonscher AK. Coll. Poylm. Sci. 1975;253:231. [Google Scholar]
- 84.Salter DC. Nature. 1978;271:645. [Google Scholar]
- 85.Bai F. Ph.D. dissertation. Blacksburg, USA: Virginia Polytechnic Institute and State University; 2006. Structure-Property Relationship of Multiferroic Materials – A Nano Perspectives. [Google Scholar]
- 86.Viehland D, Powers J, Cross LE, Li JF. Appl. Phys. Lett. 2001;78:3508. [Google Scholar]
- 87.Viehland D, Jang SJ, Cross LE, Wuttig M. J. Appl. Phys. 1990;68:2916. [Google Scholar]
- 88.Cross LE. Ferroelectrics. 1994;151:305. [Google Scholar]
- 89.Setter N, Cross LE. J. Appl. Phys. 1980;51:4356. [Google Scholar]
- 90.Morgonwnik A, Mydosh J. Solid State Commun. 1983;47:321. [Google Scholar]
- 91.Binder K. Z. Phys. B. 1977;26:339. [Google Scholar]
- 92.Vogel H. Phys. Z. 1921;22:645. [Google Scholar]
- 93.Fulcher G. J. Am. Cer. Soc. 1925;8:339. [Google Scholar]
- 94.Tagantsev AK. Phy. Rev. Lett. 1994;72:1100. doi: 10.1103/PhysRevLett.72.1100. [DOI] [PubMed] [Google Scholar]
- 95.Glazounov AE, Tagantsev AK. Appl. Phys. Lett. 1998;73:856. [Google Scholar]
- 96.Noheda B. Curr. Opin. Solid State Mater. Sci. 2002;6:27. [Google Scholar]
- 97.Shirane G, Takeda A. J. Phys. Soc. Jpn. 1952;7:5. [Google Scholar]
- 98.Shirane G, Suzuki K, Takeda A. J. Phys. Soc. Jpn. 1952;7:12. [Google Scholar]
- 99.Shirane G, Suzuki K. J. Phys. Soc. Jpn. 1952;7:333. [Google Scholar]
- 100.Durbin MK, Jacobs EW, Hicks JC. Appl. Phys. Lett. 1999;74:2848. [Google Scholar]
- 101.Noheda B, Cox DE, Shirane G, Gonzalo JA, Cross LE, Park SE. Appl. Phys. Lett. 1999;74:2059. [Google Scholar]
- 102.Lee PL, Shu D, Ramanathan M, Preissner C, Wang J, Beno MA, Von Dreele RB, Ribaud L, Kurtz C, Antao SM, Jiao X, Toby BH. J. Synchrotron Radiat. 2008;15:427. doi: 10.1107/S0909049508018438. [DOI] [PubMed] [Google Scholar]
- 103.Kong LP, Liu G, Zhang SJ, Liu HZ. J. Appl. Phys. 2013;114:144106. [Google Scholar]
- 104.Jin L, Li F, Zhang SJ. J. Am. Ceram. Soc. 2014;97:1. [Google Scholar]
- 105.Zhang SJ, Sherlock N, Meyer RJ, Jr, Shrout TR. Appl. Phys. Lett. 2009;94:162906. doi: 10.1063/1.3125431. [DOI] [PMC free article] [PubMed] [Google Scholar]
- 106.Erhart J, Burianova L. J. Eur. Ceram. Soc. 2001;21:1412. [Google Scholar]
- 107.Kahn M, Ingel RP, Lewis D., III Ferroelectrics. 1990;102:225. [Google Scholar]
- 108.Li F, Zhang SJ, Xu Z, Wei XY, Luo J, Shrout TR. J. Appl. Phys. 2010;108:034106. doi: 10.1063/1.3466978. [DOI] [PMC free article] [PubMed] [Google Scholar]
- 109.Noheda B, Zhong Z, Cox DE, Shirane G, Park SE, Rehrig P. Phys. Rev. B. 2002;65:224101. [Google Scholar]
- 110.Damjanovic D. J. Appl. Phys. 1997;82:1788. [Google Scholar]
- 111.Bertotti G. Hysteresis in Magnetism. San Diego: Academic Press; 1998. [Google Scholar]
- 112.Damjanovic D, Demartin M. J. Phys. D: Appl. Phys. 1996;29:2057. [Google Scholar]
- 113.Lord Rayleigh RS. Phil. Mag. 1887;23:225. [Google Scholar]
- 114.Taylor DV, Damjanovic D, Setter N. Ferroelectrics. 1999;224:299. [Google Scholar]
- 115.Wang HF, Jiang WH, Cao WW. J. Appl. Phys. 1999;85:8083. [Google Scholar]
- 116.Smits JG. Ferroelectrics. 1985;64:275. [Google Scholar]
- 117.Smits JG. IEEE Trans. Ultrason. Ferroelectr. Freq. Control. 1976;23:393. doi: 10.1109/58.79611. [DOI] [PubMed] [Google Scholar]
- 118.Damjanovic D, Gururaja TR, Cross LE. Am. Ceram. Soc. Bull. 1987;66:699. [Google Scholar]
- 119.Arlt G, Dederichs H, Herbiet R. Ferroelectrics. 1987;74:37. [Google Scholar]
- 120.Du XH, Wang QM, Uchino K. IEEE Trans. Ultrason. Ferroelectr. Freq. Control. 2003;50:312. doi: 10.1109/tuffc.2003.1193625. [DOI] [PubMed] [Google Scholar]
- 121.Kwok KW, Chan H, Choy C. IEEE Trans. Ultrason. Ferroelectr. Freq. Control. 1997;44:733. doi: 10.1109/58.764849. [DOI] [PubMed] [Google Scholar]
- 122.Sabat R, Mukherjee BK, Ren W, Yang GM. J. Appl. Phys. 2007;101:064111. [Google Scholar]
- 123.Zhang QM, Wang H, Kim N, Cross LE. J. Appl. Phys. 1994;75:454. [Google Scholar]
- 124.Park SE, Shrout TR. IEEE Trans. Ultrason. Ferroelectr. Freq. Control. 1997;44:1140. doi: 10.1109/58.852060. [DOI] [PubMed] [Google Scholar]
- 125.Park SE, Shrout TR. Mater. Res. Innovations. 1997;1:20. [Google Scholar]
- 126.Vanderbilt D, Cohen MH. Phys. Rev. B. 2001;63:094108. [Google Scholar]
- 127.Damjanovic D. Appl. Phys. Lett. 2010;97:062906. [Google Scholar]
- 128.Ghosh A, Damjanovic D. Appl. Phys. Lett. 2011;99:232906. [Google Scholar]
- 129.Xue DZ, Zhou YM, Bao HX, Zhou C, Gao JX, Ren XB. J. Appl. Phys. 2011;109:054110. [Google Scholar]
- 130.Zhou C, Liu WF, Xue DZ, Ren XB, Bao HX, Gao JH, Zhang LX. Appl. Phys. Lett. 2012;100:222910. [Google Scholar]
- 131.Porta M, Lookman T. Phys. Rev. B. 2011;83:174108. [Google Scholar]
- 132.Jo W, Dittmer R, Acosta M, Zang JD, Groh C, Sapper E, Wang K, Rödel J. J. Electroceram. 2012;29:71. [Google Scholar]
- 133.Wu JG, Xiao DQ, Wu WJ, Chen Q, Zhu JG, Yang ZC, Wang J. Scripta Mater. 2011;65:771. [Google Scholar]
- 134.Haun MJ, Furman E, Jang SJ, Cross LE. Ferroelectrics. 1989;99:63. doi: 10.1109/58.31774. [DOI] [PubMed] [Google Scholar]
- 135.Liu G, Jiang WH, Zhu JQ, Cao WW. Appl. Phys. Lett. 2011;99:162901. doi: 10.1063/1.3652703. [DOI] [PMC free article] [PubMed] [Google Scholar]
- 136.Webb SL. Am. Mineral. 1991;76:1449. [Google Scholar]
- 137.Roland CM. Soft Matter. 2008;4:2316. [Google Scholar]
- 138.Huang YN, Wang YN, Shen HM. Phy. Rev. B. 1992;46:3290. doi: 10.1103/physrevb.46.3290. [DOI] [PubMed] [Google Scholar]
- 139.Wang YN, Huang YN. J. Alloys Compd. 1994;211:356. [Google Scholar]
- 140.Weber HP, Tofield BC, Liao PF. Phy. Rev. B. 1975;11:1152. [Google Scholar]
- 141.Li F, Zhang SJ, Xu Z, Wei XY, Luo J, Shrout TR. J. Appl. Phys. 2010;107:054107. doi: 10.1063/1.3331407. [DOI] [PMC free article] [PubMed] [Google Scholar]
- 142.Zhang R, Jiang B, Cao WW. Appl. Phys. Lett. 2003;82:787. [Google Scholar]
- 143.Wong KS, Zhao X, Dai JY, Choy CL, Zhao XY, Luo HS. Appl. Phys. Lett. 2006;89:092906. [Google Scholar]
- 144.Wong KS, Dai JY, Zhao XY, Luo HS. Appl. Phys. Lett. 2007;90:162907. [Google Scholar]
- 145.Dietze M, Katzke H, Es-Souni M, Neumann N, Luo HS. Appl. Phys. Lett. 2012;100:242905. [Google Scholar]
- 146.Davis M, Budimir M, Damjanovic D, Setter N. J. Appl. Phys. 2007;101:054112. [Google Scholar]
- 147.Levesque D, Verlet L, Kurkijarvi J. Phy. Rev. A. 1973;7:1690. [Google Scholar]
- 148.Sharma KC. Phy. Rev. 1968;174:309. [Google Scholar]
- 149.Li JY, Rogan RC, Üstündag E, Bhattacharya K. Nat. Mater. 2005;4:776. doi: 10.1038/nmat1485. [DOI] [PubMed] [Google Scholar]
- 150.Huo XQ, Zhang SJ, Liu G, Zhang R, Luo J, Sahul R, Cao WW, Shrout TR. J. Appl. Phys. 2012;112:124113. doi: 10.1063/1.4772617. [DOI] [PMC free article] [PubMed] [Google Scholar]
- 151.Damjanovic D, Demartin M. J. Phys.: Condens. Matter. 1997;9:4943. [Google Scholar]
- 152.Tagantsev AK, Cross LE, Fousek J. Domains in Ferroic Crystals and Thin Films. London: Springer; 2010. [Google Scholar]
- 153.Cao WW. In: Adaptronics and Smart Structures. Janocha H, editor. London: Springer; 2007. pp. 29–53. [Google Scholar]
- 154.Mason WP. Physical Acoustics and the Properties of Solids. New York: Van Nostrand; 1958. pp. 221–222. [Google Scholar]
- 155.Bokov AA, Ye Z-G. J. Appl. Phys. 2004;95:6347. [Google Scholar]
- 156.Han JP, Cao WW. Appl. Phys. Lett. 2003;83:2040. [Google Scholar]
- 157.Erhart J. Phase Transitions. 2004;77:989. [Google Scholar]
- 158.Abplanalp M, Barosova B, Bridenbauth P, Erhart J, Fousek J. J. Appl. Phys. 2002;91:3797. [Google Scholar]
- 159.Cao WW, Barsch GR, Krumhansl JA. Phy. Rev. B. 1990;42:6396. doi: 10.1103/physrevb.42.6396. [DOI] [PubMed] [Google Scholar]
- 160.Cao WW, Cross LE. Phys. Rev. B. 1991;44:5. doi: 10.1103/physrevb.44.5. [DOI] [PubMed] [Google Scholar]
- 161.Arlt G. Ferroelectrics. 1987;76:451. [Google Scholar]
- 162.Robels U, Herbiet R, Arlt G. Ferroelectrics. 1989;93:95. [Google Scholar]
- 163.Herbiet R, Robels U, Dederichs H, Arlt G. Ferroelectrics. 1989;98:107. [Google Scholar]
- 164.Nelson CT, Gao P, Jokisaari JR, Heikes C, Adamo C, Melville A, Baek S-H, Folkman CM, Winchester B, Gu YJ, Liu YM, Zhang K, Wang EG, Li JY, Chen LQ, Eom C-B, Schlom DG, Pan XQ. Science. 2011;334:968. doi: 10.1126/science.1206980. [DOI] [PubMed] [Google Scholar]
- 165.Daniels JE, Finlayson TR, Davis M, Damjanovic D, Studer AJ, Hoffman M, Jones JL. J. Appl. Phys. 2007;101:104108. [Google Scholar]
- 166.Porokhonskyy V, Jin L, Damjanovic D. Appl. Phys. Lett. 2009;94:212906. [Google Scholar]
- 167.Seshdari SB, Prewitt AD, Studer AJ, Damjanovic D, Jones JL. Appl. Phys. Lett. 2013;102:042911. [Google Scholar]
- 168.Zhang R, Jiang WH, Cao WW. Appl. Phys. Lett. 2005;87:182903. doi: 10.1063/1.3584851. [DOI] [PMC free article] [PubMed] [Google Scholar]
- 169.Uchino K, Zheng JH, Chen YH, Du XH, Ryu J, Gao Y, Ural S, Priya S, Hirose S. J. Mater. Sci. 2006;41:217. [Google Scholar]
- 170.Li F, Zhang SJ, Xu Z, Wei XY, Luo J, Shrout TR. J. Appl. Phys. 2010;108:034106. doi: 10.1063/1.3466978. [DOI] [PMC free article] [PubMed] [Google Scholar]
- 171.Li F, Zhang SJ, Xu Z, Wei XY, Luo J, Shrout TR. Appl. Phys. Lett. 2010;96:192903. doi: 10.1063/1.3430059. [DOI] [PMC free article] [PubMed] [Google Scholar]
- 172.Sun EW, Cao WW, Jiang WH, Han PD. Appl. Phys. Lett. 2011;99:032901. doi: 10.1063/1.3615684. [DOI] [PMC free article] [PubMed] [Google Scholar]
- 173.Zhang SJ, Liu G, Jiang WH, Luo J, Cao WW, Shrout TR. J. Appl. Phys. 2011;110 doi: 10.1063/1.3654137. [DOI] [PMC free article] [PubMed] [Google Scholar]
- 174.Ahluwalia R, Lookman T, Saxena A, Cao WW. Phy. Rev. B. 2005;72:014112. [Google Scholar]
- 175.Wada S, Tsurumi T. Br. Ceram. Trans. 2004;103:93. [Google Scholar]
- 176.Wada S. Domain Wall Engineering in Piezoelectric Crystals with Engineered Domain Configuration. In: Ye Z-G, editor. Handbook of Advanced Dielectric, Piezoelectric and Ferroelectric Materials - Synthesis, Characterization and Applications. Cambridge, England: Woodhead; 2008. pp. 266–303. [Google Scholar]
- 177.Xiang Y, Zhang R, Cao WW. Appl. Phys. Lett. 2010;96:092902(1)–092902(3). doi: 10.1063/1.3314285. [DOI] [PMC free article] [PubMed] [Google Scholar]
- 178.Zhang SJ, Luo J, Li F, Meyer RJ, Jr, Hackenberger W, Shrout TR. Acta Mater. 2010;58:3773. doi: 10.1016/j.actamat.2010.03.018. [DOI] [PMC free article] [PubMed] [Google Scholar]
- 179.Lambeck PV, Jonker GH. J. Phys. Chem. Solids. 1986;41:453. [Google Scholar]
- 180.Okasaki K, Sakata K. Electrotechn. J. Jpn. 1962;7:13. [Google Scholar]
- 181.Takahashi M. Jpn. J. Appl. Phys. 1970;9:1236. [Google Scholar]
- 182.Mason WP, McSkimin HJ. J. Acoust. Soc. Am. 1947;19:464. [Google Scholar]
- 183.Mason WP, McSkimin HJ. J. Appl. Phys. 1948;19:940. [Google Scholar]
- 184.Rayleigh L. Theory of Sound. New York: McMillan; 1929. [Google Scholar]
- 185.Merz WJ. J. Appl. Phys. 1956;27:938. [Google Scholar]
- 186.Miller RC, Savage A. J. Appl. Phys. 1961;32:714. [Google Scholar]
- 187.Callaby DR. J. Appl. Phys. 1965;36:2751. [Google Scholar]
- 188.Carl K, Härdtl KH. Ferroelectrics. 1978;17:47. [Google Scholar]
- 189.Miserova A. Sov. Phys. Sol. State. 1960;2:1160. [Google Scholar]
- 190.Unruh HG. Z. Angew. Phys. 1963;16:315. [Google Scholar]
- 191.Jonker GH. J. Am. Ceram. Soc. 1972;55:57. [Google Scholar]
- 192.Marton P, Shimada T, Kitamura T, Elsässer C. Phys. Rev. B. 2011;83:064110. [Google Scholar]
- 193.So YW, Kim DJ, Noh TW, Yoon J-G, Song TK. J. Korean Phys. Soc. 2005;46:40. [Google Scholar]
- 194.Huey BD, Nath R, Lee S, Polomoff NA. J. Am. Ceram. Soc. 2012;95:1147. [Google Scholar]
- 195.Rodriguez BJ, Chu YH, Ramesh R, Kalinin SV. Appl. Phys. Lett. 2008;93:142901. [Google Scholar]
- 196.Marincel DM, Zhang HR, Kumar A, Jesse S, Kalinin SV, Rainforth WM, Reaney IM, Randall CA, Trolier-McKinstry S. Adv. Funct. Mater. 2014;24:1409. [Google Scholar]
- 197.Huntington HB. J. Appl. Phys. 1948;19:901. [Google Scholar]
- 198.Lifshitz IM, Parkhomovskii GD. J. Exp. Theor. Phys. 1950;20:175. [Google Scholar]
- 199.Papadakis EP. J. Acoust. Soc. Am. 1961;33:1616. [Google Scholar]
- 200.Papadakis EP. J. Appl. Phys. 1964;35:1586. [Google Scholar]
- 201.Papadakis EP. Inter. Metals Rev. 1984;29:1. [Google Scholar]
- 202.Arlt G, Hennings D, de With G. J. Appl. Phys. 1985;58:1619. [Google Scholar]
- 203.Arlt G, Peusens GH. Ferroelectrics. 1983;48:213. [Google Scholar]
- 204.Waser R. Integr. Ferroelectrics. 1997;15:39. [Google Scholar]
- 205.Arlt G, Pertsev NA. J. Appl. Phys. 1991;70:2283. [Google Scholar]
- 206.Arlt G. Ferroelectrics. 1990;104:217. [Google Scholar]
- 207.Ghosh D, Sakata A, Carter J, Thomas PA, Han H, Nino JC, Jones JL. Adv. Funct. Mater. 2014;24:885. [Google Scholar]
- 208.Randall CA, Kim N, Kucera JP, Cao WW, Shrout TR. J. Am. Ceram. Soc. 1998;81:677. [Google Scholar]
- 209.Hoshina T, Takizawa K, Li J, Kasama T, Kakemoto H, Tsurumi T. Jpn. J. Appl. Phys. 2008;47:7607. [Google Scholar]
- 210.Hoshina T, Kigoshi Y, Hatta S, Takeda H, Tsurumi T. Jpn. J. Appl. Phys. 2009;48:09KC01. [Google Scholar]
- 211.Martirenat HT, Burfoot JC. J. Phys. C: Solid State Phys. 1974;7:3182. [Google Scholar]
- 212.Buessem WR, Cross LE, Goswami AK. J. Am. Ceram. Soc. 1966;49:33. [Google Scholar]
- 213.Buessem WR, Cross LE, Goswami AK. J. Am. Ceram. Soc. 1966;49:36. [Google Scholar]
- 214.Bell AJ, Moulson AJ, Cross LE. Ferroelectrics. 1984;54:147. [Google Scholar]
- 215.Pertsev NA, Arlt G. J. Appl. Phys. 1993;74:4105. [Google Scholar]
- 216.Arlt G. Bol. Soc. Esp. Cerám. Vidrio. 1995;34:267. [Google Scholar]
- 217.Prasad KVR, Raju AR, Varma KBR. J. Mater. Sci. 1994;29:2691. [Google Scholar]
- 218.Tang XG, Chan HL-W. J. Appl. Phys. 2005;97:034109. [Google Scholar]
- 219.Cao WW, Randall CA. J. Phys. Chem. Solids. 1996;57:1499. [Google Scholar]
- 220.Guennou M, Dammak H, Thi MP. J. Appl. Phys. 2008;104:074102. [Google Scholar]
- 221.Hentati MA, Guennou M, Dammak H, Khemakhem H, Thi MP. J. Appl. Phys. 2010;107:064108. [Google Scholar]
- 222.Luo LH, Li WP, Zhu YJ, Wang J. Solid State Commun. 2009;149:978. [Google Scholar]
- 223.Huo XQ, Zhang SJ, Liu G, Zhang R, Luo J, Sahul R, Cao WW, Shrout TR. J. Appl. Phys. 2013;113:074106. doi: 10.1063/1.4792661. [DOI] [PMC free article] [PubMed] [Google Scholar]
- 224.Woollett R. IEEE Trans. Sonics Ultrasonics. 1968;15:218. [Google Scholar]
- 225.Lin S, Zhang F. Ultrasonics. 2000;37:549. doi: 10.1016/s0041-624x(99)00076-1. [DOI] [PubMed] [Google Scholar]
- 226.Sherlock NP, Zhang SJ, Luo J, Lee HY, Shrout TR, Meyer RJ., Jr J. Appl. Phys. 2010;107:074108. [Google Scholar]
- 227.Lee HJ, Zhang SJ, Sherlock NP, Meyer RJ, Jr, Shrout TR. Appl. Phys. Lett. 2012;101:032902. doi: 10.1063/1.4737651. [DOI] [PMC free article] [PubMed] [Google Scholar]
- 228.Zhang SJ, Li F, Sherlock NP, Luo J, Lee HJ, Xia R, Meyer RJ, Jr, Hackenberger W, Shrout TR. J. Crys. Grow. 2011;318:846. doi: 10.1016/j.jcrysgro.2010.11.043. [DOI] [PMC free article] [PubMed] [Google Scholar]
- 229.Han PD, Yan WL, Tian J, Huang XL, Pan HX. Appl. Phys. Lett. 2005;86:052902. [Google Scholar]
- 230.Zhang SJ, Li F, Jiang WH, Luo J, Meyer RJ, Jr, Cao WW, Shrout TR. Appl. Phys. Lett. 2011;98:182903. doi: 10.1063/1.3584851. [DOI] [PMC free article] [PubMed] [Google Scholar]
- 231.Zhang SJ, Li F, Jiang WH, Luo J, Meyer RJ, Jr, Cao WW, Shrout TR. J. Appl. Phys. 2011;110:064106. [Google Scholar]
- 232.Kim K, Zhang SJ, Jiang XN. Appl. Phys. Lett. 2012;100:253501. [Google Scholar]
- 233.Kim K, Zhang SJ, Jiang XN. IEEE Trans. Ultrasonics, Ferroelectrics, Frequency Control. 2012;59:2548. doi: 10.1109/TUFFC.2012.2488. [DOI] [PubMed] [Google Scholar]
- 234.Lee SM, Lee SH, Yoon CB, Kim HE, Lee KW. J. Eletroceram. 2007;18:311. [Google Scholar]
- 235.Li Y, Yuan J, Wang DW, Zhang DQ, Jin HB, Cao MS. J. Am. Ceram. Soc. 2013;96:3440. [Google Scholar]
- 236.Hejazi M, Taghddos E, Gurdal E, Uchino K, Safari A. J. Ceram. Soc. 2014 early view. [Google Scholar]
- 237.Kobor D, Hajjaji A, Garcia JE, Perez R, Albareda A, Lebrun L, Guyomar D. J. Mod. Phys. 2010;1:211. [Google Scholar]
- 238.Unruh HG, Muser HE. Z. Angew. Phys. 1962;14:121. [Google Scholar]
- 239.Härdtl KH. Ceram. Int. 1982;8:121. [Google Scholar]
- 240.Zhang SJ, Xia R, Lebrun L, Anderson D, Shrout TR. Mater. Lett. 2005;59:3471. [Google Scholar]
- 241.Templeton A, Wang XR, Penn SJ, Webb SJ, Cohen LF, Alford NMcN. J. Ceram. Soc. 2000;83:95. [Google Scholar]
- 242.Shannon RD. Acta Crystallogr., Sect. A: Found. Crystallogr. 1976;32:751. [Google Scholar]
- 243.Negas T, Yeager G, Bell S, Coats N, Minis I. Am. Ceram. Soc. Bull. 1993;72:80. [Google Scholar]
- 244.Zhu JS, Chen K, Li W, Yan F, Dai YR, Lu XM, Wang YN. Mater. Sci. Eng. A. 2006;442:49. [Google Scholar]
- 245.Cheng BL, Gabbay M, Fantozzi G. J. Mater. Sci. 1996;31:4141. [Google Scholar]
- 246.Hagemann HJ. J. Phys. C: Soild State Phy. 1978;11:3333. [Google Scholar]
- 247.Frayssignes H, Gabbay M, Fantozzi G, Porch NJ, Cheng BL, Button TW. J. Eur. Ceram. Soc. 2004;24:2989. [Google Scholar]
- 248.Kamysheva LN, Rozhdin SN. Ferroelectrics. 1987;71:281. [Google Scholar]
- 249.Sakata K, Masuda Y. Ferroelectrics. 1974;7:347. [Google Scholar]
- 250.Isupov VA, Golovschikova GI, Mylnikova IE. Ferroelectrics. 1974;8:507. [Google Scholar]
- 251.Roleder K, Handerrek J, Ujma Z, Kania A. Ferroelectrics. 1986;70:181. [Google Scholar]
- 252.Roleder K, Kugel GE, Handerek J, Fontana MD, Carabatos C, Hafid M, Kania A. Ferroelectrics. 1988;80:166. [Google Scholar]
- 253.Margraf R, Kolpakova NN, Sher ES. Ferroelectrics. 1988;81:77. [Google Scholar]
- 254.Bokov AA, Shonov VY. Ferroelectrics. 1990;108:237. [Google Scholar]
- 255.Cach R, Tomaszewski PE, Bornarel J. J. Phys. C: Solid State Phy. 1985;18:915. [Google Scholar]
- 256.Chen ZL, Yao X, Cross LE. Ferroelectrics. 1983;44:271. [Google Scholar]
- 257.Martin F, ter Brake HJM, Lebrun L, Zhang SJ, Shrout TR. J. Appl. Phys. 2012;111:104108. [Google Scholar]
- 258.Wang FF, Or SW, Zhao XY, Luo HS. J. Phys. D: Appl. Phys. 2009;42:182001. [Google Scholar]
- 259.Commercial data. see: http://www.morganelectroceramics.com. [Google Scholar]
- 260.Commercial data. see: http://www.ferroperm-piezo.com. [Google Scholar]
- 261.Commercial data. see: http://www.nec-tokin.com. [Google Scholar]
- 262.Commercial data. see: https://www.americanpiezo.com. [Google Scholar]
- 263.Commercial data. see: http://www.piezoproducts.com. [Google Scholar]
- 264.Commercial data. see: http://www.piezotechnologies.com. [Google Scholar]
- 265.Commercial data. see: http://www.fujicera.co.jp. [Google Scholar]
- 266.Rödel J, Jo W, Seifert KTP, Anton EM, Granzow T. J. Ceram. Soc. 2009;92:1153. [Google Scholar]
- 267.Cross LE. Nature. 2004;432:24. [Google Scholar]
- 268.Surowiak Z, Czekaj D. Molecular and Quantum Acoustics. 2003;24:183. [Google Scholar]
- 269.Lebrun L, Guiffard B, Audigier D, Boucher E, Guyomar D, Eyraud L, Pleska E. J. Eur. Ceram. Soc. 2001;21:1357. [Google Scholar]
- 270.Boucher E, Guyomar D, Lebrun L, Guiffard B, Grange G. J. Appl. Phys. 2002;92:5437. [Google Scholar]
- 271.Gao YK, Chen YH, Ryu J, Uchino K, Viehland D. Jpn. J. Appl. Phys. 2001;40:587. [Google Scholar]
- 272.EU-Directive 2002/96/EC: Waste Electrical and Electronic Equipment (WEEE) Off. J. Eur. Union. 2003;46:24. [Google Scholar]
- 273.EU-Directive 2002/95/EC: Restriction of the Use of Certain Hazardous Substances in Electrical and Electronic Equipment (RoHS) Off. J. Eur. Union. 2003;46:19. [Google Scholar]
- 274.Saito Y, Takao H, Tani T, Nonoyama T, Takatori K, Homma T, Nagaya T, Nakamura M. Nature. 2004;432:84. doi: 10.1038/nature03028. [DOI] [PubMed] [Google Scholar]
- 275.Shrout TR, Zhang SJ. J. Electroceram. 2007;19:113. [Google Scholar]
- 276.Wang XP, Wu JG, Xiao DQ, Zhu JG, Cheng XJ, Zheng T, Zhang BY, Lou XJ, Wang XJ. J. Chem. Soc. 2014;136:2905. doi: 10.1021/ja500076h. [DOI] [PubMed] [Google Scholar]
- 277.Bortolani F, del Campo A, Fernandez JF, Clemens F, Rubio-Marcos F. Chem. Mater. 2014;26:3838. [Google Scholar]
- 278.Safari A, Hejazi M. In: Lead-Free Piezoelectrics. Priya S, Nahm S, editors. Springer, London: Springer; 2012. pp. 139–176. [Google Scholar]
- 279.Egerton L, Dillon DM. J. Ceram. Soc. 1959;42:438. [Google Scholar]
- 280.Jaeger R, Egerton L. J. Ceram. Soc. 1962;45:209. [Google Scholar]
- 281.Zhang SJ, Xia R, Hao H, Liu HX, Shrout TR. Appl. Phys. Lett. 2007;92:152904. doi: 10.1063/1.2908960. [DOI] [PMC free article] [PubMed] [Google Scholar]
- 282.Zhang SJ, Xia R, Shrout TR. Appl. Phys. Lett. 2007;91:132913. [Google Scholar]
- 283.Zhang SJ, Xia R, Shrout TR, Zang GZ, Wang JF. Solid State Commun. 2007;141:675. [Google Scholar]
- 284.Zhang JL, Qin YL, Gao Y, Yao WZ, Zhao ML. J. Ceram. Soc. 2014;97:759. [Google Scholar]
- 285.Wu JG, Wang YM. Dalton Trans. 2014;43:12836. doi: 10.1039/c4dt01712a. [DOI] [PubMed] [Google Scholar]
- 286.Zhang SJ, Lim JB, Lee HJ, Shrout TR. IEEE Trans. Ultrason. Ferroelectr. Freq. Control. 2009;56:1523. doi: 10.1109/TUFFC.2009.1215. [DOI] [PMC free article] [PubMed] [Google Scholar]
- 287.Matsubara M, Yamaguchi T, Kikuta K, Hirano S. Jpn. J. Appl. Phys. 2005;44:258. [Google Scholar]
- 288.Matsubara M, Yamaguchi T, Kikuta K, Hirano S. Jpn. J. Appl. Phys. 2005;44:6136. [Google Scholar]
- 289.Park BC, Hong IK, Jang HD, Tran VDN, Tai WP, Lee JS. Mater. Lett. 2010;64:1577. [Google Scholar]
- 290.Malic B, Bernard J, Holc J, Jenko D, Kosec M. J. Eur. Ceram. Soc. 2005;25:2707. [Google Scholar]
- 291.Malic B, Bernard J, Holc J, Kosec M. Ferroelectrics. 2005;314:149. [Google Scholar]
- 292.Park SH, Ahn CW, Nahm S, Song JS. Jpn. J. Appl. Phys. 2004;43:L1072. [Google Scholar]
- 293.Chang YF, Yang ZP, Wei LL, Liu B. Mater. Sci. Eng. A. 2006;437:301. [Google Scholar]
- 294.Guo YP, Kakimoto K, Ohasto H. Mater. Lett. 2005;59:241. [Google Scholar]
- 295.Saito Y Y, Takao H. Ferroelectrics. 2003;338:17. [Google Scholar]
- 296.Saito T, Adachi H, Wada T. Jpn. J. Appl. Phys. 2005;44:L573. [Google Scholar]
- 297.Li XH, Jiang M, Liu J, Zhu JL, Zhu XH, Li LH, Zhou Y, Xiao DQ. Phys. Status Solidi A. 2009;206:2622. [Google Scholar]
- 298.Jiang M, Liu X, Chen G, Zhou C. Mater. Lett. 2009;63:1262. [Google Scholar]
- 299.Hagh NM, Kerman K, Jadidian B, Eur J. Ceram. Soc. 2009;29:2325. [Google Scholar]
- 300.Ryu J, Choi JJ, Hahn BD, Park DS, Yoon WH, Kim KY. IEEE Trans. Ultrason. Ferroelectr. Freq. Control. 2007;54:2510. doi: 10.1109/TUFFC.2007.569. [DOI] [PubMed] [Google Scholar]
- 301.Hagh NM, Jadidian B, Ashbahian E, Safari A. IEEE Trans. Ultrason. Ferroelectr. Freq. Control. 2008;55:214. doi: 10.1109/TUFFC.2008.630. [DOI] [PubMed] [Google Scholar]
- 302.Hagh NM, Jadidian B, Safari A. J. Electroceram. 2007;18:339. [Google Scholar]
- 303.Smolenskii GA, Isupov VA, Agranovskaya AI, Krainik NN. Sov. Phys. Solid State. 1961;2:2651. [Google Scholar]
- 304.Aksel E, Forrester JS, Jones JL, Thomas PA, Page K, Suchomel MR. Appl. Phys. Lett. 2011;98:152901. [Google Scholar]
- 305.Sasaki A, Chiba T, Mamiya Y, Mamiya Y, Otsuki E. Jpn. J. Appl. Phys. 1999;38:5564. [Google Scholar]
- 306.Takenaka T, Mareyama KI, Sakata K. Jpn. J. Appl. Phys. 1991;30:2236. [Google Scholar]
- 307.Hiruma Y, Watanabe T, Nagata H, Takenaka T. Jpn. J. Appl. Phys. 2008;47:7659. [Google Scholar]
- 308.Hu HC, Zhu MK, Xie FY, Lei N, Chen J, Hou YD, Yan H. J. Ceram. Soc. 2009;92:2039. [Google Scholar]
- 309.Lee HJ, Ural SO, Chen L, Uchino K, Zhang SJ. J. Ceram. Soc. 2012;95:3383. [Google Scholar]
- 310.Li HD, Feng CD, Xiang PH. Jpn. J. Appl. Phys. 2003;42:7387. [Google Scholar]
- 311.Li HD, Feng CD, Yao WL. Mater. Lett. 2004;58:1194. [Google Scholar]
- 312.Zuo RZ, Ye C, Fang XS, Li JW, Eur J. Ceram. Soc. 2008;28:871. [Google Scholar]
- 313.Yoon MS, Lee YG, Ur SC. J. Electroceram. 2009;23:564. [Google Scholar]
- 314.Wang XX, Chan HLW, Choy CL. Appl. Phys. A. 2005;80:333. [Google Scholar]
- 315.Iriea H, Miyayama M, Kudo T. J. Appl. Phys. 2001;90:4089. [Google Scholar]
- 316.Jamieson PB, Abrahams SC, Bernstein JL. J. Chem. Phys. 1968;48:5048. [Google Scholar]
- 317.Nagata H, Hiruma Y, Suzuki M, Takenaka T. Electronics Commun. Jpn. 2008;91:1141. [Google Scholar]
- 318.Nagata H, Seki M, Noumura Y, Hiruma Y, Takenaka T. Jpn. J. Appl. Phys. 2011;50:09ND05. [Google Scholar]
- 319.Ando A, Kimura M, Sakabe Y. Proc. 11th IEEE Int. Symp. Applications of erroelectrics. 1998:303. [Google Scholar]
- 320.Ando A, Sawada T, Ogawa H, Kimura M, Sakabe Y. Jpn. J. Appl. Phys. 2002;41:7057. [Google Scholar]
- 321.Ando A, Kimura M, Sakabe Y. Jpn. J. Appl. Phys. 2003;42:520. [Google Scholar]
- 322.Ogawa H, Kawada S, Kimura M, Shiratsuyu K, Sakabe Y. IEEE Trans. Ultrason. Ferroelectr. Freq. Control. 2007;54:2500. doi: 10.1109/TUFFC.2007.567. [DOI] [PubMed] [Google Scholar]
- 323.Zhang SJ, Kim N, Shrout TR, Kimura M, Ando A. Solid State Commun. 2006;140:154. [Google Scholar]
- 324.Noumura Y, Hiruma Y, Nagata H, Takenaka T. Jpn. J. Appl. Phys. 2010;49:09MD02. [Google Scholar]
- 325.Ogawa H, Kawada S, Kimura M, Higuchi Y, Takagi H. Jpn. J. Appl. Phys. 2009;48:09KD05. [Google Scholar]
- 326.Kawada S, Ogawa H, Kimura M, Shiratsuyu K, Niimi H. Jpn. J. Appl. Phys. 2006;45:7455. [Google Scholar]
- 327.Leyet Y, Guerrero F, de Los J, Guerra S, Venet M, Eiras JA. J. Appl. Phys. 2007;101:064105. [Google Scholar]
- 328.Soejima J, Sato K, Nagata K. Jpn. J. Appl. Phys. 2000;39:3083. [Google Scholar]
- 329.Venet M, Vendramini A, Zabotto FL, Garcia FD, Eiras JA. J. Eur. Ceram. Soc. 2005;25:2443. [Google Scholar]
- 330.Lee HS, Kimura T. J. Eur. Ceram. Soc. 1998;81:3228. [Google Scholar]
- 331.Soejima J, Nagata K. Jpn. J. Appl. Phys. 2001;40:5747. [Google Scholar]
- 332.Nagata K, Kawatani Y, Okazaki K. Jpn. J. Appl. Phys. 1983;22:1353. [Google Scholar]
- 333.Francombe MH, Lewis B. Acta Crystallogr. 1958;11:696. [Google Scholar]
- 334.Mercadelli E, Sanson A, Galassi C. In: Piezoelectric Ceramics. Suaste-Gomez E, editor. Croatia: InTech-Open Access Company; 2010. pp. 111–128. [Google Scholar]
- 335.Sahini MG, Grande T, Fraygola B, Biancoli A, Damjanovic D, Setter N. J. Am. Ceram. Soc. 2014;97:220. [Google Scholar]
- 336.He LX, Li CE, Chen TG, Yan HY. Chin. Phys. B. 2000;9:149. [Google Scholar]
- 337.Smith WA. Continuing Advocacy of the Fundamental Studies on Ferroelectric Materials for more than 20 Years. State College, PA, USA: Navy Workshop on Acoustic Transduction Materials and Devices; 2010. [Google Scholar]
- 338.Uchino K, Cross LE, Nomura S. J. Mater. Sci. 1980;15:2643. [Google Scholar]
- 339.Finkel P, Robinson H, Stace J, Amin A. Appl. Phys. Lett. 2010;97:122903. [Google Scholar]
- 340.Amin A, McLaughlin E, Robinson H, Ewart L. IEEE Trans. Ultrason. Ferroelectr. Freq. Control. 2007;54:1090. doi: 10.1109/tuffc.2007.362. [DOI] [PubMed] [Google Scholar]
- 341.Zhang QH, Zhao XY, Sun RB, Luo HS. Phys. Status Solidi A. 2011;208:1012. [Google Scholar]
- 342.Huo XQ, Zheng LM, Zhang SJ, Zhang R, Liu G, Wang R, Yang B, Cao WW, Shrout TR. Phys. Status Solidi RRL. 2014;8:86. doi: 10.1002/pssr.201308173. [DOI] [PMC free article] [PubMed] [Google Scholar]
- 343.Zheng LM, Huo XQ, Wang R, Wang JJ, Jiang WH, Cao WW. Cryst Eng Comm. 2013;15:7718. [Google Scholar]
- 344.Inagaki Y, Kakimoto K-I. Appl. Phys. Express. 2008;1:061602. [Google Scholar]
- 345.Wada S, Muraoka K, Kakemoto H, Tsurumi T, Kumagai H. Jpn. J. Appl. Phys. 2004;43:6692. [Google Scholar]
- 346.Lin DB, Li ZR, Zhang SJ, Xu Z, Yao X. Solid State Commun. 2009;149:1646. [Google Scholar]
- 347.Davis M, Klein N, Damjanovic D, Setter N, Gross A, Wesemann V, Vernay S, Rytz D. Appl. Phys. Lett. 2007;90:062904. [Google Scholar]
- 348.Zhang QH, Zhang YY, Wang FF, Lin D, Li XB, Zhao XY, Luo HS. J. Cryst. Growth. 2010;312:457. [Google Scholar]
- 349.Zhang Q, Zhang YY, Wang FF, Wang YJ, Lin D, Zhao XY, Luo HS, Ge WW, Viehland D. Appl. Phys. Lett. 2009;95:102904. [Google Scholar]
- 350.Abrahams SC, Hamilton WC, Reddy JM. J. Chem. Phys. Solids. 1966;27:1019. [Google Scholar]
- 351.Abrahams SC, Buehler E, Hamilton WC, Laplaca SJ, Chem J. Phys. Solids. 1973;34:521. [Google Scholar]
- 352.Nassau K, Levinstein HJ, Lolpcono GM. J. Chem. Phys. Solids. 1966;27:989. [Google Scholar]
- 343.Uchino K, Zheng J, Joshi A, Chen Y, Yoshikawa S, Hirose S, Takahashi S, Vries JD. J. Electroceram. 1998;2:33. [Google Scholar]
- 354.Papadakis EP. J. Appl. Phys. 1971;42:2990. [Google Scholar]
- 355.Jiang WH, Cao WW, Han PD. Appl. Phys. Lett. 2002;80:2466. [Google Scholar]
- 356.Sun EW, Cao WW, Han PD. IEEE Trans. Ultrason. Ferroelectr. Freq. Control. 2011;58:1669. doi: 10.1109/TUFFC.2011.1994. [DOI] [PMC free article] [PubMed] [Google Scholar]


