

Abstract
Background
Rice yield and quality are adversely affected by high temperatures, especially at night; high nighttime temperatures are more harmful to grain weight than high daytime temperatures. Unfortunately, global temperatures are consistently increasing at an alarming rate and the minimum nighttime temperature has increased three times as much as the corresponding maximum daytime temperature over the past few decades.
Results
We analyzed the transcriptome profiles for rice grain from heat-tolerant and -sensitive lines in response to high night temperatures at the early milky stage using the Illumina Sequencing method. The analysis results for the sequencing data indicated that 35 transcripts showed different expressions between heat-tolerant and -sensitive rice, and RT-qPCR analyses confirmed the expression patterns of selected transcripts. Functional analysis of the differentially expressed transcripts indicated that 21 genes have functional annotation and their functions are mainly involved in oxidation-reduction (6 genes), metabolic (7 genes), transport (4 genes), transcript regulation (2 genes), defense response (1 gene) and photosynthetic (1 gene) processes. Based on the functional annotation of the differentially expressed genes, the possible process that regulates these differentially expressed transcripts in rice grain responding to high night temperature stress at the early milky stage was further analyzed. This analysis indicated that high night temperature stress disrupts electron transport in the mitochondria, which leads to changes in the concentration of hydrogen ions in the mitochondrial and cellular matrix and influences the activity of enzymes involved in TCA and its secondary metabolism in plant cells.
Conclusions
Using Illumina sequencing technology, the differences between the transcriptomes of heat-tolerant and -sensitive rice lines in response to high night temperature stress at the early milky stage was described here for the first time. The candidate transcripts may provide genetic resources that may be useful in the improvement of heat-tolerant characters of rice. The model proposed here is based on differences in expression and transcription between two rice lines. In addition, the model may support future studies on the molecular mechanisms underlying plant responses to high night temperatures.
Electronic supplementary material
The online version of this article (doi:10.1186/s12864-015-1222-0) contains supplementary material, which is available to authorized users.
Keywords: Rice, Early milky stage, High night temperature, Transcriptomics, RNA-sequencing
Background
The grain weight of rice (Oryza sativa L.) and other cereals is determined by the rate of grain growth and the duration of the growth period [1-3]. High temperature stress increases the growth rate of grain during the early ripening period and reduces the duration of growth, but the increase in the rate of grain growth fails to compensate for the reduction in the duration of grain growth, which ultimately results in a decrease in final grain weight [4,5]. Previous studies reported that high nighttime temperatures are more harmful to grain weight in rice and other crops than high daytime temperatures, because a deficiency of carbohydrates occurs in the leaves and culms due to increased respiration loss under high night temperatures [6,7]. Rice is one of the word’s major food sources, feeding more than half of the global population, and the world rice production must increase by 1% annually to meet the growing demand for food that will result from population growth and economic development. Unfortunately, the global surface temperature is rising consistently and the minimum nighttime temperature has increased approximately three times as much as the corresponding maximum daytime temperature over the past few decades [7].
It is well studied that the typical symptoms caused by high temperature stress during rice grain filling include an increased rice grain-filling rate, a low amylose content, an increased chalkiness degree and a poor milling quality [8-10]. Under high temperature stress, many of the starch synthase-related enzymes, such as granule-bound starch synthase (GBSS), soluble starch synthase (SSS) and starch debranching enzyme (DBE), were shown to be regulated by high temperatures [11-14]. A high temperature can also play a role in the down-regulation of the isoforms of the SBE genes (SBEI, SBEIIb and SBEIII) and up-regulation of the SSS isoforms (SSSIIb, SSSIIc, SSSIIIb and SSSIVa), and some starch-consuming genes, i.e., α-amylase (Amy1A, Amy3D and Amy3E) that cause low amylase contents in rice grain under high temperature stress [11,13]. Previous studies reported that the expression of cyPPDKB and BEIIb was down-regulated by high temperatures, which resulted in an increase in rice grain chalkiness, suggesting that BEIIb and cyPPDKB may be two of the candidate genes that play a critical role in grain chalkiness [6,15].
The development of cereal endosperm, including rice, goes through three major phases. In the first phase, the endosperm mainly undergoes cell division and differentiation to increase cell number. In the second phase, macromolecules accumulate to complete the endosperm cell enlargement, and in the third phase, the endosperm reaches maturity by undergoing starch and protein transformation [4,16,17]. It is well known that the damages and responding molecules of high temperature stress move from the second to the third phase of endosperm development, and the influence of high temperatures on endosperm development have been studied at enzyme/protein [18-20] and gene [10,13,15] levels. Previous studies also reported that the weight of rice grain was permanently damaged under high temperature stress at the early milky stage (8–15 days after flowering), and rice grain quality and weight could not be reversed, even if optimum temperature conditions were provided after the high temperature stress [21,22]. However, the molecular mechanism underlying these observations remains unclear.
The advent of next-generation high-throughput RNA sequencing technology has revolutionized transcriptome studies [23,24]. The technology is not only a powerful tool for discovering the full length of 5′ and 3′ untranslated regions, novel splice junctions, novel transcripts, alternative transcription start sites and rare transcripts [23,25,26], but can also detect and quantify gene expression using digital measurements, and is especially sensitive for low-expressed genes [27,28]. In addition, RNA-seq data show a high level of reproducibility in both technical and biological replicates [23,29].
In the present study, we used Illumina sequencing to compare the transcriptome differences between heat-tolerant and -sensitive rice lines responding to high night temperatures at the first phase of rice endosperm development (early milky stage). The goals of the current work were to identify potential candidate genes involved in the high night temperature response in rice. This may provide genetic resources that can be used for the improvement of heat-tolerant characters in rice. In addition, this work may provide a starting point for the elucidation of the molecular mechanism underlying the high night temperature stress response in rice.
Results and discussion
High night temperatures decreased grain plumpness (filled spikelets) of rice
It has been reported that plant growth and grain weight are strongly influenced by temperature [5,30]. In this study, rice grains were exposed to high night temperatures at the early milky stage (see methods), followed by normal growth conditions until maturity, and the grain plumpness of the heat-tolerant and -sensitive lines was determined and compared. The results showed that grain plumpness of the two lines decreased after 48 h (including two 10-h dark periods) of high night temperature stress, and the decrease ratio of grain plumpness in the heat-sensitive line decreased far more than in the heat-tolerant line [see Additional file 1]. This indicated that high night temperatures have different effects on heat-tolerant and -sensitive rice lines.
Sequencing information
To compare the transcriptomes between the heat-tolerant and -sensitive lines responding to high temperature stress at the early milky stage, cDNA libraries were prepared from rice grain and subjected to RNA-Seq analysis on the Illumina HiSeq 2000 platform. A total of 1.34 billion raw reads were generated from the heat-tolerant and -sensitive lines.
A total of 1.25 billion (93.26%) high-quality 101-bp paired-end reads were selected for mapping to the Nipponbare reference genome by tophat [31]. The alignment results showed that 986 million (78.83%) of the high-quality reads were successfully mapped to the reference genome of O. sativa (Table 1). Of the mapped reads, 67.31-78.07% were mapped to exonic regions, 0.46-1.54% to intronic regions, 3.98-11.67% to intergenic regions and 17.29-25.33% to spliced regions (Table 2). These results suggest that a significant number of transcripts likely originated from alternative mRNA splicing or novel genes.
Table 1.
General information of sequencing reads and reads that mapped to the reference genome
| Sample | Raw reads | High quality reads | Mapping to genome | ||
|---|---|---|---|---|---|
| Number | % | Number | % | ||
| SC1 | 110,445,132 | 102,110,944 | 92.45 | 81,760,543 | 80.07 |
| SC2 | 118,361,874 | 109,714,376 | 92.69 | 87,250,440 | 79.53 |
| SC3 | 108,124,090 | 99,783,462 | 92.29 | 79,232,619 | 79.4 |
| ST1 | 122,256,502 | 114,109,402 | 93.34 | 88,945,294 | 77.95 |
| ST2 | 109,367,326 | 102,743,400 | 93.94 | 80,030,194 | 77.89 |
| ST3 | 106,564,594 | 99,517,680 | 93.39 | 77,090,356 | 77.46 |
| TC1 | 108,790,978 | 102,039,304 | 93.79 | 79,933,511 | 78.34 |
| TC2 | 105,514,112 | 99,385,790 | 94.19 | 80,911,686 | 81.41 |
| TC3 | 102,595,286 | 96,561,142 | 94.12 | 76,501,404 | 79.23 |
| TT1 | 117,028,020 | 108,822,936 | 92.99 | 84,948,725 | 78.06 |
| TT2 | 117,708,038 | 109,660,302 | 93.16 | 85,938,332 | 78.37 |
| TT3 | 114,845,464 | 106,774,882 | 92.97 | 83,835,866 | 78.52 |
| Total | 1,341,601,416 | 1,251,223,620 | 93.26 | 986,378,970 | 78.83 |
“ST”, “SC”, “TT” and “TC” indicate the treatment and control of the heat-sensitive and -tolerant lines, respectively; “1”, “2” and “3” indicate three biological replicates.
Table 2.
Overview of reads that mapped to the genic and intergenic regions
| Sample | Total MP | Exon | % | Intron | % | InterGenic | % | Spliced | % |
|---|---|---|---|---|---|---|---|---|---|
| SC1 | 120,604,217 | 92,309,005 | 76.54 | 860,430 | 0.71 | 4,794,472 | 3.98 | 22,640,310 | 18.77 |
| SC2 | 120,489,277 | 84,173,841 | 69.86 | 1,248,829 | 1.04 | 5,752,705 | 4.77 | 29,313,902 | 24.33 |
| SC3 | 115,039,494 | 83,651,248 | 72.72 | 1,110,422 | 0.97 | 7,031,767 | 6.11 | 23,246,057 | 20.21 |
| ST1 | 191,954,792 | 131,590,789 | 68.55 | 1,479,338 | 0.77 | 21,420,452 | 11.16 | 37,464,213 | 19.52 |
| ST2 | 121,649,971 | 84,829,641 | 69.73 | 1,075,848 | 0.88 | 11,366,864 | 9.34 | 24,377,618 | 20.04 |
| ST3 | 112,121,097 | 76,909,155 | 68.59 | 1,401,805 | 1.25 | 9,872,787 | 8.81 | 23,937,350 | 21.35 |
| TC1 | 124,254,032 | 84,405,467 | 67.93 | 1,029,079 | 0.83 | 14,506,377 | 11.67 | 24,313,109 | 19.57 |
| TC2 | 110,100,967 | 85,954,481 | 78.07 | 510,469 | 0.46 | 4,602,925 | 4.18 | 19,033,092 | 17.29 |
| TC3 | 105,698,981 | 73,161,750 | 69.22 | 1,069,136 | 1.01 | 6,573,728 | 6.22 | 24,894,367 | 23.55 |
| TT1 | 113,772,045 | 76,581,286 | 67.31 | 1,747,207 | 1.54 | 6,621,542 | 5.82 | 28,822,010 | 25.33 |
| TT2 | 147,430,188 | 100,277,333 | 68.02 | 1,518,413 | 1.03 | 15,045,184 | 10.2 | 30,589,258 | 20.75 |
| TT3 | 110,358,555 | 75,782,160 | 68.67 | 1,472,869 | 1.33 | 6,061,655 | 5.49 | 27,041,871 | 24.5 |
| Total | 1,493,473,616 | 1,049,626,156 | 70.28 | 14,523,845 | 0.97 | 113,650,458 | 7.61 | 315,673,157 | 21.14 |
“ST”, “SC”, “TT” and “TC” indicate the treatment and control of the heat-sensitive and -tolerant lines, respectively; “1”, “2” and “3” indicate three biological replicates.
The high-quality reads were then assembled using the Cufflinks program [32], and 35,272-42,377 assembly transcripts were obtained; the size of the assembly transcripts varied from 50 to 5000 bp [see Additional file 2], with an average size of 1,264-1,590 bp and N50 of 1,547-2,007 bp (Table 3). Of these assembled transcripts, 89.78-92.54% matched completely with the annotated rice genes, whereas 7.46-10.22% did not show any alignment hits to the rice genes that potentially originated from novel isoforms.
Table 3.
Assembly statistics
| Sample | Number of transcripts | Average size (bp) | N50 (bp) | Known transcripts | Novel transcripts | ||
|---|---|---|---|---|---|---|---|
| Number (%) | Number of genes | Number (%) | Number of genes | ||||
| SC1 | 35,975 | 1,469.6 | 1,831 | 33,235 (92.38) | 21,914 | 2,740 (7.62) | 2194 |
| SC2 | 39,333 | 1,507.2 | 1,899 | 36,022 (91.58) | 23,528 | 3,311 (8.42) | 2663 |
| SC3 | 38,489 | 1,508.6 | 1,886 | 35,178 (91.40) | 22,720 | 3,311 (8.60) | 2641 |
| ST1 | 40,989 | 1,394.4 | 1,802 | 37,256 (90.89) | 23,998 | 3,733 (9.11) | 2987 |
| ST2 | 40,125 | 1,544.6 | 1,926 | 36,540 (91.07) | 23,780 | 3,585 (8.93) | 2837 |
| ST3 | 40,972 | 1,584.6 | 1,983 | 37,026 (90.37) | 23,759 | 3,946 (9.63) | 3191 |
| TC1 | 38,268 | 1,526.1 | 1,902 | 35,268 (92.16) | 23,205 | 3,000 (7.84) | 2398 |
| TC2 | 35,272 | 1,264.2 | 1,547 | 32,639 (92.54) | 22,862 | 2,633 (7.46) | 2179 |
| TC3 | 38,507 | 1,528.8 | 1,903 | 35,518 (92.24) | 23,539 | 2,989 (7.76) | 2397 |
| TT1 | 42,377 | 1,590.2 | 2,007 | 38,090 (89.88) | 24,419 | 4,287(10.12) | 3458 |
| TT2 | 40,585 | 1,399.2 | 1,823 | 36,939 (91.02) | 23,603 | 3,646 (8.98) | 2896 |
| TT3 | 41,515 | 1,557.1 | 1,969 | 37,273 (89.78) | 24,214 | 4,242(10.22) | 3443 |
“ST”, “SC”, “TT” and “TC” indicate the treatment and control of the heat-sensitive and -tolerant lines, respectively; “1”, “2” and “3” indicate three biological replicates.
Transcript analysis in response to high night temperature
Gene expression levels can be estimated from Illumina sequencing data based on the number of raw reads [33,34]. To identify differentially expressed transcripts (DEGs), the number of fragments mapped to each gene was calculated and normalized using fragments per kb per million fragments (FPKM) [32]. The FPKM value of each gene from the treatment vs. control was calculated according to the following criteria: p-value ≤ 0.05 and fold change (FC) log2 ≥ 1.0 [35,36]. The transcripts with FPKM values that fit the above criteria were considered for further analysis and are referred to as the high night temperature response transcripts (HTRTs) in the heat-tolerant or -sensitive lines in the present study.
A total of 3,226 transcripts showed up-regulation and 2,158 transcripts showed down-regulation in the heat-sensitive line (Figure 1), whereas 2,755 transcripts showed up-regulation and 2,772 transcripts showed down-regulation in the heat-tolerant line, with a p-value ≤ 0.05 and FC log2 ≥ 1.0. Among the DEGs, 843 transcripts were up-regulated and 769 transcripts were down-regulated, both in the heat-tolerant and -sensitive rice lines. Interestingly, 33 transcripts were down-regulated in the heat-tolerant line but up-regulated in the heat-sensitive line, and 16 transcripts were up-regulated in the heat-tolerant line but down-regulated in the heat-sensitive line.
Figure 1.

The number of up- and down-regulated transcripts between the heat-sensitive and -tolerant lines.
To assess the reproducibility of RNA-sequencing data, a cluster analysis of the 2-fold change values of the differentially expressed transcripts from three biological replicates was conducted, and the dendrogram analysis results [see Additional file 3] showed that the three biological replicates of the treatments and controls were clustered into one cluster, which suggested that the reproducibility of RNA-sequencing is reliable. To confirm the validity of the DEG data, RT-qPCR analysis was performed on 12 randomly selected genes, which indicated that these genes showed a similar gene expression to the pattern predicted by the RNA-sequencing method [see Additional file 4].
GeneOntology (GO) analysis for HTRTs
Web Gene Ontology Annotation Plot (WEGO) software was used to perform the GO classifications and to draw the GO tree to classify the up- and down-regulated transcripts into putative functional groups for the heat-tolerant and -sensitive lines. A total of 9,155 and 9,011 transcripts were assigned GO terms for the heat-sensitive and -tolerant lines, respectively. Among the 9,155 transcripts from the heat-sensitive line (Figure 2A), there were 1,879 transcripts (890 showed up-regulation and 989 down-regulation) at the cellular level, 3,468 transcripts (1,346 showed up-regulation and 2,122 down-regulation) at the molecular level and 3,808 (1,506 showed up-regulation and 2,303 down-regulation) transcripts at the biological level. Among the 9,011 transcripts from the heat-sensitive line (Figure 2B), there were 2,019 transcripts (1,159 showed up-regulation and 860 down-regulation) at the cellular level, 3,228 transcripts (1,529 showed up-regulation and 1,699 down-regulation) at the molecular level and 3,764 transcripts (1,843 showed up-regulation and 1,921 down-regulation) at the biological level (Figure 2B). Within the cellular component category, transcripts that corresponded to cell (12,559) and cell organelles (12,559) were the most abundant. Binding (31,859) and catalytic activities (25,935) were the most abundant groups within the molecular functional category. A total of 15 GO functional groups were assigned to the biological processes category, among which metabolic processes (24,958) and cellular processes (22,198) were the most highly represented.
Figure 2.

Gene ontology classification of the unigenes from the heat-sensitive (A) and heat-tolerant (B) lines.
A comparison of the GO trees of the DEGs between the heat-tolerant and -sensitive lines revealed a higher number of down-regulated transcripts involved in extracellular regions, and a higher number of up-regulated transcripts involved in membrane-enclosed lumens at the cellular location category in the heat-sensitive line compared with the heat-tolerant line. This indicates that a high night temperature disrupts the cell-cell interactions and plasmalemma functioning in plant cells, and these effects exhibited different patterns in the heat-tolerant and -sensitive lines. In the molecular functional category, there was a higher number of down-regulated transcripts involved in nutrient reservoir and translation regulator activities in the heat-sensitive line compared with the heat-tolerant line. For the biological processes category, there was a higher number of up-regulated transcripts involved in reproduction and reproductive processes in the heat-sensitive line compared with the heat-tolerant line. This suggests that a high night temperature affects the reproduction of the plant cell, and the effects were different between the heat-sensitive and heat–tolerant lines.
DEGs of the HTRTs between the heat-tolerant vs. heat-sensitive lines
To identify differentially expressed HTRTs between heat-tolerant and -sensitive lines, the changes in the expression levels between the 5,384 DEGs (3,226 showed up-regulation and 2,158 showed down-regulation) from the heat-sensitive line and the 5,527 DEGs (2,755 showed up-regulation and 2,772 down-regulation) from the heat-tolerant line were further compared. The transcripts that showed a Relative Fold Change (RFC) ≥ 2.0 were selected for downstream analysis. A total of 35 transcripts showed different expression between the heat-tolerant and -sensitive rice, and the base sequences and FPKM values of the 35 transcripts are presented in Additional file 5. The results suggested that a high night temperature triggered thousand of transcripts to differentially express in the heat-tolerant and -sensitive lines, but only 35 transcripts showed a significant difference (RFC ≥ 2.0) in gene expression between the two lines. We suggest that these findings result from the similar genomics of the two rice materials (see Method-Plant materials) and the results provided a solid basis for our further study on selecting and cloning heat-resistant gene(s) in rice.
Of the 35 differentially expressed transcripts, 4 were down-regulated and 19 were up-regulated in both the heat-tolerant and -sensitive lines. In addition, 4 transcripts were up-regulated in the heat-tolerant line but down-regulated in the heat-sensitive line, and the other 8 transcripts were down-regulated in the heat-tolerant line but up-regulated in the heat-sensitive line (Figure 3).
Figure 3.
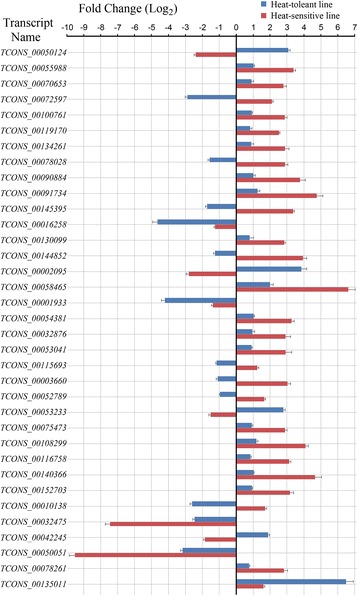
The expression patterns of the different HTRTs between the heat-tolerant and -sensitive lines. HTRTs: high night temperature response transcripts. Bar chart on the left of the x-axis denotes the down-regulated transcripts and bar chart on the right of the x-axis denotes up-regulated transcripts.
Functional annotation of the DEGs of the HTRTs
To annotate the 35 DEGs of the HTRTs, assembled transcript sequences were blasted to the National Center for Biotechnology Information (NCBI) website, against the non-redundant (nr) protein database with a cut-off e-value of 10−5. Among the 35 DEGs, 21 were functionally annotated based on the nr-NCBI database (Table 4). Based on the functional annotation, the 21 unigenes were classified into six groups: oxidation-reduction (6 genes), metabolic (7 genes), transport (4 genes), transcript regulation (2 genes), defense response (1 gene) and photosynthetic (1 gene) processes. Of the 14 HTRTs [see Additional file 6], 8 were found to have homologous genes but without functional annotation, whereas six HTRTs did not show any hits in the nr-NCBI database.
Table 4.
The differentially expressed HTRTs between heat-tolerant and -sensitive rice lines with their corresponding reference genes, functional annotations and protein functions
| Transcripts name | Size (bp) | Reference gene in GenBank | Interpro hits | Molecular function | |
|---|---|---|---|---|---|
| ID | Annotation | ||||
| Oxidation | |||||
| TCONS_00050124 | 1767 | OJ1115_B01.19 | IPR002401 | Cytochrome P450, E-class, group I | Oxidoreductase activity; acting on paired donors, with incorporation or reduction of molecular oxygen |
| TCONS_00134261 | 1808 | P0025D09.112 | IPR002401 | Cytochrome P450, E-class, group I | Oxidoreductase activity; acting on paired donors, with incorporation or reduction of molecular oxygen |
| TCONS_00070653 | 1973 | OS03G0760000 | IPR002401 | Cytochrome P450, E-class, group I | Oxidoreductase activity; acting on paired donors, with incorporation or reduction of molecular oxygen |
| TCONS_00055988 | 3243 | OJ1353_F08.4 | IPR000572 | Oxidoreductase, molybdopterin- binding domain | Electron carrier activity; catalyses oxidation of nitrate to nitrite, using cytochrome c as the physiological electron acceptor |
| TCONS_00100761 | 2437 | OSJNBA0083N12.10 | IPR002680 | Alternative oxidase | Alternative oxidase activity; used as a second terminal oxidase in the mitochondria, electrons are transferred directly from reduced ubiquinol to oxygen forming water |
| TCONS_00072597 | 1096 | OS03G0693900 | IPR001929 | Germin | Manganese ion binding; act as oxalate oxidases or as superoxide dismutase |
| Transportation | |||||
| TCONS_00130099 | 2072 | P0567H04.25 | IPR003663 | Sugar/inositol transporter | Substrate-specific transmembrane transporter activity; binding and transport of various carbohydrates, organic alcohols, and acids |
| TCONS_00144852 | 1741 | P0498H04.19 | IPR003480 | Transferase | Transferase activity; transferring acyl groups other than amino-acyl groups |
| TCONS_00053041 | 1016 | OJ1004_A05.35 | IPR000566 | Lipocalin/cytosolic fatty- acid binding domain | Transport small hydrophobic molecules such as steroids, bilins, retinoids |
| TCONS_00001933 | 1107 | P0432B10.23 | IPR016140 | Bifunctional inhibitor/plant lipid transfer protein/ seed storage helical domain | A transporter of fatty acids or fatty acid derivatives (e.g. hydroxy-fatty acids, acyl-CoA) necessary during the formation of cutin layers or during lipid mobilization in germinating seedlings |
| Metabolism | |||||
| TCONS_00016258 | 2627 | OS01G0150100 | IPR001330 | Prenyltransferase/squalene oxidase | Catalytic activity; catalyzes the cyclization of (S)-2,3- epoxysqualene to lanosterol, the initial precursor of steroid hormones and vitamin D |
| TCONS_00119170 | 794 | P0592E11.19 | IPR015797 | NUDIX hydrolase domain-like | Hydrolase activity; catalyze the hydrolysis of a variety of nucleo-side diphosphate derivatives |
| TCONS_00078028 | 1390 | OS03G0790500 | IPR013094 | Alpha/ beta hydrolase fold-3 | Hydrolase activity; a number of hydrolytic enzymes of widely differing phylogenetic origin and catalytic function |
| TCONS_00090884 | 1102 | OSJNBA0041A02.26 | IPR000757 | Glycoside hydrolase, family 16 site | Hydrolase activity; hydrolyzing O-glycosyl compounds |
| TCONS_00091734 | 2019 | OSJNBA0064H22.6 | IPR010107 | Glutamate decarboxylase | Glutamate decarboxylase activity; catalyze the irreversible alpha- decarboxylation of L-glutamate to gamma-amino-butyrate (GABA). |
| TCONS_00145395 | 1856 | OJ1368_G08.14 | IPR010977 | Aromatic-L-amino-acid decarboxylase | Carboxy-lyase activity; catalyses the decarboxylation of tryptophan to tryptamine |
| TCONS_00054381 | 2231 | P0705A04.34 | IPR001461 | Aspartic peptidase | Aspartic-type endopeptidase activity; encode for an aspartyl protease which is a homodimer of a chain of about 95 to 125 amino acids. |
| Transcription | |||||
| TCONS_00002095 | 1776 | NCRNA_5217 | IPR001584 | Integrase, catalytic core | Nucleic acid binding |
| TCONS_00058465 | 1242 | DREB1G | IPR001471 | AP2/ERF domain | Sequence-specific DNA binding transcription factor activity |
| Photosynthesis | |||||
| TCONS_00115693 | 877 | P0644A02.28 | IPR003245 | Plastocyanin-like | Electron carrier activity; exchange electrons with cytochrome c6 |
| Defense | |||||
| TCONS_00032876 | 2297 | OS11G0249000 | IPR000767 | Disease resistance protein | Plant defense response to pathogens |
Expression patterns of the unigenes
Electron transfer is a fundamental process in all living organisms. In plants, most electron relay systems lie in the mitochondrial respiratory chain and in the photosystems in chloroplasts. In the present study, five unigenes (TCONS_00050124, TCONS_00134261, TCONS_00070653, TCONS_00055988 and TCONS_00100761) involved in electron transfer in the mitochondrial respiratory chain and one (TCONS_00115693) in the photosystem were found to be differentially expressed in the heat-tolerant and -sensitive lines after high temperature exposure. Among the five unigenes involved in the mitochondrial respiratory chain, the molecular functions of three unigenes (TCONS_00050124, TCONS_00134261 and TCONS_00070653) was related to cytochrome P450 activity. Cytochrome P450, which catalyzes electron transfer through the pathway from NADPH to flavin adenine dinucleotide (FAD), then to flavin mononucleotide (FMN), and finally to heme groups containing redox partners [37,38], is also reported to be involved in reproductive development and act as a maternal regulator of seed size by stimulating integument cell proliferation in Arabidopsis [39-41]. One unigene (TCONS_00055988) with an annotation of molybdopterin-binding domain protein, which is known as the molybdopterin cofactor, is required for eukaryotic oxidoreductases to catalyze the reduction of nitrate to nitrite in a single polypeptide electron transport chain with electron flow from NAD(P)H-FAD-cytochrome b5-molybdopterin-NO(3) [42]. Another unigene (TCONS_00100761) is alternative oxidase, which is a second terminal oxidase in the mitochondria, and which transfers electrons directly from reduced ubiquinol to oxygen forming water [43].
Comparing the gene expression patterns between the heat-tolerant and -sensitive lines, four unigenes (TCONS_00134261, TCONS_00070653, TCONS_00055988 and TCONS_00100761) were up-regulated in both the heat-tolerant and -sensitive lines, but up-regulation was more pronounced in the heat-sensitive than in the heat-tolerant line (Figure 4). Interestingly, one of the cytochrome P450 unigenes (TCONS_00050124) showed a 3-fold up-regulation in the heat-sensitive line but more than a 2-fold down-regulation in the heat-tolerant line. The unigene (TCONS_00115693), which is involved in electron transfer in the photosystem, showed up-regulation in the heat-sensitive line but down-regulation in the heat-tolerant line. It was reported that the overexpression of the P450 cytochrome gene CYP78A in Arabidopsis produced a general growth phenotype such as reduced fertility, and the knockout line of the P450 cytochrome gene CYP78A5 showed a decreased cell number but not a decreased cell size [40]. In our study, the P450 cytochrome unigenes in the heat-sensitive line pronounced more up-regulation than in the heat-tolerant line, but the heat-sensitive line showed lower grain plumpness compared with the heat-tolerant line, which suggests that a higher expression level of the P450 unigenes would restrict grain plumpness in rice. Collectively, these results suggest that the electron transfer chains of mitochondrial respiration and the photosystems were influenced by high night temperatures, but there were differences in the damage patterns between the heat-tolerant and -sensitive lines.
Figure 4.

Possible regulating processes of the differentially expressed HTRTs in rice grain cells in response to high night temperatures at the early milky stage. Blue arrow indicates the electron transport orientation; Red words indicate the differentially expressed HTRTs, and the arrow pointing to the box indicates the regulated pathway. TCA: tricarboxylic acid cycle; FAD: flavin adenine dinucleotide; FMN: flavin mononucleotide; Q in the electron transport chain indicates ubiquinone (coenzyme Q, CoQ); Cyto: cytochrome; NO3 −: nitrate; NO2 −: nitrite.
Amino acid metabolism was influenced by high night temperature
Some amino acids or metabolic intermediates play an important role in plant growth and developmental processes, as well as in the resistance of plants to a variety of stresses, including both biotic and abiotic stresses [44]. For example, Brassinosteroids, a class of plant-specific steroidal hormones, were reported to influence grain yield, plant height, leaf angle, grain size and tiller number [45]. Gamma-aminobutyric acid (GABA), a non-protein amino acid converted by L-glutamate, was reported to be related to a blast pathogen [46] and salt stress [47,48]. Aspartic proteases,which are distributed in all living organisms, were reported to be involved in pollen germination and growth [49], disease resistance [50], drought and abscisic acid (ABA)-dependent signal transduction [51]. In the present study, unigenes involved in the synthesis of steroid hormones (TCONS_00016258), glycosyl (TCONS_00090884), glutamate (TCONS_00091734) and aspartic peptidase (TCONS_00054381) were found to have different expressions in the heat-tolerant and -sensitive lines after high temperature stress.
With respect to the expression patterns, the unigenes involved in glycosyl, glutamate and aspartic peptidase synthesis showed up-regulation in both the heat-tolerant and -sensitive lines, but up-regulation was more pronounced in the heat-sensitive line. A previous study reported that the aspartic protease ASPG1 gene in Arabidopsis was significantly up-regulated and triggered the expression of downstream targets in ABA signal transduction under drought conditions, which in turn promoted reactive oxygen species (ROS) production and caused oxidative damage in plant cells [51]. In the present study, the aspartic peptidase unigene TCONS_00054381 had a more pronounced up-regulation in the heat-sensitive than in the heat-tolerant line, which suggests that oxidative damage was more serious and led to low grain plumpness in the heat-sensitive line compared with the heat-tolerant line.
In plants, steroid hormones are involved in regulating gene expression to regulate plant growth and developmental processes such as cell elongation, photomorphogenesis and stress responses [44]. In the present study, the transcript (TCONS_00016258) involved in steroid hormone synthesis was down-regulated in both the heat-tolerant and -sensitive lines. The transcript showed more than 4-fold down-regulation in the heat-tolerant line but less than 2-fold down-regulation in the heat-sensitive line. However, the grain plumpness of the heat-sensitive line was lower than that of the heat-tolerant line under high night temperature stress, which suggests that reduced steroid hormones in plant cells may be beneficial for rice grain plumpness.
Transmembrane transport of metabolic intermediates was influenced by high night temperature
Transport of solutes and intermediates across cellular plasma membranes is necessary for complex metabolism. In this study, four unigenes involved in the transmembrane transport of sugar (TCONS_00130099), acyl (TCONS_00144852), hydrophobic molecules (TCONS_00053041) and fatty acids (TCONS_00001933) were found to be influenced by high night temperature stress.
For the expression pattern, the fatty acids transporter related unigene (TCONS_00001933) was down-regulated in both the heat-tolerant and -sensitive lines, and the unigene showed more than 3.5-fold greater down-regulation in the heat-tolerant line compared with the heat-sensitive line after high night temperature stress. The sugar transporter (TCONS_00130099) and hydrophobic molecule transporter (TCONS_00053041) showed higher expression in the heat-tolerant and -sensitive rice lines than in the controls, but up-regulation was more pronounced in the heat-sensitive line. In addition, the acyl transporter related unigene (TCONS_00144852) showed a 4-fold up-regulation in the heat-sensitive line but was down-regulated in the heat-tolerant line under high night temperature stress (Figure 4). The results of the gene expression patterns suggest that night warming stimulates dark respiration and leads to a depletion of carbohydrates in plant cells [52]. However, there was greater depletion of carbohydrates in the heat-sensitive line than in the heat-tolerant line, and this resulted in a low grain plumpness in the heat-sensitive line.
Hydrolysis and decarboxylization in rice cells were influenced by high temperature stress
Some Nudix hydrolases are reported to play regulatory roles in preventing accumulation of reactive nucleoside diphosphate derivatives, cell signaling molecules or metabolic intermediates by diverting them to metabolic pathways to maintain physiological homeostasis by sensing and modulating the levels of their substrates [53]. In the present study, three unigenes (TCONS_00119170, TCONS_00078028 and TCONS_00090884) involved in hydrolysis and two unigenes (TCONS_00091734 and TCONS_00145395) involved in decarboxylization were influenced by high night temperature stress. Comparing the expressed patterns of their parallel controls, the NUDIX hydrolase related unigene (TCONS_00119170) and glycoside hydrolase related unigene (TCONS_00090884) involved in hydrolysis, and the glutamate decarboxylase related unigene (TCONS_00091734) involved in decarboxylization showed up-regulation in both the heat-sensitive and heat-tolerant lines. In addition, the expression of the transcript was 3.5-fold higher in the heat-sensitive line compared with the heat-tolerant line. In contrast, the Alpha/beta hydrolase related unigene (TCONS_00078028) involved in hydrolysis and Aromatic-L-amino-acid decarboxylase related unigene (TCONS_00145395) involved in decarboxylization were up-regulated in the heat-sensitive line but down-regulated in the heat-tolerant line. The expression patterns of the genes related to hydrolysis suggest that the disturbance of physiological homeostasis in the heat-sensitive line was greater than in the heat-tolerant line.
Unknown transcripts may play an important role in rice responding to high night temperature stress
Fourteen transcripts without functional annotation exhibited differentially expressed patterns between the heat-sensitive and heat-tolerant lines. Interestingly, the unigene TCONS_00135011 showed more than 6-fold greater up-regulation compared with its control in the heat-tolerant line but less than 2-fold greater up-regulation in the heat-sensitive line. The unigene TCONS_00050051 was down-regulated more than 9-fold compared with its control in the heat-sensitive line but only down-regulated 3-fold in the heat-tolerant line. Further, the unigene TCONS_00032475 was down-regulated more than 7-fold compared with its control in the heat-sensitive line but was only down-regulated 2.5-fold in the heat-tolerant line. We suggest that these three unigenes may play an important role in rice response to high night temperature stress.
Proposed model that regulates the expression of differentially expressed transcripts during high temperature stress in rice at the early milky stage
Based on the functions of the differentially expressed HTRTs, we proposed a possible mechanism under which these unigenes function in response to heat shock in the plant cell (Figure 4). Initially, heat shock influenced the enzyme (TCONS_00050124, TCONS_00134261, TCONS_00070653 and TCONS_00100761) activities involved in electron transport under normal conditions, and disrupted electron transport from the intramembrane to the extramembrane in mitochondria, including the electron transport chains from NADP-NAD+ to FMN, FAD to ubiquinol-Q, and ubiquinol-Q to oxygen forming water, which led to changes in the concentration of the hydrogen ion in the mitochondrial and cellular matrix. In the mitochondrial matrix, the activities of the transporter for acyl-CoA (TCONS_00001933 and TCONS_00144852), glycoside hydrolase activities (TCONS_00090884 and TCONS_00091734) and glutamate decarboxylase activities (TCONS_00016258) were influenced by changes in the concentration of the hydrogen ion, which influenced the metabolism of oxaloacetic acid and citric acid, and further affected the metabolism of succinate to fumarate in the tricarboxylic acid cycle (TCA). The disruption of the metabolism of succinate to fumarate may result in feedback regulation of electron transport from the TCA to the mitochondrial membrane. In the cellular matrix, the electron transport chain from NO3− to NH4+ was also influenced by changes in the hydrogen ion concentration. According to our proposed model and the different expression patterns of the unigenes related to electron transfer, oxidation, hydrolase activities, depletion of carbohydrates and the production of metabolic intermediates involved in physiological homeostasis, it suggested that a high night temperature resulted in a more pronounced up-regulation and increased depletion of carbohydrates in the heat-sensitive line than in the heat-tolerant line, which led to lower carbohydrate accumulation and resulted in a low grain plumpness in the heat-sensitive line.
Comparing our previous results from transcriptome [54] and proteomics [20] studies in rice responding to high temperature stress (at daytime and nighttime), we suggest that high temperature may mainly affect the expression of genes related to oxidation, while a high night temperature could exert a major influence on the expression of genes related to the electron transport from the intramembrane to the extramembrane of mitochondria in rice grains at the early milky stage.
Conclusions
Using Illumina sequencing technology, the differences in the transcriptomes of heat-sensitive and -tolerant rice lines in response to high night temperature stress at the early milky stage are described here for the first time. The candidate transcripts may provide genetic resources for the improvement of heat-tolerant characters in rice. The proposed model, which is based on transcription expression differences between two rice lines, may facilitate future studies of the molecular mechanisms underlying high night temperature responses in plants.
Methods
Plant materials
Two rice lines, heat-tolerant XN0437T and heat-sensitive XN0437S, which originated from RIL inbred populations in our previous study, were used as the plant materials in this study. These lines showed only 1.80% genomic polymorphism based on the 887 SSR markers and showed significant differences in grain weight when exposed to high temperatures during the grain ripening period [55].
Growth conditions and temperature treatments
Rice was cultured using a tub-planting method described previously [20,53]. In order to ensure that only uniformly developed samples were used for analysis, rice ears with the same heading date were labelled, and then florets on the labelled ears with the same flowering date were further labelled.
On the 8th day after the labeled florets flowered, plants with the same label were transferred to chambers and maintained at a temperature of 38.0 ± 0.5°C (treatment) or 25.0 ± 0.5°C (control) for the dark period (10 h), and 26.0 ± 0.5°C (both treatment and control) for the light period (14 h). Three biological replicates of the temperature treatments were grown under the same conditions.
After 48 h of treatment, samples containing 45 grains with labels from the same region (middle to bottom part) of labelled ears were harvested, packed in aluminum foil, and flash-frozen in liquid nitrogen until further use. A total of 12 rice grain samples were harvested, i.e., controls (TC1, TC2 and TC3) and treatments (TT1, TT2 and TT3) of the three biological replicates of the heat-tolerant line, and controls (SC1, SC2 and SC3) and treatments (ST1, ST2 and ST3) of the three biological replicates of the heat-sensitive line.
To determine the effect of a high night temperature on the heat-tolerant and -sensitive lines, plants were moved to natural growth conditions until maturity, when grain plumpness (GP) was measured. GP was calculated using the formula GP (%) =100% × GWt/ GWc; GWt and GWc represent the weight of 1000 grains from the treatment and control, respectively. The three biological replicates of the temperature treatments were grown at different time periods under the same growth conditions.
RNA extraction and mRNA library construction
Total RNA was isolated from 12 rice panicle samples, including the controls, from three biological replicates (SC1, SC2 and SC3). These three biological replicates (ST1, ST2 and ST3) from the heat-sensitive line, the controls of the three biological replicates (TC1, TC2 and TC3), and the three biological replicates (TT1, TT2 and TT3) from the heat-tolerant line were treated using the RNeasy Plus Plant Kit (Qiagen, Germany), and the contaminated genomic DNA was removed using the RNeasy® MinElute® Cleanup Kit (Qiagen, Germany) following the manufacturer’s instructions. The RNA quality was checked using Bioanalyzer 2100 (Agilent, CA) with a minimum RNA Integrity Number (RIN) value of 8.5. Sequencing libraries were prepared using the TruSeq RNA Sample Preparation Kit (Illumina, CA) according to the manufacturer’s protocol as follows. Briefly, the poly (A)+RNA was isolated from 4 μg of the pooled total RNA from the 12 samples (SC1, SC2, SC3, ST1, ST2 ST3, TC1, TC2 TC3, TT1, TT2 and TT3) using Dynal oligo(dT)25 beads, and fragmented using divalent cations at 95°C. The fragmented RNA fragments were reverse transcribed into first strand cDNA using reverse transcriptase and random hexamers. Following the second strand cDNA synthesis and adaptor ligation, 300–350 bp cDNA fragments were isolated using gel electrophoresis and amplified by 12 cycles of PCR to produce the library for cluster generation and sequencing.
Illumina sequencing
The libraries (3 per lane) were loaded onto an Illumina HiSeq™ 2000 instrument and subjected to 100 cycles of paired-end (2 × 101 bp) sequencing that generated 10 Gb per sample. For the multiplexing sequencing, 100 cycles of single read 1 was used to sequence the RNA, followed by 7 cycles of index identification and 100 cycles of single read 2. Primary data analysis and base calling were performed using the Illumina instrument software (Illumina’s Consensus Assessment of Sequence and Variation, CASAVA).
Reads filtration and assembly
Before assembly, adaptor sequences, empty reads, low quality sequences with ‘N’ percentage over 5% and those containing more than 20% bases with a Q-value < 20 were removed using the Perl program written according to the custom method of Program editing. The retained high quality reads were mapped to the Nipponbare reference genome [56] by tophat [31], and then assembled with Cufflinks [32].
Functional annotation of transcripts
Information was obtained regarding functional annotation, including protein functional annotation, COG functional annotation, and GO functional annotation of unigenes. Unigene sequences were first submitted to the protein databases for alignment and comparison by BLASTX algorithms with a significant threshold e-value ≤ 1e-5, from the Nr-NCBI, SWISS-PROT, COG and KEGG databases. In addition, unigenes were aligned by Blastn to nucleotide databases nt (e-value ≤ 1e-5) to retrieve functional annotations based on proteins with the highest sequence similarity to the given unigenes. We used the ESTScan program to predict the CDS and orientation of the assembled transcripts. With nr-NCBI annotation, the Blast2GO program was used to classify unigenes to GO terms based on molecular function, biological processes and cellular components [57].
Validation of RNA-Seq by RT-qPCR
RT-qPCR was performed to verify the expression patterns revealed by the RNA-seq study. Total RNA extraction and generation of first-strand cDNA generation were performed according to the protocol used for the RNA-seq study mentioned above. Twelve unigenes were selected based on their possible functions and expression patterns in RNA-Seq. Primer sequences [see Additional file 7] were designed on exon-exon boundaries using the online primer software package primer-BLAST in NCBI. RT-qPCR was performed in an ABI 7500 FAST Real-Time PCR System using a protocol described in a previous study [20,53]. The amplicons were used for melting curve analysis to confirm the specificity of amplification. The detection threshold cycle for each reaction was normalized against the expressed level of the rice reference gene ACT1 (GenBank ID: AK100267) [58]. The relative expression level of each gene was calculated using the 2-(ΔΔCt) method with some modifications [59]: ΔΔCT = (CT, Target − CT, Actin) − (CCK, Target − CCK, Actin). CT, Target and CCK, Target indicate the ΔΔCT values of the target transcript from the treatment and control samples, respectively; CT, Actin and CCK, Actin indicate the ΔΔCT values of the reference gene ACT1 from the treatment and control samples, respectively. The mean expression values were calculated using the three technical replicate measurements of each target gene. Three biological replicates were performed for the RT-qPCR experiment.
Detection of differentially expressed transcripts between the heat-sensitive and the heat-tolerant rice
To identify the differentially expressed transcripts in the heat-sensitive and -tolerant lines responding to high night temperatures, we first identified the differentially expressed transcripts (DEGs) using Cufflinks (http://www.cbcb.umd.edu/software/cufflinks/). The unigene expression levels were normalized by the Fragments Per Kb per Million fragments (FPKM) values [32]. The threshold P-value ≤ 0.05 and FC log2 ≥ 1.0 were used to determine the significantly differentially expressed genes [35,36]. Second, the transcripts obtained by the above criteria were further analyzed for the Relative Fold Change (RFC) between the heat-sensitive vs. -tolerant lines with RFC ≥ 2.0. The RFC values were calculated using the following methods: if the transcript showed up- / down-regulation in both the heat-tolerant and -sensitive lines and the fold change in the heat-tolerant line was higher than in the heat-sensitive line, this indicated that the relative fold change in the heat-tolerant line was opposite to that in the heat-sensitive line, and the RFC was calculated using formula A. If the transcript showed up-/down-regulation in both the heat-tolerant and -sensitive lines and the fold change in the heat-tolerant line was lower than in the heat-sensitive line, this indicated that the relative fold change in up-/down-regulation in the heat-sensitive line was opposite to the heat-tolerant line, and the RFC was calculated using formula B. If the transcript showed up-/down-regulation in the heat-tolerant line but down-/up-regulation in heat-sensitive line, the relative up-/down-regulating fold change was similar between the heat-tolerant and -sensitive lines, and formula C was used to calculate RFC.
Formula A: RFC = (HT Log2 − HS Log2)/ HS Log2;
Formula B: RFC = (HS Log2 − HT Log2)/ HT Log2;
Formula C: RFC = (HS Log2 + HT Log2)/ 2.
HS Log2 and HT Log2 in the formulas indicate the logarithm of a 2-fold change in the heat-sensitive line and the heat-tolerant line, respectively.
Availability of supporting data
The raw reads produced by Illumina-sequencing method in this publication have been deposited in NCBI’s Gene Expression Omnibus (GEO) dataset and are accessible through GEO Series accession number SRP050315 [http://www.ncbi.nlm.nih.gov/Traces/study/?acc=SRP050315].
Acknowledgements
This research was financially supported by two grants from the National Natural Science Foundation of China (Grant no. 31260315 and Grant no.31160272) and the Major Scientific and Technological Special Project of Jiangxi Province (Grant no. 20114ABF03103).
Additional files
Influence on the grain plumpness of the heat-sensitive and heat-tolerant lines at high night temperatures.
Size distribution of the assembled transcripts.
The cluster results of the 2-fold change values for each differentially expressed transcript from the heat-sensitive and heat-tolerant lines.
RT-qPCR analysis of 12 transcripts selected from heat-tolerant and -sensitive rice lines under high night temperature stress.
The base sequences and FPKM values for the 35 differentially expressed transcripts.
The differentially expressed HTRTs without reference genes and/ or functional annotation.
The RT-qPCR primers for the 12 selected unigenes.
Footnotes
Competing interests
The authors declare that they have no competing interests.
Authors’ contributions
JLL designed the study, analyzed the data and drafted the manuscript; HWZ and QP carried out the RNA extraction and RT-qPCR, PAZ and HYZ carried out the construction of the libraries, CH carried out the rice culture and temperature treatments, YJH facilitated in the design of the study and assisted with manuscript preparation. All authors read and approved the final manuscript.
Contributor Information
Jiang-Lin Liao, Email: jlliao514815@163.com.
Hui-Wen Zhou, Email: zhouhuiwen0320@126.com.
Qi Peng, Email: pengq231@163.com.
Ping-An Zhong, Email: Zpa778210@163.com.
Hong-Yu Zhang, Email: jnzhanghy@126.com.
Chao He, Email: hechao7021@163.com.
Ying-Jin Huang, Email: yjhuang_cn@126.com.
References
- 1.Kim J, Shon J, Lee C, Yang W, Yoon Y, Yang W, et al. Relationship between grain filling duration and leaf senescence of temperate rice under high temperature. Field Crop Res. 2011;122(3):207–13. doi: 10.1016/j.fcr.2011.03.014. [DOI] [Google Scholar]
- 2.Takai T, Matsuura S, Nishio T, Ohsumi A, Shiraiwa T, Horie T. Rice yield potential is closely related to crop growth rate during late reproductive period. Field Crop Res. 2006;96(2):328–35. doi: 10.1016/j.fcr.2005.08.001. [DOI] [Google Scholar]
- 3.Wheeler TR, Hong TD, Ellis RH, Batts GR, Morison J, Hadley P. The duration and rate of grain growth, and harvest index, of wheat (Triticum aestivum L.) in response to temperature and CO2. J Exp Bot. 1996;47(5):623–30. doi: 10.1093/jxb/47.5.623. [DOI] [Google Scholar]
- 4.Liu P, Guo W, Jiang Z, Pu H, Feng C, Zhu X, et al. Effects of high temperature after anthesis on starch granules in grains of wheat (Triticum aestivum L.) J Agric Sci. 2011;149(2):159–69. doi: 10.1017/S0021859610001024. [DOI] [PMC free article] [PubMed] [Google Scholar]
- 5.Morita S, Yonemaru J, Takanashi J. Grain growth and endosperm cell size under high night temperatures in rice (Oryza sativa L.) Ann Bot. 2005;95(4):695–701. doi: 10.1093/aob/mci071. [DOI] [PMC free article] [PubMed] [Google Scholar]
- 6.Li H, Chen Z, Hu M, Wang Z, Hua H, Yin C, et al. Different effects of night versus day high temperature on rice quality and accumulation profiling of rice grain proteins during grain filling. Plant Cell Rep. 2011;30(9):1641–59. doi: 10.1007/s00299-011-1074-2. [DOI] [PubMed] [Google Scholar]
- 7.Peng S, Huang J, Sheehy JE, Laza RC, Visperas RM, Zhong X, et al. Rice yields decline with higher night temperature from global warming. Proc Natl Acad Sci U S A. 2004;101(27):9971–5. doi: 10.1073/pnas.0403720101. [DOI] [PMC free article] [PubMed] [Google Scholar]
- 8.Madan P, Jagadish SV, Craufurd PQ, Fitzgerald M, Lafarge T, Wheeler TR. Effect of elevated CO2 and high temperature on seed-set and grain quality of rice. J Exp Bot. 2012;63(10):3843–52. doi: 10.1093/jxb/ers077. [DOI] [PMC free article] [PubMed] [Google Scholar]
- 9.Lü G, Wu Y, Bai W, Ma B, Wang C, Song J. Influence of high temperature stress on net photosynthesis, dry matter partitioning and rice grain yield at flowering and grain filling stages. J Integr Agric. 2013;12(4):603–9. doi: 10.1016/S2095-3119(13)60278-6. [DOI] [Google Scholar]
- 10.Zhang H, Duan L, Dai JS, Zhang CQ, Li J, Gu MH, et al. Major QTLs reduce the deleterious effects of high temperature on rice amylose content by increasing splicing efficiency of Wx pre-mRNA. Theor Appl Genet. 2014;127(2):273–82. doi: 10.1007/s00122-013-2216-4. [DOI] [PubMed] [Google Scholar]
- 11.Jiang H, Dian W, Wu P. Effect of high temperature on fine structure of amylopectin in rice endosperm by reducing the activity of the starch branching enzyme. Phytochemistry. 2003;63(1):53–9. doi: 10.1016/S0031-9422(03)00005-0. [DOI] [PubMed] [Google Scholar]
- 12.Lin CJ, Li CY, Lin SK, Yang FH, Huang JJ, Liu YH, et al. Influence of high temperature during grain filling on the accumulation of storage proteins and grain quality in rice (Oryza sativa L.) J Agric Food Chem. 2010;58(19):10545–52. doi: 10.1021/jf101575j. [DOI] [PubMed] [Google Scholar]
- 13.Hakata M, Kuroda M, Miyashita T, Yamaguchi T, Kojima M, Sakakibara H, et al. Suppression of alpha-amylase genes improves quality of rice grain ripened under high temperature. Plant Biotechnol J. 2012;10(9):1110–7. doi: 10.1111/j.1467-7652.2012.00741.x. [DOI] [PubMed] [Google Scholar]
- 14.Larkin PD, Park WD. Transcript accumulation and utilization of alternate and non-consensus splice sites in rice granule-bound starch synthase are temperature-sensitive and controlled by a single-nucleotide polymorphism. Plant Mol Biol. 1999;40(4):719–27. doi: 10.1023/A:1006298608408. [DOI] [PubMed] [Google Scholar]
- 15.Yamakawa H, Hirose T, Kuroda M, Yamaguchi T. Comprehensive expression profiling of rice grain filling-related genes under high temperature using DNA microarray. Plant Physiol. 2007;144(1):258–77. doi: 10.1104/pp.107.098665. [DOI] [PMC free article] [PubMed] [Google Scholar]
- 16.Brown RC, Lemmon BE, Olsen O. Development of the endosperm in rice (Oryza sativa L.): Cellularization. J Plant Res. 1996;109(3):301–13. doi: 10.1007/BF02344477. [DOI] [Google Scholar]
- 17.Hong SK, Aoki T, Kitano H, Satoh H, Nagato Y. Temperature-sensitive mutation, embryoless 1, affects both embryo and endosperm development in rice. Plant Sci. 1995;108(2):165–72. doi: 10.1016/0168-9452(95)04128-H. [DOI] [Google Scholar]
- 18.Ashida K, Araki E, Maruyama-Funatsuki W, Fujimoto H, Ikegami M. Temperature during grain ripening affects the ratio of type-II/type-I protein body and starch pasting properties of rice (Oryza sativa L.) J Cereal Sci. 2013;57(1):153–9. doi: 10.1016/j.jcs.2012.10.006. [DOI] [Google Scholar]
- 19.Cheng F, Zhong L, Zhao N, Liu Y, Zhang G. Temperature induced changes in the starch components and biosynthetic enzymes of two rice varieties. Plant Growth Regul. 2005;46(1):87–95. doi: 10.1007/s10725-005-7361-6. [DOI] [Google Scholar]
- 20.Liao JL, Zhou HW, Zhang HY, Zhong PA, Huang YJ. Comparative proteomic analysis of differentially expressed proteins in the early milky stage of rice grains during high temperature stress. J Exp Bot. 2014;65(2):655–71. doi: 10.1093/jxb/ert435. [DOI] [PMC free article] [PubMed] [Google Scholar]
- 21.Cao Y, Duan H, Yang L, Wang Z, Liu L, Yang J. Effect of high temperature during heading and early filling on grain yield and physiological characteristics in indica rice. Acta Agron Sin. 2009;35(3):512–21. doi: 10.3724/SP.J.1006.2009.00512. [DOI] [Google Scholar]
- 22.Fu G, Song J, Xiong J, Liao X, Zhang X, Wang X, et al. Thermal resistance of common rice maintainer and restorer lines to high temperature during flowering and early grain filling stages. Rice Sci. 2012;19(4):309–14. doi: 10.1016/S1672-6308(12)60055-9. [DOI] [Google Scholar]
- 23.Ozsolak F, Milos PM. RNA sequencing: advances, challenges and opportunities. Nat Rev Genet. 2011;12(2):87–98. doi: 10.1038/nrg2934. [DOI] [PMC free article] [PubMed] [Google Scholar]
- 24.Wang Z, Gerstein M, Snyder M. RNA-Seq: a revolutionary tool for transcriptomics. Nat Rev Genet. 2009;10(1):57–63. doi: 10.1038/nrg2484. [DOI] [PMC free article] [PubMed] [Google Scholar]
- 25.Takahashi H, Lassmann T, Murata M, Carninci P. 5′ end-centered expression profiling using cap-analysis gene expression and next-generation sequencing. Nat Protoc. 2012;7(3):542–61. doi: 10.1038/nprot.2012.005. [DOI] [PMC free article] [PubMed] [Google Scholar]
- 26.Alamancos GP, Agirre E, Eyras E. Methods to study splicing from high-throughput RNA sequencing data. Methods Mol Biol. 2014;1126:357–97. doi: 10.1007/978-1-62703-980-2_26. [DOI] [PubMed] [Google Scholar]
- 27.Kodzius R, Kojima M, Nishiyori H, Nakamura M, Fukuda S, Tagami M, et al. CAGE: cap analysis of gene expression. Nat Methods. 2006;3(3):211–22. doi: 10.1038/nmeth0306-211. [DOI] [PubMed] [Google Scholar]
- 28.Kurosawa J, Nishiyori H, Hayashizaki Y. Deep cap analysis of gene expression. Methods Mol Biol. 2011;687:147–63. doi: 10.1007/978-1-60761-944-4_10. [DOI] [PubMed] [Google Scholar]
- 29.‘t Hoen PA, Friedlander MR, Almlof J, Sammeth M, Pulyakhina I, Anvar SY, et al. Reproducibility of high-throughput mRNA and small RNA sequencing across laboratories. Nat Biotechnol. 2013;31(11):1015–22. doi: 10.1038/nbt.2702. [DOI] [PubMed] [Google Scholar]
- 30.Nagai T, Makino A. Differences between rice and wheat in temperature responses of photosynthesis and plant growth. Plant Cell Physiol. 2009;50(4):744–55. doi: 10.1093/pcp/pcp029. [DOI] [PMC free article] [PubMed] [Google Scholar]
- 31.Trapnell C, Pachter L, Salzberg SL. TopHat: discovering splice junctions with RNA-Seq. Bioinformatics. 2009;25(9):1105–11. doi: 10.1093/bioinformatics/btp120. [DOI] [PMC free article] [PubMed] [Google Scholar]
- 32.Trapnell C, Williams BA, Pertea G, Mortazavi A, Kwan G, van Baren MJ, et al. Transcript assembly and quantification by RNA-Seq reveals unannotated transcripts and isoform switching during cell differentiation. Nat Biotechnol. 2010;28(5):511–5. doi: 10.1038/nbt.1621. [DOI] [PMC free article] [PubMed] [Google Scholar]
- 33.Pradervand S, Weber J, Lemoine F, Consales F, Paillusson A, Dupasquier M, et al. Concordance among digital gene expression, microarrays, and qPCR when measuring differential expression of microRNAs. Biotechniques. 2010;48(3):219–22. doi: 10.2144/000113367. [DOI] [PubMed] [Google Scholar]
- 34.Bloom JS, Khan Z, Kruglyak L, Singh M, Caudy AA. Measuring differential gene expression by short read sequencing: quantitative comparison to 2-channel gene expression microarrays. BMC Genomics. 2009;10:221. doi: 10.1186/1471-2164-10-221. [DOI] [PMC free article] [PubMed] [Google Scholar]
- 35.Lenka SK, Katiyar A, Chinnusamy V, Bansal KC. Comparative analysis of drought-responsive transcriptome in Indica rice genotypes with contrasting drought tolerance. Plant Biotechnol J. 2011;9(3):315–27. doi: 10.1111/j.1467-7652.2010.00560.x. [DOI] [PubMed] [Google Scholar]
- 36.Ma TL, Wu WH, Wang Y. Transcriptome analysis of rice root responses to potassium deficiency. BMC Plant Biol. 2012;12:161. doi: 10.1186/1471-2229-12-161. [DOI] [PMC free article] [PubMed] [Google Scholar]
- 37.Pandey AV, Fluck CE. NADPH P450 oxidoreductase: structure, function, and pathology of diseases. Pharmacol Ther. 2013;138(2):229–54. doi: 10.1016/j.pharmthera.2013.01.010. [DOI] [PubMed] [Google Scholar]
- 38.Iyanagi T, Xia C, Kim JJ. NADPH-cytochrome P450 oxidoreductase: prototypic member of the diflavin reductase family. Arch Biochem Biophys. 2012;528(1):72–89. doi: 10.1016/j.abb.2012.09.002. [DOI] [PMC free article] [PubMed] [Google Scholar]
- 39.Jiang WB, Huang HY, Hu YW, Zhu SW, Wang ZY, Lin WH. Brassinosteroid regulates seed size and shape in Arabidopsis. Plant Physiol. 2013;162(4):1965–77. doi: 10.1104/pp.113.217703. [DOI] [PMC free article] [PubMed] [Google Scholar]
- 40.Sotelo-Silveira M, Cucinotta M, Chauvin AL, Chavez MR, Colombo L, Marsch-Martinez N, et al. Cytochrome P450 CYP78A9 is involved in Arabidopsis reproductive development. Plant Physiol. 2013;162(2):779–99. doi: 10.1104/pp.113.218214. [DOI] [PMC free article] [PubMed] [Google Scholar]
- 41.Adamski NM, Anastasiou E, Eriksson S, O’Neill CM, Lenhard M. Local maternal control of seed size by KLUH/CYP78A5-dependent growth signaling. Proc Natl Acad Sci U S A. 2009;106(47):20115–20. doi: 10.1073/pnas.0907024106. [DOI] [PMC free article] [PubMed] [Google Scholar]
- 42.Wootton JC, Nicolson RE, Cock JM, Walters DE, Burke JF, Doyle WA, et al. Enzymes depending on the pterin molybdenum cofactor: sequence families, spectroscopic properties of molybdenum and possible cofactor-binding domains. Biochim Biophys Acta. 1991;1057(2):157–85. doi: 10.1016/S0005-2728(05)80100-8. [DOI] [PubMed] [Google Scholar]
- 43.Li Q, Ritzel RG, McLean LL, McIntosh L, Ko T, Bertrand H, et al. Cloning and analysis of the alternative oxidase gene of Neurospora crassa. Genetics. 1996;142(1):129–40. doi: 10.1093/genetics/142.1.129. [DOI] [PMC free article] [PubMed] [Google Scholar]
- 44.Li L, Ye H, Guo H, Yin Y. Arabidopsis IWS1 interacts with transcription factor BES1 and is involved in plant steroid hormone brassinosteroid regulated gene expression. Proc Natl Acad Sci U S A. 2010;107(8):3918–23. doi: 10.1073/pnas.0909198107. [DOI] [PMC free article] [PubMed] [Google Scholar]
- 45.Zhang C, Bai MY, Chong K. Brassinosteroid-mediated regulation of agronomic traits in rice. Plant Cell Rep. 2014;33(5):683–96. doi: 10.1007/s00299-014-1578-7. [DOI] [PMC free article] [PubMed] [Google Scholar]
- 46.Forlani G, Bertazzini M, Giberti S. Differential accumulation of gamma-aminobutyric acid in elicited cells of two rice cultivars showing contrasting sensitivity to the blast pathogen. Plant Biol (Stuttg) 2014;16(6):1127–32. doi: 10.1111/plb.12165. [DOI] [PubMed] [Google Scholar]
- 47.Renault H, El AA, Berger A, Mouille G, Soubigou-Taconnat L, Bouchereau A, et al. gamma-Aminobutyric acid transaminase deficiency impairs central carbon metabolism and leads to cell wall defects during salt stress in Arabidopsis roots. Plant Cell Environ. 2013;36(5):1009–18. doi: 10.1111/pce.12033. [DOI] [PubMed] [Google Scholar]
- 48.Renault H, Roussel V, El AA, Arzel M, Renault D, Bouchereau A, et al. The arabidopsis pop2-1 mutant reveals the involvement of GABA transaminase in salt stress tolerance. BMC Plant Biol. 2010;10:20. doi: 10.1186/1471-2229-10-20. [DOI] [PMC free article] [PubMed] [Google Scholar]
- 49.Huang J, Zhao X, Cheng K, Jiang Y, Ouyang Y, Xu C, et al. OsAP65, a rice aspartic protease, is essential for male fertility and plays a role in pollen germination and pollen tube growth. J Exp Bot. 2013;64(11):3351–60. doi: 10.1093/jxb/ert173. [DOI] [PMC free article] [PubMed] [Google Scholar]
- 50.Prasad BD, Creissen G, Lamb C, Chattoo BB. Heterologous expression and characterization of recombinant OsCDR1, a rice aspartic proteinase involved in disease resistance. Protein Expr Purif. 2010;72(2):169–74. doi: 10.1016/j.pep.2010.03.018. [DOI] [PubMed] [Google Scholar]
- 51.Yao X, Xiong W, Ye T, Wu Y. Overexpression of the aspartic protease ASPG1 gene confers drought avoidance in Arabidopsis. J Exp Bot. 2012;63(7):2579–93. doi: 10.1093/jxb/err433. [DOI] [PMC free article] [PubMed] [Google Scholar]
- 52.Wan S, Xia J, Liu W, Niu S. Photosynthetic overcompensation under nocturnal warming enhances grassland carbon sequestration. Ecology. 2009;90(10):2700–10. doi: 10.1890/08-2026.1. [DOI] [PubMed] [Google Scholar]
- 53.Munoz FJ, Baroja-Fernandez E, Moran-Zorzano MT, Alonso-Casajus N, Pozueta-Romero J. Cloning, expression and characterization of a Nudix hydrolase that catalyzes the hydrolytic breakdown of ADP-glucose linked to starch biosynthesis in Arabidopsis thaliana. Plant Cell Physiol. 2006;47(7):926–34. doi: 10.1093/pcp/pcj065. [DOI] [PubMed] [Google Scholar]
- 54.Liao JL, Zhang HY, Liu JB, Zhong PA, Huang YJ. Identification of candidate genes related to rice grain weight under high-temperature stress. Plant Sci. 2012;196:32–43. doi: 10.1016/j.plantsci.2012.07.013. [DOI] [PubMed] [Google Scholar]
- 55.Liao JL, Zhang HY, Shao XJ, Zhong PA, Huang YJ. Identification for heat tolerance in backcross recombinant lines and screening of backcross introgression lines with heat tolerance at milky stage in rice. Rice Sci. 2011;18(4):279–86. doi: 10.1016/S1672-6308(12)60006-7. [DOI] [Google Scholar]
- 56.Li B, Dewey CN. RSEM: accurate transcript quantification from RNA-Seq data with or without a reference genome. BMC Bioinformatics. 2011;12:323. doi: 10.1186/1471-2105-12-323. [DOI] [PMC free article] [PubMed] [Google Scholar]
- 57.Conesa A, Gotz S, Garcia-Gomez JM, Terol J, Talon M, Robles M. Blast2GO: a universal tool for annotation, visualization and analysis in functional genomics research. Bioinformatics. 2005;21(18):3674–6. doi: 10.1093/bioinformatics/bti610. [DOI] [PubMed] [Google Scholar]
- 58.Li QF, Sun SSM, Yuan DY, Yu HX, Gu MH, Liu QQ. Validation of candidate reference genes for the accurate normalization of real-time quantitative RT-PCR data in rice during seed development. Plant Mol Biol Rep. 2010;28(1):49–57. doi: 10.1007/s11105-009-0124-1. [DOI] [Google Scholar]
- 59.Livak KJ, Schmittgen TD. Analysis of relative gene expression data using real-time quantitative PCR and the 2-ΔΔCt method. Methods. 2001;25(4):402–8. doi: 10.1006/meth.2001.1262. [DOI] [PubMed] [Google Scholar]