

Abstract
Ample evidence supports genetic and functional heterogeneity in primary tumors, but it remains unclear whether circulating tumor cells (CTCs) also exhibit the same hierarchical organization. We examined the functional diversity of viable, single CTCs using an array of subnanoliter wells (nanowells). The compartmentalization of single cells by nanowells allowed clonal comparison and mapping of heterogeneity of single cells or preformed clusters of cells. By measuring the short-term viability, invasiveness and secretory profiles of individual CTCs, it was evident that only a rare subset of CTCs possessed malignant traits indicative of metastatic potential in late-stage, progressing metastatic castration-resistant prostate cancer (mCRPC) patients. These CTCs were resistant to anoikis after being in the circulation, were invasive in their epithelial state, or secreted proteases capable of cleaving peptide substrates. Every CTC observed, however, did not exhibit such metastatic potential, suggesting that enumeration of CTCs alone may be insufficient to understand metastasis or stratify patients.
Introduction
Circulating tumor cells (CTCs) mobilize from primary tumors or metastases and transit through the bloodstream. They are of fundamental interest because a subpopulation of CTCs may initiate metastasis and mediate the hematogenous dissemination of cancer.1 The recent successful engraftment of CTCs in xenograft models provided convincing evidence that metastasis-initiating cells exist amongst CTCs.2,3 Because these assays used pooled CTCs, however, it remains unclear if every CTC contributes equally to tumor formation, or if a founder population possesses enhanced tumorigenic potential and gives rise to metastatic colonies.4 Identifying the cells, or a subpopulation of cells, most capable of establishing overt metastasis may be one key to designing effective therapies, especially if such cells are rare and can evade conventional chemotherapies5 and remain dormant for a number of years in the form of minimal residual disease.4
To adequately resolve the fine variance within a population of CTCs, it is important to both isolate rare CTCs and interrogate each CTC individually, preferably in a high-throughput fashion. Current assays, however, either require pooled CTCs,2,3 obscuring any heterogeneous differences in cellular behaviors among cells, or fail to preserve cell viability. Existing single-cell assays are mainly confined to enumeration,6 intracellular staining,7 geno-typing,8 and gene expression.9 Because these assays require fixation or lysis, it has not been possible to evaluate several important characteristics of live CTCs, including their viability over time and their propensity to invade or secrete soluble factors. These functional phenotypes could provide potentially useful indictors of the metastatic potential of tumor cells. 10–12
Here we developed a process using arrays of subnanoliter wells (nanowells)13 to isolate and characterize single, viable CTCs from whole blood, thereby exploring the functional diversity amongst CTCs. This approach enabled us to perform spatiotemporal tracking of CTCs and identify a rare subset of CTCs that exhibited malignant traits indicative of metastatic potential.
Materials and methods
Patient recruitment
The patient cohort used in this study was generated from the Prostate Clinical Research Information System (CRIS) at the Dana-Farber Cancer Institute. The CRIS system consists of data-entry software, a central data repository, collection of patient data including comprehensive follow-up of all patients, and tightly integrated security measures as previously described.14 All patients provided written informed consent to allow the collection of tissue and blood and the analysis of clinical and genetic data for research purposes. Patients with metastatic castration-resistant prostate cancer were identified for this trial based on (1) progression on a phase II study of abiraterone in combination with dutasteride or (2) Prostate-specific Antigen (PSA) > 20 ng ml−1 to enrich for patients likely to have detectable CTCs. Patient status was assigned by changes in serum PSA levels, with progression at the time of blood collection defined as a PSA increase of > 5% per 30 days. Refer to Table S1 (ESI†) for patient information. Blood was drawn into EDTA tubes and processed within 4 h. Whole blood from healthy donors was purchased from Research Blood Components.
Fabrication of arrays of nanowells
A silicon master15 was microfabricated (Stanford foundry) and mounted in a metal mold. Poly(dimethylsiloxane) (PDMS) (Dow Corning) (10:1 ratio of base to catalyst) was injected through a port into the silicon mold, cured at 80 °C for 4 h, and then removed to produce an array containing 84 672 cubic wells (65 μm). Before use, the PDMS array was oxygen plasma treated for 2 min and immediately submerged in PBS to preserve the hydrophilicity rendered by the plasma treatment. The array was then blocked in serum-containing media for 15 min before cells were loaded.
Enrichment of CTCs
Negative selection was performed using either the EasySep or RosetteSep CD45 depletion kit (StemCell Technologies). With the EasySep kit, 45 ml of red blood cell lysis buffer (Biolegend) was added to 5 ml of whole blood and the mixture was incubated at room temperature until the red blood cells were completely lysed (15–20 min). Blood was washed once with wash buffer (2% Fetal Bovine Serum (FBS), 1% Bovine Serum Antigen (BSA), 5 mM ethylenediaminetetraacetic acid (EDTA) in Phosphate Buffered Saline (PBS)). CD45 depletion was performed with the EasySep human CD45 depletion kit according to the manufacturer's instructions. The remaining cells were suspended in approximately 200 μl wash buffer and were directly deposited onto the PDMS nanowells and allowed to settle for 5 min. With the RosetteSep kit, 250 μl antibody cocktail was incubated with 5 ml of whole blood for 20 min. The blood was then diluted with PBS at a 1:1 ratio and layered onto Ficoll-Paque Plus (GE Healthcare) in a SepMate tube (StemCell Technologies) and centrifuged at 800 × g for 10 min. The upper layer containing the serum and buffy coat was removed and washed twice. Further red blood cell lysis was sometimes necessary to remove residual red blood cells.
Staining and microscopy
Cells were either stained directly on the array of nanowells in a tube for 1 h at room temperature with EpCAM and a cocktail of lineage markers for leukocytes including CD3, CD16, CD20, CD38 and CD45 (refer to the list of antibodies used in Table S2, ESI†). For viability assays, the cells were rinsed with PBS and stained with Calcein AM violet (Molecular Probes) and Annexin V FITC (BD Pharmingen) in Annexin V binding buffer (BD Pharmingen) for 10 min at room temperature.
The stamps were imaged with an epifluorescence microscope (Zeiss) with filter wheels at the following wavelengths: Calcein AM violet (Ex: 390 nm, Em: 440/40 nm), FITC (Ex: 488 nm, Em: 525/36 nm), PerCP-eFluor710 (Ex: 488 nm, Em: 716/40 nm), PE/CY7 (Ex: 570 nm, Em: 809/81 nm).
Compensation was performed with beads that were precoated with anti-Fc antibodies (Bangs Laboratories). Each antibody was incubated with the beads and imaged in all the fluorescent channels. The percentage of bleed over was computed by plotting the fluorescence intensity of the signal channel versus the intensity of all other channels individually. The slope of the linear plot gave the percentage bleed over of the signal channel into the second channel.
Cells were identified with Enumerator, a custom image analysis software developed in house. For each nanowell array, we generated a list of cell information including the well IDs, cell size and fluorescent intensities. The text file was converted into a FlowJo-readable text format.16 Gating and cell statistics were analyzed in Flowjo (Treestar).
Proliferation assay
CTCs were cultured directly in the nanowells. C4-2 cells were authenticated using Short Tandem Repeat (STR) analysis (Promega and ATCC). Matrigel (1 ml; BD Biosciences) was added directly onto the nanowells and allowed to solidify for 1 h at room temperature. Cells were maintained in a growth medium that was previously reported to enhance the proliferation of epithelial cells.17 The growth medium consisted of 3:1 Ham's F-12 Nutrient Mixture-Dulbecco's modified Eagle's medium (Cellgro), 5% FBS (Sigma-Aldrich), 0.4 μg ml−1 hydrocortisone (Sigma-Aldrich), insulin (5 μg ml−1) -transferrin (5 μg ml−1) - sodium selenite (5 ng ml−1) supplement (Roche), 8.4 ng ml−1 cholera toxin (Sigma-Aldrich), 100 U ml−1 Penicillin-Streptomycin (Cellgro), 10 ng ml−1 epidermal growth factor (Life Technologies), 24 μg ml−1 adenine (Sigma-Aldrich), 10 μM Y-27632 (Enzo Life Sciences) and 1 pM 5α-Androstan-17β-ol-3-one (Sigma-Aldrich). In addition to the growth conditions described above, we applied a second culture condition that has previously been used to grow intestinal stem cells and primary prostate cancer cells.18 The growth medium consisted of 3:1 Ham's F-12 Nutrient Mixture-Dulbecco's modified Eagle's medium (Cellgro), 1× N2 supplements (Life Technologies), 1× B-27 supplements (Life Technologies), 1 mM N-acetylcysteine (Sigma-Aldrich), 1 μg ml−1 R-spondin (Life Technologies), 100 ng ml−1 Noggin (Life Technologies), 50 ng ml−1 epidermal growth factor (Life Technologies), 100 U ml−1 penicillin-streptomycin (Cellgro), 10 μM Rho-kinase (ROCK) inhibitor (Y-27632) (Enzo Life Sciences) and 1 pM 5α-Androstan-17β-ol-3-one (Sigma-Aldrich). There was, however, no significant difference in the percentage of CTC survival between the two culture conditions.
The cells were relabeled with antibodies against EpCAM, CD3, CD16, CD20, CD38 and CD45 and Calcein AM, and then imaged every three days. Viability was defined by positive Calcein AM and EpCAM staining as well as intact cell morphology in the bright field.
The predicted probability of the viability of a cluster was estimated based on the viability of a single cell. A cluster was considered viable if it contained at least one viable cell. The viabilities of clusters containing different numbers of cells were weighted by the frequencies of each cluster according to the following formula:
where N = total number of cells found in clusters, i = number of cells found in a cluster (ranging from 2 to imax), ni = number of clusters containing i cells and Psingle,viable = viability of single cells.
Invasion assay
After cell loading, 1 ml of Matrigel was pipetted directly onto the nanowell arrays and allowed to solidify for 1 h at room temperature. Cells embedded in Matrigel were stained with antibodies (1:200) for 2 h at 37 °C before imaging. The array was then imaged every three days. EpCAM+ cells were identified and tracked by their positive EpCAM staining. The coordinates of the centroid of the individual cells or cell clusters and of their wells were read in AxioVision (Zeiss). The relative coordinates of the cells to the wells were calculated as:
The distance that the cells had moved from their initial position was calculated as:
Microengraving
Microengraving was performed as previously described.19 Poly-lysine-coated glass slides were coated with 1 μg of capture antibody in 80 μl sodium borate buffer (pH 9) for 1 h at room temperature or 4 °C overnight and then blocked in PBS + 1% BSA for 30 min. The cell-loaded array of nanowells was rinsed with basal media containing 0.04% human serum. Human IgGs in the serum were used to mark the position of each well; every well should be positive for human IgG because anti-human IgG capture and detection antibodies were included in the panel of antibodies. The antibody-coated glass slide was then sealed on top of the nanowells in a hybridization clamp for 4 h at 37 °C. The slide was then blocked with 5% milk + 0.5% TWEEN-20 + PBS (blocking buffer) for 15 min and incubated with 0.3 μg fluorescently conjugated detection antibodies in 150 μl of blocking buffer for 45 min at room temperature. The dried slide was scanned with a GenePix 4400A scanner (Molecular Devices). The scanned image was analyzed with Matlab programs developed in house, Crossword and Matchbox. The IgG background channel was used to identify the position of each well. A positive event was defined as a well that (1) had 50% of its pixels 2 standard deviations above the mean intensity of the background and (2) 3 ≤ signal-to-noise ratio (SNR) ≤12. Each positive event was further manually inspected for potential artifacts.
The calibration curve for determining rates of secreted PSA was constructed by spotting 1 μl of diluted PSA detection antibody (1 μgμl−1) (5000 × to 10 000 000× dilution) on a poly-lysine slide. The slide was dried under vacuum for 5 min and then scanned using the same settings as the clinical samples. The median intensity was quantified using GenePix Pro 6.0 (Molecular Devices).
Proteolytic assay with Fluorescence Resonance Energy Transfer (FRET)-based peptides
Whole blood from a prostate cancer patient was first enriched for CTCs using the RosetteSep CD45 depletion kit. The cells were then loaded into the nanowells and stained with Calcein AM Violet, EpCAM and lineage antibody cocktail for 1 h. Next, 500 μl of 5 μM FRET polypeptides (BioZyme) mixture was added to the array of nanowells. A glass slide was sealed over the array using a hybridization clamp for 3 h in a humidifier chamber. The array of nanowells was then imaged with the microscope using the FITC channel (Ex: 488 nm, Em: 525/36 nm) for the FRET peptides. The peptides are substrates of Matrix Metalloproteinases (MMPs) 1, 2, 8, 9, 10, 12, 13 and 14 and A Disintegrin and Metalloproteinases (ADAMs) 8, 10, 17 as described previously.20 The sequences of the peptides are shown in Table S3 (ESI†).
After the initial time point, the arrays of nanowells containing CTCs were placed in the lower chamber of a 0.2 μm transwell petri dish (Corning). C4-2 cells (1 × 10⁴ cells, ATCC) and MG-63 cells (1 × 10⁶ cells, ATCC) were seeded on top of the transwell. The 0.2 μm transwell allowed secreted factors from C4-2 cells and MG-63 cells to diffuse to the CTCs in the lower chamber. The cells were maintained in growth medium as described in the proliferation assay for one week, at which point the proteolytic activity was measured again.
Results
Isolation of circulating tumor cells with arrays of subnanoliter wells
In order to resolve the variance between individual CTCs, we developed a system to characterize single cells in a high-throughput manner. Our PDMS array comprised 84 762 cubic wells of 275 pL each (65 μm × 65 μm × 65 μm). CTCs were enriched from whole blood by negative selection against CD45 and loaded onto the array to settle into the nanowells by limiting serial dilution (Fig. 1a). Because CTCs are rare, the loading biased the occupancy of each well to single CTCs or preformed clusters, allowing comparisons among individual CTCs.
Fig. 1.

Functional measurements of viability, invasion and secretory profiles of CTCs using arrays of nanowells. (a) Scheme for the enrichment and functional characterization of CTCs using nanowells for (1) viability, (2) invasion, or (3) secretion of soluble factors. (b) Scatter plot (left) is generated from on-chip imaging cytometry of 50 C4-2 cells spiked into 5 ml of whole blood. Image analysis software extracted the fluorescence intensities of all the cells on the array, and plotted as a scatter plot similar to that used in flow cytometry. A single cell can be mapped back to its original image (middle) or secretion event determined by microengraving (right) based on its unique well ID. (c) Efficiency of recovery of tumor cells from whole blood is about 30% using spiked HT29 and C4-2 cells.
To interrogate all the cells, we imaged the entire array and obtained the surface fluorescence and position of every cell using a custom-designed image processing software (on-chip cytometry). In addition to surface fluorescence, we were also interested in measuring the secretion of individual cells. We placed glass slides functionalized with capture antibodies in contact with the nanowells to capture soluble factors secreted by cells in the individual wells in a process called microengraving.13 Because the unique well ID retains the spatial information of each cell, we can visually inspect rare cells with their images, track the same cells over time and map secretion events back to the respective cells (Fig. 1b). Using this approach, we were able to make three types of measurements on viable CTCs isolated from patients with prostate cancer: (1) immediate and short-term viability of CTCs, (2) invasive potential of CTCs, and (3) secretion of soluble factors (Fig. 1a).
We validated the performance of our method using spiked tumor cell lines. We estimated the yield of our process to be 30% using C4-2 prostate tumor cells and HT29 colon tumor cells (Fig. 1c). The depletion of CD45+ cells was the dominant source of loss (Fig. S1, ESI†). The process maintained the viability of the isolated tumor cells (95% ± 10% for HT29 cells and 90% ± 7% for C4-2 cells). Therefore, viability of CTCs lower than 90% is a likely result of previous apoptotic events, rather than death induced from processing.
A subset of circulating tumor cells is viable upon isolation
Previously reported methods have not distinguished among viable and dead CTCs from blood samples. Therefore, we determined the viability of primary CTCs isolated from the blood of prostate cancer patients. We applied a combination of live (Calcein AM+) and apoptotic (Annexin V+) markers in addition to lineage markers (EpCAM+CD45−). The non-fluorescent Calcein AM is hydrolyzed to a fluorescent form by intracellular esterases in live cells, while Annexin V binds to phosphatidylserine on apoptotic cells. Using imaging cytometry, we analyzed CTCs isolated from the blood of prostate cancer patients and categorized them as either fully viable (Calcein AM+/Annexin V−), apoptotic (Calcein AM+/Annexin V+), dead (Calcein AM−/Annexin V+), or disintegrated (Calcein AM−/Annexin V−) (Fig. 2a).
Fig. 2.
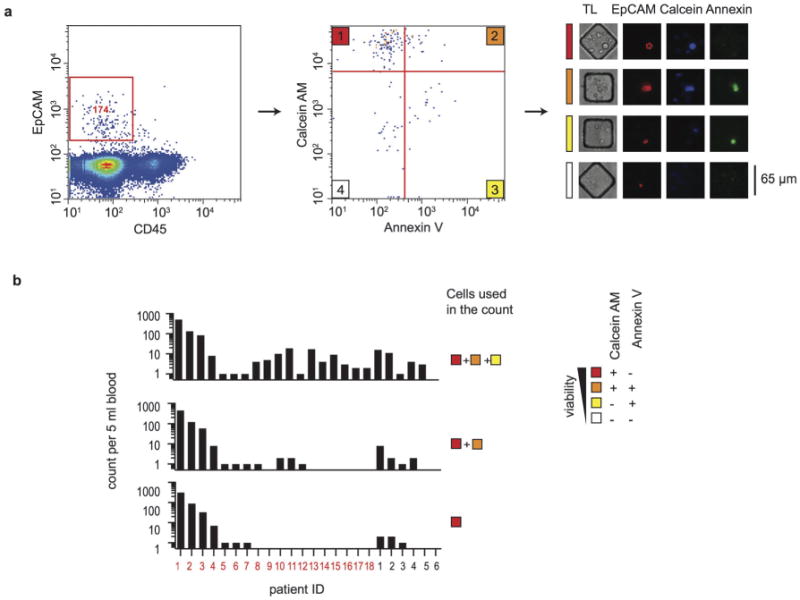
Viability of CTCs at the time of isolation. (a) Assessment of the viability of CTCs using measurements of apoptosis (Annexin V) and viability (Calcein AM) by on-chip cytometry. Gating of EpCAM+ cells (left) yields a population of EpCAM+CD45− cells that are scored for both Annexin V and Calcein AM (middle) to classify viable cells (1), apoptotic cells (2), dead cells (3) and disintegrated cells (4). Representative phase contrast and epifluorescence micrographs (right) are shown for each classified state. (b) Bargraphs of the number of CTCs classified by state of viability. The numbers of total intact EpCAM+ cells (top), Calcein AM+/EpCAM+ cells (middle) and Calcein AM+/AnnexinV−/EpCAM+ cells (bottom) are shown for 18 prostate cancer patients (red) and 6 healthy donors (black).
Our results showed that a significant proportion of CTCs were already dead after isolation. The range of viable CTCs observed in 18 prostate cancer patients was 0–314 cells per 5 ml of blood (mean = 25, median = 0) (Fig. 2b, bottom panel). Viable EpCAM+ cells were completely absent in 5 ml of blood of 60% of mCRPC patients. Since most CTC enumeration methods count the aggregate number of viable, apoptotic and dead cells (Fig. 2b, top panel), previous analyses may have overestimated the abundance of biologically active CTCs.
The majority of circulating tumor cells undergo rapid cell death
A subset of CTCs may represent “in transit” tumor cells with metastatic potential, but the rate-limiting step of metastasis is thought to be colonization at the distant site.21 We therefore sought to determine whether viable CTCs isolated from blood maintained their viability and/or possessed proliferative potential.
We tracked the viability (Fig. 3a) and the surface area (Fig. 3b) as a proxy for proliferation (cells in a cluster fused and could not be accurately counted after a week in culture) in 125 CTCs from patient ID2 and 48 spiked C4-2 prostate cancer cells for 16 days in Matrigel. Tracking was possible because CTCs maintained expression of EpCAM and other cell types started to die as early as day 4. Both the CTCs and C4-2 cells had clusters of cells and single cells. In the case of C4-2 cells, a subset of cells experienced substantial growth (Fig. 3b), forming colonies from single cells or clusters (Fig. 3c). In contrast, none of the primary CTCs exhibited sustained proliferation. Most surviving CTCs spread out after becoming adherent to the Matrigel but remained dormant throughout the 16 days of culture (Fig. 3b and c), suggesting that CTCs have a low in vitro clonogenic potential compared with prostate cancer cell lines. The absence of any proliferative cells might be a result of their low abundance or the inability of our in vitro system to mimic the important stromal factors found in vivo. We also cultured the CTCs using different conditions (see Methods) and with co-culture of fibroblasts, but none of these culture conditions resulted in proliferation.
Fig. 3.
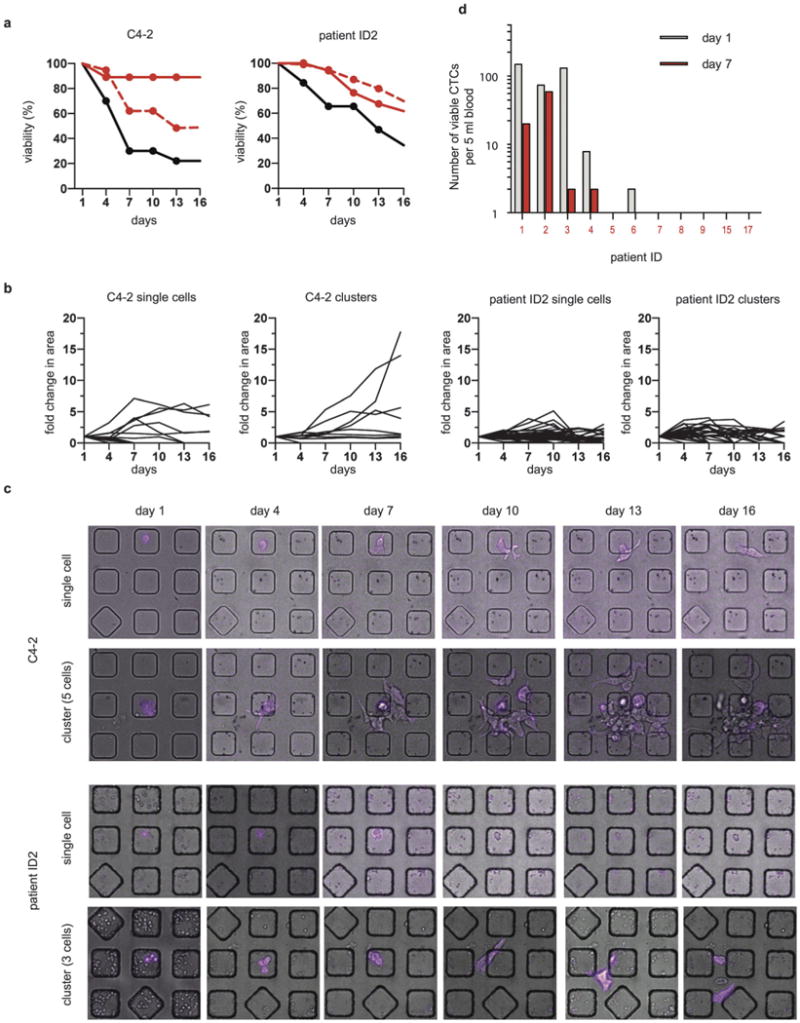
Short-term viability of CTCs is low compared to that of C4-2 cells. (a) Viability of single cells and clusters of cells. Left: viability of single C4-2 cells (black line, n = 34), clusters of C4-2 cells (red solid line, n = 32) and predicted viability of clusters of C4-2 cells (red dashed line). Right: viability of single CTCs (black line, n = 23), clusters of CTCs (red solid line, n = 9) and predicted viability of clusters of CTCs (red, dashed line) from patient ID2. (b) Fold changes in the surface area of single cells or clusters of C4-2 cells or CTCs from patient ID2 over 16 days. (c) Representative micrographs of the proliferation of a single C4-2 cell, a cluster of 5 C4-2 cells, a single CTC from patient ID2, and a cluster of 3 CTCs from patient ID2 in Matrigel cultured over 16 days. EpCAM staining is in magenta. (d) Bargraph of the number of viable CTCs as a function of time in culture. Only 4/10 patients had persistent viable CTCs after one week in Matrigel culture in the nanowells (red bar).
We observed that the overall viability of single cells declined at a faster rate than did cell clusters for both CTCs and C4-2 cells (Fig. 3a). We asked whether being in a cluster imparted enhanced survival to cells. Since we considered the entire cluster to be viable if at least one cell remained alive, we needed to correct for the higher number of cells found in a cluster (see Methods for formula). We compared the observed and predicted viability of clusters extrapolated from single cells (Fig. 3a) and found that clusters of CTCs did not show enhanced survival but clusters of C4-2 cells had an increased survival rate compared with single cells.
We cultured CTCs from 10 more patients in Matrigel in nano-wells for up to 7 days (Fig. 3d). Similar to that of patient ID2, most CTCs underwent cell death, but a small number of cells remained viable after a week of culture in Matrigel (Fig. 3d). We did not observe outgrowth of CTCs in samples without any starting viable CTCs (in case some CTCs could upregulate their EpCAM expression once becoming established in culture). The two patients (ID1 and ID2) with the highest number of persistent CTCs were deceased within six months of their blood draws. Therefore, it is possible that the presence of large numbers of persistent CTCs indicate an aggressive clinical disease and poor patient outcome. These persistent cells appeared resistant to anoikis after being in the circulation and thus may have the potential to colonize when growth conditions become favorable.
A subset of circulating tumor cells is invasive
In addition to clonogenic potential, the invasiveness of tumor cells also correlates with metastatic potential. When we cultured CTCs from patient ID2, we noticed that even though CTCs did not proliferate, they could invade through the Matrigel layer. Therefore, we quantified the invasiveness of individual CTCs from patients ID1 and ID2. Both patients had single cells and cell clusters in their blood samples (Fig. S2, ESI†), although clusters from patient ID1 comprised only doublets whereas clusters from patient ID2 ranged from two to nine cells.
Using each CTC's original well as a reference point, we monitored cell movement by recording the coordinates of the cells' centroids over time (Fig. 4a and Fig. S3, ESI†). Clusters from patient ID1 did not exhibit enhanced invasive behavior relative to single cells (Fig. 4b). On the other hand, cell clusters from patient ID2 exhibited a greater range of migration compared with single cells (Fig. 4b). Single cells and cell clusters of patient ID2 also differed significantly in their invasive behavior, ranging from no movement to over 100 μm in two weeks.
Fig. 4.

CTCs migrate and secrete PSA and proteolytic enzymes. (a) Micrographs (top) of an EpCAM+ cluster of CTCs isolated from patient ID2 (red) in Matrigel and the corresponding plot of the movement of the centroid of the cluster as a function of time (bottom). (b) Heat maps of the cumulative distance moved by the CTCs isolated from two patients. Each row represents a single cell or a cell cluster.
A subset of circulating tumor cells secretes PSA and proteolytic enzymes
One key advantage of the nanowells is the ability to use them to detect secreted factors from single cells with high sensitivity and specificity. We used microengraving (4 h) to detect the secretion of prostate specific antigen (PSA) from CTCs. While EpCAM staining can only ascribe the histological classification of a cell to be epithelial, secretion of a tissue-specific protein such as PSA can further reveal the origin of CTCs. Using a signal-to-noise ratio (SNR) of 3 to 12, we could distinguish spiked prostate cancer cells (C4-2 and LNCaP) from blood cells and HT29 colon tumor cells with 100% specificity (Fig. S4, ESI†). We sought to determine whether CTCs in the blood produce PSA. We detected secretion of PSA by CTCs from prostate cancer patients (Fig. 5a), but surprisingly, only from a very small subset of cells. For example, only 2/31 CTCs of patient ID3 secreted PSA above the threshold. Furthermore, the number of PSA-secreting events did not correlate with serum PSA levels. The rate of detectable PSA secretion by CTCs was low, ranging from 0.05–0.2 pg per hour per cell (Fig. S5, ESI†), implying that PSA secreted by CTCs is a negligible source of total serum PSA (typically in the ng ml−1 range). This result also suggests that CTCs make up only a small fraction of the total tumor burden in a patient if serum PSA correlates with tumor volume.22 We also used microengraving to measure five other secreted factors—MMP9, CXCL1, 5, 8 and VEGF, but we did not detect these factors from CTCs.
Fig. 5.

CTCs secrete PSA and proteolytic enzymes. (a) Scatter plot of the signal-to-noise ratio of secreted PSA measured by microengraving for 5 prostate cancer patients, 6 healthy donors and 2 prostate cancer cell lines. Each dot indicates one measured well. Micrographs of the secreted PSA (green) and control measure (human IgG; red) are shown for a subset of events. The red dashed line (SNR = 5) indicates the threshold set to discriminate between healthy donors and prostate cancer patients. Red arrows denote PSA positive events. (b) Histogram of the proteolytic activity of CTCs as measured by the cleavage of FRET-based polypeptide substrates immediately after isolation (gray) or after one week in culture (red). The micrograph shows one example of a positive signal (green) generated by an EpCAM+ cell (magenta) after 7 days.
In addition to directly measuring secreted PSA, we also measured the activity of enzymes secreted into the wells by observing the cleavage of their substrates. We incubated enriched CTCs with FRET-based polypeptide protease substrates20 (moderately specific for matrix metalloproteinases (MMPs) and A disintegrin and metalloproteinases (ADAMs)) in the nanowells. Only a small proportion of CTCs cleaved the substrates immediately after isolation (Fig. 5b). To mimic the paracrine interactions in the bone microenvironment since prostate cancer cells have a tendency to metastasize to the bone tissue, we cultured the CTCs with conditioned media from MG63 osteosarcoma cells and C4-2 prostate cancer cells. After a week in culture, two of the five surviving CTCs cleaved the peptides to a greater degree than did freshly isolated CTCs, resulting in an increase in the fluorescent signal within the well (Fig. 5b). These results indicate that CTCs can secrete proteolytic enzymes necessary to break down extracellular matrix.
Discussion
Heterogeneity among CTCs adds complexity to the understanding of cancer metastasis. We demonstrated that CTCs found in mCRPC patients exhibit functional heterogeneity in terms of viability, invasiveness and proteolytic activity, with as few as 2% of the total viable CTCs possessing malignant traits in progressing patients. For example, patient ID3 had 117 viable CTCs at the time of isolation but only 2/117 remained viable on day 7. In a separate experiment, only 2/86 CTCs of the same patient secreted proteolytic enzymes. The rarity of malignant CTCs agrees with two pieces of evidence supporting metastatic inefficiency. First, the low engraftment rate of CTCs in an immunocompromised mouse model, and the requirement for at least 103 CTCs to initiate tumor formation, suggest that metastatic initiating cells (MICs) comprise a rare fraction of total CTCs.2 Second, the discrepancy between the number of CTCs (0–23 618 cells per 7.5 ml of peripheral blood6) and the number of metastases (1–13 lesions per patient23) implies that the majority of the shed tumor cells are incapable of progressing to overt metastases.
One advantage of our nanowell-based platform relative to conventional flow cytometry is that each cell is documented with an optical image, allowing us to visually inspect the intactness, morphology, and spatial distributions of labeled proteins for each cell. This feature is important for verifying rare events when the number of false positives can be similar to that for true positives. Our platform can also be coupled with a robotic manipulator to recover single cells for genotyping.
Here we have provided two additional pieces of evidence to account for the low frequency of tumorigenic CTCs: (1) significant apoptosis during and after circulation and (2) dormancy of CTCs. By preserving the viability of isolated CTCs, we quantified the distribution of viable and dead cells. The relatively high percentage of apoptotic cells we saw agree with previous studies that detected a significant number of apoptotic CTCs by Terminal deoxynucleotidyl transferase dUTP nick end labeling (TUNEL) assay24 or caspase cleavage at cytokeratin 18.25,26 Because these previous studies used an intracellular marker, however, they could not directly quantify the presence of viable cells. Our data indicated that only 22% of the patients have ≥1 viable cells in 1 ml of blood after isolation. The majority of these surviving cells continued to undergo rapid cell death after leaving the circulation, and only a few cells could persist in Matrigel culture for over two weeks.
Secondly, we found that these viable CTCs are in a quiescent state. The observation that these CTCs are non-proliferative may seem surprising initially but corroborates an earlier study that failed to detect any Ki-67 staining in the CTCs of 47 breast cancer patients.27 A separate genetic analysis of CTCs also showed that compared with established cell lines, CTCs had a quiescent phenotype, with a decreased expression of growth factors such as VEGFA, MET, ESR1, EGFR, and HER2 and the cell cycle genes downstream of these growth factors including MYC, ATF3, TERT, RAC1, FOXA1, RRM1, CCNB1, and BIRC5.28 It is important to realize that the proliferative potential of CTCs found in patients differs significantly from that of cell lines. Conventional chemotherapy is ineffective in eliminating single dormant cells in the bone marrow of cancer patients29 because these dormant cells evade drugs that target proliferating cells. These dormant cells may have the potential to restart their proliferative program after a number of years as minimal residual disease.1 Accordingly, the presence of dormant disseminated tumor cells correlates with a worse prognosis and a higher rate of relapse.30-32
We demonstrated for the first time that clusters of CTCs could exhibit invasive phenotypic behaviors while retaining their expression of EpCAM, an epithelial marker. This collective cell invasion, in which multicellular units invade while maintaining their cell-cell junction molecules, was thought to be the predominate form of invasion in highly differentiated tumors such as epithelial prostate cancer.33,34 While experimental evidence has demonstrated the importance of epithelial-mesenchymal transition for cell invasion to occur, and has thus raised the question whether CTCs expressing EpCAM, an epithelial marker, can be invasive. This result suggests that the loss of epithelial markers is not a requirement for invasion to occur. Furthermore, consistent with our observation that the invasive CTCs were quiescent, an earlier study identified primary tumor cells in the invasive margin of ductal carcinoma to be invasive yet dormant. These cells were enriched for pro-migratory and anti-proliferative genes relative to intratumoral cells.35 An in vitro model using tumor cell lines encapsulated in 3D collagen matrices also demonstrated that tumor cells could be highly invasive and dormant, but knockdown of p27 could reverse this dormancy.35
In this study, we focused our efforts on examining EpCAM+ cells, but we did not exclude the possibility that EpCAM− cells exist and may equally constitute a major source of tumorigenic CTCs.3 We observed the presence of persistent EpCAM− cells even though they are rare. Together with additional markers, such as PMSA, we may further explore whether these cells are potentially prostate in origin.
In conclusion, interrogating the functional behavior of individual CTCs allowed us to demonstrate that CTCs from the same patient differ significantly in their viability, invasiveness and secretory profiles. We identified a rare subset among isolated CTCs with phenotypes consistent with more efficient metastasis in mCRPC patients. Cells in this subset can resist apoptosis, invasive, or they can secrete proteolytic enzymes. If and when these cells escape cell arrest, they may cause tumor recurrence. Therefore, therapy to target this subset of cells36 may be necessary to eliminate minimal residual disease. Future studies incorporating a sufficiently powered cohort of patients and new CTC markers (e.g., PSMA) could potentially provide further insights into how functional behavior of CTCs affects patient outcome. The functional assessment of individual CTCs was accomplished by our spatially-addressable array of nano-wells that allowed compartmentalization and spatiotemporal tracking of individual cells or clusters. The nanowell-based approach can be further expanded to retrieve the individual cells to investigate whether this functional diversity may arise from genetic or epigenetic factors, thus helping us to better understand cancer dissemination and design therapies to counter it.
Supplementary Material
Insight, innovation, integration.
Circulating tumor cells (CTCs) may mediate the hematogenous dissemination of cancer and initiate metastasis. Their paucity at 1 cell per ml blood, however, makes direct functional characterization challenging. We exploited spatially-addressable arrays of nanowells to measure short-term viability, invasiveness and secretory profiles of individual CTCs. We found that individual CTCs exhibit heterogeneous behavior, with only a rare subset of them being anoikis-resistant or invasive. This nanowell-based approach allowed compartmentalization and spatiotemporal tracking of individual cells or clusters, and thus enabled us to gain new insight into the largely dormant and selectively malignant population of CTCs.
Acknowledgments
J.C.L. is a Camille Dreyfus Teacher-Scholar. This work was supported by Janssen Pharmaceuticals. This work was also supported in part by the Koch Institute Support (core) Grant P30-CA14051 from the National Cancer Institute. X.Y. was supported by a fellowship from A*STAR, Singapore. A.D.C is supported by the Prostate Cancer Foundation Young Investigator Award and the DoD Physician Scientist Training Award. V.A.A. was supported in part by a graduate fellowship from the National Science Foundation. The authors dedicate this paper to the memory of Officer Sean Collier, for his caring service to the MIT coμmunity and for his sacrifice.
Footnotes
Electronic supplementary information (ESI) available. See DOI: 10.1039/c3ib40264a
Conflicts of interest: The authors declare no conflicts of interest.
Author contributions: X.Y., A.D.C., Y.J.Y., K.D.W. and J.C.L. conceived the experiments. X.Y., Y.J.Y., V.A.A., and T.M.G. developed and performed nanowell-based assays, and analyzed single-cell data. A.D.C., C.A.W., C.R.L., M.T., M.N., G.M.L., T.L., M.S.C., J.S.B. and P.W.K., wrote the IRB protocol, recruited patients and provided clinical specimens. X.Y., K.D.W., and J.C.L. wrote the manuscript.
References
- 1.Pantel K, Alix-Panabieres C, Riethdorf S. Cancer micrometastases. Nat Rev Clin Oncol. 2009;6:339–351. doi: 10.1038/nrclinonc.2009.44. [DOI] [PubMed] [Google Scholar]
- 2.Baccelli I, Schneeweiss A, Riethdorf S, Stenzinger A, Schillert A, Vogel V, et al. Identification of a population of blood circulating tumor cells from breast cancer patients that initiates metastasis in a xenograft assay. Nat Biotechnol. 2013;31:539–544. doi: 10.1038/nbt.2576. [DOI] [PubMed] [Google Scholar]
- 3.Zhang LX, Ridgway LD, Wetzel MD, Ngo J, Yin W, Kumar D, et al. The Identification and Characterization of Breast Cancer CTCs Competent for Brain Metastasis. Sci Transl Med. 2013;5:180ra48. doi: 10.1126/scitranslmed.3005109. [DOI] [PMC free article] [PubMed] [Google Scholar]
- 4.Pantel K, Brakenhoff RH, Brandt B. Detection, clinical relevance and specific biological properties of disseminating tumour cells. Nat Rev Cancer. 2008;8:329–340. doi: 10.1038/nrc2375. [DOI] [PubMed] [Google Scholar]
- 5.Muller V, Stahmann N, Riethdorf S, Rau T, Zabel T, Goetz A, et al. Circulating tumor cells in breast cancer: correlation to bone marrow micrometastases, heterogeneous response to systemic therapy and low proliferative activity. Clin Cancer Res. 2005;11:3678–3685. doi: 10.1158/1078-0432.CCR-04-2469. [DOI] [PubMed] [Google Scholar]
- 6.Allard WJ, Matera J, Miller MC, Repollet M, Connelly MC, Rao C, et al. Tumor cells circulate in the peripheral blood of all major carcinomas but not in healthy subjects or patients with nonmalignant diseases. Clin Cancer Res. 2004;10:6897–6904. doi: 10.1158/1078-0432.CCR-04-0378. [DOI] [PubMed] [Google Scholar]
- 7.Stott SL, Lee RJ, Nagrath S, Yu M, Miyamoto DT, Ulkus L, et al. Isolation and Characterization of Circulating Tumor Cells from Patients with Localized and Metastatic Prostate Cancer. Sci Transl Med. 2010;2:25ra23. doi: 10.1126/scitranslmed.3000403. [DOI] [PMC free article] [PubMed] [Google Scholar]
- 8.Maheswaran S, Sequist LV, Nagrath S, Ulkus L, Brannigan B, Collura CV, et al. Detection of mutations in EGFR in circulating lung-cancer cells. N Engl J Med. 2008;359:366–377. doi: 10.1056/NEJMoa0800668. [DOI] [PMC free article] [PubMed] [Google Scholar]
- 9.Ramskold D, Luo SJ, Wang YC, Li R, Deng QL, Faridani OR, et al. Full-length mRNA-Seq from single-cell levels of RNA and individual circulating tumor cells. Nat Biotechnol. 2012;30:777–782. doi: 10.1038/nbt.2282. [DOI] [PMC free article] [PubMed] [Google Scholar]
- 10.Li L. Correlation of Growth Capacity of Human Tumor Cells in Hard Agarose With Their In Vivo Proliferative Capacity at Specific Metastatic Sites. J Natl Cancer Inst. 1989;81:1406–1412. doi: 10.1093/jnci/81.18.1406. [DOI] [PubMed] [Google Scholar]
- 11.Inoue K, Slaton JW, Eve BY, Kim SJ, Perrotte P, Balbay MD, et al. Interleukin 8 expression regulates tumorigenicity and metastases in androgen-independent prostate cancer. Clin Cancer Res. 2000;6:2104–2119. [PubMed] [Google Scholar]
- 12.Repesh LA. A new in vitro assay for quantitating tumor cell invasion. Invasion Metastasis. 1989;9:192–208. [PubMed] [Google Scholar]
- 13.Love JC, Ronan JL, Grotenbreg GM, van der Veen AG, Ploegh HL. A microengraving method for rapid selection of single cells producing antigen-specific antibodies. Nat Biotechnol. 2006;24:703–707. doi: 10.1038/nbt1210. [DOI] [PubMed] [Google Scholar]
- 14.Oh WK, Hayes J, Evan C, Manola J, George DJ, Waldron H, et al. Development of an integrated prostate cancer research information system. Clin Genitourin Cancer. 2006;5:61–66. doi: 10.3816/CGC.2006.n.019. [DOI] [PubMed] [Google Scholar]
- 15.Ogunniyi AO, Story CM, Papa E, Guillen E, Love JC. Screening individual hybridomas by microengraving to discover monoclonal antibodies. Nat Protoc. 2009;4:767–782. doi: 10.1038/nprot.2009.40. [DOI] [PMC free article] [PubMed] [Google Scholar]
- 16.Simm M. http://flowjo.typepad.com/the_daily_dongle/2006/06/how_to_roll_you.html.
- 17.Liu XF, Ory V, Chapman S, Yuan H, Albanese C, Kallakury B, et al. ROCK Inhibitor and Feeder Cells Induce the Conditional Reprogramming of Epithelial Cells. Am J Pathol. 2012;180:599–607. doi: 10.1016/j.ajpath.2011.10.036. [DOI] [PMC free article] [PubMed] [Google Scholar]
- 18.Sato T, Clevers H. Primary mouse small intestinal epithelial cell cultures. Methods Mol Biol. 2013;945:319–328. doi: 10.1007/978-1-62703-125-7_19. [DOI] [PubMed] [Google Scholar]
- 19.Han Q, Bradshaw EM, Nilsson B, Hafler DA, Love JC. Multidimensional analysis of the frequencies and rates of cytokine secretion from single cells by quantitative microengraving. Lab Chip. 2010;10:1391–1400. doi: 10.1039/b926849a. [DOI] [PMC free article] [PubMed] [Google Scholar]
- 20.Miller MA, Barkal L, Jeng K, Herrlich A, Moss M, Griffith LG, et al. Proteolytic Activity Matrix Analysis (PrAMA) for simultaneous determination of multiple protease activities. Integr Biol. 2011;3:422–438. doi: 10.1039/c0ib00083c. [DOI] [PMC free article] [PubMed] [Google Scholar]
- 21.Luzzi KJ, MacDonald IC, Schmidt EE, Kerkvliet N, Morris VL, Chambers AF, et al. Multistep nature of metastatic inefficiency: dormancy of solitary cells after successful extravasation and limited survival of early micrometastases. Am J Pathol. 1998;153:865–873. doi: 10.1016/S0002-9440(10)65628-3. [DOI] [PMC free article] [PubMed] [Google Scholar]
- 22.Carvalhal GF, Daudi SN, Kan D, Mondo D, Roehl KA, Loeb S, et al. Correlation Between Serum Prostate-specific Antigen and Cancer Volume in Prostate Glands of Different Sizes. Urology. 2010;76:1072–1076. doi: 10.1016/j.urology.2009.11.056. [DOI] [PMC free article] [PubMed] [Google Scholar]
- 23.Klein CA. Parallel progression of primary tumours and metastases. Nat Rev Cancer. 2009;9:302–312. doi: 10.1038/nrc2627. [DOI] [PubMed] [Google Scholar]
- 24.Mehes G, Witt A, Kubista E, Ambros PF. Circulating breast cancer cells are frequently apoptotic. Am J Pathol. 2001;159:17–20. doi: 10.1016/S0002-9440(10)61667-7. [DOI] [PMC free article] [PubMed] [Google Scholar]
- 25.Rossi E, Fassan M, Aieta M, Zilio F, Celadin R, Borin M, et al. Dynamic changes of live/apoptotic circulating tumour cells as predictive marker of response to Sunitinib in metastatic renal cancer. Br J Cancer. 2012;107:1286–1294. doi: 10.1038/bjc.2012.388. [DOI] [PMC free article] [PubMed] [Google Scholar]
- 26.Larson CJ, Moreno JG, Pienta KJ, Gross S, Repollet M, O'Hara SM, et al. Apoptosis of circulating tumor cells in prostate cancer patients. Cytometry, Part A. 2004;62:46–53. doi: 10.1002/cyto.a.20073. [DOI] [PubMed] [Google Scholar]
- 27.Muller V, Stahmann N, Riethdorf S, Rau T, Zabel T, Goetz A, et al. Circulating tumor cells in breast cancer: Correlation to bone marrow micrometastases, heterogeneous response to systemic therapy and low proliferative activity. Clin Cancer Res. 2005;11:3678–3685. doi: 10.1158/1078-0432.CCR-04-2469. [DOI] [PubMed] [Google Scholar]
- 28.Powell AA, Talasaz AH, Zhang HY, Coram MA, Reddy A, Deng G, et al. Single Cell Profiling of Circulating Tumor Cells: Transcriptional Heterogeneity and Diversity from Breast Cancer Cell Lines. PLoS One. 2012;7:e33788. doi: 10.1371/journal.pone.0033788. [DOI] [PMC free article] [PubMed] [Google Scholar]
- 29.Murray NP, Reyes E, Tapia P, Badinez L, Orellana N, Fuentealba C, et al. Redefining micrometastasis in prostate cancer – a comparison of circulating prostate cells, bone marrow disseminated tumor cells and micrometastasis: implications in determining local or systemic treatment for biochemical failure after radical prostatectomy. Int J Mol Med. 2012;30:896–904. doi: 10.3892/ijmm.2012.1071. [DOI] [PubMed] [Google Scholar]
- 30.Alix-Panabieres C, Vendrell JP, Pelle O, Rebillard X, Riethdorf S, Muller V, et al. Detection and characterization of putative metastatic precursor cells in cancer patients. Clin Chem. 2007;53:537–539. doi: 10.1373/clinchem.2006.079509. [DOI] [PubMed] [Google Scholar]
- 31.Aguirre-Ghiso JA. Models, mechanisms and clinical evidence for cancer dormancy. Nat Rev Cancer. 2007;7:834–846. doi: 10.1038/nrc2256. [DOI] [PMC free article] [PubMed] [Google Scholar]
- 32.Wiedswang G, Borgen E, Karesen R, Qvist H, Janbu J, Kvalheim G, et al. Isolated tumor cells in bone marrow three years after diagnosis in disease-free breast cancer patients predict unfavorable clinical outcome. Clin Cancer Res. 2004;10:5342–5348. doi: 10.1158/1078-0432.CCR-04-0245. [DOI] [PubMed] [Google Scholar]
- 33.Friedl P, Wolf K. Tumour-cell invasion and migration: diversity and escape mechanisms. Nat Rev Cancer. 2003;3:362–374. doi: 10.1038/nrc1075. [DOI] [PubMed] [Google Scholar]
- 34.Friedl P, Locker J, Sahai E, Segall JE. Classifying collective cancer cell invasion. Nat Cell Biol. 2012;14:777–783. doi: 10.1038/ncb2548. [DOI] [PubMed] [Google Scholar]
- 35.Raviraj V, Zhang H, Chien HY, Cole L, Thompson EW, Soon L. Dormant but migratory tumour cells in desmoplastic stroma of invasive ductal carcinomas. Clin Exp Metastasis. 2012;29:273–292. doi: 10.1007/s10585-011-9450-4. [DOI] [PubMed] [Google Scholar]
- 36.Yu Z, Schmaltz RM, Bozeman TC, Paul R, Rishel MJ, Tsosie KS, et al. Selective tumor cell targeting by the disaccharide moiety of bleomycin. J Am Chem Soc. 2013;135:2883–2886. doi: 10.1021/ja311090e. [DOI] [PMC free article] [PubMed] [Google Scholar]
Associated Data
This section collects any data citations, data availability statements, or supplementary materials included in this article.