Short abstract
In vitro systems for applying mechanical strain to cultured cells are commonly used to investigate cellular mechanotransduction pathways in a variety of cell types. These systems often apply mechanical forces to a flexible membrane on which cells are cultured. A consequence of the motion of the membrane in these systems is the generation of flow and the unintended application of shear stress to the cells. We recently described a flexible system for applying mechanical strain to cultured cells, which uses a linear motor to drive a piston array to create biaxial strain within multiwell culture plates. To better understand the fluidic stresses generated by this system and other systems of this type, we created a computational fluid dynamics model to simulate the flow during the mechanical loading cycle. Alterations in the frequency or maximal strain magnitude led to a linear increase in the average fluid velocity within the well and a nonlinear increase in the shear stress at the culture surface over the ranges tested (0.5–2.0 Hz and 1–10% maximal strain). For all cases, the applied shear stresses were relatively low and on the order of millipascal with a dynamic waveform having a primary and secondary peak in the shear stress over a single mechanical strain cycle. These findings should be considered when interpreting experimental results using these devices, particularly in the case when the cell type used is sensitive to low magnitude, oscillatory shear stresses.
Keywords: mechanical stretch, fluid shear stress, in vitro mechanical loading device, computational fluid dynamics, mechanotransduction, mechanobiology
Introduction
Mechanical forces are important in embryonic development [1] and key factor in the pathogenesis of many diseases including cardiovascular disease [1–3], cancer [4,5], and neurological disorders [6,7]. A variety of devices have been developed to study the effects of mechanical forces on the cells through the application of mechanical strain [8–10]. These systems most commonly involve growing cultured cells on a flexible substrate and applying forces to the substrate with a piston [11–14] or through pneumatic pressure [15–17]. While a key advantage of in vitro systems is the ability to isolate a single cell type and create a well-defined mechanical environment, it is a fundamental limitation of these systems that the movement of the flexible culture substrate generates fluid flow that also applies shear forces to cells in culture.
As many cell types are sensitive to fluid shear forces as well as mechanical stretch, the generation of flow may also cause a response from the cells. Thus, it is critical to understand the fluidic forces within these systems to account for this potential confounding factor in these experiments. In particular, endothelial cells have been shown to respond to shear stresses and mechanical strain, leading to modulation of the immune cell interactions [18–20], coagulation factors [21], and vasomotor tone [22,23]. As flow is inevitably generated within the systems that apply mechanical strain, it is unclear what part of the response is induced from the flow or the mechanical stretch. A similar situation is relevant to many cell types including osteoblasts [24,25], vascular smooth muscle cells [26,27], and mesenchymal stem cells [28,29], all of which have shown to have potent mechanobiological responses to mechanical strain in culture and respond strongly to shear forces.
There have been only limited attempts to understand the shear forces during the application of mechanical stretch to cultured cells. One previous study used a 2D model of shear stresses in a pneumatically driven system [30] while another used a highly simplified model of flat wall displacement to estimate the order of magnitude of the shear stress generated during the motion of the piston [13]. We recently created a novel device that allows application of complex mechanical stretch waveforms to cultured cells in a six-well format [12]. While we have validated the strain applied by this system in terms of flexible membrane distention, it remains unclear what the nature of the flow is within this system during mechanical loading. Here, we have created a computational simulation of the flow within a culture well with a flexible bottom during the application of mechanical strain. In our model, displacement of the flexible membrane leads to the generation of fluid flow. In the actual system, the pistons are mounted on a rigid plate that is coupled to a linear motor allowing arbitrary displacements and the application of complex temporal strain profiles. In our model, we simulated several common loading profiles including the application of sinusoidal load of 0.5–2.0 Hz and displacements that generate 1–10% maximal strain on the culture membrane. Our results are useful for interpreting the potential effects of shear stress in the many experimental studies that have applied mechanical strain to cultured cells and provide a computational analysis of the flow within these in vitro mechanical loading devices. Moreover, we demonstrate that motion of the membrane within the well leads to the generation of low level oscillatory shear stress that has been shown to alter the function of endothelial cells [19,31,32]. Thus, the analysis presented here may be relevant to many systems in which mechanical forces are applied to cells through displacement of a flexible membrane.
Methods
Numerical Simulation.
Comsol Multiphysics (version 4.2a; COMSOL Inc., Burlington, MA) was used for performing finite element (FEM) analysis of the fluid dynamics within the system. The Navier–Stokes equation was used to model laminar fluid flow with the momentum balance included for each component of the momentum vector in all spatial dimensions [33]. Incompressible flow of a Newtonian fluid was assumed with constant density and viscosity. The physical parameters were defined as shown in Table 1. The overall geometry of the system is identical to a 35-mm diameter culture well in which the bottom of the well is displaced to create stretch in the flexible cell culture substrate (Figs. 1(a) and 1(b)) in a system recently designed by our group [12]. During the loading cycle, a piston is driven through the flexible culture membrane (Fig. 1(c)). The geometry was created in Comsol and we performed an initial set of optimization simulations for the tolerance and mesh size Fig. 1 (Supplemental figures are available under the “Supplemental Data” tab for this paper on the ASME Digital Collection). Based on the test simulations, we chose the final tolerance of 0.0001 at “finer-mesh” density settings. For these conditions, the time step for the simulations varied between 5.86 ms and 46.9 ms. The final optimized mesh is shown in Fig. 2(a). During the simulation, the bottom surface of the well is deformed to match an idealized version of the deformation of silicone membrane during the piston motion (Figs. 2(b) and 2(c)). The boundary conditions included a cylindrical wall with free boundary on the top surface, no-slip condition on the sides, and a no-slip condition on the bottom surface with a displacement profile corresponding to the piston motion distending the membrane. A sinusoidal motion with frequency and amplitude of the membrane displacement was modeled using the following equation:
Table 1.
List of parameters used in the computational model
| Parameter | Value | Units |
|---|---|---|
| Fluid density (ρ) | 1000 | kg/m3 |
| Dynamic viscosity (μ) | 1 × 10⁻³ | Pa s |
| Well height (H) | 12.7 | mm |
| Well diameter (D 1) | 35 | mm |
| Piston diameter (D 2) | 32.8 | mm |
Fig. 1.
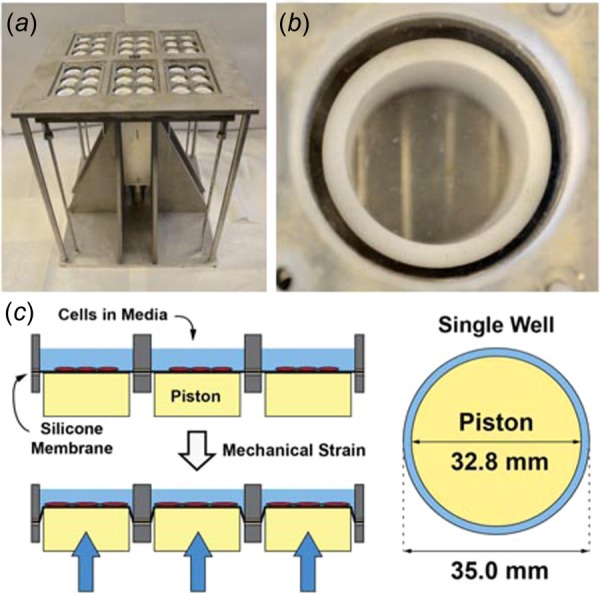
(a) Photograph of device for applying mechanical stretch to culture cells. (b) Photograph of a single well with flexible cell culture substrate. (c) Diagram of the application of mechanical strain to the well through the displacement of the piston and the top view of the geometry of the culture well used for the studies.
Fig. 2.
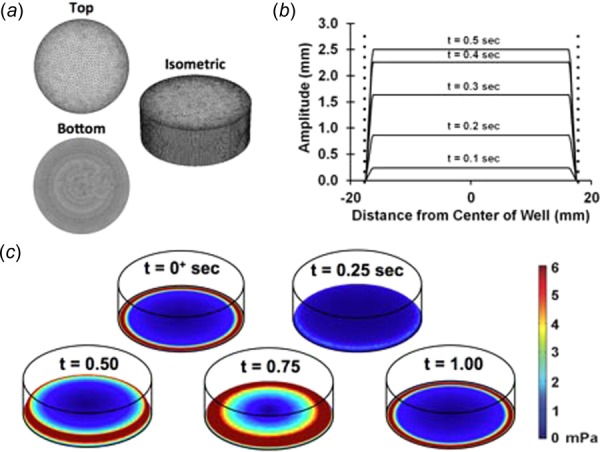
(a) Optimized mesh used in the simulations. (b) Displacement profile of piston. Dashed lines denote the location of the walls of the well. (c) Displacement of the bottom of the well during the simulation. Plotted are the shear stress of the bottom of the well during the motion. The displacement for 10% maximal strain at 1 Hz is shown.
| (1) |
where f represents frequency, A is the strain amplitude, R p represents radius of the piston, and R w represents the radius of the well. The distension amplitude A was determined by our strain calibration for the actual system [12]. A time derivative of Eq. (1) was used as a velocity input to the moving wall as shown below:
| (2) |
The simulations were run for a total of 15 cycles of mechanical strain for each condition.
Results and Discussion
Here, we examined the flow field generated by the motion of a piston that deforms a flexible substrate to apply strain to cultured cells. A primary motivation for this study is that motion within culture media creates flow and the shear stresses from this flow represent a potential source of confounding findings in studies aimed at examining the response of cells to mechanical strain. We examined nine cases of mechanical loading in which the strain applied was sinusoidal in its motion. We first examined the flow velocities within a well in each of the loading conditions. The maximum velocity for each frequency condition over the last cycle (cycle 15) was visualized with a single transverse cut plane through the middle of the well at the time of maximum velocity Fig. 3 with multiple cut planes shown in Supplementary Fig. 2 and multiple horizontal cut planes through the well (Fig. 4). (Supplemental figures are available under the “Supplemental Data” tab for this paper on the ASME Digital Collection). Velocity maps from both the transverse and horizontal cut indicate that the flow velocity is generally uniform within the piston region and drops significantly near the walls as expected due to fluid drag along the walls. A time course of the evolution of flow can be seen in Supplementary Video 1 (Supplemental videos available under the “Supplemental Data” tab for this paper on the ASME Digital Collection), for the case of 1 Hz and 10% maximal strain. The average velocity over the entire well varied linearly with frequency and magnitude (Fig. 5(a)). Isosurface visualization revealed the piston motion propagating through the well during the loading cycle Fig. 6 and Supplementary Video 2 (Supplemental videos available under the “Supplemental Data” tab for this paper on the ASME Digital Collection), for 1 Hz and 10% maximal strain. Flows within the simulation were highest near the outer upper edge of the liquid within the well and near to the deforming surface at the bottom of the well.
Fig. 3.
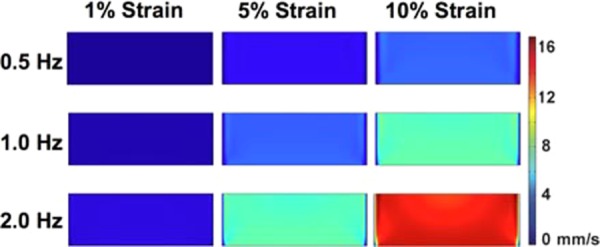
Maximal magnitude of velocity within the well at frequency plotted on a coronal plane cut through the center of the well (time point varied with frequency of loading). The plotted time was chosen as the time when there was the maximum velocity in the coronal slice from all time points examined in the last cycle of loading. Plotted times are from the last cycle of loading for 0.5 Hz (time = 14.5 s), 1 Hz (time = 14.25 s), and 2 Hz (time = 14.625 s). Maximum strains of 1%, 5%, and 10% were investigated per frequency. Higher velocity is observed toward the middle of the well. To aid visualization, the displacement of the membrane is not shown in the simulation.
Fig. 4.
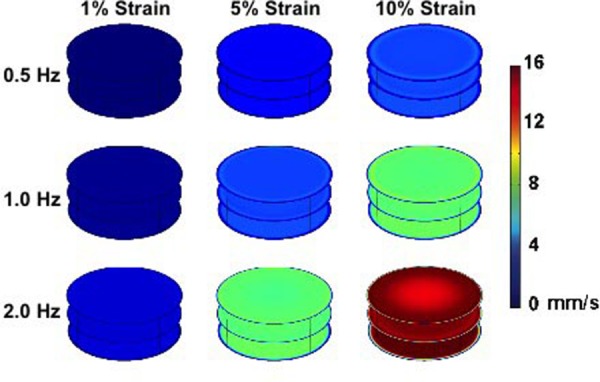
Maximal magnitude of velocity within the system for each of the frequencies tested (0.5, 1, and 2 Hz) as the membrane displaces. The plotted time was chosen as the time when there was the maximum velocity in the horizontal slices from all time points examined in the last cycle of loading. Plotted times are from the last cycle of loading for 0.5 Hz (time = 14.5 s), 1 Hz (time = 14.25 s), and 2 Hz (time = 14.625 s). Horizontal cut planes through the well with the bottom, middle, and top of the well are shown. Maximum strains of 1%, 5%, and 10% were investigated at each frequency. The bottom plane shows the velocity of the displacing surface, and the top plane shows the velocity at the top of the well. Higher velocity is observed toward the middle of the well. To aid visualization, the displacement of the membrane is not shown in the simulation.
Fig. 5.
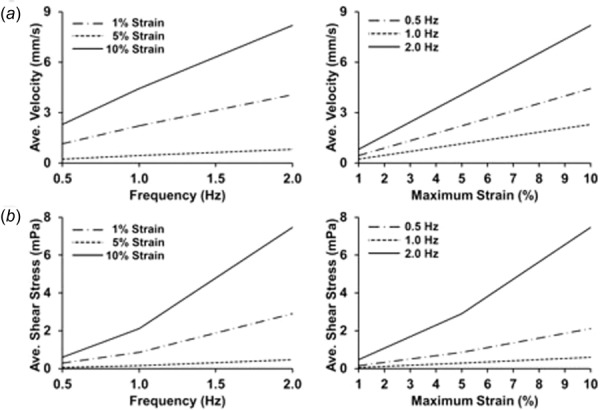
Fluid velocity and shear stress during mechanical loading, averaged over the entire well or culture surface. (a) Average fluid velocity for the entire well averaged over time in the final cycle of the simulation. (b) Average shear stress on the culture surface averaged over time in the final cycle of the simulation.
Fig. 6.
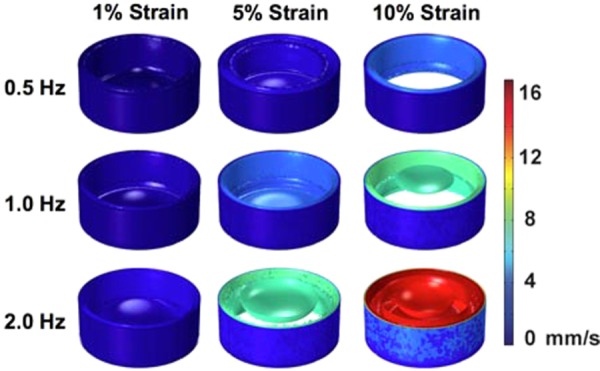
Velocity isosurfaces for the time with maximal velocity for each frequency of loading (0.5, 1, and 2 Hz) as the membrane displaces. Maximum strains of 1%, 5%, and 10% were investigated at each frequency. The plotted time was chosen as the time when there was the maximum velocity in the well from all time points examined in the last cycle of loading. Plotted times are from the last cycle of loading for 0.5 Hz (time = 14.5 s), 1 Hz (time = 14.25 s), and 2 Hz (time = 14.625 s). Each isosurface color shows a surface with a constant velocity within the well in millimeter per second. Higher velocity is observed toward the middle of the well.
We next examined the shear stresses generated by the flow on the culture surface. We averaged the shear stresses over the regions within the piston, outside piston, and over the total bottom surface and plotted these over time (Figs. 7(a) and 7(b)). This analysis revealed a cyclic waveform with two peaks that repeated over each loading cycle Supplementary Figs. 3, 4, and 5. (Supplemental figures available under the “Supplemental Data” tab for this paper on the ASME Digital Collection). This waveform was most pronounced in the region outside the piston with a maximal shear stress of around 37 mPa and a secondary peak with a maximal shear stress of around 16 mPa for 2 Hz and 10% maximum strain loading conditions. The radial distribution of shear stress averaged over time showed a peak in shear stress just outside the piston edge (Fig. 8). Over time, the shear stress within the well varied from almost zero across the well to a profile with two peaks near to the edge of the piston (shown for the case of 10% maximal strain and 1 Hz in Fig. 9 and for all cases in Fig. 10). Visualizations of the dynamic development of shear stress with the well can be found in Supplementary Videos 3 and 4 (Supplemental videos available under the “Supplemental Data” tab for this paper on the ASME Digital Collection), for 1 Hz and 10% maximal strain. The average shear stress over the entire culture surface within the well varied nonlinearly with frequency and magnitude, particularly at the highest frequency and maximal strain (Fig. 5(b)).
Fig. 7.
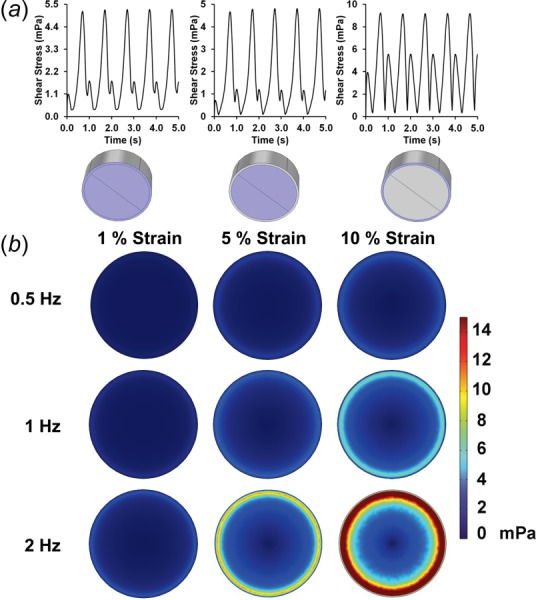
(a) Average shear stress over the first cycles of loading for the total, central, and outer regions of the bottom surface of the well. Conditions shown are for 10% maximal strain and 1 Hz frequency of loading. (b) Average shear stress on the bottom of the plate over the last cycle of the simulation.
Fig. 8.
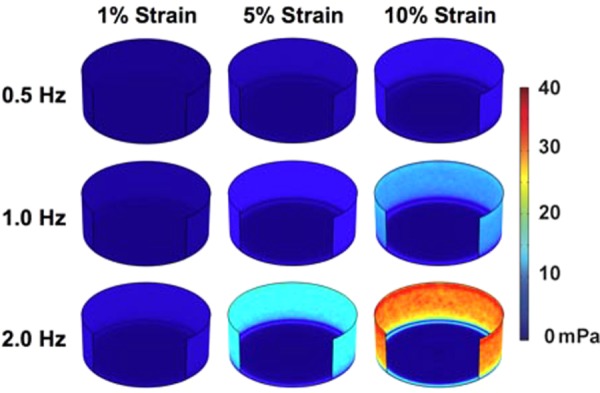
Maximal shear stress on the surfaces of the well during the loading cycle. Within each frequency group, the time point chosen is held constant and is set for the time of maximal shear stress. Maximum strains of 1%, 5%, and 10% were investigated per frequency. The plotted time was chosen as the time when there was the maximum shear stress on the well surfaces from all time points examined in the last cycle of loading. Plotted times are from the last cycle of loading for 0.5 Hz (time = 14.5 s), 1 Hz (time = 14.25 s), and 2 Hz (time = 14.625 s). Higher shear stress is observed toward the wall. The quarter front wall has been removed to aid visualization.
Fig. 9.
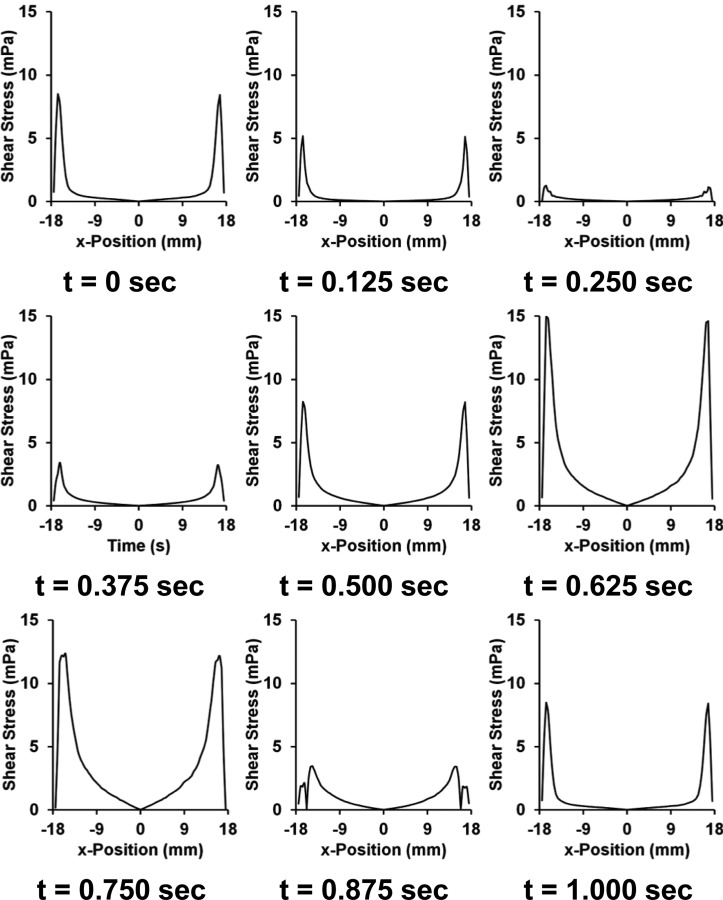
Circumferential average of shear stresses on the culture surface during last cycle of the simulation. The zero point indicates the center of the well with an average taken circumferentially at each radius. Graphs shown are for 10% maximal strain and 1 Hz frequency of loading.
Fig. 10.
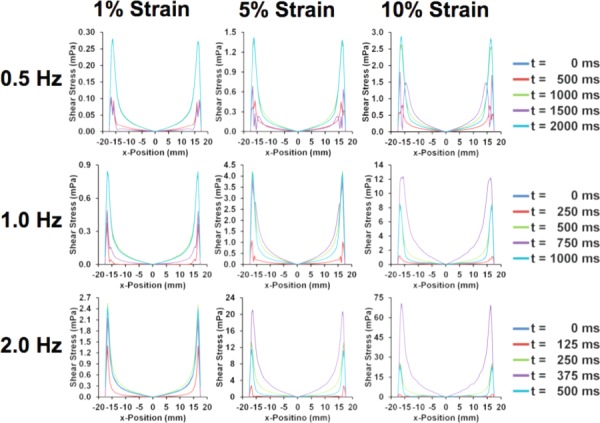
Circumferential average shear stress during last cycle of the simulation. The zero point indicates the center of the well with an average taken circumferentially at each radius. All frequencies (0.5, 1, and 2 Hz) and maximal strain (1%, 5%, and 10%) are shown.
The shear stresses on the culture surface of the plate had a primary and secondary peak within a single strain cycle. While the first cycle in time had some small deviations, this quickly stabilized into a consistent waveform. Due to symmetry, there is a point of zero shear stress at the center of the well. The shear stresses within the piston region of the well are the lowest within the well and increase toward the outer edge. Outside of this region, the shear stresses are higher, about twofold in the maximal peak and around fourfold in the secondary peak during a single cycle. While the outer region of the plate can be avoided in imaging studies, this area is included when cells are lysed for gene or protein expression.
A limited number of previous studies have attempted to estimate the shear stresses generated during the application of mechanical strain to cultured cells. An early study described the construction of a device that uses a cam and rotational motor to apply mechanical strain to a silicone culture surface [13]. As part of their study, they estimated the shear stresses created by a simple wall moving in a fluid as an order-of-magnitude estimation. This rough calculation for the system gave shear stresses of a magnitude of 0.05, 0.60, and 1.70 Pa at 1, 5, and 10 Hz, respectively, for a 100 mm wall oscillating with a peak displacement of 5 mm (10% maximal strain). This estimate is considerably higher than the shear stresses found in this study and this may be due to the larger diameter plate, requiring greater displacements for similar strain levels as well as the differences in the complexity of the model used in our study. A second study created a 2D model of shear stress generated by flow within the pneumatically driven Flexcell system [30]. This system has similarly sized wells as the system described here but with a pneumatic loading mechanism. Their 2D model was found to have peak shear stresses of 0.088 and 0.132 Pa for 1 Hz loading at 3.8% and 6.7% maximal strain. At higher frequencies, they found 0.172 and 0.424 Pa of peak shear stress for 2 Hz and 5 Hz of loading, respectively, at 3.8% maximal strain. Thus, their results, while not directly comparable because of the differences in device mechanism and modeling technique, show relatively similar levels of shear stress to those from our model here. The shear stresses observed are low in comparison to those used in many studies on shear stress-induced mechanobiology [34]. However, the shear forces are rapidly oscillating and may have an effect on cells due to their temporal variation. Low magnitude oscillatory stress has been shown to have potent effects on endothelial cell biology including expression of adhesion molecules and monocyte recruitment [19]. Low levels of disturbed shear stresses have been shown to alter endothelial cell proliferation [31]. In addition, there is synergy between pulsatile low shear stresses and mechanical stretch [32].
The model described in this study provides a simulation of the flow within a flexible system for applying mechanical strains to cultured cells, which was recently described by our group [12]. Our study has found that shear stresses generated by this type of system are on the order of millipascal on the cell culture surface with frequencies of flow oscillation exceeding that of the strain loading cycle. Many other systems use a similar configuration to apply loads to cultured cells and likely generate similar shear stresses during the application of stretch in these systems [8]. While our simulation captures considerable complexity for the system, we used several assumptions that should be considered when interpreting our results. We did not include surface tension or gravity effects of air–liquid interface of culture well. Depending on the volume of fluid within the well and frequency applied, there may be effects of wavelike motions on the surface of the well. In addition, our study does not directly model the mechanical interaction between the piston and the membrane or the effects of the fluid on the membrane mechanics. We modeled this as a deformation of the bottom surface of the well and, thus, did not include the complexities of this interaction including friction and bowing of the membrane as it is pushed into the fluid. Thus, the effects of the horizontal stretching of the membrane during the stretch are not captured in this study. The tension on the membrane could alter the flow and significantly alter the shear stress on cell culture surface. Thus, the model could be improved by including either a sequential or fully coupled model of the fluid structure interactions. In addition, we have also assumed perfect vertical alignment that creates a symmetrical flow that may not fully recapitulate the experimental situation in which the system is not perfectly aligned with gravity.
In summary, our studies have simulated the flow within a device to apply mechanical stretch to cultured cells. Our results support that the shear stresses generated are low in magnitude but have rapid and complex oscillation that varies radially within the culture well. As some cell types such as endothelial and bone cells are sensitive to oscillatory shear stresses, it is important to be aware of the shear stress generated while applying mechanical stretch to the cells. In particular, at high frequencies and strains the region outside the piston is exposed to the highest levels of oscillatory shear stresses. This region should therefore be minimized in the design of these devices and avoided in imaging studies on cells exposed to mechanical strain whenever possible.
Supplementary Material
Acknowledgment
The authors would like to acknowledge support through the American Heart Association (10SDG2630139), through the NIH Director's New Innovator Grant (1DP2 OD008716-01) and the Welch Foundation.
Contributor Information
Jason Lee, Department of Biomedical Engineering, University of Texas at Austin, Austin, TX 78712.
Aaron B. Baker, Department of Biomedical Engineering, University of Texas at Austin, 107 West Dean Keeton Street, BME 5.202D, C0800, Austin, TX 78712, e-mail: abbaker1@gmail.com.
References
- [1]. Mammoto, T. , Mammoto, A. , and Ingber, D. E. , 2013, “Mechanobiology and Developmental Control,” Annu. Rev. Cell Dev. Biol., 29, pp. 27–61. 10.1146/annurev-cellbio-101512-122340 [DOI] [PubMed] [Google Scholar]
- [2]. Chiu, J. J. , and Chien, S. , 2011, “Effects of Disturbed Flow on Vascular Endothelium: Pathophysiological Basis and Clinical Perspectives,” Physiol. Rev., 91(1), pp. 327–387. 10.1152/physrev.00047.2009 [DOI] [PMC free article] [PubMed] [Google Scholar]
- [3]. Koskinas, K. C. , Chatzizisis, Y. S. , Baker, A. B. , Edelman, E. R. , Stone, P. H. , and Feldman, C. L. , 2009, “The Role of Low Endothelial Shear Stress in the Conversion of Atherosclerotic Lesions From Stable to Unstable Plaque,” Curr. Opin. Cardiol., 24(6), pp. 580–590. 10.1097/HCO.0b013e328331630b [DOI] [PMC free article] [PubMed] [Google Scholar]
- [4]. Makale, M. , 2007, “Cellular Mechanobiology and Cancer Metastasis,” Birth Defects Res., Part C, 81(4), pp. 329–343. 10.1002/bdrc.20110 [DOI] [PubMed] [Google Scholar]
- [5]. Suresh, S. , 2007, “Biomechanics and Biophysics of Cancer Cells,” Acta Biomater., 3(4), pp. 413–438. 10.1016/j.actbio.2007.04.002 [DOI] [PMC free article] [PubMed] [Google Scholar]
- [6]. Laplaca, M. C. , and Prado, G. R. , 2010, “Neural Mechanobiology and Neuronal Vulnerability to Traumatic Loading,” J. Biomech., 43(1), pp. 71–78. 10.1016/j.jbiomech.2009.09.011 [DOI] [PubMed] [Google Scholar]
- [7]. Uversky, V. N. , and Eliezer, D. , 2009, “Biophysics of Parkinson's Disease: Structure and Aggregation of Alpha-Synuclein,” Curr. Protein Pept. Sci., 10(5), pp. 483–499. 10.2174/138920309789351921 [DOI] [PMC free article] [PubMed] [Google Scholar]
- [8]. Brown, T. D. , 2000, “Techniques for Mechanical Stimulation of Cells In Vitro: A Review,” J. Biomech., 33(1), pp. 3–14. 10.1016/S0021-9290(99)00177-3 [DOI] [PubMed] [Google Scholar]
- [9]. Kim, D. H. , Wong, P. K. , Park, J. , Levchenko, A. , and Sun, Y. , 2009, “Microengineered Platforms for Cell Mechanobiology,” Annu. Rev. Biomed. Eng., 11, pp. 203–233. 10.1146/annurev-bioeng-061008-124915 [DOI] [PubMed] [Google Scholar]
- [10]. Schulz, R. M. , and Bader, A. , 2007, “Cartilage Tissue Engineering and Bioreactor Systems for the Cultivation and Stimulation of Chondrocytes,” Eur. Biophys. J., 36(4–5), pp. 539–568. 10.1007/s00249-007-0139-1 [DOI] [PubMed] [Google Scholar]
- [11]. Lee, A. A. , Delhaas, T. , Waldman, L. K. , MacKenna, D. A. , Villarreal, F. J. , and McCulloch, A. D. , 1996, “An Equibiaxial Strain System for Cultured Cells,” Am. J. Physiol., 271(4 Pt. 1), p. C1400. [DOI] [PubMed] [Google Scholar]
- [12]. Lee, J. , Wong, M. , Smith, Q. , and Baker, A. B. , 2013, “A Novel System for Studying Mechanical Strain Waveform-Dependent Responses in Vascular Smooth Muscle Cells,” Lab Chip, 13(23), pp. 4573–4582. 10.1039/c3lc50894c [DOI] [PMC free article] [PubMed] [Google Scholar]
- [13]. Schaffer, J. L. , Rizen, M. , L'Italien, G. J. , Benbrahim, A. , Megerman, J. , Gerstenfeld, L. C. , and Gray, M. L. , 1994, “Device for the Application of a Dynamic Biaxially Uniform and Isotropic Strain to a Flexible Cell Culture Membrane,” J. Orthop. Res., 12(5), pp. 709–719. 10.1002/jor.1100120514 [DOI] [PubMed] [Google Scholar]
- [14]. Sotoudeh, M. , Jalali, S. , Usami, S. , Shyy, J. Y. , and Chien, S. , 1998, “A Strain Device Imposing Dynamic and Uniform Equi-Biaxial Strain to Cultured Cells,” Ann. Biomed. Eng., 26(2), pp. 181–189. 10.1114/1.88 [DOI] [PubMed] [Google Scholar]
- [15]. Bieler, F. H. , Ott, C. E. , Thompson, M. S. , Seidel, R. , Ahrens, S. , Epari, D. R. , Wilkening, U. , Schaser, K. D. , Mundlos, S. , and Duda, G. N. , 2009, “Biaxial Cell Stimulation: A Mechanical Validation,” J. Biomech., 42(11), pp. 1692–1696. 10.1016/j.jbiomech.2009.04.013 [DOI] [PubMed] [Google Scholar]
- [16]. Simmons, C. S. , Sim, J. Y. , Baechtold, P. , Gonzalez, A. , Chung, C. , Borghi, N. , and Pruitt, B. L. , 2011, “Integrated Strain Array for Cellular Mechanobiology Studies,” J. Micromech. Microeng., 21(5), pp. 54016–54025. 10.1088/0960-1317/21/5/054016 [DOI] [PMC free article] [PubMed] [Google Scholar]
- [17]. Vande Geest, J. P. , Di Martino, E. S. , and Vorp, D. A. , 2004, “An Analysis of the Complete Strain Field Within Flexercell Membranes,” J. Biomech., 37(12), pp. 1923–1928. 10.1016/j.jbiomech.2004.02.022 [DOI] [PubMed] [Google Scholar]
- [18]. Chatzizisis, Y. S. , Coskun, A. U. , Jonas, M. , Edelman, E. R. , Feldman, C. L. , and Stone, P. H. , 2007, “Role of Endothelial Shear Stress in the Natural History of Coronary Atherosclerosis and Vascular Remodeling: Molecular, Cellular, and Vascular Behavior,” J. Am. Coll. Cardiol., 49(25), pp. 2379–2393. 10.1016/j.jacc.2007.02.059 [DOI] [PubMed] [Google Scholar]
- [19]. Hsiai, T. K. , Cho, S. K. , Wong, P. K. , Ing, M. , Salazar, A. , Sevanian, A. , Navab, M. , Demer, L. L. , and Ho, C. M. , 2003, “Monocyte Recruitment to Endothelial Cells in Response to Oscillatory Shear Stress,” FASEB J., 17(12), pp. 1648–1657. 10.1096/fj.02-1064com [DOI] [PMC free article] [PubMed] [Google Scholar]
- [20]. Hwang, J. , Saha, A. , Boo, Y. C. , Sorescu, G. P. , McNally, J. S. , Holland, S. M. , Dikalov, S. , Giddens, D. P. , Griendling, K. K. , Harrison, D. G. , and Jo, H. , 2003, “Oscillatory Shear Stress Stimulates Endothelial Production of O2- From p47phox-Dependent NAD(P)H Oxidases, Leading to Monocyte Adhesion,” J. Biol. Chem., 278(47), pp. 47291–47298. 10.1074/jbc.M305150200 [DOI] [PubMed] [Google Scholar]
- [21]. Yin, W. , Shanmugavelayudam, S. K. , and Rubenstein, D. A. , 2011, “The Effect of Physiologically Relevant Dynamic Shear Stress on Platelet and Endothelial Cell Activation,” Thromb. Res., 127(3), pp. 235–241. 10.1016/j.thromres.2010.11.021 [DOI] [PubMed] [Google Scholar]
- [22]. Awolesi, M. A. , Widmann, M. D. , Sessa, W. C. , and Sumpio, B. E. , 1994, “Cyclic Strain Increases Endothelial Nitric Oxide Synthase Activity,” Surgery, 116(2), pp. 439–444. [PubMed] [Google Scholar]
- [23]. Xiao, Z. , Zhang, Z. , Ranjan, V. , and Diamond, S. L. , 1997, “Shear Stress Induction of the Endothelial Nitric Oxide Synthase Gene is Calcium-Dependent but Not Calcium-Activated,” J. Cell. Physiol., 171(2), pp. 205–211. [DOI] [PubMed] [Google Scholar]
- [24]. Boutahar, N. , Guignandon, A. , Vico, L. , and Lafage-Proust, M. H. , 2004, “Mechanical Strain on Osteoblasts Activates Autophosphorylation of Focal Adhesion Kinase and Proline-Rich Tyrosine Kinase 2 Tyrosine Sites Involved in ERK Activation,” J. Biol. Chem., 279(29), pp. 30588–30599. 10.1074/jbc.M313244200 [DOI] [PubMed] [Google Scholar]
- [25]. Kapur, S. , Baylink, D. J. , and Lau, K. H. , 2003, “Fluid Flow Shear Stress Stimulates Human Osteoblast Proliferation and Differentiation Through Multiple Interacting and Competing Signal Transduction Pathways,” Bone, 32(3), pp. 241–251. 10.1016/S8756-3282(02)00979-1 [DOI] [PubMed] [Google Scholar]
- [26]. Iwasaki, H. , Eguchi, S. , Ueno, H. , Marumo, F. , and Hirata, Y. , 2000, “Mechanical Stretch Stimulates Growth of Vascular Smooth Muscle Cells Via Epidermal Growth Factor Receptor,” Am. J. Physiol. Heart Circ. Physiol., 278(2), pp. H521–H529. [DOI] [PubMed] [Google Scholar]
- [27]. Ueba, H. , Kawakami, M. , and Yaginuma, T. , 1997, “Shear Stress as an Inhibitor of Vascular Smooth Muscle Cell Proliferation. Role of Transforming Growth Factor-Beta 1 and Tissue-Type Plasminogen Activator,” Arterioscler. Thromb. Vasc. Biol., 17(8), pp. 1512–1516. 10.1161/01.ATV.17.8.1512 [DOI] [PubMed] [Google Scholar]
- [28]. Song, G. , Ju, Y. , Shen, X. , Luo, Q. , Shi, Y. , and Qin, J. , 2007, “Mechanical Stretch Promotes Proliferation of Rat Bone Marrow Mesenchymal Stem Cells,” Colloids Surf. B, 58(2), pp. 271–277. 10.1016/j.colsurfb.2007.04.001 [DOI] [PubMed] [Google Scholar]
- [29]. Yourek, G. , McCormick, S. M. , Mao, J. J. , and Reilly, G. C. , 2010, “Shear Stress Induces Osteogenic Differentiation of Human Mesenchymal Stem Cells,” Regener. Med., 5(5), pp. 713–724. 10.2217/rme.10.60 [DOI] [PMC free article] [PubMed] [Google Scholar]
- [30]. Thompson, M. S. , Abercrombie, S. R. , Ott, C. E. , Bieler, F. H. , Duda, G. N. , and Ventikos, Y. , 2011, “Quantification and Significance of Fluid Shear Stress Field in Biaxial Cell Stretching Device,” Biomech. Model Mechanobiol., 10(4), pp. 559–564. 10.1007/s10237-010-0255-1 [DOI] [PubMed] [Google Scholar]
- [31]. Davies, P. F. , Remuzzi, A. , Gordon, E. J. , Dewey, C. F., Jr. , and Gimbrone, M. A., Jr. , 1986, “Turbulent Fluid Shear Stress Induces Vascular Endothelial Cell Turnover In Vitro,” Proc. Natl. Acad. Sci. USA, 83(7), pp. 2114–2117. 10.1073/pnas.83.7.2114 [DOI] [PMC free article] [PubMed] [Google Scholar]
- [32]. Ziegler, T. , Bouzourene, K. , Harrison, V. J. , Brunner, H. R. , and Hayoz, D. , 1998, “Influence of Oscillatory and Unidirectional Flow Environments on the Expression of Endothelin and Nitric Oxide Synthase in Cultured Endothelial Cells,” Arterioscler. Thromb. Vasc. Biol., 18(5), pp. 686–692. 10.1161/01.ATV.18.5.686 [DOI] [PubMed] [Google Scholar]
- [33]. White, F. M. , 2003, Fluid Mechanics, McGraw-Hill, Boston, MA. [Google Scholar]
- [34]. Voyvodic, P. L. , Min, D. , Liu, R. , Williams, E. , Chitalia, V. , Dunn, A. K. , and Baker, A. B. , 2014, “Loss of Syndecan-1 Induces a Pro-Inflammatory Phenotype in Endothelial Cells With a Dysregulated Response to Atheroprotective Flow,” J. Biol. Chem., 289(14), pp. 9547–9559. 10.1074/jbc.M113.541573 [DOI] [PMC free article] [PubMed] [Google Scholar]
Associated Data
This section collects any data citations, data availability statements, or supplementary materials included in this article.


