

Abstract
Spectroscopic analysis of biological tissues can provide insight into changes in structure and function due to disease or injury. Depth resolved spectroscopic measurements can be implemented for tissue imaging using optical coherence tomography (OCT). Here spectroscopic OCT is applied to in vivo measurement of burn injury in a mouse model. Data processing and analysis methods are compared for their accuracy. Overall accuracy in classifying burned tissue was found to be as high as 91%, producing an area under the curve of a receiver operator characteristic curve of 0.97. The origins of the spectral changes are identified by correlation with histopathology.
Evaluation of burn severity is a significant clinical problem. There are over 2 million burns reported each year in the United States, and for U.S. military personnel, a significant fraction of injuries are thermally related [1]. These injuries are estimated to cost $7.5 billion/year [2]. The magnitude of this clinical need has inspired development of many technologies to assess burn depth, which can range from superficial first-degree burns affecting only the epidermis to full thickness third-degree burns that extend through the entire dermis. Unfortunately, none of these burn assessment technologies have been widely adopted and clinical judgment still relies primarily on visual inspection, with an accuracy of about 70% [3].
A number of optical methods have been developed to evaluate burn injuries including laser Doppler imaging for assessing blood flow [4] and photoacoustic imaging for measuring blood coagulation [5]. Near infrared (NIR) spectroscopy offers another compelling approach for burn assessment. NIR spectroscopy studies have revealed changes in oxygen saturation and total hemoglobin that are dependent upon the severity of the burn [6] and shown that multispectral imaging can accurately predict the time needed for intermediate-depth burn wounds to heal [7], but there has yet to be an implementation with depth-resolved measurements.
One approach that has been used to acquire depth-resolved, NIR spectra is spectroscopic optical coherence tomography (OCT) [8, 9]. Spectroscopic OCT has primarily been utilized to measure wavelength-dependent absorption [10-14], but it can also be used to measure tissue scattering spectra [15, 16] which have been leveraged to detect early cancerous changes in epithelial tissues [17]. Previous applications of non-spectroscopic OCT to burn evaluation have focused primarily on polarization-sensitive imaging [18-20], which can detect changes in collagen organization. Another recent study of burn injury combined OCT with reflectance confocal measurements [21] but did not include spectroscopic contrast.
In this study, we used spectroscopic OCT to evaluate burned animal tissues in vivo. The depth-resolved spectral data were obtained by processing the OCT signal with a short time Fourier transform (STFT) or the recently developed dual window (DW) method [22]. The spectral data were used to classify the tissue as burned or healthy based upon coefficients derived from power-law fitting or a logistic regression classification model. The accuracy of these two approaches was compared for both the STFT and DW processing methods.
Experimental OCT imaging was accomplished using a commercial OCT system (λ0 = 850 nm, Δλ = 155 nm; Spark DRC, Wasatch Photonics Inc., Durham, NC) that offered an imaging range, axial resolution, and lateral resolution in air of 2 mm, 2.1 μm, and 8 μm, respectively. The animal studies outlined below were approved by the Institutional Animal Care and Use Committee at Duke University. First, mice were anesthetized, shaved, and placed in a custom, insulated mold with an 8-mm diameter opening that exposed the shaved dorsal skin. Next, burn injuries were induced at the opening by immersing the mold in 60°C water for 25 seconds [23]. This produced third degree burns affecting the epidermis, dermis, and subdermal adipose layers. The tissue was imaged immediately following burn induction and was marked with India ink to enable registration with histopathology.
Figure 1 shows typical OCT images of healthy and burned mouse tissues obtained in vivo alongside histopathology from the same site. The healthy tissues show regular structures in the OCT image (note horizontal axis has been compressed to allow display of OCT image) while the burned tissue appears more irregular. The histopathology in Fig. 1(c) shows the epidermis at the surface above the collagenous dermis. Beneath the dermis are layers of adipose tissue and muscle. In contrast, the burned tissue [Fig. 1(d)] shows a pink layer of necrotic tissue atop a layer of darkly stained cell nuclei, which is indicative of inflammation. The fat cells are no longer confined beneath the dermis and appear in the superficial layers as well.
Fig. 1.

OCT images of (a) healthy and (b) burned mouse skin in vivo (scale bars 250 μm). Corresponding histopathology (hematoxylin and eosin staining) is shown below each image. (c) 10x, 100 μm scale bar. Tissue layers include E-epidermis, D-dermis, A-adipose, and M-muscle. (d) 4x, 500 μm scale bar.
Typically, spectroscopic OCT images are formed by processing the raw interferometric data with an STFT [8, 9]. This approach yields depth-resolved spectral information, but results in a loss of spatial resolution because resolution in one domain is exchanged for knowledge in the other. The DW method, on the other hand, uses the product of two STFTs, one calculated with a narrow window, to provide good spectral resolution, and the other calculated with a broad window to maintain depth resolution [22]. In this study, the DW method was applied using window sizes of 1400 cm-1 (wide) and 75 cm−1 (narrow). The wide window provides an axial resolution of 3 μm in air while the narrow window produces a spectral resolution of approximately 5 nm. For the STFT processing, a spectral window of 75 cm−1 was applied, resulting in a spectral resolution of 5 nm, but a degraded axial resolution of 60 μm.
Data were analyzed from 6 burned and 4 healthy sites, comprising 77807 total spectra. Figure 2(a) shows the average spectrum obtained for all sites of each type using the DW method. These average spectra as well as those from each individual tissue location were fit to a power law of the form A λ-b where λ is the wavelength and A,b are fitted parameters. Figure 2(b) shows the distribution of the power law exponents for the two tissue types. A statistically significant difference was observed with the healthy tissue showing an exponent of b = 7.8 compared to b = 1.2 for the burned tissue. Note that the healthy tissue spectrum in Fig. 2(a) is monotonically decreasing over almost the entire spectral range while the burned tissue spectrum shows several oscillatory features that are similar to the absorption spectrum of adipose tissue [24]. This observation is supported by the histopathology of the burned tissue sample displayed in Fig. 1(d), which shows that the fat cells are no longer confined beneath the dermis.
Fig. 2.

(a) Average DW spectra from healthy and burned mouse skin in vivo. Data are shown compared to the best-fit power-law model. (b) The average power-law exponents are significantly different (p<0.0001).
To demonstrate the diagnostic utility of the spectral data, the OCT images shown in Fig. 1 were color coded based on the power law exponent b [Fig. 3 (a) & (c)]. For comparison, the spectral data were also analyzed using principal component analysis followed by logistic regression to form a binary predictor of tissue health ς [Fig. 3 (b) & (d)]. The color coded images show healthy tissue with mostly light-beige coloring and burned tissue with mostly red coloring.
Fig. 3.
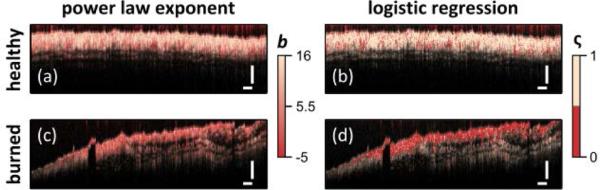
Diagnostic capability of DW spectral analysis shown by color coding image based on power law exponent (a,c) or via logistic regression (b,d) for healthy (a,b) and burned (c,d) tissues. Scale bars = 250 μm.
To quantitatively compare the performance of the two analysis methods, receiver operator characteristic (ROC) curves were created (Fig. 4). These were compared by evaluating the area under the curve (AUC) which was 0.83 for the power law exponent and 0.87 for the logistic regression analysis indicating similar performances. The overall accuracy of 76% (power law exponent) and 80% (logistic regression) for these two methods are reasonable but not sufficiently robust to serve as a basis for a diagnostic method where visual inspection can already achieve 70% accuracy. Upon studying Fig. 3, it is evident that each tissue type has a few misclassified pixels within areas that are mostly classified as correct.
Fig. 4.

ROC curves for the (a) power law exponent and (b) logistic regression analyses of DW spectra. Accuracy and AUC are similar with logistic regression showing slightly better performance.
In an effort to improve the overall accuracy, the images were spatially averaged by processing the raw interferometric data with an STFT and mean filtering in the lateral dimension. The resulting OCT images [Fig. 5 (a) and (b)] have noticeably degraded depth and lateral resolutions of 60 and 40 μm, respectively. Figure 5(c) shows the average spectrum obtained for all sites of each type using the STFT method. Figure 5(d) shows the distribution of the power law exponents for the two tissue types. The difference in the exponents was again statistically significant with the healthy tissue showing an average exponent of b = 6.0 compared to b = 0.9 for the burned tissue. Although the average exponents are not identical to those observed with the DW-processed data [Fig. 2(a)], the spectra are qualitatively similar, with the burned tissues again showing oscillatory features.
Fig. 5.

OCT images of (a) healthy and (b) burned tissues after STFT processing. (c) Average STFT spectra from healthy and burned sites. Data are shown compared to the best fit power law model. (d) The average power law exponents are significantly different (p<0.0001).
To compare the diagnostic utility of the STFT analysis, the OCT images were again color coded based on the power law exponent b [Fig. 6 (a) & (c)] or logistic regression predictor ς [Fig. 6 (b) & (d)]. The color coded images again show healthy and burned tissue with mostly light-beige and red coloring, respectively, but the colors are more uniform than what is seen in Fig. 3.
Fig. 6.
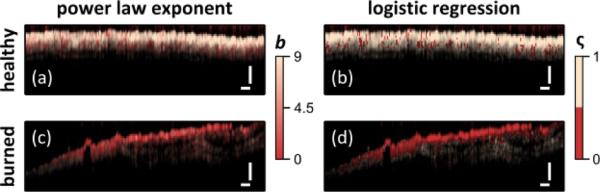
Diagnostic capability of STFT spectral analysis shown by color coding image based on power law exponent (a,c) or via logistic regression (b,d) for healthy (a,c) and burned (c,d) tissues. Scale bars = 250 μm.
To quantitatively compare the performance of the two analysis methods, ROC curves were again created (Fig. 7). The AUC values for these curves were sharply improved compared to those for the ROC curves in Fig. 4 with AUC = 0.95 for the power law exponent and 0.97 for logistic regression. The overall accuracy of 90% and 91% for these two methods were excellent and point to a potentially robust diagnostic method.
Fig. 7.

ROC curves for the (a) power law exponent and (b) logistic regression analyses of STFT spectra. Accuracy and AUC are higher than those associated with the DW analysis (Fig. 4).
Upon comparison, the STFT-based analysis performed significantly better than the DW-based analysis. This can be understood by comparing Fig. 2(b) with Fig. 5(d). By virtue of the larger spatial average, the width of the power-law-exponent distribution is reduced in the STFT analysis, producing greater separation even though the mean values were similar for both approaches. A recent analysis by Bosschaart et al. [25] similarly found that DW spectra were not as accurate when determining bulk tissue properties. Again, the spatial averaging serves to improve the fidelity of the spectral measurement. While the DW method can provide useful information related to bulk tissue properties, the approach was developed for assessing characteristic signatures of light scattered by single cellular particles [16] in an effort to detect early cancerous changes in epithelial tissues due to changes in nuclear morphology [17]. These signatures are not seen in STFT-processed OCT spectra due to the spatial and spectral averaging that are necessary.
We have shown that there are clear spectral changes between healthy and third-degree burned tissues that can be observed with spectroscopic OCT and that these changes can be used to discriminate tissue health in vivo in a mouse burn model. Future work will focus on differentiating between various degrees of burn injuries. We also note that some of the spectral changes seen here may not directly be applicable to burn assessment in humans. For example, the spectra of burned tissue [Fig. 2(a) and 5(c)] show oscillatory features reminiscent of the absorption spectra of adipose tissue [24]. However, reference absorption spectra are not generally available for mouse fat, burned or healthy. Further, the penetration depth of spectroscopic OCT may preclude use in clinically assessing the health of deeper human tissues. However, new techniques under development with improved penetration depth [26, 27] may benefit from the spectral analysis presented herein.
Acknowledgments
This work was supported by the National Science Foundation (CBET-1039562), the National Institutes of Health (1R21EY023451), the Research School+, the European Space Agency, and the RWTÜV Stiftung. AW acknowledges support from an innovative ophthalmic research award from Research to Prevent Blindness.
Full References
- 1.Kauvar DS, Wolf SE, Wade CE, Cancio LC, Renz EM, Holcomb JB. Burns sustained in combat explosions in Operations Iraqi and Enduring Freedom (OIF/OEF explosion burns) Burns : journal of the International Society for Burn Injuries. 2006;32:853–857. doi: 10.1016/j.burns.2006.03.008. [DOI] [PubMed] [Google Scholar]
- 2.Finkelstein E, Corso PS, Miller TR. The incidence and economic burden of injuries in the United States. Oxford University Press; 2006. [Google Scholar]
- 3.Jaskille AD, Ramella-Roman JC, Shupp JW, Jordan MH, Jeng JC. Critical review of burn depth assessment techniques: part II. Review of laser doppler technology. J Burn Care Res. 2010;31:151–157. doi: 10.1097/BCR.0b013e3181c7ed60. [DOI] [PubMed] [Google Scholar]
- 4.Sainsbury DC. Critical evaluation of the clinimetrics of laser Doppler imaging in burn assessment. J Wound Care. 2008;17:193–194. 196–198, 200. doi: 10.12968/jowc.2008.17.5.29155. [DOI] [PubMed] [Google Scholar]
- 5.Talbert RJ, Holan SH, Viator JA. Photoacoustic discrimination of viable and thermally coagulated blood using a two-wavelength method for burn injury monitoring. Phys Med Biol. 2007;52:1815. doi: 10.1088/0031-9155/52/7/004. [DOI] [PubMed] [Google Scholar]
- 6.Cross KM, Leonardi L, Payette JR, Gomez M, Levasseur MA, Schattka BJ, Sowa MG, Fish JS. Clinical utilization of near-infrared spectroscopy devices for burn depth assessment. Wound Repair and Regeneration. 2007;15:332–340. doi: 10.1111/j.1524-475X.2007.00235.x. [DOI] [PubMed] [Google Scholar]
- 7.Afromowitz MA, Callis JB, Heimbach DM, DeSoto LA, Norton MK. Multispectral imaging of burn wounds: a new clinical instrument for evaluating burn depth. Biomedical Engineering, IEEE Transactions on. 1988;35:842–850. doi: 10.1109/10.7291. [DOI] [PubMed] [Google Scholar]
- 8.Morgner U, Drexler W, Kärtner FX, Li XD, Pitris C, Ippen EP, Fujimoto JG. Spectroscopic optical coherence tomography. Opt. Lett. 2000;25:111–113. doi: 10.1364/ol.25.000111. [DOI] [PubMed] [Google Scholar]
- 9.Leitgeb R, Wojtkowski M, Kowalczyk A, Hitzenberger CK, Sticker M, Fercher AF. Spectral measurement of absorption by spectroscopic frequency-domain optical coherence tomography. Opt Lett. 2000;25:820–822. doi: 10.1364/ol.25.000820. [DOI] [PubMed] [Google Scholar]
- 10.Robles FE, Wilson C, Grant G, Wax A. Molecular imaging true-colour spectroscopic optical coherence tomography. Nature Photonics. 2011;5:744–747. doi: 10.1038/nphoton.2011.257. [DOI] [PMC free article] [PubMed] [Google Scholar]
- 11.Robles FE, Chowdhury S, Wax A. Assessing hemoglobin concentration using spectroscopic optical coherence tomography for feasibility of tissue diagnostics. Biomed. Opt. Express. 2010;1:310–317. doi: 10.1364/boe.1.000310/. [DOI] [PMC free article] [PubMed] [Google Scholar]
- 12.Lu C-W, Lee C-K, Tsai M-T, Wang Y-M, Yang CC. Measurement of the hemoglobin oxygen saturation level with spectroscopic spectral-domain optical coherence tomography. Opt Lett. 2008;33:416–418. doi: 10.1364/ol.33.000416. [DOI] [PubMed] [Google Scholar]
- 13.Jacob D, Shelton RL, Applegate BE. Fourier domain pump-probe optical coherence tomography imaging of Melanin. Opt Express. 2010;18:12399–12410. doi: 10.1364/OE.18.012399. [DOI] [PMC free article] [PubMed] [Google Scholar]
- 14.Fleming CP, Eckert J, Halpern EF, Gardecki JA, Tearney GJ. Depth resolved detection of lipid using spectroscopic optical coherence tomography. Biomed Opt Express. 2013;4:1269–1284. doi: 10.1364/BOE.4.001269. [DOI] [PMC free article] [PubMed] [Google Scholar]
- 15.Robles FE, Wax A. Separating the scattering and absorption coefficients using the real and imaginary parts of the refractive index with low-coherence interferometry. Opt Lett. 2010;35:2843–2845. doi: 10.1364/OL.35.002843. [DOI] [PMC free article] [PubMed] [Google Scholar]
- 16.Robles FE, Wax A. Measuring morphological features using light-scattering spectroscopy and Fourier-domain low-coherence interferometry. Opt Lett. 2010;35:360–362. doi: 10.1364/OL.35.000360. [DOI] [PMC free article] [PubMed] [Google Scholar]
- 17.Robles FE, Zhu Y, Lee J, Sharma S, Wax A. Detection of early colorectal cancer development in the azoxymethane rat carcinogenesis model with Fourier domain low coherence interferometry. Biomed. Opt. Express. 2010;1:736–745. doi: 10.1364/BOE.1.000736. [DOI] [PMC free article] [PubMed] [Google Scholar]
- 18.De Boer J, Srinivas S, Malekafzali A, Chen Z, Nelson J. Imaging thermally damaged tissue by polarization sensitive optical coherence tomography. Opt Express. 1998;3:212–218. doi: 10.1364/oe.3.000212. [DOI] [PubMed] [Google Scholar]
- 19.Jiao S, Yu W, Stoica G, Wang LV. Contrast mechanisms in polarization-sensitive Mueller-matrix optical coherence tomography and application in burn imaging. Appl Optics. 2003;42:5191–5197. doi: 10.1364/ao.42.005191. [DOI] [PubMed] [Google Scholar]
- 20.Pierce MC, Sheridan RL, Hyle Park B, Cense B, de Boer JF. Collagen denaturation can be quantified in burned human skin using polarization-sensitive optical coherence tomography. Burns : journal of the International Society for Burn Injuries. 2004;30:511–517. doi: 10.1016/j.burns.2004.02.004. [DOI] [PubMed] [Google Scholar]
- 21.Iftimia N, Ferguson RD, Mujat M, Patel AH, Zhang EZ, Fox W, Rajadhyaksha M. Combined reflectance confocal microscopy/optical coherence tomography imaging for skin burn assessment. Biomed Opt Express. 2013;4:680–695. doi: 10.1364/BOE.4.000680. [DOI] [PMC free article] [PubMed] [Google Scholar]
- 22.Robles F, Graf RN, Wax A. Dual window method for processing spectroscopic optical coherence tomography signals with simultaneously high spectral and temporal resolution. Opt. Express. 2009;17:6799–6812. doi: 10.1364/oe.17.006799. [DOI] [PMC free article] [PubMed] [Google Scholar]
- 23.Bayliss J, DeLaRosa S, Wu JF, Peterson JR, Eboda ON, Su GL, Hemmila M, Krebsbach PH, Cederna PS, Wang SC, Xi CW, Levi B. Adenosine Triphosphate Hydrolysis Reduces Neutrophil Infiltration and Necrosis in Partial-Thickness Scald Burns in Mice. Journal of Burn Care & Research. 2014;35:54–61. doi: 10.1097/BCR.0b013e31829b36d6. [DOI] [PMC free article] [PubMed] [Google Scholar]
- 24.Jacques SL. Optical properties of biological tissues: a review. Phys Med Biol. 2013;58:R37–R61. doi: 10.1088/0031-9155/58/11/R37. [DOI] [PubMed] [Google Scholar]
- 25.Bosschaart N, van Leeuwen TG, Aalders MCG, Faber DJ. Quantitative comparison of analysis methods for spectroscopic optical coherence tomography. Biomed Opt Express. 2013;4:2570–2584. doi: 10.1364/BOE.4.002570. [DOI] [PMC free article] [PubMed] [Google Scholar]
- 26.Matthews TE, Giacomelli MG, Brown WJ, Wax A. Fourier domain multispectral multiple scattering low coherence interferometry. Appl Optics. 2013;52:8220–8228. doi: 10.1364/AO.52.008220. [DOI] [PubMed] [Google Scholar]
- 27.Matthews TE, Medina M, Maher JR, Levinson H, Brown WJ, Wax A. Deep tissue imaging using spectroscopic analysis of multiply scattered light. Optica. 2014;1:105–111. [Google Scholar]