Abstract
An in-depth understanding of dynamic interfacial self-assembly processes is essential for a wide range of topics in theoretical physics, materials design, and biomedical research. However, direct monitoring of such processes is hampered by the poor imaging contrast of a thin interfacial layer. We report in situ imaging technology capable of selectively highlighting self-assembly at the phase boundary in real time by employing the unique photophysical properties of aggregation-induced emission. Its application to the study of breath-figure formation, an immensely useful yet poorly understood phenomenon, provided a mechanistic model supported by direct visualization of all main steps and fully corroborated by simulation and theoretical analysis. This platform is expected to advance the understanding of the dynamic phase-transition phenomena, offer insights into interfacial biological processes, and guide development of novel self-assembly technologies.
Spontaneous interfacial self-assembly processes, which have been captivating minds of scientists and artists for decades because of their ubiquity, fundamental roles in nature, and aesthetic appeal, still remain a topic of active research.[1] Numerous novel materials and applications have been explored, and deep insights into the mechanisms of self-assembly have been gained from the examination of static systems. Now, the greatest challenges, and opportunities, lie in the study of the highly dynamic interfacial layers.[2] Continuous interaction between phases and the dynamic nature of interfacial transformations, however, make study of such systems challenging, requiring access to both temporal and spatial dimensions. A number of attempts have been made to directly examine interfacial phenomena in real time by microscopy-based techniques,[3] but all the methodologies reported to date suffer from their own intrinsic limitations. Development of a versatile technology capable of monitoring the interfacial dynamic self-assembly processes in real time promises to open new opportunities for interrogation of an “interfacial world”.
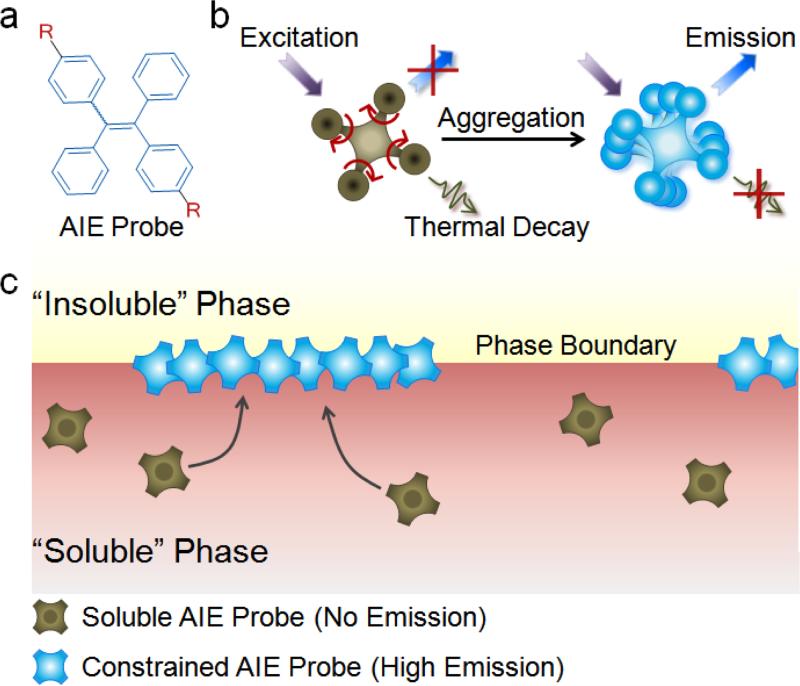
Herein, we present a real-time fluorescence imaging platform that employs the unique phenomenon of aggregation-induced emission (AIE) for direct visualization of the dynamic interfacial evolution. Conventional fluorescent probes are, in general, poorly suited for the interrogation of fine interfaces because of nonselective fluorescence emission from both the phase boundary as well as the bulk solution. In contrast, AIEgens,[4] such as tetraphenylethene (TPE) and its derivatives (Figure 1a),[5] are nonluminescent when dissolved in the solution and become highly emissive when aggregated.[6] Such behavior stems from the competition between radiative and nonradiative energy dissipation mechanisms (Figure 1b). As the AIE mechanism of restriction of intramolecular rotation (RIR) occurs at the level of individual AIE-active units, quenched-to-emissive state transitions are solely defined by the characteristics of AIEgens regardless of the size of aggregates or proximity of AIE-active groups, thus facilitating high-contrast imaging of the thin phase-boundary layer with conventional fluorescence microscopy (Figure 1c) and providing a selective tool for real-time monitoring of interfacial dynamic self-assembly.
Figure 1.
a) Chemical structure of tetraphenylethene (TPE)-based AIE probe. R is a side group of an AIEgen that conveys selective solubility of the probe in one phase of an interfacial system. b) Emission enhancement by the restriction of intramolecular rotation (RIR) mechanism in AIE-active probes. When fully dissolved, the TPE phenyl rings rotate freely, dissipating the energy upon excitation in the form of heat and thus quenching fluorescence. Phase transition and probe aggregation, in turn, activate the RIR process of the phenyl rings, promoting energy dissipation by emission and dramatically increasing fluorescence intensity of AIEgens. c) Schematic of AIE-based imaging technology for real-time monitoring of the interfacial processes. In the “soluble ” phase, AIE-active probes remain non-emissive under external excitation. At the phase boundary, in contrast, probes meet the “insoluble” phase and exhibit high fluorescence because of the RIR process.
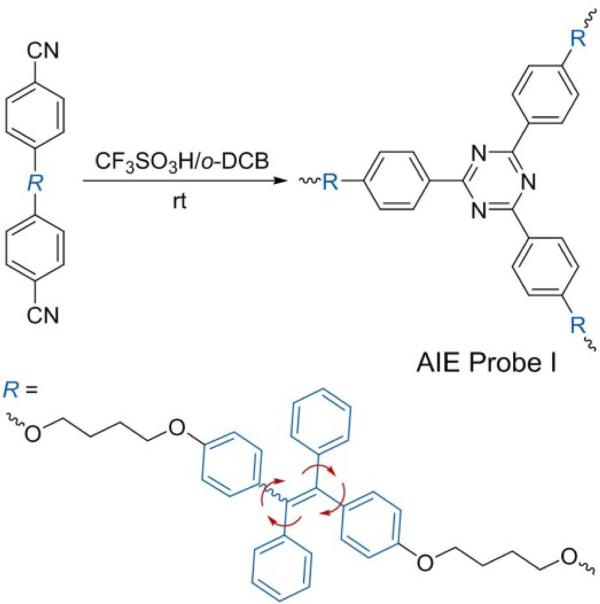
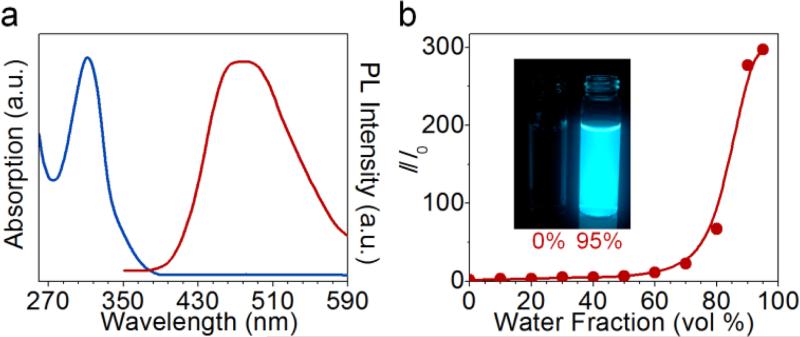
For this study, a hyperbranched polymer PI consisting of TPE incorporated into the repeating units of polytriazine (see Figure S1 in the Supporting Information) was synthesized by the polycyclotrimerization of a TPE-containing dinitrile (Scheme 1).[7] Being hydrophobic, PI dissolved well in organic solvents and lacked photoluminescence, but formed fluorescent nanoaggregates[5] with characteristic absorption and emission profiles when exposed to an aqueous environment (Figure 2). The photoluminescence intensity was linearly proportional to the PI concentration in the range 0.1-7 mg mL-1 (Figure^^S2), thus demonstrating the direct relationship between the number of TPE units and the amount of fluorescence produced.
Scheme 1.
Synthesis of the hydrophobic TPE-based hyperbranched polymeric AIE-active probe PI by polycyclotrimerization. TPE=tetraphenylethene, o-DCB=o-dichlorobenzene.
Figure 2.
a) Absorbance (solid line) and photoluminescence (PL) spectra (dashed line) of PI nanoaggregates. b) Relationship between the PL intensity and the fraction of an “insoluble” solvent (water) in THF/water mixture. I=fluorescence intensity of PI in THF/water mixtures. I0=fluorescence intensity of PI in THF. PI concentration: 1 mg mL-1. Excitation wavelength: 310 nm. Inset: PI solutions in THF (left) and THF/water mixture with 95% water (right) under UV illumination.
Fast and sensitive transition of TPE to a highly emissive state enabled use of PI and a hydrophilic TPE derivative PII for selective real-time imaging of dynamic interfacial processes in liquid/liquid systems, such as oil-in-water microemulsion[8] (Figure S3 in the Supporting Information), and liquid/air systems, such as coffee-ring formation[9] (Figures S4 and S5). In comparison to conventional AIE-inactive fluorophores, the contrast was dramatically enhanced with these AIE probes because of selective activation of fluorescence by RIR at the interface.
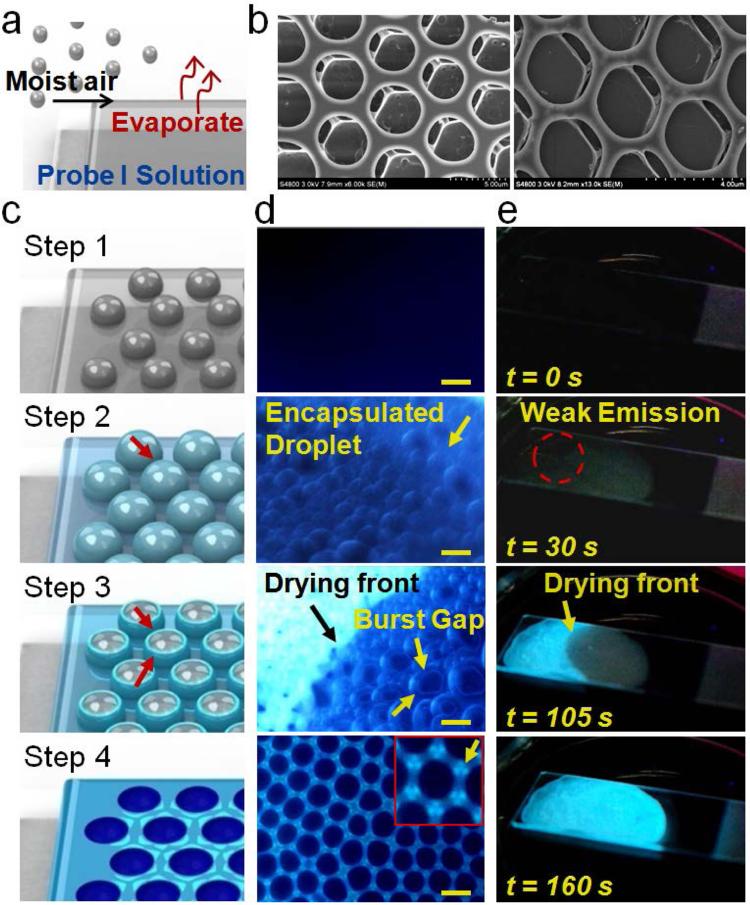
We took advantage of the new capabilities provided by the AIE imaging platform, and applied this technique to untangling one of the most intriguing interfacial self-assembly puzzles, namely breath-figure formation.[10] Despite being widely used in design of new materials, the mechanism of breath-figure formation remains unclear,[11] with optical microscopy producing only limited insights, mostly because of poor imaging contrast.[12] AIE-active probe PI, in turn, could serve as both the structural material for breath figure pattern fabrication and an optical probe for high-contrast monitoring of the self-assembly process. Casting of a chloroform solution of PI onto a glass slide under humid airflow (Figure 3a) produced characteristic honeycomb-like porous arrays that could be examined with SEM (Figure 3b and Figure S6 in the Supporting Information) as well as optical microscopy (Figure S7), thus confirming the ability of PI to form highly fluorescent breath figures.
Figure 3.
a) Schematic of breath-figure formation. b) Representative SEM images of the ordered porous PI film formed by breath figures. c) Schematic of the four main steps of breath figures observed with in situ AIE imaging. d) Fluorescence microscopy images taken during the breath-figure formation corresponding to steps 1-4. The inset in step 4 shows an enlarged ordered cloverlike fluorescent pattern (yellow arrow). Scale bar: 3 μm. e) Representative progressing frames showing macroscopic evolution of emission signal during steps 1-4 of the breath-figure formation process.
The four main steps in breath-figure formation (Figure 3c) were elucidated by monitoring AIE signal development by fluorescence microscopy (Figure 3d) and macroscopically under a UV lamp (Figure 3e). In step 1, small water droplets (200-300 nm, Figure S8a in the Supporting Information) nucleated on the surface of PI/chloroform solution; yet, no fluorescence could be observed (Figure S8b), thus suggesting that PI was well dissolved during this period, and no detectable PI aggregates at the water/oil interface had yet formed. However, in step 2, water droplets with weak fluorescence started appearing when the droplets stopped growing and finished assembling into ordered arrays. It is hypothesized that during step 1 water droplets form partial water/oil and water/air interfaces and undergo simultaneous growth and self-assembly into ordered hexagonal arrays on the PI/chloroform surface. Growing surface energy of the water/air interface then leads to spontaneous encapsulation of water droplets with a thin PI/chloroform layer in step 2 followed by fast chloroform evaporation, enrichment, and aggregation of PI at the interface,[13] and development of a weak AIE fluorescence signal around water droplets (step 2 in Figure 3c,d,e). Additionally, AIE imaging results provide direct evidence for a potential mechanism underlying size uniformity of pores, thus suggesting that a thin polymer film featuring outstanding surfactant-like properties[8] likely stabilizes the shape and size of water droplets and prevents further droplet growth and coalescence.
In step3, upon further evaporation of the chloroform, the film encapsulated on water droplets started bursting in different directions (step 3 in Figure 3c,d,e). Meanwhile, highly emissive material enrichment around the edges of bursting gaps could be observed (Figure S8c in the Supporting Information), thus implying deposition of PI to the liquid/air interface. Hypothetically, during the initial stage of step 3, faster solvent evaporation at the gap boundary could result in local drop in temperature and create Marangoni flows within the PI/chloroform layer encapsulating water droplets that preferentially carried PI probes to the edges of bursting gaps, to yield faster local enhancement of PI fluorescence.[14] Following gap expansion and pore formation, evaporation of the solvent between the water droplets likely contributed to further PI enrichment around the pores of forming breath figure through an analogous mechanism.
Finally, in step 4, when the water has completely evaporated, ordered highly emissive porous arrays were formed (Step 4 in Figure 3c,d,e, and Figure S8d in the Supporting Information). Interestingly, “cloverlike ” fluorescent patterns could be observed around the neighboring pores, which is consistent with the notion of preferential PI deposition within the junction of three nearby droplets. Notably, similar breath figures could be prepared with a linear AIE- active polymer PIII (Figure S9a) and with PI-doped high-molecular-weight polystyrene (Figure S9b).
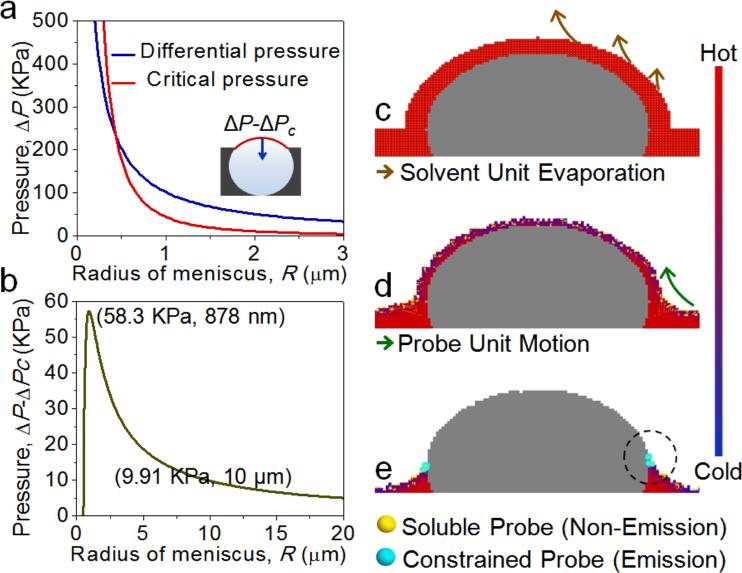
AIE imaging highlighted the critical role of water droplet encapsulation by a thin polymer layer followed by its rupture and expansion in breath figure self-assembly. To gain a deeper understanding of these results, we performed a basic theoretical analysis and computer simulation. Analysis of the polymer film stability and rupture was based on the hypothesis that following thin-film encapsulation of the water droplets, a differential pressure ΔP induced by the surface tension of the top layer across the meniscus developed.[15] In order for the film to rupture and breath figure pores to form, ΔP must exceed the critical differential pressure ΔPc of the polymer film.[16] Taking literature values for a commonly used breath figure polymer, polystyrene (PS),[13,17] model curves of ΔP versus R and ΔPc versus R were constructed (Figure S10a in the Supporting Information), where R was the radius of encapsulated water droplets. Examination of (ΔP-ΔPc) versus R relationship (Figure S10b) showed that the bursting pressure reached its maximum for droplets with a radius of about 880 nm and dropped rapidly with increasing droplet size, thus providing a potential explanation for why it is extremely challenging to prepare breath figures with pore radius less than 500 nm or larger than 10 μm.[18]
A computer simulation using the Monte Carlo method was employed to gain insights into inhomogeneous PI enrichment around the gap edges during the gap bursting process. Water, chloroform, and air were considered as the constituents of simulation cells, which “walk ” across the map through four processes: evaporation, tension, gravity, and thermal motion (Figure S11-S13, Table S1, and Movie S1 in the Supporting Information). Simulation showed that the thickness of the chloroform film (Figure 4, red units) on water droplets (Figure 4, gray units) decreased continuously during the solvent evaporation. Then, the combined effect of four processes led to a PI/chloroform layer burst followed by a continuous increase in the gap size. Faster evaporation produced a relative decrease in temperature at the surface and edge of the burst gap (Figure 4, blue pixels), which, in turn, created a temperature gradient and an associated capillary flow inside the solvent (chloroform) units, thus transporting the AIE probe units to the edge of the bursting gap. The AIE probe units homogenously distributed inside the solvent units (yellow), accumulated on the edge of the gap, thereby increasing the localized probe concentration. When the concentration exceeded the threshold (70 probe units), the AIE effect was activated (as indicated by cyan color). Thus, simulation results highlighted the profound role of the combined effect of evaporation, tension, gravity, and thermal motion in accumulation of material at the burst gap edge and, eventually, around the breath figure pores.
Figure 4.
Simulation of the dynamic bursting process. Fast solvent evaporation from the PI/chloroform layer encapsulating water droplets (a) leads to local temperature drop and induced capillary flow toward this region (b), eventually resulting in PI probe enrichment, aggregation, and emission around the edges of the bursting gap (c).
In conclusion, a simple and versatile AIE imaging platform has been developed for the monitoring of various interfacial dynamic self-assembly phenomena. A series of complex interfacial processes, including microemulsion, coffee-ring, and breath figure evolution, have been directly visualized by the AIE-active probes in real time. Taken together with theoretical modeling and simulation, AIE imaging results have provided, for the first time, direct evidence for main steps in the formation of breath figures. In comparison to conventional real-time imaging modalities, AIE imaging technology is simple yet highly specific and sensitive, offering a clear view into the “interfacial world” with ultralow background signal. We envision that AIE imaging platform will become a powerful tool for advancing a deeper understanding of the dynamic phase-transition phenomena, offering new insights into complex biological processes, and guiding development of novel self-assembly technologies.
Supplementary Material
Footnotes
This work was partially supported by the key project of the Ministry of Science and Technology of China (2013CB834702); the National Science Foundation of China (21222402 and 21174120); the Research Grants Council of Hong Kong (604711, 602212, and HKUST2/CRF/10). A.J.Q. and B.Z.T. thank the support from Guangdong Innovative Research Team Program (201101C0105067115), and P.Z thanks the National Cancer Institute for a T32 fellowship (T32A138312). We are also grateful to Dr. L.S. Wan and Prof. Z.K. Xu at Zhejiang University for discussions on breath figures.
Supporting information for this article is available on the WWW under http://dx.doi.org/10.1002/anie.201408757.
References
- 1.a Shetty AS, Fischer PR, Stork KF, Bohn PW, Moore JS. J. Am. Chem. Soc. 1996;118:9409–9414. [Google Scholar]; b Wang S, Kappl M, Liebewirth I, Müller M, Kirchhoff K, Pisula W, Müllen K. Adv. Mater. 2012;24:417–420. doi: 10.1002/adma.201103057. [DOI] [PubMed] [Google Scholar]; c Dragna JM, Pescitelli G, Tran L, Lynch VM, Anslyn EV, Di Bari L. J. Am. Chem. Soc. 2012;134:4398–4407. doi: 10.1021/ja211768v. [DOI] [PMC free article] [PubMed] [Google Scholar]
- 2.Whitesides GM, Grzybowski B. Science. 2002;295:2418–2421. doi: 10.1126/science.1070821. [DOI] [PubMed] [Google Scholar]
- 3.a Cui M, Emrick T, Russell TP. Science. 2013;342:460–463. doi: 10.1126/science.1242852. [DOI] [PubMed] [Google Scholar]; b Mai Y, Zhou Y, Yan D. Small. 2007;3:1170–1173. doi: 10.1002/smll.200600733. [DOI] [PubMed] [Google Scholar]; c Ritchie C, Cooper GJ, Song Y-F, Streb C, Yin H, Parenty AD, MacLaren DA, Cronin L. Nat. Chem. 2009;1:47–52. doi: 10.1038/nchem.113. [DOI] [PubMed] [Google Scholar]; d Williamson M, Tromp R, Vereecken P, Hull R, Ross F. Nat. Mater. 2003;2:532–536. doi: 10.1038/nmat944. [DOI] [PubMed] [Google Scholar]; e Wilson EF, Miras HN, Rosnes MH, Cronin L. Angew. Chem. Int. Ed. 2011;50:3720–3724. doi: 10.1002/anie.201006938. [DOI] [PubMed] [Google Scholar]; Angew. Chem. 2011;123:3804–3808. [Google Scholar]
- 4.a Luo J, Xie Z, Lam JWY, Cheng L, Chen H, Qiu C, Kwok HS, Zhan X, Liu Y, Zhu D, Tang BZ. Chem. Commun. 2001:1740–1741. doi: 10.1039/b105159h. [DOI] [PubMed] [Google Scholar]; b Hong Y, Lam JW, Tang BZ. Chem. Commun. 2009:4332–4353. doi: 10.1039/b904665h. [DOI] [PubMed] [Google Scholar]; c Hong Y, Lam JW, Tang BZ. Chem. Soc. Rev. 2011;40:5361–5388. doi: 10.1039/c1cs15113d. [DOI] [PubMed] [Google Scholar]
- 5.a Mei J, Hong YN, Lam JWY, Qin AJ, Tang YH, Tang BZ. Adv. Mater. 2014;26:5429–5479. doi: 10.1002/adma.201401356. [DOI] [PubMed] [Google Scholar]; b Zhao Z, Lam JWY, Tang BZ. J. Mater. Chem. 2012;22:23726–23740. [Google Scholar]; c Hu RR, Leung NLC, Tang BZ. Chem. Soc. Rev. 2014;43:4494–4562. doi: 10.1039/c4cs00044g. [DOI] [PubMed] [Google Scholar]; d Qin AJ, Lam JWY, Tang BZ. Prog. Polym. Sci. 2012;37:182–209. [Google Scholar]; e Wang M, Zhang GX, Zhang DQ, Zhu DB, Tang BZ. J. Mater. Chem. 2010;20:1858–1867. [Google Scholar]
- 6.a Chen JW, Law CCW, Lam JWY, Dong YP, Lo SMF, Williams ID, Zhu DB, Tang BZ. Chem. Mater. 2003;15:1535–1546. [Google Scholar]; b Chi ZG, Zhang XQ, Xu BJ, Zhou X, Ma CP, Zhang Y, Liu SW, Xu J^R. Chem. Soc. Rev. 2012;41:3878–3896. doi: 10.1039/c2cs35016e. [DOI] [PubMed] [Google Scholar]; c Zhang JB, Xu B, Chen JL, Ma SQ, Dong YJ, Wang LJ, Li B, Ye L, Tian WJ. Adv. Mater. 2014;26:739–745. doi: 10.1002/adma.201303639. [DOI] [PubMed] [Google Scholar]; d Gu XG, Yao JJ, Zhang GX, Zhang C, Yan YL, Zhao YS, Zhang DQ. Chem. Asian J. 2013;8:2362–2369. doi: 10.1002/asia.201300451. [DOI] [PubMed] [Google Scholar]; e Li ST, Lin YC, Kuo SW, Chuang WT, Hong JL. Polym. Chem. 2012;3:2393–2402. [Google Scholar]; f Liu Y, Feng X, Shi JB, Zhi JG, Tong B, Dong YP. Chin. J. Polym. Sci. 2012;30:443–450. [Google Scholar]; g Huang J, Sun N, Dong YQ, Tang RL, Lu P, Cai P, Li QQ, Ma DG, Qin JG, Li Z. Adv. Funct. Mater. 2013;23:2329–2337. [Google Scholar]; h Deng SL, Chen TL, Chien WL, Hong JL. J. Mater. Chem. C. 2014;2:651–659. [Google Scholar]
- 7.Chan CY, Lam JW, Jim CK, Sung HH, Williams ID, Tang BZ. Macromolecules. 2013;46:9494–9506. [Google Scholar]
- 8.Nagarajan R. Langmuir. 1993;9:369–375. [Google Scholar]
- 9.a Bigioni TP, Lin X-M, Nguyen TT, Corwin EI, Witten TA, Jaeger HM. Nat. Mater. 2006;5:265–270. doi: 10.1038/nmat1611. [DOI] [PubMed] [Google Scholar]; b deGans BJ, Duineveld PC, Schubert US. Adv. Mater. 2004;16:203–213. [Google Scholar]; c Kajiya T, Kaneko D, Doi M. Langmuir. 2008;24:12369–12374. doi: 10.1021/la8017858. [DOI] [PubMed] [Google Scholar]
- 10.a Srinivasarao M, Collings D, Philips A, Patel S. Science. 2001;292:79–83. doi: 10.1126/science.1057887. [DOI] [PubMed] [Google Scholar]; b Widawski G, Rawiso M, Francois B. Nature. 1994;369:387–389. [Google Scholar]
- 11.a Bai H, Du C, Zhang A, Li L. Angew. Chem. Int. Ed. 2013;52:12240–12255. doi: 10.1002/anie.201303594. [DOI] [PubMed] [Google Scholar]; Angew. Chem. 2013;125:12462–12478. [Google Scholar]; b Bunz UHF. Adv. Mater. 2006;18:973–989. [Google Scholar]; c Heng L, Qin W, Chen S, Hu R, Li J, Zhao N, Wang S, Tang BZ, Jiang L. J. Mater. Chem. 2012;22:15869–15873. [Google Scholar]; d Stenzel MH, Barner-Kowollik C, Davis TP. J. Polym. Sci. Part A. 2006;44:2363–2375. [Google Scholar]; e Wan L-S, Zhu L-W, Ou Y, Xu Z-K. Chem. Commun. 2014;50:4024–4039. doi: 10.1039/c3cc49826c. [DOI] [PubMed] [Google Scholar]; f Sun H, Wu L. Prog. Chem. 2010;22:1784–1798. [Google Scholar]
- 12.a Karthaus O, Maruyama N, Cieren X, Shimomura M, Hasegawa H, Hashimoto T. Langmuir. 2000;16:6071–6076. [Google Scholar]; b Kuo C-T, Lin Y-S, Liu T-K, Liu H-C, Hung W-C, Jiang I-M, Tsai M-S, Hsu C-C, Wu C-Y. Opt. Express. 2010;18:18464–18470. doi: 10.1364/OE.18.018464. [DOI] [PubMed] [Google Scholar]; c Pitois O, Francois B. Eur. Phys. J. B. 1999;8:225–231. [Google Scholar]
- 13.Guillen GR, Pan Y, Li M, Hoek EM. Ind. Eng. Chem. Res. 2011;50:3798–3817. [Google Scholar]
- 14.Deegan RD, Bakajin O, Dupont TF, Huber G, Nagel SR, Witten TA. Nature. 1997;389:827–829. doi: 10.1103/physreve.62.756. [DOI] [PubMed] [Google Scholar]
- 15.Youngblood JP, McCarthy TJ. Macromolecules. 1999;32:6800–6806. [Google Scholar]
- 16.a Gao C, Leporatti S, Moya S, Donath E, Möhwald H. Langmuir. 2001;17:3491–3495. [Google Scholar]; b Wan L-S, Li J-W, Ke B-B, Xu Z-K. J. Am. Chem. Soc. 2012;134:95–98. doi: 10.1021/ja2092745. [DOI] [PubMed] [Google Scholar]
- 17.a Absolom DR, Neumann AW. Colloids Surf. 1987;30:25–45. [Google Scholar]; b Torres JM, Stafford CM, Vogt BD. Polymer. 2010;51:4211–4217. [Google Scholar]
- 18.a Barner-Kowollik C, Dalton H, Davis TP, Stenzel MH. Angew. Chem. Int. Ed. 2003;42:3664–3668. doi: 10.1002/anie.200351612. [DOI] [PubMed] [Google Scholar]; Angew. Chem. 2003;115:3792–3796. [Google Scholar]; b Bormashenko E, Musin A, Bormashenko Y, Whyman G, Pogreb R, Gendelman O. Macromol. Chem. Phys. 2007;208:702–709. [Google Scholar]; c Yabu H, Shimomura M. Chem. Mater. 2005;17:5231–5234. [Google Scholar]; d Zhu L-W, Wan L-S, Jin J, Xu Z-K. J. Phys. Chem. C. 2013;117:6185–6194. [Google Scholar]
Associated Data
This section collects any data citations, data availability statements, or supplementary materials included in this article.


