

Abstract
Tripartite motif 24 protein (TRIM24) is a plant homeodomain (PHD)/bromodomain histone reader, recently associated with poor overall survival of breast cancer patients. At a molecular level, TRIM24 is a negative regulator of p53 levels and a co-activator of estrogen receptor. However, the role of TRIM24 in breast tumorigenesis remains largely unknown. We used an isogenic human mammary epithelial cell (HMEC) culture model, derived from reduction mammoplasty tissue, and found that ectopic expression of TRIM24 in immortalized HMECs (TRIM24-iHMECs) greatly increased cellular proliferation and induced malignant transformation. Subcutaneous injection of TRIM24-iHMECs in nude mice led to growth of intermediate to high-grade tumors in 60-70% of mice. Molecular analysis of TRIM24-iHMECs revealed a glycolytic and tricarboxylic acid cycle gene signature, alongside increased glucose uptake and activated aerobic glycolysis. Collectively, these results identify a role for TRIM24 in breast tumorigenesis through reprogramming of glucose metabolism in HMECs, further supporting TRIM24 as a viable therapeutic target in breast cancers.
Keywords: TRIM24, Metabolism, HMEC, Breast, Cancer
INTRODUCTION
Recent studies indicate that specific members of the tripartite motif (TRIM) protein family, characterized by conserved amino (N)-terminal zinc-finger domains of a RING-type E3 ubiquitin ligase, B-boxes and coiled coil, are important regulators of carcinogenesis 1. Among these, we identified TRIM24, as a previously unknown E3-ubiquitin ligase of p53 in embryonic stem cells and breast cancer cell lines, and as a histone reader that activates estrogen-dependent genes associated with cellular proliferation and tumor development 2-4. Of note, we and others reported that high expression of TRIM24 is associated with poor prognosis and survival in breast cancer patients 4, 5. However, whether TRIM24 plays a causal role in malignant transformation of breast epithelial cells during breast tumor development and progression has yet to be studied. Further, the mechanisms involved in potential TRIM24-mediated breast tumor initiation and progression are unknown.
Dramatic shifts in metabolism have received a substantial amount of interest from investigators over the past decade and are considered a hallmark of cancer 6. Highly proliferative tumor cells undergo fundamental changes in metabolism and nutrient usage that result in their survival and progression, and metabolic transformation appears to be necessary for sustained cellular proliferation 7, 8. In most cases, metabolic transformation is glucose-dependent, with invasive cancers exhibiting increased aerobic glycolysis to meet increasing energy demand 9. Altered metabolic activity is crucial for uncontrolled proliferation of cancer cells, evasion of growth-inhibitory signals, cellular migration, and dissemination of metastatic cells into distant tissues 7. Although researchers have appreciated that epigenetic, oncogenic and tumor suppressor networks contribute to metabolic reprogramming of cancer cells 10, the key players involved in regulation of breast tumor metabolism and their role in tumorigenesis are poorly defined.
The transition of a normal cell to a malignant one is a multistep process 11. Therefore, to develop a timeline of TRIM24 deregulation during malignant transformation of human mammary epithelial cells and elucidate a role for TRIM24 in breast tumorigenesis, we used an isogenic HMEC culture model of transformation. These HMEC lines were originally derived from normal reduction mammoplasty tissue samples and, following exposure to various oncogenic agents, were previously characterized as representative of the stepwise in vivo process of breast tumorigenesis: normal finite lifespan cells (184D12), abnormal post-stasis (184B-7p12) finite lifespan cells, non-malignant immortalized cell lines (184A113) and malignantly transformed immortal (184AA214) cells, which have mutations that support anchorage independent growth (AIG). 13, 15-19 This HMEC system proved useful for identifying and reflecting the molecular events involved in the early stages of human breast tumorigenesis20. Here, we report that HMECs, transitioning from cells with finite lifespans to immortal and then malignantly transformed cells, exhibited gradual and increasing expression of endogenous TRIM24. Ectopic expression of TRIM24 potently increased proliferation of an immortalized HMEC (iHMEC) line, 184A1, and conferred malignant transformation, as judged by multiple criteria including growth of xenograft tumors. TRIM24 over expression promoted a glycolytic and tricarboxylic acid (TCA) cycle gene signature in these malignantly transformed iHMECs, which in turn activated glucose metabolic pathways in the cells. Taken together, our results reveal a role for TRIM24 in metabolic reprogramming associated with malignant transformation of normal mammary epithelial cells. To our knowledge, this is the first reported identification of TRIM24 as a major regulator of metabolic shifts in cancer cells, consistent with its correlation with poor overall survival of breast cancer patients.
RESULTS
Aberrant expression of TRIM24 during breast cancer progression
To determine whether TRIM24 expression in breast tissues was deregulated during breast cancer progression, we performed IHC-staining to detect TRIM24 protein expression in a human tissue microarray (BR2082, US Biomax) consisting of samples of normal breast tissue, atypical ductal hyperplasia, intraductal breast carcinoma, and invasive breast carcinoma. We detected low TRIM24 protein expression in normal breast tissue but high expression in atypical ductal hyperplasia and carcinoma (Fig. 1A), suggesting that TRIM24 expression is deregulated in breast cancer and likely early in progression. We then examined the expression of TRIM24 in 1008 breast cancer patients and 92 normal samples from The Cancer Genome Atlas – Breast invasive carcinoma (TCGA-BRCA) dataset. We found the TRIM24 was significantly up-regulated in breast invasive carcinoma patients (p-value: 1e-16, Fig 1B) and its expression in paired samples was greater than 1.5 fold in 40 out of 106 (37.8%) patients (Supp. Fig S1A).
Figure 1. Aberrant expression of TRIM24 during breast cancer progression.
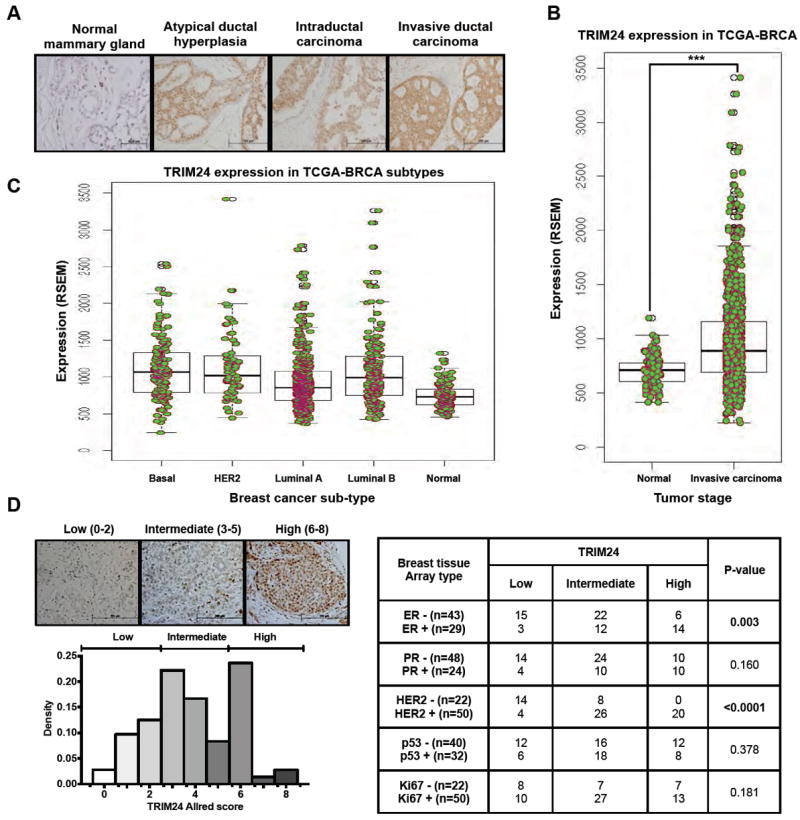
A, TRIM24-Immunohistochemical (IHC) staining was performed on a breast tissue array (BR2082, US Biomax) with tissues from different stages of breast cancer progression such as normal mammary gland, atypical ductal hyperplasia, Intraductal carcinoma and invasive ductal carcinoma, B, Distribution of TRIM24 expression (p-value:1.32e-07) in TCGA breast invasive carcinoma patients (1008) and normal tissues (92) and C, in PAM50 breast cancer subtypes (950, also see Supp. Fig. S1B for additional information). D, TRIM24 expression in breast tissue array (BR1503, US Biomax) by Allred score (left), Correlation of TRIM24 expression with ER, PR, HER2, p53, and Ki67 (right and bottom left, as assessed by IHC). ***p < 0.001.
Next, we assessed whether high levels of TRIM24 expression were associated with any specific breast cancer sub-type by using the TCGA-BRCA dataset and by performing TRIM24-IHC in an array of tissue samples from 72 breast cancer cases. In the TCGA-BRCA dataset, the PAM50 (Prediction analysis of Microarray – 50 genes expression signature21) breast-cancer subtypes showed different distribution in TRIM24 high expressing versus low expressing patients (p-value: 1.32e-07). The basal subtype (Odds ratio: 1.98, p-value: 3.8e-04) was significantly over-represented in the TRIM24 high expressing patients, followed by HER2 (Odds ratio: 1.78, p-value: 0.03) and Luminal B subtype (Odds ratio: 1.4, p-value: 0.047); whereas, the Luminal A subtype (Odds ratio: 0.43, p-value: 1.46e-08) was significantly under-represented (Fig. 1C). For details of the intersection of PAM50 and TRIM24-expression analysis, please see Supp. Fig. S1B. In the breast cancer tissue array (BR2082, US Biomax), TRIM24 expression stratified into three classes: low (score, 0-2), undetectable to low expression in few foci (25%); intermediate (score, 3-5), abundant foci with expression in nuclear and cytoplasmic compartments (47%); and high (score, 6-8), abundant foci with high expression in nuclei (28%, Fig.1D). Of note, chi-square testing (Supp. Table T1) identified a statistically significant positive correlation of TRIM24 expression with ErbB2 (HER2) expression (p < 0.0001) and ER (p = 0.003).
To estimate a timeline for deregulation of TRIM24 expression in breast cancer cells during malignant transformation, we used an isogenic HMEC model that facilitates assessment of molecular changes from the earliest stages of human breast carcinogenesis (Fig. 2A). In this model, the transformation of normal, finite lifespan HMECs to malignant cells requires overcoming two distinct senescence-associated barriers to immortality15, 20. The first, a stress-associated barrier called stasis, is overcome or bypassed in cultured HMECs by inactivation of the RB pathway, commonly through loss of p16ink4a expression12, 13, 16, 17. HMECs that escape stasis undergo further proliferation before encountering the second, more stringent barrier to immortality due to critically shortened telomeres 17. In rare instances, cells that gain telomerase expression escape this barrier and acquire immortal potential. Additional perturbations, such as insertional mutagenesis of p5314 or transduction of specific oncogenes22 can confer malignant properties to the immortally transformed cells. We found that endogenous TRIM24 expression increases at both RNA and protein levels early in the transformation process, after stasis is overcome (184B-7p12, 15), and continues to be highly expressed in the immortalized HMEC lines 184A113 and 184AA214(Fig. 2B, Supp. Fig. S2A). Strikingly, TRIM24 expression was even more highly up-regulated in MCF-7 cells (p53 wild type and ER positive), MDAMB231 (p53- mutant and triple negative) and SKBR3 (p53-mutant and HER2 positive) cultured lines of breast tumor-derived cells (Fig. 2B). Thus, the progressive stages of breast cancer in human patient tumor samples and immortalization of isogenic HMEC lines support a correlation between TRIM24 expression and loss of normal, cellular homeostasis.
Figure 2. Aberrant expression of TRIM24 in an isogenic HMEC model.
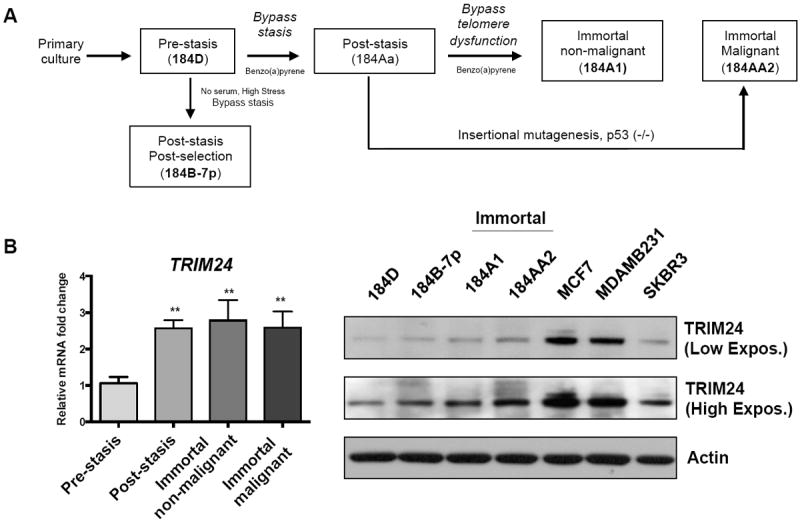
A, Schematic of the isogenic HMEC model showing transition of the cells from finite-lifespan cells to immortal and malignant cells. B, TRIM24 mRNA (left) and protein (right) expression in HMEC lines transitioning from “normal” finite-lifespan cells before stasis to immortal and malignant cells. Data are averages from three biological replicates ± standard deviation (SD). **p < 0.01.
TRIM24 drives HMEC transformation and survival
To answer the critical question of whether TRIM24 causes malignant transformation of HMECs, we induced ectopic expression of TRIM24 in the non-malignant, immortal 184A1 HMEC (iHMEC) line. Analysis of stable control- (FLAG-only) and TRIM24-expressing, lentiviral-transduced iHMEC pools from two independent experiments (TRIM24-1 and TRIM24-2) showed increased TRIM24 expression at both the RNA and protein level, compared to control pooled cells (Fig. 3A). Of note, we see a corresponding decrease in p53 protein expression in both TRIM24-1 and TRIM24-2 iHMECs suggesting that the ectopically expressed TRIM24 is enzymatically active 2. The growth rates of TRIM24-1 and TRIM24-2 iHMECs were significantly higher than control vector-transduced iHMECs, suggesting increased proliferation (by cell count see Fig. 3B; by XTT assay see Supp. Fig S2B). Consistent with this, both TRIM24-1 and TRIM24-2 iHMECs exhibited significant enrichment of cells in the S and G2/M phases of the cell cycle, compared to control cells enriched in G1, indicating rapid cell-cycle progression as a result of TRIM24 expression (Fig. 3C, for flow data see Supp. Fig. S3).
Figure 3. TRIM24 drives iHMEC transformation and survival.
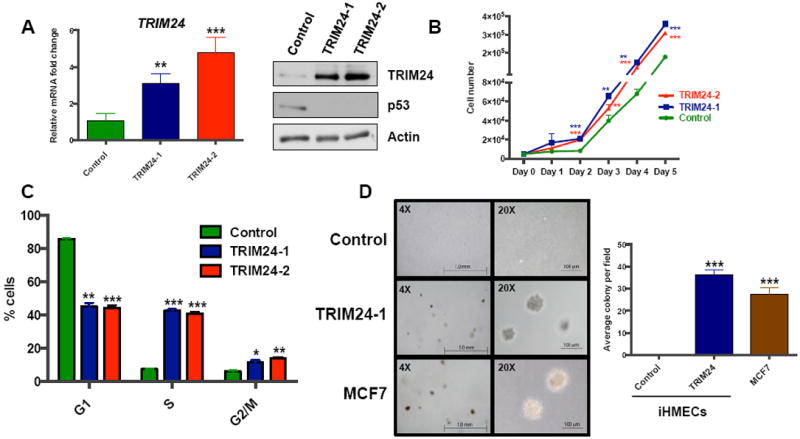
A, qRT-PCR analysis of TRIM24 mRNA and Immunoblot of TRIM24 and p53 in Control, TRIM24-1, and TRIM24-2 iHMECs. B, Cell proliferation analysis of Control, TRIM24-1, and TRIM24-2 iHMECs. C, Cell-cycle analysis of Control, TRIM24-1, and TRIM24-2 iHMECs. D, Anchorage-independent proliferation of Control iHMECs, TRIM24-1 iHMECs, and MCF-7 cells as determined using a soft agar colony formation assay (left) and quantification of the colonies per field ± SD (right). The data are averages from two replicates ± SD. *p < 0.05; **p < 0.01; ***p < 0.001.
To assess the oncogenic potential of TRIM24-iHMECs, we examined their ability to grow in an anchorage-independent manner in soft agar. Our control iHMEC line failed to form colonies in soft agar, whereas TRIM24-iHMECs formed colonies comparable in size and number to colonies of MCF-7 cells used as a positive control (Fig. 3D). Thus, ectopic expression of TRIM24 confers anchorage-independent growth to iHMECs, suggesting that TRIM24 over expression is sufficient to induce malignant transformation of immortal, nontumorigenic HMECs.
TRIM24 regulates multiple cancer-associated pathways and promotes a glycolytic and TCA-cycle gene signature in HMECs
To understand the mechanisms of TRIM24-induced transformation of iHMECs, we analyzed the gene expression profiles of 420 cancer-associated genes in TRIM24-iHMECs and control iHMECs using the nCounter analysis system. This analysis identified 233 genes (55% of the total) that were significantly changed (Supp. Fig. S4A) suggesting that TRIM24 mediated deregulated expression of cancer-relevant genes. Expression of 127 (30%) of these genes was up-regulated, whereas 106 genes (25%) were down-regulated (Supplementary Table T2). Unsupervised hierarchical clustering of the 233 differentially expressed genes clearly distinguished the control and TRIM24-iHMECs (Fig. 4A), supporting TRIM24-mediated transformation of iHMECs via effects on cancer-associated genes and pathways.
Figure 4. Regulation of multiple cancer-associated pathways in iHMECs by TRIM24.
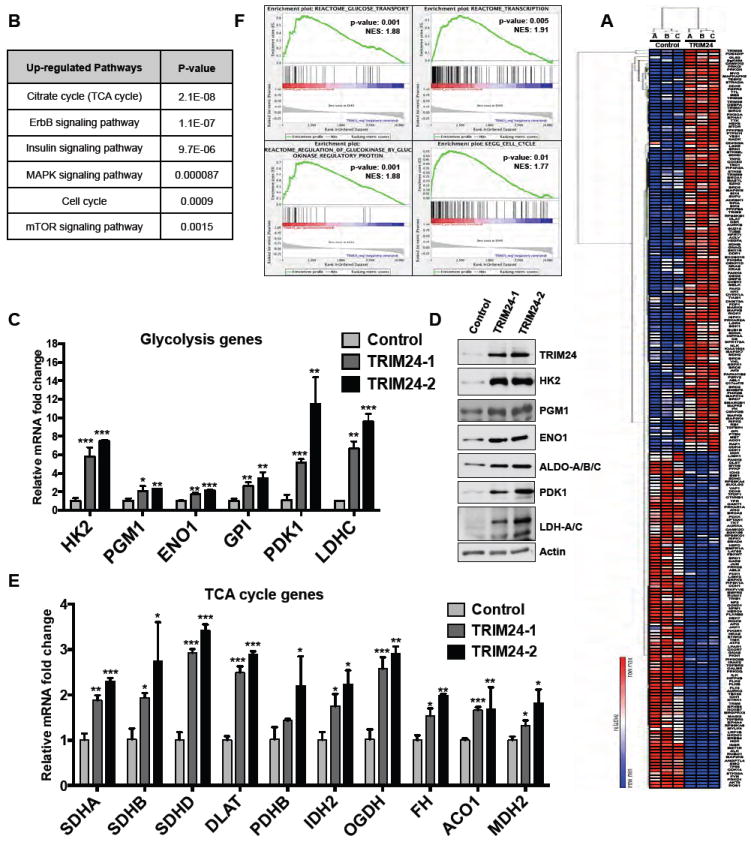
A, Heat map showing unsupervised hierarchical clustering of 233 differentially expressed genes in TRIM24-1 compared to the Control. B, Table showing the list of Upregulated pathways associated with Growth and Metabolism in TRIM24-iHMECs (for complete list of pathways please see Supp. T3 & T4). C, qRT-PCR analysis of Glycolytic genes in Control, TRIM24-1, and TRIM24-2 iHMECs showing upregulation of their expression. D, Immunoblot for various Glycolytic proteins in Control, TRIM24-1, and TRIM24-2 iHMECs. E, qRT-PCR analysis of TCA-cycle genes in Control, TRIM24-1, and TRIM24-2 iHMECs. The data are averages from three biological replicates ± SD. F, GSEA profiles of different pathways positively correlated to TRIM24 expression in TCGA-BRCA dataset. NES: Normalized Enrichment Score (See Supp. Table T5 for complete list of pathways.) *p < 0.05; **p < 0.01; ***p < 0.001.
TRIM24 induced expression of genes frequently altered in cancers, including PTEN, NRAS, KRAS and others that enrich amongst multiple cancer pathways (see Supplementary Tables T3 and T4). Additionally, TRIM24 up-regulated genes are significantly enriched (p≤0.05) in functional pathways that impact metabolism and growth, including the citrate cycle (TCA), ErbB, insulin, mitogen-activated protein kinase (MAPK) and mTOR signaling and cell cycle regulation (Fig. 4B). The highly significant pathways down-regulated by TRIM24 expression include TP53, representing a breadth of cancer types and pathways, as well as members of the ErbB pathway (see Supplementary Tables T3 and T4).
Analysis of individual glycolytic regulatory genes uncovered a glycolytic signature, specific to TRIM24-iHMECs versus control, marked by increased Hexokinase 2 (HK2), Phosphoglutamase 1 (PGM1), Enolase 1 (ENO1), Glucose-6-phosphate isomerase (GPI), Pyruvate dehydrogenase kinase 1 (PDK1), and Lactate dehydrogenase C (LDHC) mRNA expression (Fig. 4C). Gene expression changes were reflected in elevated HK2, PGM1, ENO1, PDK1, and LDHC protein expression, along with elevated Aldolase A (Aldo) protein (Fig. 4E). HK2 is a key enzyme involved in tight regulation of glycolysis via catalysis of individual, irreversible steps of glucose to glucose-6-phosphate and phosphoenolpyruvate to pyruvate 10.
Additionally, we found that expression of TCA-cycle genes was also higher in TRIM24-1 and TRIM24-2 iHMECs compared to control iHMECs. Succinate dehydrogenase complex, subunits A, B, and D (SDHA, SDHB and SDHD); dihydrolipoamide S-acetyltransferase (DLAT); isocitrate dehydrogenase 2 (IDH2); oxoglutarate dehydrogenase (OGDH); aconitase 1 (ACO1); malate dehydrogenase 2 (MDH2) and fumarate hydratase (FH) were among the TCA-associated genes with up-regulated expression (Fig.4E). Collectively, these results suggest that TRIM24 expression in iHMECs and subsequent transformation rely on increased glucose metabolism to meet the higher energy demands of increased growth and proliferation. This metabolic shift is marked by up-regulation of both glycolysis and expression of TCA-cycle genes.
To determine if these findings are relevant to human breast disease, we assessed whether TRIM24 expression correlated with altered expression of glucose metabolism genes in human breast tumors using TCGA-BRCA expression data and Geneset enrichment analysis (GSEA) on invasive breast carcinoma samples. Consistent with our in vitro findings, we found that the glucose transport pathway (p-value: 0.001, Normalized Enrichment Score (NES23): 1.88) was among the top 10 pathways positively correlated with TRIM24 expression (Fig. 4F). For a complete list of enriched pathways please see Supp. Table T5. Thus, TRIM24 has a significant and/or strong tendency to be co-expressed with genes that regulate glucose metabolism in breast tumors, supporting clinical relevance of our findings.
TRIM24 expression results in diverse metabolic states and increased glucose uptake in iHMECs
To determine the functional impact that TRIM24 expression has on cellular metabolism, we examined the two main bio-energetic pathways: oxidative phosphorylation (OXPHOS) and glycolysis. The rate of oxygen consumption by cells (OCR) is an indicator of mitochondrial respiration 24. Additionally, cells generate ATP via glycolysis (the conversion of glucose to lactate) independently of oxygen. Measurement of the lactic acid produced indirectly via protons released into the extracellular medium, which causes acidification of the medium surrounding the cells, provides the extracellular acidification rate or ECAR 24. Previous studies suggest that maintenance of high reserve mitochondrial capacity is a major factor that defines the vitality and/or survival of cancer cells 25.
To examine the bio-energetic phenotype of TRIM24-iHMECs and control iHMECs, we measured respiration, glycolysis rate and ATP turnover in the cells in response to pharmacological modulators of glucose metabolism (Fig. 5A and B). TRIM24-1 and TRIM24-2 iHMECs exhibited higher basal ECARs and OCRs compared to control iHMECs, suggesting increased basal glycolysis and mitochondrial respiration, respectively. We then metabolically perturbed the cells by treating the cells with compounds that shift the bio-energetic profiles of the cells. Oligomycin, an inhibitor of the mitochondrial ATP synthase, triggered a robust increase in lactic acid production (Fig. 5A), expressed as changes in ECAR levels in control and TRIM24-iHMECs. After uncoupling the proton gradient in the electron transport chain from oxidative phosphorylation by treating the cells with FCCP, TRIM24-1 and TRIM24-2 iHMECs had much higher reserve mitochondrial capacities than did control iHMECs (Fig. 5B). With these effects on metabolism, TRIM24-iHMECs are more responsive to stress under conditions of increased energy demand, compared to control iHMECs. Taken together, our findings suggest that ectopic expression of TRIM24 in iHMECs leads to increased basal glycolysis and basal mitochondrial respiration in parallel with an increased reserve of mitochondrial capacity.
Figure 5. TRIM24 leads to diverse metabolic states and increased glucose uptake.
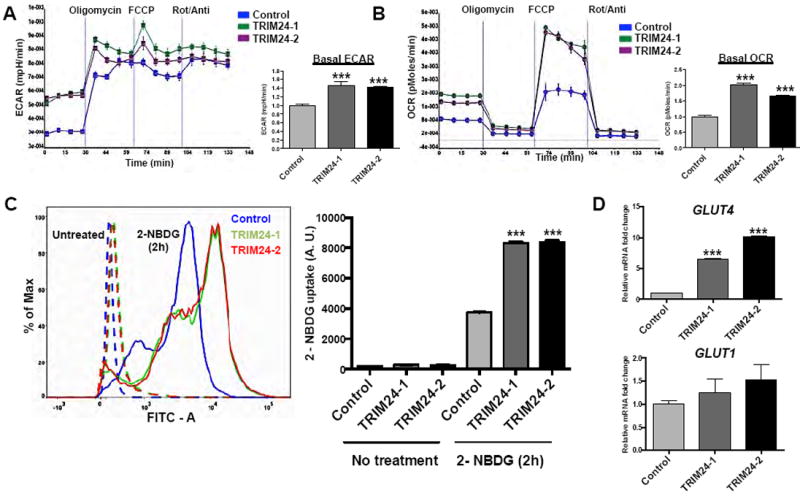
A and B, Extracellular Acidification rate (ECAR) and Oxygen Consumption Rate (OCR) in the presence of Oligomycin (1 μM), FCCP (Carbonylcyanide p-trifluoromethoxyphenylhydrazone, 500 nM) and Rot + Ant [Rotenone (1 μM) + Antimycin A (1 μM) measured using an XFe96 Extracellular Flux Analyzer (Sea-horse) for Control, TRIM24-1 and TRIM24 iHMECs. Both ECAR and OCR, were normalized using cell number. C, 2-NBDG (Florescent Glucose) uptake assay for Control, TRIM24-1, and TRIM24-2 iHMECs for 0 hours (untreated) and 2 hours. Florescent intensity curves of the 2-NBDG uptake are shown. D, qRT-PCR analysis of GLUT4 and GLUT1 mRNA expression in Control, TRIM24-1, and TRIM24-2 iHMECs. The data are averages from three biological replicates ± SD. ***p < 0.001.
Next, we studied whether the altered bio-energetic states of TRIM24-iHMECs result in increased glucose uptake by these cells. We compared control and TRIM24-iHMECs using the fluorescent 2-deoxyglucose analog (2-NBDG) staining. Our results indicated higher glucose uptake in both TRIM24-1 and TRIM24-2 iHMECs, compared to control iHMECs, further confirming the increased glycolytic state of TRIM24-transformed cells. (Fig. 5C, Supplementary Fig. S4B and S4C). Consistent with this, we observed significantly increased glucose transporter protein GLUT4 gene expression and measurable GLUT1 activation in TRIM24-iHMECs (Fig. 5D).
TRIM24 regulates expression of several genes associated with glucose metabolism in multiple breast cancer lines
We asked whether TRIM24-mediated regulation of glycolytic and TCA-associated genes is widespread amongst various cellular models of breast cancer by assessing multiple, established cell lines derived from breast tumors. Transient knock down of TRIM24 (siTRIM24) expression (Supp. Fig. S5) in MCF-7 (luminal), MDA-MB-231 (triple-negative), and SKBR3 (HER2-positive) indicated that depletion of TRIM24 down-regulated GLUT1, ACO1, IDH1, IDH2, PGM1, and OGDH expression in MCF-7 cells (Fig. 6A). Moreover, expression of GLUT1, ACO1, IDH1, and IDH2 was likewise decreased in MDA-MB-231 and SKBR3 cells treated with TRIM24 siRNA, suggesting that regulation of specific metabolic genes by TRIM24 is conserved, albeit to varying levels. We then checked for expression of the aforementioned metabolic genes in the isogenic panel of HMECs. Interestingly, we found that the endogenous expression pattern of ACO1 and IDH2 parallels endogenous TRIM24 expression and follows an upward trend along the transformation process, and OGDH and HK2 gain highest expression in the immortalized malignant HMECs (Fig. 6B). Taken together, these results suggest that TRIM24-mediated deregulation of glucose metabolism is a relatively global phenomenon that occurs in multiple breast cancer subtypes.
Figure 6. TRIM24 regulates expression of several genes associated with glucose metabolism in multiple breast cancer subtypes.
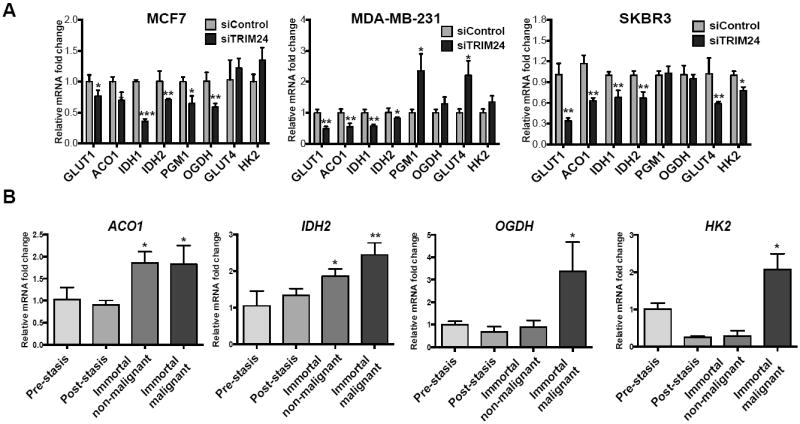
A, MCF-7, SKBR3 and MDA-MB-231 cells were transfected with siControl or siRNA against TRIM24 (siTRIM24) and harvested 48 hours later. Effect of TRIM24 knockdown on expression of a glucose metabolism gene panel (by qRT-PCR analysis) is shown. The data are averages from three replicates ± SD. *p < 0.05; **p < 0.01; ***p < 0.001. B, mRNA expression for ACO1, IDH2, OGDH and HK2 in HMEC lines transitioning from normal finite-lifespan pre-stasis cells to abnormal finite post-stasis, non-malignant immortal and malignant cells. The data are averages from three biological replicates ± SD. *p < 0.05; **p < 0.01.
TRIM24-HMECs form intermediate to high-grade tumors in nude mice
We assessed the impact of TRIM24 expression in iHMECs by in vivo xenograft formation. To this end, we injected female nude mice subcutaneously with either Control or TRIM24-iHMECs in 50% high concentration matrigel. TRIM24-1 and TRIM24-2 xenografts displayed significantly higher xenograft volume as compared to their control counterparts (Fig. 7A, Supp. Fig. S6A-C). H&E staining showed that xenograft tumors from TRIM24-iHMECs contained intermixed neoplastic epithelial cells and fibrous tissue in various proportions (Fig. 7B, left panel), whereas no epithelial cells were detected in xenografts from Control-iHMECs (Fig. S6D-E and 7C). TRIM24-expressing, neoplastic epithelial cells formed tumors that reflect a spectrum of low, intermediate and high-grade malignancy (Fig. 7B, left panel). The expression levels of TRIM24 in these tumors correlated with the malignancy grade, as shown by TRIM24-IHC (Fig. 7B, right panel). The grade of malignancy was based on the degree of cellular atypia, anysokaryosis and degree of vascularization (Supp. Fig. S6F-H, Supp. Table T6). Of note, about 60-70% of the tumors formed with TRIM24-iHMECs were either intermediate or high grade (Fig. 7D) with the proportion of epithelial cells in the subcutaneous tumors at 30-40% (Fig. 7C, Suppl. Fig. S6E), compared to xenografts of Control-iHMECs that consisted of fibrous tissue only (Fig. 7C, Supp. Fig. S6E, Supp. Table T6). Taken together, these data indicate that over expression of TRIM24 can confer in vivo tumorigenic growth of iHMECs.
Figure 7. TRIM24-HMECs form intermediate to high-grade tumors in nude mice.
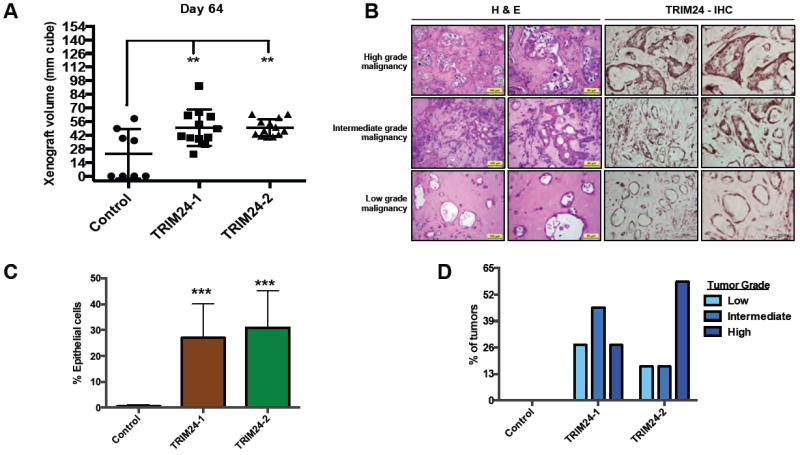
A, Tumor volume after 65 days post-injection of Control and TRIM24-iHMECs in nude mice. **p < 0.01 (all compared to Control). B, H&E Staining and TRIM24-IHC for various grades of tumors obtained from nude mice injected with TRIM24-iHMECs. C, Distribution of various grades of tumors from mice injected with either Control or TRIM24-iHMECs. D, Distribution of epithelial cells in tumors from mice injected with either Control or TRIM24-iHMECs.
DISCUSSION
Here, we show that expression of TRIM24 has a wide range of transcriptional and functional consequences, supporting transformation and tumor progression of HMECs. TRIM24-induced transformation of iHMECs is associated with deregulation of multiple cancer-associated pathways, including glucose metabolism, in correlation with breast tumorigenesis. To our knowledge, this is the first reported identification of TRIM24 as a major regulator of a metabolic shift in cancer cells. TRIM24 over expression induces malignant transformation of non-malignant, immortalized breast epithelial cells. When challenged to form tumors as subcutaneous xenografts in nude mice 26-28, we observed that 60-70% of tumors formed by TRIM24-iHMECs were scored as intermediate or high grade and contained 30-40% epithelial cells. Interestingly, many of these epithelial cells had unusually larger nuclei (high anysokaryosis) that correlate with increased TRIM24 expression.
Our gene expression profiling studies of TRIM24-overexpressing HMECs demonstrated marked enrichment of growth-stimulating pathways previously associated with breast cancer development and progression, such as the ErbB 29, insulin 30 and mitogen-activated protein kinase 31 signaling pathways, as well as glucose metabolism. Tumor cells have higher glucose metabolism and preferentially use glycolysis instead of oxidative phosphorylation (OXPHOS) for energy demand, referred to as the Warburg effect 32. The “aerobic” glycolysis switch has been reported for many tumor types, and studies of various proliferating cells link global metabolic reprogramming to cancer progression 33, 34. During aerobic glycolysis, glucose is converted to pyruvate and finally to lactate, which is exported and contributes to extracellular acidification 10. Consistent with this, we observed increased ECAR levels in HMECs overexpressing TRIM24, in addition to increased glucose uptake and a glycolytic gene signature. Preferential use of aerobic glycolysis offers several benefits to rapidly proliferating cancer cells with regards to both bio-energetic and biosynthetic demands 35.
Perhaps surprisingly, OXPHOS is also promoted by TRIM24 over expression in iHMECs, as shown by increased OCR levels and an altered TCA-cycle gene signature. This is somewhat contradictory to a Warburg effect, which predicts aerobic glycolysis in cancer cells as a result of permanent impairment in mitochondrial function. However, recent studies find that defects in mitochondrial OXPHOS are not common in spontaneous tumors 33, 36, and mitochondrial OXPHOS in most cancers remains intact 37-41. The existence of more than one tumor-specific metabolic state is becoming increasingly clear, and tumors exploit a variety of metabolic strategies that continue to be uncovered 42. For example, tumor cells can generate ATP via mitochondrial oxidation of fatty acids and amino acids, such as glutamine, when glucose is limited 42-44. A considerable number of cancers use OXPHOS or a mixture of glycolysis and OXPHOS as pathways of energy production 45.
Our study established TRIM24 as a key mediator of metabolic transformation, one that directly reduced p53 protein expression in iHMECs. Recent studies support functions of p53 in regulation of homeostasis in metabolism and redox balance by processes of mitochondrial oxidative phosphorylation, glycolysis, glutamine metabolism, lipid metabolism, and antioxidant defense 10. Additionally, aberrant expression of TRIM24 may disrupt cellular homeostasis, as a result of TRIM24 epigenetic functions 2-4. Crosstalk between epigenetic regulation, metabolic reprogramming and tumor progression has been highlighted by recent reports: HK2 and fructose-1, 6- bisphosphatase (FBP1), enzymes with opposing roles in glycolysis, are epigenetically regulated by promoter demethylation and methylation, respectively46, 47. Histone acetyl transferases acetylate pyruvate kinase M2 isoform (PKM2) at K305 to promote PKM2 degradation in a glucose-dependent manner48. IDH1 and IDH2, which catalyze conversion of isocitrate to α-KG, are frequently mutated in >75% of gliomas and >20% acute myeloid leukemia49 and induce novel catalytic products, e.g. 2-hydroxyglutarate (2-HG). 2-HG inhibits the activity of α-KG/Fe2+-dependent dioxygenases, including epigenetic modifiers such as histone demethylases (HDMs) and the ten eleven translocation protein 2 (TET2)49.
Major shifts in metabolism are universally accepted as a hallmark of cancer cells 11. Nevertheless, a lingering question in the field of cancer metabolism is whether this metabolic alteration contributes to tumorigenesis or is simply a byproduct of tumorigenesis. Given the unique role of TRIM24 in regulating metabolic reprogramming in concert with induced transformation, as shown in the present study, this regulation may be a driver event in breast tumorigenesis rather than simply a byproduct. More studies are warranted to delineate the complete mechanisms of TRIM24-mediated breast tumorigenesis, as well as the functional roles of TRIM24 in different breast cancer subtypes. Nevertheless, our findings emphasize the role of TRIM24, as a potential oncogene capable of transforming HMECs, and highlight the potential therapeutic benefit of inhibiting TRIM24 activity in breast cancer patients.
MATERIALS AND METHODS
Cell culture
Previously established HMEC cultures, 184D (normal pre-stasis12), 184B-7p (abnormal, post-stasis12), 184A1 (Immortal non-malignant13) and 184AA2 (Immortal malignant14) were cultured in M87A medium with 0.1% AlbuMAX bovine serum albumin (Invitrogen) and 0.1 nmol/L oxytocin (Bachem) as described12. Human breast cancer cell lines (MCF-7, MDA-MB-231, and SKBR3) from ATCC were cultured according to the supplier’s protocols. For transient knockdown experiments, TRIM24 (L-047483-00) and non-silencing control (D-00120-01-20) small interfering RNAs (siRNAs) (Dharmacon) were transfected at 100 nM for 48 hours using Lipofectamine RNAiMAX reagent (Invitrogen).
Cell proliferation, soft agar colony formation, and cell-cycle analysis
For cell proliferation and XTT assays, 7500 cells were seeded in 24-well plates in M87A+X medium and counted for 6 days (Beckman Coulter counter). For soft agar colony formation, 5000 cells were seeded in 4ml of M87A+X with 0.35% low-melting-temperature agarose (BD Biosciences) overlying 1.5 mL of 0.7% low-melting agarose in 6-well plates and incubated at 37°C for 14 days. For cell-cycle analysis, cells were washed and fixed with 70% ethanol for 1 hour at 4°C and stained with propidium iodide at a concentration of 50 μg/mL, along with RNase A (100 U/mL), prior to analysis using Flow cytometry and ModFit software program (Verity Software House).
HMECs stably overexpressing TRIM24
TRIM24 full-length coding sequences were amplified from the vector pCMV-XL4-hsTRIM24 (OriGene Technologies) using gene-specific primers (Supp. T7), digested with XbaI and PmlI and cloned into pEntry4-FLAG vector 50. TRIM24 coding sequences and FLAG-only sequences were transferred to pLenti-PGK-Neo-DEST 50 using Gateway cloning (Invitrogen). Lentiviruses containing culture supernatants were prepared as described 4. Briefly, 800 ng of clone/vector DNA were transfected into HEK293T cells with packaging vectors pPAX2 and pMD2 (800 ng each) using Effectene (Qiagen) according to manufacturer’s instructions. After 48 hours, immortal HMEC line 184A1 was transduced using virus-containing culture supernatants with 8 μg /mL Polybrene (Sigma). After 48 hours, cells were selected using 700 μg/mL G418 (Stratagene) for 10 days. Stable cell lines, ectopically expressing TRIM24 (TRIM24-iHMECs) or FLAG only (Control-iHMECs) were maintained in regular culture medium containing 200 μg/ml G418.
Quantitative real-time PCR (qRT-PCR)
Total RNA was isolated with TRIzol reagent (Invitrogen) and qRT-PCR analysis was performed as described 4.
nCounter analysis
A panel of 420 breast cancer associated genes was used for nCounter analysis (NanoString Technologies) 51. Three biological replicates of RNA from TRIM24 and Control iHMECs (100ng each) were processed according to the manufacturer’s recommendations (http://www.nanostring.com). Data were analyzed using the nSolver digital analyzer software program (http://www.nanostring.com/products/nSolver). Differentially expressed genes were identified using the Student t-test: genes with expression significantly (p < 0.05) up- (fold change ≥ 1.2) or down-regulated (fold change ≤ 0.8) were identified. Unsupervised hierarchical clustering of differentially expressed genes was performed using the GENE-E software program (http://www.broadinstitute.org/cancer/software/GENE-E/) and a Euclidean distance matrix. Gene Ontology (GO) category (http://www.geneontology.org/) enrichment analysis and KEGG pathway analysis were done using the Database for Annotation, Visualization and Integrated Discovery (DAVID) (http://david.abcc.ncifcrf.gov/) 52.
Immunoblotting and Immunohistochemistry
Immunoblotting of proteins in TRIM24 and Control iHMECs was performed using standard techniques with antibodies listed in Supplemental Table T8. Immunohistochemistry (IHC) of breast tumor arrays, BR2082 (US Biomax) and BR1503 (US Biomax), was performed, as described 4, using a VECTASTAIN Elite ABC Kit and a DAB Detection Kit (Vector Laboratories) with an anti-TRIM24 antibody (1:200 dilution; Proteintech). IHC staining data for ER, PR, and ErbB2 were available and TRIM24 staining was quantified using the Allred scoring method (for details of the Chi-square method and calculations please see Supp. Table T1) 53.
Metabolic experiments and glucose uptake
The extracellular acidification rate (ECAR) and oxygen consumption rate (OCR) of TRIM24 and Control iHMECs were measured using an XFe96 Extracellular Flux Analyzer (Seahorse Bioscience) as described 24. Briefly, 50,000 cells were seeded into XFe96 tissue culture plates in quadruplicate and ECAR and OCR measured under basal conditions and after sequential treatment of the cells with Oligomycin (1 μM), FCCP (Carbonylcyanide p-trifluoromethoxyphenylhydrazone, 500 nM) and Rot + Ant [Rotenone (1 μM) + Antimycin A (1 μM)]. Cells were trypsinized and counted using a Coulter counter (Beckman Coulter) and the cell count used for normalization purposes. For glucose uptake assays, a non-metabolic fluorescent-labelled glucose (2- NBDG) was used. iHMECs were seeded in the regular HMEC medium for 24h and just prior to performing the assay were washed with glucose-free medium. Cells were incubated with glucose-free medium, containing 120 μM 2-NBDG (Invitrogen) for 0.5h, 1.0h, 1.5h and 2h, followed by FACS analysis.
Xenograft experiments
Female athymic Nu/Nu mice (age 6–8 weeks) were housed under pathogen-free conditions. 1 million TRIM24 iHMECs or Control iHMECs suspended in 50 μl of serum free DMEM were co-injected subcutaneously with 50 μl of high concentration Matrigel (BD Biosciences); 10-15 mice were injected for each cell line. Tumor sizes measured weekly by caliper for up to 64 days and xenograft volume calculated as previously described54. All procedures were approved by the University of Texas M D Anderson Cancer Center Institutional Animal Care and Use Committee and performed with veterinary supervision.
The Cancer Genome Atlas data and statistical methods
The Cancer Genome Atlas – Breast invasive carcinoma (TCGA-BRCA) data on RNA expression (Level 3) of Breast invasive carcinoma patients (1008) and normal tissues (92) in terms of RSEM (RNA-seq by Expectation-Maximization) were downloaded from the Broad Institute TCGA Firehose Genome Data analysis center pipeline (standard data run 2013/11/14). 950 of 1008 BRCA samples had PAM50 subtype information available. Gene set enrichment analysis (GSEA) was run with default parameters with TRIM24 expression levels as phenotype and C2 (canonical pathways) gene sets. GSEA with patient samples limited to Basal subtypes and TRIM24 expression as phenotype gave very similar results.
Supplementary Material
Acknowledgments
We thank Abhinav Jain and Srikanth Appikonda for helpful discussions. Zeynep Coban and Kadir Akdemir for help with Bioinformatic analyses. Lindsey Minter and Joseph Taube for help with Xenograft experiments.
Grant Support: This research is supported by grant RP100602 from the Cancer Prevention and Research Initiative of Texas to MCB and in part by the MD Anderson Cancer Center Support Grant CA016672.
Footnotes
Supplementary information accompanies the paper on the Oncogene Website (http://www.nature.com/onc).
CONFLICT OF INTEREST
The authors declare no conflict of interest.
References
- 1.Hatakeyama S. TRIM proteins and cancer. Nat Rev Cancer. 2011;11:792–804. doi: 10.1038/nrc3139. [DOI] [PubMed] [Google Scholar]
- 2.Allton K, Jain AK, Herz HM, Tsai WW, Jung SY, Qin J, et al. Trim24 targets endogenous p53 for degradation. Proc Natl Acad Sci U S A. 2009;106:11612–11616. doi: 10.1073/pnas.0813177106. [DOI] [PMC free article] [PubMed] [Google Scholar]
- 3.Jain AK, Allton K, Iacovino M, Mahen E, Milczarek RJ, Zwaka TP, et al. p53 regulates cell cycle and microRNAs to promote differentiation of human embryonic stem cells. PLoS biology. 2012;10:e1001268. doi: 10.1371/journal.pbio.1001268. [DOI] [PMC free article] [PubMed] [Google Scholar]
- 4.Tsai WW, Wang Z, Yiu TT, Akdemir KC, Xia W, Winter S, et al. TRIM24 links a non-canonical histone signature to breast cancer. Nature. 2010;468:927–932. doi: 10.1038/nature09542. [DOI] [PMC free article] [PubMed] [Google Scholar]
- 5.Chambon M, Orsetti B, Berthe ML, Bascoul-Mollevi C, Rodriguez C, Duong V, et al. Prognostic significance of TRIM24/TIF-1alpha gene expression in breast cancer. Am J Pathol. 2011;178:1461–1469. doi: 10.1016/j.ajpath.2010.12.026. [DOI] [PMC free article] [PubMed] [Google Scholar]
- 6.Ward PS, Thompson CB. Metabolic reprogramming: a cancer hallmark even warburg did not anticipate. Cancer cell. 2012;21:297–308. doi: 10.1016/j.ccr.2012.02.014. [DOI] [PMC free article] [PubMed] [Google Scholar]
- 7.Schulze A, Harris AL. How cancer metabolism is tuned for proliferation and vulnerable to disruption. Nature. 2012;491:364–373. doi: 10.1038/nature11706. [DOI] [PubMed] [Google Scholar]
- 8.Jones RG, Thompson CB. Tumor suppressors and cell metabolism: a recipe for cancer growth. Genes & development. 2009;23:537–548. doi: 10.1101/gad.1756509. [DOI] [PMC free article] [PubMed] [Google Scholar]
- 9.DeBerardinis RJ, Lum JJ, Hatzivassiliou G, Thompson CB. The biology of cancer: metabolic reprogramming fuels cell growth and proliferation. Cell metabolism. 2008;7:11–20. doi: 10.1016/j.cmet.2007.10.002. [DOI] [PubMed] [Google Scholar]
- 10.Chen JQ, Russo J. Dysregulation of glucose transport, glycolysis, TCA cycle and glutaminolysis by oncogenes and tumor suppressors in cancer cells. Biochimica et biophysica acta. 2012;1826:370–384. doi: 10.1016/j.bbcan.2012.06.004. [DOI] [PubMed] [Google Scholar]
- 11.Hanahan D, Weinberg RA. The hallmarks of cancer. Cell. 2000;100:57–70. doi: 10.1016/s0092-8674(00)81683-9. [DOI] [PubMed] [Google Scholar]
- 12.Garbe JC, Bhattacharya S, Merchant B, Bassett E, Swisshelm K, Feiler HS, et al. Molecular distinctions between stasis and telomere attrition senescence barriers shown by long-term culture of normal human mammary epithelial cells. Cancer Res. 2009;69:7557–7568. doi: 10.1158/0008-5472.CAN-09-0270. [DOI] [PMC free article] [PubMed] [Google Scholar]
- 13.Stampfer MR, Bartley JC. Induction of transformation and continuous cell lines from normal human mammary epithelial cells after exposure to benzo[a]pyrene. Proc Natl Acad Sci U S A. 1985;82:2394–2398. doi: 10.1073/pnas.82.8.2394. [DOI] [PMC free article] [PubMed] [Google Scholar]
- 14.Stampfer MR, Garbe J, Nijjar T, Wigington D, Swisshelm K, Yaswen P. Loss of p53 function accelerates acquisition of telomerase activity in indefinite lifespan human mammary epithelial cell lines. Oncogene. 2003;22:5238–5251. doi: 10.1038/sj.onc.1206667. [DOI] [PubMed] [Google Scholar]
- 15.Novak P, Jensen TJ, Garbe JC, Stampfer MR, Futscher BW. Stepwise DNA methylation changes are linked to escape from defined proliferation barriers and mammary epithelial cell immortalization. Cancer Res. 2009;69:5251–5258. doi: 10.1158/0008-5472.CAN-08-4977. [DOI] [PMC free article] [PubMed] [Google Scholar]
- 16.Brenner AJ, Stampfer MR, Aldaz CM. Increased p16 expression with first senescence arrest in human mammary epithelial cells and extended growth capacity with p16 inactivation. Oncogene. 1998;17:199–205. doi: 10.1038/sj.onc.1201919. [DOI] [PubMed] [Google Scholar]
- 17.Garbe JC, Holst CR, Bassett E, Tlsty T, Stampfer MR. Inactivation of p53 function in cultured human mammary epithelial cells turns the telomere-length dependent senescence barrier from agonescence into crisis. Cell Cycle. 2007;6:1927–1936. doi: 10.4161/cc.6.15.4519. [DOI] [PubMed] [Google Scholar]
- 18.Stampfer MR, Yaswen P. Culture models of human mammary epithelial cell transformation. J Mammary Gland Biol Neoplasia. 2000;5:365–378. doi: 10.1023/a:1009525827514. [DOI] [PubMed] [Google Scholar]
- 19.Stampfer MR, Yaswen P. Human epithelial cell immortalization as a step in carcinogenesis. Cancer Lett. 2003;194:199–208. doi: 10.1016/s0304-3835(02)00707-3. [DOI] [PubMed] [Google Scholar]
- 20.Stampfer M, LaBarge M, Garbe J. An Integrated Human Mammary Epithelial Cell Culture System for Studying Carcinogenesis and Aging. In: Schatten H, editor. Cell and Molecular Biology of Breast Cancer. Humana Press; 2013. pp. 323–361. [Google Scholar]
- 21.Parker JS, Mullins M, Cheang MC, Leung S, Voduc D, Vickery T, et al. Supervised risk predictor of breast cancer based on intrinsic subtypes. Journal of clinical oncology : official journal of the American Society of Clinical Oncology. 2009;27:1160–1167. doi: 10.1200/JCO.2008.18.1370. [DOI] [PMC free article] [PubMed] [Google Scholar]
- 22.Pierce JH, Arnstein P, DiMarco E, Artrip J, Kraus MH, Lonardo F, et al. Oncogenic potential of erbB-2 in human mammary epithelial cells. Oncogene. 1991;6:1189–1194. [PubMed] [Google Scholar]
- 23.Subramanian A, Tamayo P, Mootha VK, Mukherjee S, Ebert BL, Gillette MA, et al. Gene set enrichment analysis: a knowledge-based approach for interpreting genome-wide expression profiles. Proc Natl Acad Sci U S A. 2005;102:15545–15550. doi: 10.1073/pnas.0506580102. [DOI] [PMC free article] [PubMed] [Google Scholar]
- 24.Ferrick DA, Neilson A, Beeson C. Advances in measuring cellular bioenergetics using extracellular flux. Drug discovery today. 2008;13:268–274. doi: 10.1016/j.drudis.2007.12.008. [DOI] [PubMed] [Google Scholar]
- 25.Diers AR, Broniowska KA, Chang CF, Hogg N. Pyruvate fuels mitochondrial respiration and proliferation of breast cancer cells: effect of monocarboxylate transporter inhibition. The Biochemical journal. 2012;444:561–571. doi: 10.1042/BJ20120294. [DOI] [PMC free article] [PubMed] [Google Scholar]
- 26.Lee E, Koskimaki JE, Pandey NB, Popel AS. Inhibition of lymphangiogenesis and angiogenesis in breast tumor xenografts and lymph nodes by a peptide derived from transmembrane protein 45A. Neoplasia. 2013;15:112–124. doi: 10.1593/neo.121638. [DOI] [PMC free article] [PubMed] [Google Scholar]
- 27.Milke L, Schulz K, Weigert A, Sha W, Schmid T, Brune B. Depletion of tristetraprolin in breast cancer cells increases interleukin-16 expression and promotes tumor infiltration with monocytes/macrophages. Carcinogenesis. 2013;34:850–857. doi: 10.1093/carcin/bgs387. [DOI] [PubMed] [Google Scholar]
- 28.Zhao JJ, Liu Z, Wang L, Shin E, Loda MF, Roberts TM. The oncogenic properties of mutant p110alpha and p110beta phosphatidylinositol 3-kinases in human mammary epithelial cells. Proc Natl Acad Sci U S A. 2005;102:18443–18448. doi: 10.1073/pnas.0508988102. [DOI] [PMC free article] [PubMed] [Google Scholar]
- 29.Arteaga CL, Sliwkowski MX, Osborne CK, Perez EA, Puglisi F, Gianni L. Treatment of HER2-positive breast cancer: current status and future perspectives. Nature reviews Clinical oncology. 2012;9:16–32. doi: 10.1038/nrclinonc.2011.177. [DOI] [PubMed] [Google Scholar]
- 30.Werner H, Bruchim I. IGF-1 and BRCA1 signalling pathways in familial cancer. The lancet oncology. 2012;13:e537–544. doi: 10.1016/S1470-2045(12)70362-5. [DOI] [PubMed] [Google Scholar]
- 31.Zhu C, Qi X, Chen Y, Sun B, Dai Y, Gu Y. PI3K/Akt and MAPK/ERK1/2 signaling pathways are involved in IGF-1-induced VEGF-C upregulation in breast cancer. Journal of cancer research and clinical oncology. 2011;137:1587–1594. doi: 10.1007/s00432-011-1049-2. [DOI] [PubMed] [Google Scholar]
- 32.Koppenol WH, Bounds PL, Dang CV. Otto Warburg’s contributions to current concepts of cancer metabolism. Nat Rev Cancer. 2011;11:325–337. doi: 10.1038/nrc3038. [DOI] [PubMed] [Google Scholar]
- 33.Kroemer G, Pouyssegur J. Tumor cell metabolism: cancer’s Achilles’ heel. Cancer cell. 2008;13:472–482. doi: 10.1016/j.ccr.2008.05.005. [DOI] [PubMed] [Google Scholar]
- 34.Vander Heiden MG, Cantley LC, Thompson CB. Understanding the Warburg effect: the metabolic requirements of cell proliferation. Science. 2009;324:1029–1033. doi: 10.1126/science.1160809. [DOI] [PMC free article] [PubMed] [Google Scholar]
- 35.Fritz V, Fajas L. Metabolism and proliferation share common regulatory pathways in cancer cells. Oncogene. 2010;29:4369–4377. doi: 10.1038/onc.2010.182. [DOI] [PMC free article] [PubMed] [Google Scholar]
- 36.Zheng J. Energy metabolism of cancer: Glycolysis versus oxidative phosphorylation (Review) Oncology letters. 2012;4:1151–1157. doi: 10.3892/ol.2012.928. [DOI] [PMC free article] [PubMed] [Google Scholar]
- 37.Hsu PP, Sabatini DM. Cancer cell metabolism: Warburg and beyond. Cell. 2008;134:703–707. doi: 10.1016/j.cell.2008.08.021. [DOI] [PubMed] [Google Scholar]
- 38.Scott DA, Richardson AD, Filipp FV, Knutzen CA, Chiang GG, Ronai ZA, et al. Comparative metabolic flux profiling of melanoma cell lines: beyond the Warburg effect. The Journal of biological chemistry. 2011;286:42626–42634. doi: 10.1074/jbc.M111.282046. [DOI] [PMC free article] [PubMed] [Google Scholar]
- 39.Lim HY, Ho QS, Low J, Choolani M, Wong KP. Respiratory competent mitochondria in human ovarian and peritoneal cancer. Mitochondrion. 2011;11:437–443. doi: 10.1016/j.mito.2010.12.015. [DOI] [PubMed] [Google Scholar]
- 40.Smolkova K, Plecita-Hlavata L, Bellance N, Benard G, Rossignol R, Jezek P. Waves of gene regulation suppress and then restore oxidative phosphorylation in cancer cells. The international journal of biochemistry & cell biology. 2011;43:950–968. doi: 10.1016/j.biocel.2010.05.003. [DOI] [PubMed] [Google Scholar]
- 41.Jose C, Bellance N, Rossignol R. Choosing between glycolysis and oxidative phosphorylation: a tumor’s dilemma? Biochimica et biophysica acta. 2011;1807:552–561. doi: 10.1016/j.bbabio.2010.10.012. [DOI] [PubMed] [Google Scholar]
- 42.Vazquez F, Lim JH, Chim H, Bhalla K, Girnun G, Pierce K, et al. PGC1alpha Expression Defines a Subset of Human Melanoma Tumors with Increased Mitochondrial Capacity and Resistance to Oxidative Stress. Cancer cell. 2013;23:287–301. doi: 10.1016/j.ccr.2012.11.020. [DOI] [PMC free article] [PubMed] [Google Scholar]
- 43.Gao P, Tchernyshyov I, Chang TC, Lee YS, Kita K, Ochi T, et al. c-Myc suppression of miR-23a/b enhances mitochondrial glutaminase expression and glutamine metabolism. Nature. 2009;458:762–765. doi: 10.1038/nature07823. [DOI] [PMC free article] [PubMed] [Google Scholar]
- 44.Zaugg K, Yao Y, Reilly PT, Kannan K, Kiarash R, Mason J, et al. Carnitine palmitoyltransferase 1C promotes cell survival and tumor growth under conditions of metabolic stress. Genes & development. 2011;25:1041–1051. doi: 10.1101/gad.1987211. [DOI] [PMC free article] [PubMed] [Google Scholar]
- 45.Moreno-Sanchez R, Rodriguez-Enriquez S, Marin-Hernandez A, Saavedra E. Energy metabolism in tumor cells. The FEBS journal. 2007;274:1393–1418. doi: 10.1111/j.1742-4658.2007.05686.x. [DOI] [PubMed] [Google Scholar]
- 46.Chen M, Zhang J, Li N, Qian Z, Zhu M, Li Q, et al. Promoter hypermethylation mediated downregulation of FBP1 in human hepatocellular carcinoma and colon cancer. PLoS One. 2011;6:e25564. doi: 10.1371/journal.pone.0025564. [DOI] [PMC free article] [PubMed] [Google Scholar]
- 47.Goel A, Mathupala SP, Pedersen PL. Glucose metabolism in cancer. Evidence that demethylation events play a role in activating type II hexokinase gene expression. The Journal of biological chemistry. 2003;278:15333–15340. doi: 10.1074/jbc.M300608200. [DOI] [PubMed] [Google Scholar]
- 48.Lv L, Li D, Zhao D, Lin R, Chu Y, Zhang H, et al. Acetylation targets the M2 isoform of pyruvate kinase for degradation through chaperone-mediated autophagy and promotes tumor growth. Molecular cell. 2011;42:719–730. doi: 10.1016/j.molcel.2011.04.025. [DOI] [PMC free article] [PubMed] [Google Scholar]
- 49.Xu W, Yang H, Liu Y, Yang Y, Wang P, Kim SH, et al. Oncometabolite 2-hydroxyglutarate is a competitive inhibitor of alpha-ketoglutarate-dependent dioxygenases. Cancer cell. 2011;19:17–30. doi: 10.1016/j.ccr.2010.12.014. [DOI] [PMC free article] [PubMed] [Google Scholar]
- 50.Campeau E, Ruhl VE, Rodier F, Smith CL, Rahmberg BL, Fuss JO, et al. A versatile viral system for expression and depletion of proteins in mammalian cells. PLoS One. 2009;4:e6529. doi: 10.1371/journal.pone.0006529. [DOI] [PMC free article] [PubMed] [Google Scholar]
- 51.Geiss GK, Bumgarner RE, Birditt B, Dahl T, Dowidar N, Dunaway DL, et al. Direct multiplexed measurement of gene expression with color-coded probe pairs. Nat Biotechnol. 2008;26:317–325. doi: 10.1038/nbt1385. [DOI] [PubMed] [Google Scholar]
- 52.Dennis G, Jr, Sherman BT, Hosack DA, Yang J, Gao W, Lane HC, et al. DAVID: Database for Annotation, Visualization, and Integrated Discovery. Genome Biol. 2003;4:P3. [PubMed] [Google Scholar]
- 53.Allred DC, Harvey JM, Berardo M, Clark GM. Prognostic and predictive factors in breast cancer by immunohistochemical analysis. Mod Pathol. 1998;11:155–168. [PubMed] [Google Scholar]
- 54.Wen H, Li Y, Xi Y, Jiang S, Stratton S, Peng D, et al. ZMYND11 links histone H3.3K36me3 to transcription elongation and tumour suppression. Nature. 2014;508:263–268. doi: 10.1038/nature13045. [DOI] [PMC free article] [PubMed] [Google Scholar]
Associated Data
This section collects any data citations, data availability statements, or supplementary materials included in this article.