

Abstract
Dendritic morphology determines the kinds of input a neuron receives, having a profound impact on neural information processing. In the mammalian cerebral cortex, excitatory neurons have been ascribed to one of two main dendritic morphologies, either pyramidal or stellate, which differ mainly on the extent of the apical dendrite. Developmental mechanisms regulating the emergence and refinement of dendritic morphologies have been studied for cortical pyramidal neurons, but little is known for spiny stellate neurons. Using biolistics to label single cells on acute brain slices of the ferret primary visual cortex, we show that neurons in layer 4 develop in a two-step process: initially, all neurons appear pyramidal, growing a prominent apical dendrite and few small basal dendrites. Later, a majority of these neurons show a change in the relative extent of basal and apical dendrites that results in a gradual sculpting into a stellate morphology. We also find that ∼22% of neurons maintain the proportionality of their dendritic arbors, remaining as pyramidal cells at maturity. When ferrets were deprived of retinal input at early stages of postnatal development by binocular enucleation, a significant proportion of layer 4 spiny neurons failed to remodel their apical dendrites, and ∼55% remained as pyramidal neurons. Our results demonstrate that cortical spiny stellate neurons emerge by differential sculpting of the dendritic arborizations of an initial pyramidal morphology and that sensory input plays a fundamental role in this process.
Introduction
The mammalian cerebral cortex contains a unique repertoire of neuronal types with characteristic dendritic arbors and axonal projections. Most cortical excitatory neurons are characterized by having a long apical dendrite (AD) that predominates over multiple shorter basal dendrites (BDs), giving these cells a pyramidal appearance. In layer 4, however, the majority of excitatory neurons have a short apical dendrite similar to the basal dendrites, giving these cells a stellate appearance. Because dendrites are the site of most synapses, the laminar arrangement of dendrites defines the sets of information that each neuron can sample (Callaway, 1998; Briggs and Callaway, 2001). For example, because stellate neurons confine their dendritic arbor to layer 4, the layer of termination for most thalamic afferents, the stellate morphology allows these neurons to specialize in the reception of thalamic synapses. It has been shown that, during development, cortical pyramidal cells undergo extensive dendritic growth and differentiation, leading to the specific apical and basal dendritic arborizations of mature neurons (Koester and O'Leary, 1992; Borrell and Callaway, 2002). Numerous studies indicate that the final form and extent of these pyramidal dendritic arbors appear to result from interactions between intrinsic developmental programs and local environmental cues, including levels and patterns of neuronal activity (McAllister et al., 1995, 1996; Whitford et al., 2002). In contrast, little is known about the mechanisms of dendrite development leading to the emergence of the stellate morphology typical for layer 4 spiny neurons, nor the factors influencing this process.
During development, cells fated to become pyramidal neurons develop a long apical dendrite, which is lengthened and elaborated until maturity (Koester and O'Leary, 1992; Borrell and Callaway, 2002; Olson et al., 2006). Pyramidal neurons within a layer may also be distinguished into distinct morphological subtypes by selective sculpting of their apical dendrite during development (Koester and O'Leary, 1992; Vercelli et al., 1992). These findings suggested the hypothesis that stellate neurons might develop similarly, first emerging as pyramidal neurons and later pruning their apical dendrite (Vercelli et al., 1992). Alternatively, layer 4 stellate neurons may develop from the onset with a short apical dendrite. Here we studied the development of dendritic arbors in layer 4 neurons of the ferret primary visual cortex, which we labeled in living slices using biolistics. We found that all layer 4 neurons initially emerged as pyramidal cells and that, later in development, a subset of them sculpted their dendritic arbor to acquire a stellate morphology. Our results suggested that dendritic sculpting involved active elimination of the apical dendrite, and passive displacement of the dendritic arbor as the cerebral cortex thickens. In contrast, the basal dendrites had similar growth and elaboration in all layer 4 neurons, indicating that the stellate phenotype results from specific remodeling to the apical dendrite. Finally, binocular enucleation in newborn ferrets caused a reduction in the proportion of stellate neurons and an increase in the size of the basal dendrites, demonstrating that the developmental transformation from pyramidal to stellate in vivo depends on retinal input.
Materials and Methods
Visual cortex slice cultures.
Ferrets were obtained from Marshall Farms and kept on a 12 h light/dark cycle. All animals were treated in accordance with institutional and National Institutes of Health guidelines for the care and use of laboratory animals and protocols were approved by the Salk Institute Institutional Animal Care and Use Committee. ICR mice obtained from Harlan were mated, and the day of vaginal plug was considered embryonic day 0.5 (E0.5). Mouse procedures were performed at the Instituto de Neurociencias in accordance with Spanish and European Union regulations.
Ferret kits from eight different litters were deeply anesthetized with sodium pentobarbital (100 mg/kg, i.p.) and decapitated. Organotypic slices of visual cortex were prepared as described previously, under sterile conditions (Borrell and Callaway, 2002). Briefly, the brain was removed and submerged in ice-cold HEPES-buffered artificial CSF (in mm: 140 NaCl, 5 KCl, 1 MgCl2, 24 d-glucose, 10 HEPES, and 1 CaCl2, pH 7.2). The pia was removed using fine forceps, and the tissue from the posterior pole of each hemisphere was cut into a single block, containing area 17 of the visual cortex. This block was then sliced sagittally to a thickness of 400 μm using a tissue slicer (Katz, 1987). Slices were then placed onto cell culture inserts (Falcon, 0.4 μm pore size; Thermo Fisher Scientific) overlying 1 ml of medium. Culture medium was composed of 50% Basal Medium of Eagle, 25% HBSS, 25% horse serum, 330 mm d-glucose, 10 mm HEPES, and 10 U/ml penicillin–streptomycin (all from Invitrogen). Slices were then incubated and maintained in a 95% humidity, 5% CO2 atmosphere, at 37°C. The photograph in Figure 1A was taken from material previously prepared and described in a published study (Callaway and Katz, 1992). Following procedures approved by the Rockefeller University Institutional Animal Care and Use Committee, a postnatal day 26 (P26) cat was deeply anesthetized with sodium pentobarbital (100 mg/kg, i.p.) and decapitated. The visual cortex was sliced at 400 μm, individual cells were intracellularly labeled with Lucifer yellow, and slices were then fixed, resectioned, mounted, and coverslipped (Callaway and Katz, 1992).
Figure 1.
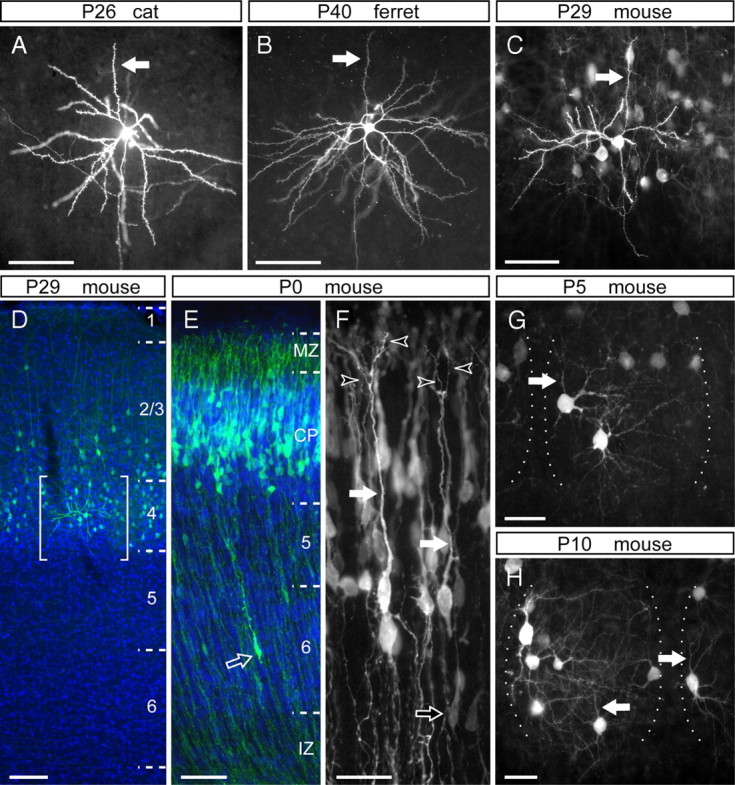
The dendritic arbor of layer 4 cells is dramatically transformed during the first postnatal week in the mouse barrel cortex. A–C, Representative examples of layer 4 spiny stellate neurons in V1 of a P25 cat (A), A17 of a P40 ferret (B), and in the barrel cortex of a P29 mouse (C), in which the apical dendrites are indicated by arrows. D, Cross-section of the barrel cortex of a P29 mouse electroporated at E13.5, in which GFP-transfected cells (green) are positioned in layer 4 and bottom of layer 2/3. Brackets delimit the area shown in C. E, F, Laminar position (E) and detailed morphology (F) of cells in the somatosensory cortex of a newborn mouse, transfected with GFP at E13.5. Bright GFP+ neurons (green in E) align along the deep aspect of the cortical plate (CP) and exhibit a long apical dendrite (filled arrows) with multiple branches within the marginal zone (MZ; open arrowheads). These cells are distinguished from migrating cells in the intermediate zone (IZ) or cortical plate (open arrows) by having a much larger soma (E, F). G, H, Representative layer 4 GFP+ neurons in the barrel cortex of P5 (G) and P10 (H) mice electroporated with GFP at E14.5. These cells display typical stellate morphologies, in which the apical dendrite (arrows) is not more prominent than the basal dendrites. The lateral borders of individual barrels are indicated by dotted lines. DAPI is shown in blue. Scale bars: A–C, E, 50 μm; D, 100 μm; F–H, 25 μm.
Enucleation.
Enucleation was always performed bilaterally and on ferret kits aged P1. Kits were deeply anesthetized and maintained with 1.5% isoflurane during surgery. Eyelids were cut open, the connective tissue and muscle surrounding the eyeball was cut all around, the optic nerve was severed, and the eyeball was removed. Finally, eyelids were closed back. Enucleated animals were killed for brain slicing at different ages, together with unmanipulated control littermates (controls, n = 2 kits at P18, 2 at P22, 2 at P26, 2 at P30; enucleated, n = 1 kit at P18, 2 at P22, 2 at P26, 2 at P30).
Biolistic transfection.
To reveal the morphology of individual cells, slices were transfected under sterile conditions using a Biolistics Helios gene gun device (Bio-Rad) within 1 h after slice preparation. This method of transfection has been shown previously not to alter dendritic morphology in transfected neurons of ferret visual cortex (McAllister et al., 1995; Borrell and Callaway, 2002). Gene gun cartridges were prepared by precipitating 50 μg of a CMVP–EGFP–N1 plasmid (Clontech) onto 12.5 mg of 1.6 μm gold particles, which were then used to coat 1 m of tubing (Bio-Rad). By application of a helium pressure of 80 psi, DNA-coated gold particles were accelerated into the tissue. After 24 h of culture to allow for gene expression, slices were fixed and stained for the detection of green fluorescent protein (GFP).
In utero electroporation.
Timed-pregnant mice were anesthetized with sodium pentobarbital (0.625 mg/10 g body weight, i.p.), their abdominal cavity was cut open, and the uterine horns were exposed. Approximately 1–2 μl of 1 μg/μl DNA solution (pCAG–EGFP) was injected into the lateral ventricle of embryos aged E13.5–E14.5 using pulled glass micropipettes. Each embryo within its uterus was placed between tweezers-type electrodes (CUY650-P5; NEPA Gene), and square electric pulses (40–45 V, 50 ms) were passed five times at 1 s intervals using an electroporator (CUY21E; NEPA Gene). The wall and skin of the abdominal cavity were suture closed, and embryos were allowed to develop normally.
Histology and immunostaining.
Mice at different developmental stages (P0, n = 4; P5, n = 2; P10, n = 2; P15, n = 2; P20, n = 4; P21, n = 5; P24, n = 1; P29, n = 3; P30, n = 8) were overdosed with isoflurane and transcardially perfused with 4% paraformaldehyde, and brains were cryoprotected in 30% sucrose and then cut frozen at 50 μm. For the immunodetection of GFP in mouse brain sections and ferret slices, tissue was incubated in blocking solution (10% normal goat serum, 2% bovine serum albumin, and 0.25% Triton X-100 in 0.1 m phosphate buffer), followed by incubation with primary and secondary antibody solutions. The following antibodies were used: rabbit anti-GFP (1:2000; Invitrogen), chicken anti-GFP (1:1000; Aves Labs), cyanine 3-conjugated donkey anti-rabbit (1:100; Millipore Bioscience Research Reagents), and goat anti-chicken 488 (1:200, Invitrogen). Counterstaining with 4′,6′-diamidino-2-phenylindole dihydrochloride (DAPI) (5 μm; Sigma) allowed the determination of cortical areas and laminar borders.
Cell selection and reconstruction.
Ferret slices were analyzed only if visual cortical area 17, and layers within it, could be identified unequivocally. In addition, to avoid including cells in slices cut obliquely, where dendrites may have been cutoff, slices were selected only if a majority of cells appeared healthy and, within those slices, only cells with an undamaged dendritic arbor. Cells were selected only when the following criteria were fulfilled: spines visible on the dendritic arbor, and axon emerging from the bottom of the cell soma and containing collaterals ascending into layer 2/3 (particularly between P26 and P40). The dendritic arbors of selected cells were reconstructed by using a 40× objective on a Leica fluorescence microscope in concert with a Neurolucida computerized reconstruction system (MicroBrightField). For comparisons between layer 4 and layer 2/3 neurons, part of the data for layer 2/3 cells was obtained from a previous study (Borrell and Callaway, 2002).
Cells transfected with GFP in slice cultures were incubated for 24 h because the use of GFP to reveal neuronal processes requires a minimum incubation time of 24 h to allow expression and intracellular diffusion of GFP. Nonetheless, it is reasonable to assume that the morphology of dendritic arbors after 24 h in vitro is very similar to that in vivo on the day that slice cultures are made (Borrell and Callaway, 2002).
Quantification and data analysis.
For each cell reconstructed, 10 parameters were measured: (1) span of apical dendrite; (2) span of basal dendrite; (3) ratio between span of apical dendrite and of basal dendrites; (4) area of cell soma; (5) number of basal dendrites; (6) length of apical dendrite; (7) total length of basal dendritic arbor; (8) total length of apical and basal dendritic arbors; (9) number of branch points in apical dendrite; (10) branch points in basal dendritic arbor. All data were statistically analyzed by using SPSS or Matlab software; p < 0.05 was considered statistically significant.
To summarize the developmental changes in dendritic complexity, we combined the data on dendritic span, length, and number of branch points to calculate the dendrite growth index (DGI). We used a modification of the DGI described previously (Borrell and Callaway, 2002), and DGI was calculated as follows:
where Fi is the value of a given parameter i at the final of the stages compared, Ii is the value at the initial stage, and Ci is a normalized weighting constant whose magnitude depends on the parameter. We assigned C1 = 0.4 for dendritic span, C2 = 0.3 for total length of dendrite, and C3 = 0.3 for number of dendritic branches. The ratio F/I was set to a value of 1 for cases in which final values were not statistically distinct from initial values (p < 0.05). According to these formulas, a DGI smaller than 1 means a significant decrease in dendritic complexity, and a DGI larger than 1 means a significant increase in complexity. Also, a larger value of DGI represents a greater increase in dendritic complexity.
Results
Pioneering descriptions of layer 4 excitatory neurons distinguished three morphological types, depending on the extension of the apical dendrite into upper layers: pyramids, star pyramids, and stellates (Jones, 1975; Staiger et al., 2004; and references therein). In this study, we have made no specific distinction between star pyramid and pyramidal morphologies, both of which are referred to as “pyramid.” The detailed morphology of single neurons, and particularly their dendritic arbor, has been extensively studied using the classical Golgi method (Ramon y Cajal, 1891). For the past few decades, single neurons have also been studied by performing intracellular injection of tracers on brain slices, such as biocytin or Lucifer yellow (Fig. 1A) (Katz, 1987; Briggs and Callaway, 2001). More recently, technological advances have allowed the use of relatively simple genetic tools to label single cells in a highly efficient and unbiased manner, including biolistics in brain slices and in utero electroporation in intact brains (Fig. 1B–D) (McAllister et al., 1995; Borrell et al., 2005; Borrell, 2010).
Developmental sculpting of the dendritic arbor of mouse layer 4 neurons
To label individual layer 4 neurons in the mouse cerebral cortex, we transfected neocortical progenitors of E13.5 embryos in utero by electroporation. When these embryos were allowed to develop to maturity (P29), the majority of GFP-labeled cells were found in layer 4, with only a few in the lower aspect of layer 2/3 (Fig. 1D). In the barrel cortex, GFP-positive (GFP+) layer 4 cells exhibited distinctive morphology of spiny stellate neurons, including a reduced apical dendrite limited to layer 4 and not extending to supragranular layers (Fig. 1C,D) (Staiger et al., 2004).
To monitor the dendritic development of layer 4 neurons, we electroporated embryos at E13.5 with GFP-encoding DNA and performed a time course analysis of GFP+ cells during postnatal development. By birth (P0), the vast majority of GFP+ cells accumulated in the lower aspect of the cortical plate, in which layer 4 started to form right above the already distinguishable layer 5 (Fig. 1E). These GFP+ cells displayed a round soma and, strikingly, a thick and prominent apical process that branched a few times in the vicinity of the cortical surface, which are features typical of a developing AD in pyramidal neurons (Olson et al., 2006) (Fig. 1F). These cells and their apical processes were completely different from migrating neurons, which had a much thinner leading process and an elongated cell soma (Fig. 1F, open arrow).
By P5, GFP+ neurons had multiple dendrites of similar caliber and span emerging from the cell soma in all directions, giving these cells a characteristic stellate appearance (Fig. 1G). This morphology contrasted with the pyramidal-like appearance observed in these cells only 5 d earlier, at P0. Each of the dendrites branched several times, already forming an elaborate arbor. Five days later, by P10, GFP+ neurons remained with a stellate appearance, but the complexity of dendritic elaboration was greater than at previous stages (Fig. 1H). The dendritic trees also appeared more specialized at P10, such as in the barrel field of the somatosensory cortex in which layer 4 neuron dendrites were strictly confined to the barrel hollows (Fig. 1G,H). The stellate appearance of layer 4 neurons did not change after P10, and the size and complexity of the apical dendrite remained equivalent to that of BDs.
Together, our results so far suggested that layer 4 neurons go through distinct phases of development: initially, they grow an AD and acquire a pyramidal morphology; on a second phase, they preferentially grow and elaborate BDs, acquiring a stellate appearance; and finally, they refine their dendritic arbor to the specialized adult morphology. Unfortunately, this whole process occurred within a very brief period of time in the developing mouse, making it difficult to pinpoint the exact developmental events involved in the transformation of layer 4 neurons from pyramidal (at P0) to stellate (at P5). To overcome this limitation, we turned to the ferret primary visual cortex, in which layer 4 spiny neurons are also stellate, as in the mouse barrel cortex (Fig. 1B,C), but developmental events occur during a much longer period of time than in mouse (Jackson et al., 1989).
Gradual switch from pyramidal to stellate morphology by selective elaboration of basal dendrites but not the apical dendrite
We began our ferret analysis at P14, the youngest age when layer 4 is distinguishable in the primary visual cortex. At this age, layer 4 neurons had a very simple and poorly branched dendritic arbor, with a single AD extended up to the marginal zone and few short BDs (Fig. 2A,B). These morphological traits were similar to those of layer 2/3 pyramids at this same stage (Borrell and Callaway, 2002), not only qualitatively but also quantitatively, as evidenced by the analysis of span, length, and number of collateral branches for apical and basal dendrites (Fig. 3A–F).
Figure 2.
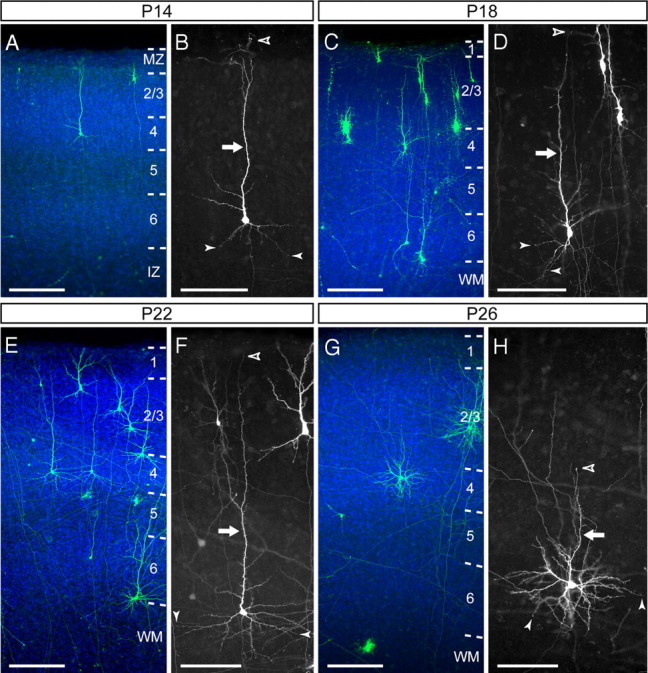
Spiny neurons in layer 4 of ferret visual area A17 transform from pyramidal to stellate at postnatal stages. A–H, Representative examples of layer 4 neurons in ferret A17 at P14 (A, B), P18 (C, D), P22 (E, F), and P26 (G,H) showing the laminar location (A,C,E,G) and details of the dendritic morphologies (B, D, F, H). Between P14 and P22 (A–F), the apical dendrite (arrow) extends radially from the cell soma a much greater distance (open arrowhead indicates the distal end of the apical dendrite) than the basal dendrites (filled arrowheads). The apical dendrite of many neurons is shorter at P26 (G, H) than at P22 (F), whereas the basal dendrites are longer and more arborized. DAPI is shown in blue. Numbers identify layers. CP, Cortical plate; IZ, intermediate zone; MZ, marginal zone; WM, white matter. Scale bars: A, C, E, G, 200 μm; B, D, F, H, 100 μm.
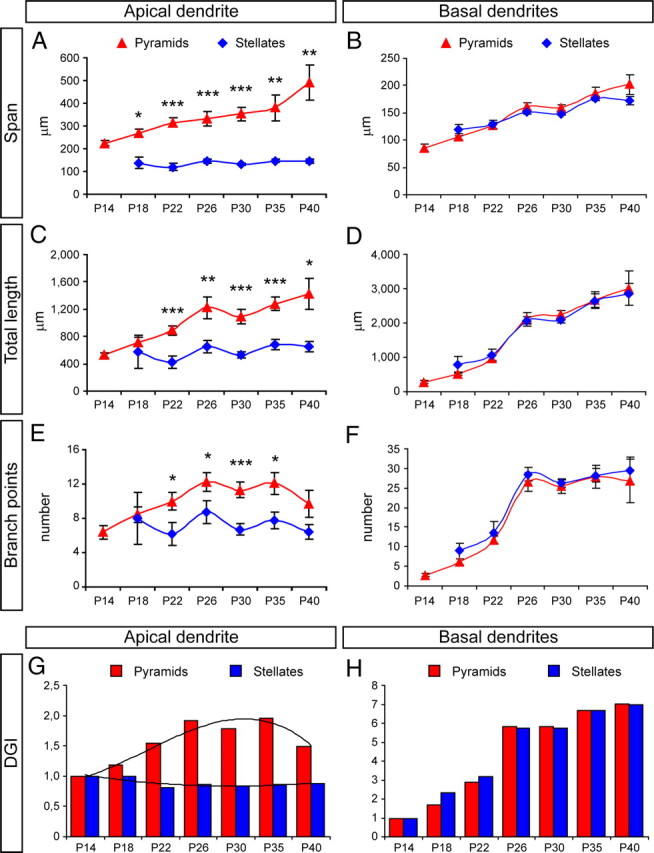
Figure 3.
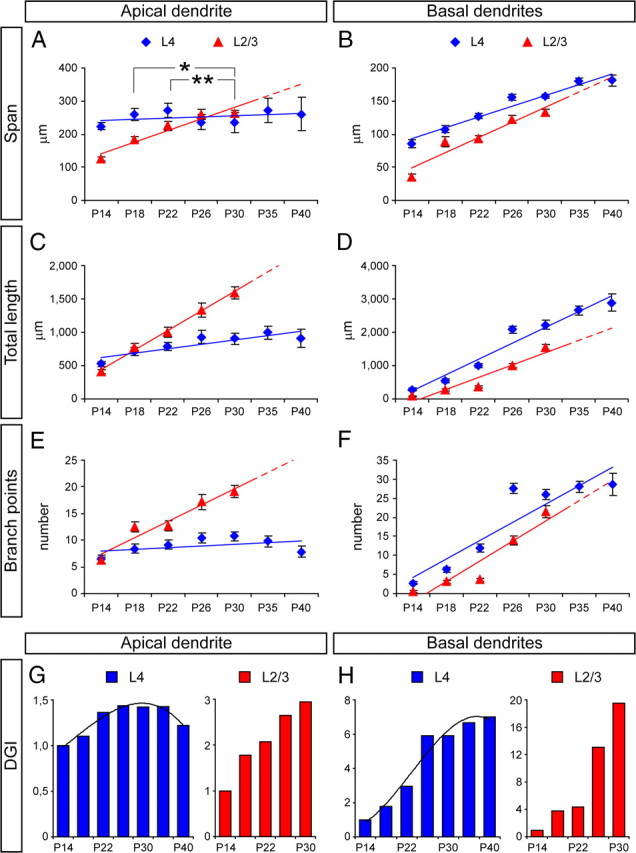
Comparison of the development of dendritic arbors between layer 2/3 and layer 4 spiny neurons in ferret A17 during postnatal development. A–F, Measurements of dendritic span (A, B), total length (C, D), and number of branch points (E, F) in apical dendrite (A, C, E) and basal dendritic arbor (B, D, F) of layer 2/3 and layer 4 neurons between P14 and P40. Colored lines represent developmental trend lines for each case; dashed line fragments are trend line extensions based on data from earlier developmental stages. Data are mean ± SEM. In A, statistical differences were found between P18 and P22 with P30 (*p < 0.05, **p < 0.01) after testing for multiple comparisons (p < 0.001, Kruskal–Wallis test). G, H, Analysis of DGI of apical dendrite (G) and basal dendritic arbor (H) of layer 4 and layer 2/3 neurons between P14 and P40. DGI is calculated with respect to P14 for each group independently. Black curves are trend lines (third-order polynomial) for DGI data on apical dendrite (r2 = 0.96) and basal dendrites (r2 = 0.96) of layer 4 neurons. Layer 2/3, n = 25 neurons at P14; 26 neurons at P18; 32 neurons at P22; 26 neurons at P26; 25 neurons at P30. Layer 4, n = 27 neurons at P14; 27 neurons at P18; 41 neurons at P22; 33 neurons at P26; 27 neurons at P30; 27 neurons at P35; 13 neurons at P40.
Between P14 and P22, the dendritic tree of layer 4 neurons increased in both size and complexity of arborization, but the overall morphology remained pyramidal and with little resemblance to the stellate morphology displayed in the mature cortex (Figs. 1B, 2A–F). Our quantitative analysis demonstrated that the elaboration of the AD in layer 4 neurons was significant but less dramatic than that of layer 2/3 pyramids, with a gradual but much slower increase in span, total length, and branching. This difference between layer 2/3 and 4 neurons was limited to the AD, because the increase in size and complexity of the BDs was similar to that of layer 2/3 pyramids (Fig. 3).
After P22, the dynamics of AD development of layer 4 spiny neurons stalled compared with previous stages, whereas the BD arbors continued to grow steadily in size and complexity (Figs. 2, 3). For example, by P26, the AD of layer 4 neurons was less prominent than at earlier stages: whereas between P14 and P18 the AD extended an average of 66–84% of the distance between the cell soma and the pial surface of the cortex, by P26, the AD span was only 37.5 ± 4.4% of that distance on average (n = 33 cells, 3 animals). These emerging differences in developmental dynamics between apical and basal dendrites led those neurons to start losing their pyramidal appearance exhibited until P22 and to acquire a more stellate appearance (Fig. 2G,H), a tendency that was further accentuated at later developmental stages (Fig. 1B).
The quantitative analysis of dendritic growth and elaboration allowed us to compare the development of layer 4 spiny neurons with typical pyramidal neurons in layer 2/3. Whereas the AD of layer 2/3 pyramids increased several-fold in span, total length, and branching across development, for layer 4 neurons, these variables were quite similar at P14 and P40 (Fig. 3A,C,E). In addition, the number of AD branch points decreased significantly between P30 and P40 (Fig. 3E) (P30, 10.71 ± 0.91 branch points; P40, 7.84 ± 0.97 branch points; p < 0.005, t test after ANOVA for multiple comparisons), further reducing its complexity. Such a dramatic difference in AD development between layer 2/3 pyramids and layer 4 neurons was also evidenced by the DGI, which increased steadily in pyramidal neurons up to a value of 3, whereas in layer 4 neurons, it plateaued at a value of only 1.4 before decreasing back to 1.2 at the last stage analyzed (Fig. 3G). In contrast, in the same developmental period, the basal dendritic arbor of these same layer 4 neurons doubled the span and increased 10-fold in total length and number of collateral branches, much in parallel to layer 2/3 pyramidal neurons (Fig. 3B,D,F,H).
Together, our findings showed that layer 4 spiny neurons initially emerge as pyramidal cells and that as development proceeds they gradually acquire a more stellate appearance. Our findings so far suggested that this morphological transformation might take place by two simultaneous mechanisms: increase in the size and complexity of the basal dendrites, and limited growth of the apical dendrite.
Developmental distinction of pyramidal and stellate morphologies from an early common pattern
In our previous analysis, we observed an important morphological heterogeneity in the apical dendrite among layer 4 cells, particularly between P30 and P40 (Fig. 4A), which was evidenced by the substantial variability of our measurements of AD span at those ages (Fig. 3A). Thus, we next investigated whether such variability in AD span could be attributable to the coexistence in layer 4 of a mixture of various neuronal subpopulations with distinctive AD morphologies: cells with large AD span (pyramidal) and cells with small AD span (stellate), as has been shown previously in other species (Jones, 1975; Mates and Lund, 1983; Staiger et al., 2004). Indeed, pyramidal neurons are characterized by having an AD span much longer than the basal dendrites, whereas stellate neurons are characterized by having apical and basal dendrites with similar span (Staiger et al., 2004). Based on this basic morphological concept, we calculated the ratio between the span of the AD and that of the BD arbor (AD/BD) for each neuron analyzed. High values of AD/BD should be typical of pyramidal morphology, and low values (close to 1) should be typical of stellate morphology. We also reasoned that, if discrete populations of neurons exist with clearly distinctive dendritic morphologies, AD/BD values would show a clustered distribution. We found that, at all ages examined, the AD/BD ratio covered a wide range of values and appeared to have a continuous distribution (Fig. 4B). Nevertheless, comparing across developmental time, we found that the average AD/BD was significantly lower between P26 and P40 compared with P14 through P22 and that this mean value remained constant from P30 onward (Fig. 4B, red line). These results supported our initial observations that layer 4 neurons had a tendency to switch their morphology gradually during development, from a clearly asymmetric pyramidal morphology to a more radial, stellate-like morphology.
Figure 4.

Spiny neurons in layer 4 of ferret A17 sculpt their dendritic morphology during postnatal development. A, Reconstructions of the dendritic arbor of representative layer 4 spiny neurons at P22 and P40. Black lines represent apical dendrite, and gray lines represent basal dendrites. Cell bodies are represented by filled polygons. Red shading indicates pyramidal neurons, and blue shading indicates stellate neurons. B, Quantification of the AD/BD ratio along postnatal development between P14 and P40. Filled circles represent individual neurons from multiple animals per age group. Open circles represent mean ± SEM for each age group. Statistically significant differences were found between P14, P18, P22 and P26, P30, P35, or P40 (*p < 0.05 between P22 and P26; ***p < 0.001 for all other comparisons) after testing for multiple comparisons (p < 0.001, Kruskal–Wallis test). Dashed line indicates AD/BD of 1.28. Red arrow symbolizes that neurons with AD/BD larger than 1.28 are categorized as pyramidal, and blue arrow symbolizes that neurons with AD/BD smaller than 1.28 are categorized as stellate. C, Frequency distribution of layer 4 spiny neurons between P30 and P40 according to their AD/BD ratio. Data for individual ages and mean value are color coded. Cells with small AD/BD values (gray shading area) form a large cluster, distinct from the sparse distribution of AD/BD values for the remaining neurons. For mean values, the large cell cluster ended at AD/BD of 1.28 (dashed line). D, Percentage of spiny neurons categorized as pyramidal or stellate in layer 4 of ferret A17 between P14 and P40. n = 43 neurons at P14; 101 at P18; 157 at P22; 126 at P26; 169 at P30; 51 at P35; 32 at P40. E, Quantification of the AD/BD ratio for neuronal populations categorized as pyramidal or stellate. For stellates, the ratio scatters near 1.0 at all ages. Pyramids, n = 27 neurons at P14; 53 at P18; 63 at P22; 30 at P26; 33 at P30; 13 at P35; 6 at P40. Stellates, n = 4 neurons at P18; 16 at P22; 35 at P26; 54 at P30; 26 at P35; 22 at P40. Data are mean ± SEM; **p < 0.01, ***p < 0.001, t test after two-way ANOVA for multiple comparisons (p < 10−25). Scale bars: 100 μm.
To better define the mature display of cell morphologies in layer 4 of the visual cortex, we focused on cells from P30 to P40. A detailed analysis of the frequency of AD/BD ratios during this period showed that a majority of cells had AD/BD values between 0.5 and 1.28 (Fig. 4C, shaded area), hence bearing a relatively symmetric (stellate) dendritic arborization. This large cluster of cells was distinguishable from the rest of layer 4 neurons, which had a wide variability of AD/BD values, each at low frequency, from 1.28 to 3.45 (Fig. 4C), and hence had largely asymmetric dendritic arbors (pyramidal-like). Although it was clear that the diversity of layer 4 neuron morphologies was not strictly binary (pyramidal or stellate), to understand the developmental transformation of these cells, we decided to use the AD/BD ratio as a criterion to simplify this continuous range of cell morphologies in two: either pyramidal or stellate. We defined those neurons with an AD/BD value of 1.28 or higher as pyramidal (Fig. 4B, red arrow) and neurons with an AD/BD below 1.28 as stellate (Fig. 4B, blue arrow). As illustrated in the dendritic reconstructions of Figure 4A, this criterion allowed us to discriminate reasonably well between cells with a pyramidal-like and a stellate-like appearance.
When the AD/BD criterion of 1.28 was applied to all spiny cells analyzed in layer 4 throughout development, we found that, between P14 and P40, there was a gradual switch in the proportion of dendritic phenotypes. The percentage of pyramids decreased from 100% of neurons at P14 to 22% at P40, and, conversely, the proportion of stellate neurons increased from 0% at P14 to 78% at P40 (Fig. 4C). This result was consistent with the decrease of AD/BD values observed between P14 and P40 (Fig. 4B). To further test the robustness of our criterion for morphological classification, we compared the AD/BD ratio between the pyramidal and the stellate cell group. At all ages, the AD/BD ratio in pyramids was more than double that in stellates, ranging between 1.98 and 2.78 in pyramidal neurons and between 0.85 and 1.13 in stellate neurons (Fig. 4D). These findings were a clear indication that the dendritic proportionality of the two cell groups was significantly different, and thus it was coherent with their different identification as pyramidal versus stellate.
Pyramidal neurons transform into stellates by passive displacement of their apical dendrite
Next we focused on the developmental mechanisms that lead to the transformation of layer 4 spiny neurons from exclusively pyramidal at P14 to mostly stellate at P40. A typical feature that distinguishes pyramidal from stellate neurons is the extension of their apical dendrite into superficial layers. Stellate neurons have a very short apical dendrite that remains primarily within the vicinity of layer 4, whereas pyramidal neurons extend a long apical dendrite from the cell soma to layer 2/3 and even into layer 1, close to the pial surface (Jones, 1975; Staiger et al., 2004). Because the cerebral cortex increases in thickness during development, differentiated layer 4 neurons may progressively suffer the passive displacement of their apical dendrite to deeper positions, hence acquiring a stellate appearance. To investigate this possibility, we analyzed the vertical span of the AD of individual neurons, as proportion of the distance between the cell soma and the pial surface (S–P). Neurons extending for 90–100% of the S–P distance were found at all ages examined, suggesting the presence of true pyramidal neurons throughout development (Fig. 5A). In addition, a variable number of cells were found to cover <35% of S–P, suggestive of stellate neuron identity (Fig. 5A). Indeed, the majority of these cells fulfilled the AD/BD < 1.28 criterion for stellate cells (Fig. 5A). Direct comparison between percentage of S–P distance and AD/BD ratio demonstrated that these two features are strongly correlated in mature layer 4 cells, with putative stellate neurons forming a tight cluster in the low values (AD/BD < 1.28, S–P < 32%) and putative pyramidal neurons forming a wide cluster in the high values (AD/BD > 1.28, S–P > 32%) (Fig. 5C). Therefore, to better understand the mechanisms underlying the developmental transformation of layer 4 neurons, we analyzed the frequency distributions of AD span as percentage of S–P distance across development. We found significant differences between early and late stages of development: at P14, the majority of neurons had an apical dendrite covering 80–100% of S–P distance; at P18–P22, most neurons covered only intermediate distances; and at P26–P40, the majority of neurons had short apical dendrites covering <30% of the distance to the pia (Fig. 5B,D). Together, the above results suggested that, as the cortex increases in thickness during development, a large proportion of layer 4 neurons fail to elongate their AD sufficiently to maintain it extended to the superficial layers, so this is passively displaced to deeper positions and cells gradually acquire a stellate appearance. In addition, our results also showed that a minority of cells maintained their AD extended through much of the distance to the pia, suggesting that these had managed to sustain apical dendrite elongation throughout development, thus remaining as pyramidal neurons to maturity.
Figure 5.
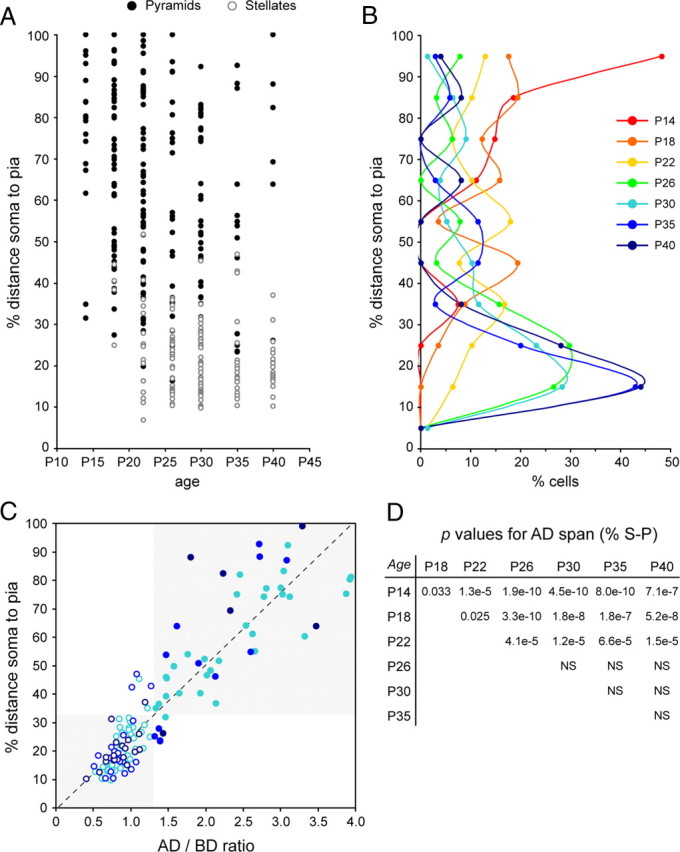
Quantification of apical dendrite span for spiny layer 4 neurons in ferret A17 during postnatal development. A, Plot of apical dendrite span values, as percentage of the distance between the cell body and the pial surface, at the developmental stages indicated, in which circles represent individual neurons from multiple animals per age group. Filled circles are neurons categorized as pyramidal (AD/BD > 1.28), and open circles are neurons categorized as stellate (AD/BD < 1.28). n = 78 neurons at P30; 34 at P35; 25 at P40. B, Binned distribution of apical dendrite span for all neurons analyzed in A. Each bin corresponds to a range of 10% of the distance from cell soma to pial surface, as indicated. C, Scatter plot of the AD/BD ratio of each cell with respect to the percentage of the distance soma-to-pia covered by its apical dendrite, for neurons between P30 and P40. Pyramids are represented as filled circles, and stellates are represented as open circles. Ages are color coded as in B. Dashed line indicates the regression line for all plotted values. There was a strong correlation between the two variables tested (r2 = 0.8594, p < 10−40, t test). The combination of these two variables resulted in 91% of neurons segregating in either the stellate or the pyramidal cell cluster (shaded areas). D, p values for Kolmogorov–Smirnov two-sample test across apical dendrite span distributions at different ages as in B. p values for comparisons between the indicated ages are shown. NS, Not significant, p > 0.05.
Reduction of the apical dendrite also contributes to the transformation of pyramidal neurons into stellates
Previous studies reported that sculpting of the apical dendrite in subclasses of cortical layer 5 neurons is achieved by elimination of portions of dendrite rather than by its passive displacement to deeper positions as the cortex thickens (Koester and O'Leary, 1992). Our above analyses suggested that, in layer 4, the distinction between pyramidal and stellate cells during development is achieved, at least in part, by the passive displacement of the apical dendrite to lower positions, which may be caused by a failure to sustain apical dendrite elongation as the cortex thickens. Thus, we next studied whether active elimination of the apical dendrite in prospective stellate neurons may also contribute to their distinction from pyramidal neurons. A first qualitative assessment revealed that 10.5% of layer 4 neurons did not have a distinguishable AD by P30–P40 (n = 16 of 153 cells in which no apical dendrite could be identified), which was extremely rare at previous stages (n = 2 of 228 cells between P14 and P26), thus highly suggestive of complete AD elimination. Second, on those neurons having an AD, we measured the span in absolute distance (AD span). Between P14 and P35, the maximum AD span of layer 4 cells increased gradually from 352 to 712 μm, suggesting sustained growth of the AD (Fig. 6A,B). In addition, however, numerous cells with AD shorter than 200 μm were present at all ages examined. Not surprisingly, most cells with short AD span fell into the stellate category (AD/BD < 1.28), and cells with long AD fell into the pyramid category (AD/BD > 1.28) (Fig. 6A). Although these results appeared to suggest that, during development, ADs do not retract but rather their span increases or remains unchanged, a careful examination of the dataset for the entire population suggested differently. Comparison of the frequency distributions of absolute AD span showed significant differences across development, in which the distribution peaked at the 200–250 μm range from P14 to P22, whereas from P26 to P40, the AD span distribution peaked at the 100–150 μm range (Fig. 6B,C). This result strongly argued in favor of a progressive shortening of the apical dendrite in a significant proportion of the layer 4 cell population (Fig. 6A,B). Together, the above findings suggested that a proportion of layer 4 neurons progressively modify their dendritic morphology from pyramidal to stellate by the action of two processes: the active elimination of the apical dendrite, and the passive displacement to deeper positions within the cortex. Simultaneously, a subpopulation of neurons does not retract the apical dendrite but sustains active growth, remaining as pyramids throughout development.
Figure 6.

Quantification of apical dendrite span for spiny layer 4 neurons in ferret A17 during postnatal development. A, Plot of apical dendrite span values, as absolute distance, at the developmental stages indicated, in which circles represent individual neurons from multiple animals per age group. Filled circles are neurons categorized as pyramidal (AD/BD > 1.28), and open circles are neurons categorized as stellate (AD/BD < 1.28). n = 27 neurons at P14; 57 at P18; 78 at P22; 64 at P26; 66 at P30; 34 at P35; 25 at P40. B, Binned distribution of apical dendrite span for all neurons analyzed at each age. Each bin corresponds to a range of 50 μm of distance from the cell body, as indicated. C, p values for Kolmogorov–Smirnov two-sample test across apical dendrite span distributions at different ages as in B. p values for comparisons between the indicated ages are shown. NS, Not significant, p > 0.05. Neuronal populations at younger ages (P14–P22) had significantly different distributions than at older ages (P30–P40).
Different dynamics of dendritic development between pyramidal and stellate neurons
Next we compared the dynamics of dendritic growth and elaboration between pyramidal and stellate neurons in layer 4 across development. The apical dendrite of pyramids increased several-fold in span and total length between P14 and P40, whereas these variables remained constant in stellate cells (Fig. 7A,C). Interestingly, the number of branch points in the AD of pyramids doubled initially, between P14 and P26, to then decrease back down by P40. In contrast, branching of the AD in stellate cells remained constant throughout development (Fig. 6E). These differences in AD development were also evidenced by the DGI values, which remained similar at ∼0.85 in stellates, whereas in pyramids, the DGI increased up to 1.95 by P35, decreasing slightly to 1.49 by P40 (Fig. 6G). Scholl analysis of ADs across development further confirmed the different dynamics between pyramids and stellates. Whereas in pyramidal neurons the apical dendritic arbor had a sustained and dramatic increase in complexity, this tendency was much more moderate in stellate neurons (Fig. 8A).
Figure 7.
Quantification of the dendritic elaboration of spiny layer 4 pyramidal and stellate neurons in ferret A17 during postnatal development. A–F, Measurements of dendritic span (A, B), total length (C, D), and number of branch points (E, F) in apical dendrite (A, C, E) and basal dendritic (B, D, F) arbor of pyramidal and stellate neurons between P14 and P40. Data are mean ± SEM; *p < 0.05, **p < 0.01, ***p < 0.001, t test after two-way ANOVA for multiple comparisons (p < 0.05). G, H, Analysis of DGI of apical dendrite (G) and basal dendritic (H) arbor of layer 4 pyramidal and stellate neurons between P14 and P40. DGI is calculated with respect to P14 for each group independently. Black curves are trend lines (third-order polynomial) for DGI data of pyramids (r2 = 0.94) and stellates (r2 = 0.73). Pyramids, n = 27 neurons at P14; 25 at P18; 32 at P22; 15 at P26; 21 at P30; 13 at P35; 4 at P40. Stellates, n = 2 neurons at P18; 9 at P22; 18 at P26; 54 at P30; 14 at P35; 9 at P40.
Figure 8.
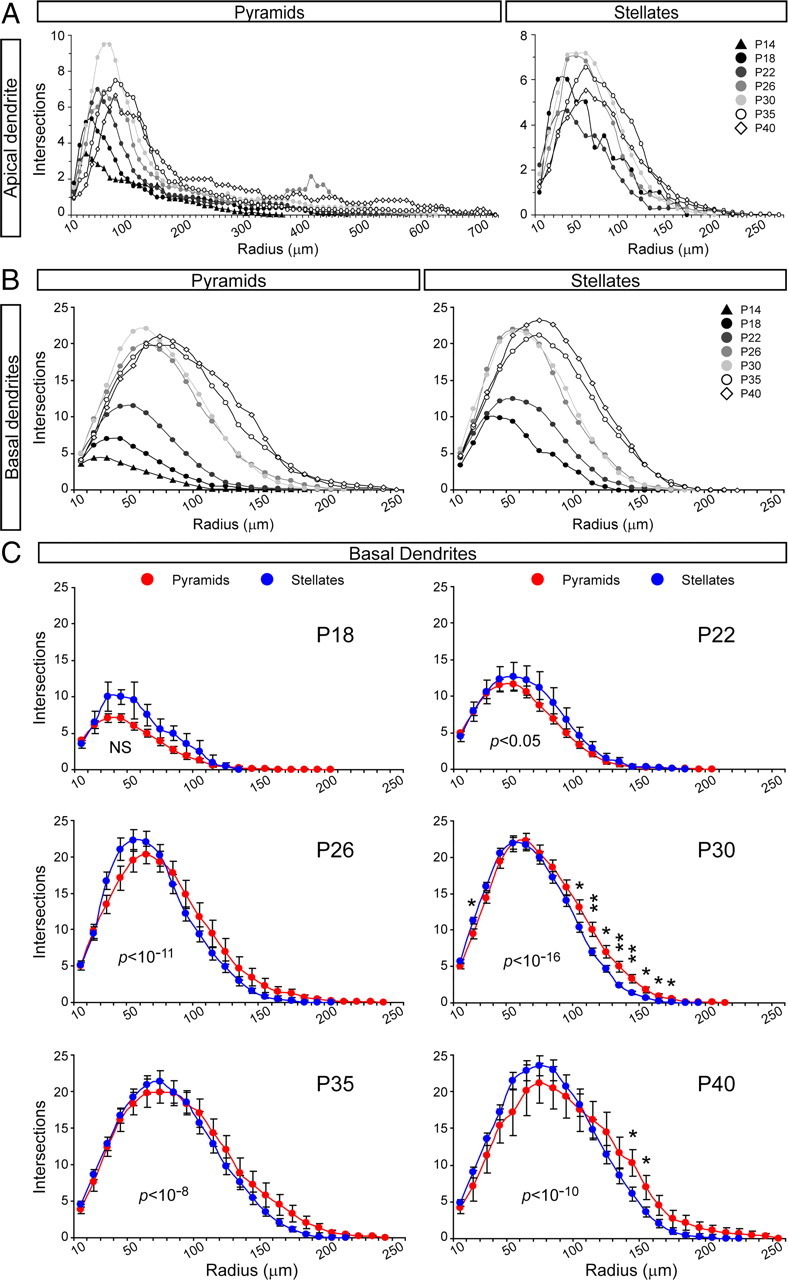
Comparison of complexity of apical and basal dendritic arbors of spiny layer 4 neurons in ferret A17 across normal postnatal development by Sholl analysis. A, B, Comparison of apical dendrites (A) and basal dendrites (B) of pyramidal and stellate neurons across the indicated developmental period. For clarity, mean values are plotted without SEM. Data are color coded for the different ages as indicated in legends. The data distributions were compared by Kolmogorov–Smirnov two-sample test: for apical dendrite pyramids, all comparisons were statistically different (p < 0.0001); for apical dendrite stellates, all comparisons were statistically different (p < 0.01) except for P18 compared with P22, P26, and P30, for P26 compared with P30, and for P35 compared with P40 (p > 0.05); for basal dendrite pyramids, all comparisons were statistically different (p < 0.0001) except for P26 compared with P30 and for P35 compared with P40 (p > 0.05); for basal dendrite stellates, all comparisons were statistically different (p < 0.05) except for P18 compared with P22, for P26 compared with P30, and for P35 compared with P40 (p > 0.05). C, Comparison of basal dendrites between pyramidal and stellate neurons at each individual age across the developmental period studied. Data points are mean ± SEM. *p < 0.05, **p < 0.01, t test after Kolmogorov–Smirnov two-sample test for differences in data distribution. In C, p values for Kolmogorov–Smirnov test at each age are indicated within the plot area. NS, Not significant, p > 0.05.
In contrast to the dramatic differences observed in AD development between pyramids and stellates, the BD arbor of these same cell populations followed very similar development (Figs. 7B,D,F,H, 8B). Only age-matched comparisons by Sholl analysis revealed statistical differences between pyramids and stellates. These indicated that, initially at P22, the BD arbors of stellate neurons were slightly more complex than in pyramids. However, the situation was inverse starting at P26, with the BDs of pyramids being more complex than in stellates, particularly at distal domains (Fig. 8C). Together, our findings so far showed that cortical layer 4 neurons initially emerge as pyramidal cells, and as development proceeds many of them gradually transform into stellate cells. This morphological transformation appears to take place by passive displacement of the apical dendritic arbor combined with the selective reduction of the AD span, while simultaneously increasing the size and complexity of the basal dendrites. Furthermore, our results indicated that ∼22% of layer 4 neurons still remain as pyramids in the mature cortex. As opposed to stellates, layer 4 pyramidal neurons appeared to reach their mature morphology by sustaining the growth and arborization of both their apical and basal dendrites throughout development.
Elimination of retinal input impairs the sculpting of layer 4 neurons into stellates
Because sensory experience and neuronal activity are known to influence the development of cortical circuitry and function, including dendrite growth (Harris and Woolsey, 1981; McMullen et al., 1988; Huberman et al., 2008), we hypothesized that the developmental sculpting of layer 4 spiny neurons from pyramidal to stellate could also be influenced by sensory experience. To test this hypothesis, we focused on the ferret primary visual cortex as previously and analyzed whether early elimination of retinal input by binocular enucleation might influence the pyramidal-to-stellate transformation of layer 4 neurons. Our above analyses on unmanipulated animals showed that the proportions of pyramidal and stellate neurons in layer 4 remained relatively stable from P30 onward, suggesting that by P30 the dendritic sculpting of most cells had already taken place. At this age, the majority of layer 4 spiny neurons in unmanipulated control animals had a stellate appearance, and only a minority was pyramidal. In contrast, neurons in enucleated littermates had a pyramidal appearance much more frequently (Fig. 9A). The detailed morphological analysis of these neurons allowed us to determine that the AD/BD ratio had a wide range of variation in both control and enucleates (Fig. 9B), but on average this ratio was significantly higher in enucleated animals than in controls (controls, 1.52 ± 0.13; enucleates, 1.98 ± 0.15; p < 0.05, t test). Next we used the AD/BD value of individual neurons to classify them as pyramids or stellates, as previously. With this criterion we found that, in enucleated animals, 53.8% of neurons were pyramidal and only 46.2% were stellate, which was significantly different from the proportions in control littermates (34.9% pyramids, 65.1% stellates) (Fig. 8C). This result was consistent with both our initial appreciation of neuronal morphologies and the differences in AD/BD measured between enucleates and controls. To understand the influence of retinal input on the dynamics of dendritic sculpting, we performed a time course analysis of the proportion of pyramidal versus stellate neurons in layer 4, comparing between control and enucleated animals. As shown in Figure 9D, at P18 the percentage of stellate neurons was statistically similar between controls and enucleates. Between P18 and P26, however, the percentage of stellates in control animals increased by nearly sixfold, whereas in enucleated animals, it only increased by twofold, thus becoming statistically lower already by P26. This situation remained similar at P30, the last stage analyzed (Fig. 9D), suggesting that the differences found in enucleated animals at P30 were not attributable to a delayed development. Rather, these results were consistent with incomplete or stalled dendritic development in enucleates compared with controls.
Figure 9.
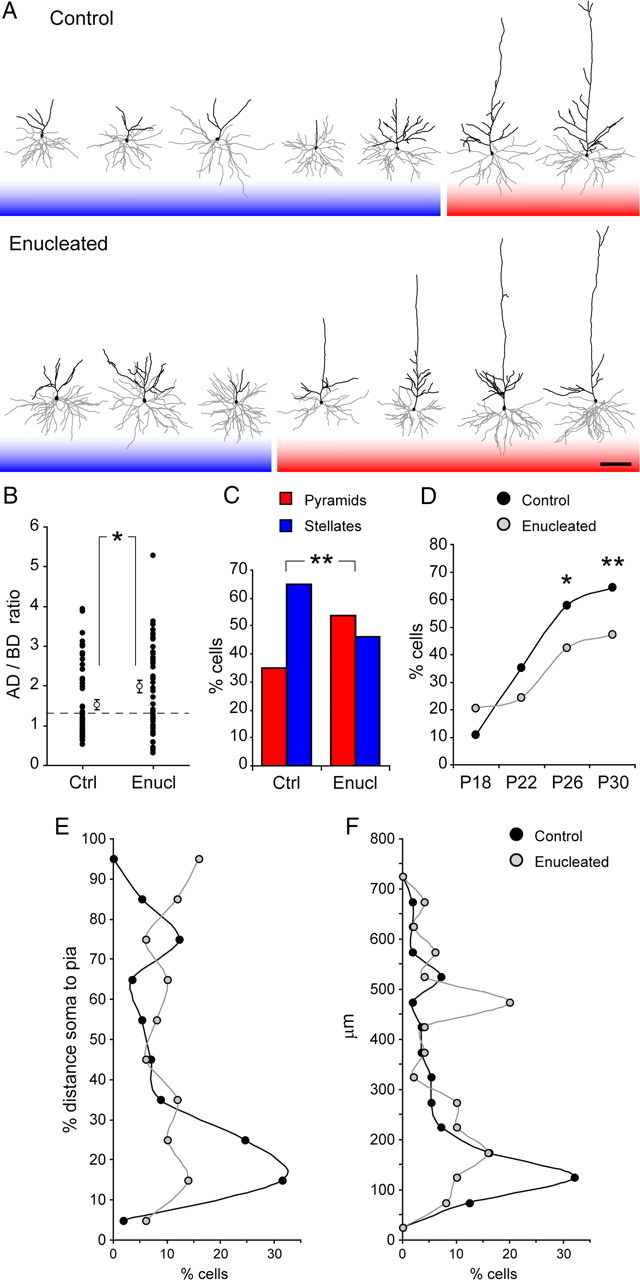
Developmental sculpting of spiny layer 4 neurons in visual cortex requires retinal input. A, Reconstructions of the dendritic arbor of representative spiny layer 4 neurons at P30 in primary visual cortex of control and binocularly enucleated ferrets. Black lines represent apical dendrite, and gray lines represent basal dendrites. Cell bodies are represented by filled polygons. B, Quantification of the AD/BD ratio at P30 in control and enucleated animals. Filled circles represent individual neurons from multiple animals, and open circles represent mean ± SEM of these values. Control, 1.52 ± 0.13; enucleated, 1.98 ± 0.15; *p < 0.05, t test. Dashed line indicates AD/BD of 1.28. C, D, Percentage of neurons categorized as pyramidal or stellate in control and enucleated ferrets at P30 (C) and percentage of neurons categorized as stellates across the developmental period between P18 and P30 (D). Control, n = 64 neurons at P18, 94 at P22, 90 at P26, 126 at P30; enucleated, n = 44 neurons at P18, 123 at P22, 87 at P26, 104 at P30; *p < 0.05, **p < 0.01, χ2 test. In enucleated animals, the sculpting of neurons into a stellate morphology affected a lower percentage of cells compared with controls. E, F, Binned distributions of apical dendrite span as percentage of the distance between soma and pial surface (E) and as absolute length from the cell body (F), for all neurons analyzed at P30 from control and enucleated animals. Each bin corresponds to a range of 10% (E), or 50 μm (F), as indicated. The distributions for cells from enucleated animals were significantly different from those from control animals (p < 0.05 in both cases, Kolmogorov–Smirnov two-sample test). Scale bar, 100 μm.
To better understand the differences between enucleated and controls at P30, we compared the frequency distributions of AD span as before, as both percentage of the S–P distance and absolute length. In both cases, the distribution was different between controls and enucleates: enucleated animals had a larger proportion of neurons with the AD extending to intermediate and upper layers, close to the pial surface (Fig. 9E), and they also had more neurons with a long AD and fewer with a short AD (Fig. 9F). This was consistent with enucleated animals having a greater proportion of pyramids than controls (Fig. 9C). Interestingly, the AD span distributions from P30 enucleated animals were reminiscent of those in P22 control animals (Figs. 5B, 6B, 9E,F), again suggestive of stalled or incomplete development. Altogether, these findings demonstrated that the normal developmental sculpting of layer 4 spiny neurons was impaired in the absence of retinal input, indicating a role in this process.
Next we compared individual parameters of dendritic morphology for pyramid and stellate neurons between enucleated and control ferrets (Tables 1, 2). Although many of the parameters analyzed revealed no statistical differences, most of them indicated that apical and basal dendritic arbors had a marked tendency to be larger and more elaborate in enucleated ferrets than in control littermates, including a longer dendritic span, greater total dendritic length, higher percentage of the S–P distance covered by the apical dendrite, and greater number of branch points (Tables 1, 2). Scholl analysis demonstrated only mild differences in the elaboration and complexity of AD between controls and enucleates (Fig. 10A,B) but important differences in BDs (Fig. 10C–G). The basal dendritic arbor of layer 4 pyramidal cells had approximately similar numbers of crossings in control and enucleated animals, with the important exception at the 10 μm radius, which was likely attributable to the smaller number of basal dendrites in enucleates (Fig. 10C, Table 1). In contrast, the basal dendritic arbor of stellate neurons was significantly more elaborate in enucleated animals, particularly in the distal half of the dendritic tree in which the number of crossings was two to three times larger than in control neurons (Fig. 10D). Surprisingly, we found these exact same differences when comparing between pyramids and stellates in control animals, in which pyramids were significantly more elaborate than stellates only in the distal half of the dendritic arbor (Fig. 10E). Hence, these results suggested that, in enucleated animals, stellate cells might have basal dendrites with similar complexity as pyramidal cells. To test this hypothesis, we compared the Scholl analysis for pyramids and stellates in enucleated ferrets and found that cells in these two groups were identical at the distal half of the basal dendritic arbor, but pyramids were much less elaborate in the proximal domain (Fig. 10F). Finally, the results of all these comparisons not only indicated that stellate cells were more elaborate in enucleated animals than in controls but further suggested that stellate cells in enucleated animals might have a similar profile of elaboration as pyramidal cells in control animals, which indeed we confirmed by direct comparison (Fig. 10G).
Table 1.
Measures of dendritic size and complexity of layer 4 pyramidal neurons in control and enucleated ferrets at P30 (mean ± SEM)
| Control | Enucleated | p | |
|---|---|---|---|
| Span of apical dendrite (μm) | 386.70 ± 30.05 | 426.62 ± 23.17 | 0.290 |
| Span of basal dendrites (μm) | 157.65 ± 4.17 | 168.03 ± 6.52 | 0.186 |
| Ratio AD/BD | 2.45 ± 0.18 | 2.60 ± 0.15 | 0.515 |
| % soma–pia distance by AD | 58.41 ± 3.73 | 71.66 ± 3.70 | 0.017* |
| Number of basal dendrites | 3.75 ± 0.16 | 3.16 ± 0.16 | 0.012* |
| Total length AD (μm) | 1247.17 ± 97.44 | 1412.21 ± 107.89 | 0.278 |
| Total length BD (μm) | 2178.65 ± 112.02 | 2150.76 ± 152.79 | 0.890 |
| Total length AD + BD | 3425.81 ± 155.17 | 3562.97 ± 156.44 | 0.545 |
| Branch points AD | 12.00 ± 0.81 | 12.94 ± 1.12 | 0.500 |
| Branch points BD | 26.50 ± 1.82 | 24.81 ± 2.13 | 0.566 |
% soma–pia distance by AD, Percentage of the distance between the cell soma and the pial surface covered by the apical dendrite.
*p < 0.05.
Table 2.
Measures of dendritic size and complexity of layer 4 stellate neurons in control and enucleated ferrets at P30 (mean ± SEM)
| Control | Enucleated | p | |
|---|---|---|---|
| Span of apical dendrite (μm) | 126.18 ± 5.21 | 143.00 ± 11.16 | 0.184 |
| Span of basal dendrites (μm) | 143.31 ± 2.48 | 163.10 ± 6.26 | 0.007* |
| Ratio AD/BD | 0.88 ± 0.03 | 0.88 ± 0.07 | 0.981 |
| % soma–pia distance by AD | 18.62 ± 1.05 | 19.57 ± 1.94 | 0.639 |
| Number of basal dendrites | 3.75 ± 0.16 | 3.65 ± 0.20 | 0.697 |
| Total length AD (μm) | 432.14 ± 43.50 | 616.19 ± 102.28 | 0.111 |
| Total length BD (μm) | 2057.34 ± 95.91 | 2449.30 ± 187.60 | 0.073 |
| Total length AD + BD | 2453.48 ± 112.09 | 3003.87 ± 190.21 | 0.010** |
| Branch points AD | 5.42 ± 0.66 | 7.17 ± 1.34 | 0.196 |
| Branch points BD | 26.56 ± 1.34 | 30.60 ± 2.37 | 0.114 |
% soma–pia distance by AD, Percentage of the distance between the cell soma and the pial surface covered by the apical dendrite.
*p < 0.01, **p < 0.05.
Figure 10.
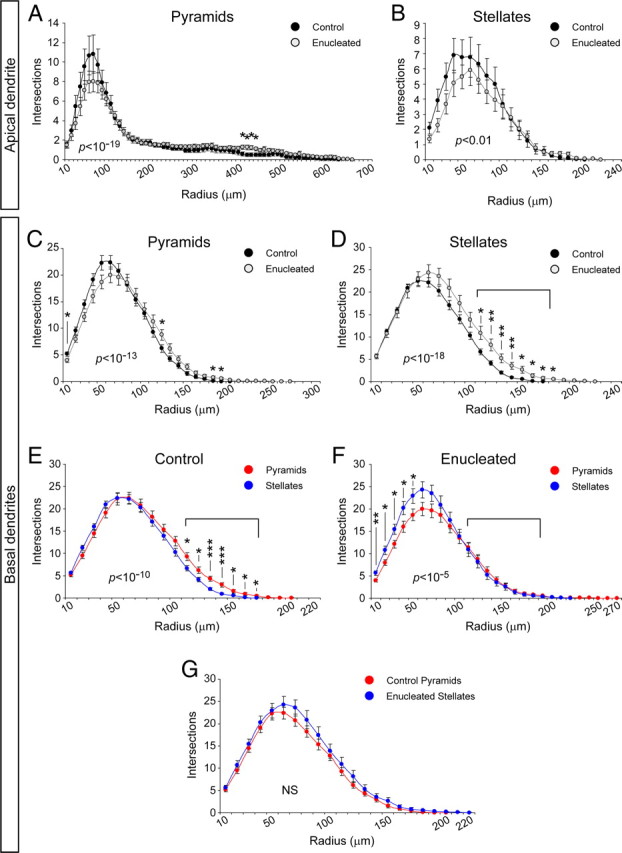
Sholl analysis of the complexity of apical and basal dendritic arbors from spiny layer 4 neurons in ferret A17. A, B, Comparison of the apical dendrite of pyramidal (A) and stellate (B) neurons from control and enucleated animals. C–G, Comparison of the basal dendritic arbor between control and enucleated ferrets: C, D, comparison between pyramids (C) and between stellates (D); E, F, comparison between pyramids and stellates in control (E) and enucleated (F) ferrets; G, comparison between pyramids from control animals and stellates from enucleated animals. Brackets in graphs highlight the same range of dendritic span, in which differences between control and enucleated stellate neurons are maximal. Control, n = 24 pyramids, 36 stellates. Enucleated, n = 32 pyramids, 20 stellates. Data are mean ± SEM; *p < 0.05, **p < 0.01, ***p < 0.001, t test after Kolmogorov–Smirnov two-sample test for differences in data distribution. p values for Kolmogorov–Smirnov tests in each comparison are indicated within the plot area. NS, Not significant, p > 0.05.
Together, our experiments of binocular enucleation revealed that layer 4 neurons require retinal input for sculpting their dendritic tree and transform from pyramidal to stellate. Although our initial assessments suggested that elimination of retinal input might lead to stalled or incomplete development, the last and more detailed set of analyses strongly suggested the opposite: in enucleates, many neurons failed to transform into stellates because they continued growing their apical dendrite. Moreover, even those cells that succeeded in limiting the growth of their apical dendrite and acquired a stellate appearance, they still grew and elaborated their basal dendritic arbor excessively, resembling the basal dendrites of pyramidal cells.
Discussion
Previous studies have shown that pyramidal neurons in the cerebral cortex develop their characteristic dendritic arborization by preferentially extending and elaborating a long apical dendrite over shorter basal dendrites. This process has been shown to rely on the action of various intrinsic and extrinsic factors, including guidance signals, growth factors, neurotrophic factors, and synaptic activity (Whitford et al., 2002). In contrast, little is known about the development of layer 4 spiny stellate neurons and how they achieve their unique dendritic morphology. We show here that, in layer 4 of the ferret visual cortex, spiny stellate neurons initially develop as pyramidal cells (between P14 and P22), exhibiting a long apical dendrite and few short basal dendrites. Our data also suggests that, later on (between P22 and P30), some of these cells start shortening their apical dendrite while continuing to grow their basal dendrites, which results in the sculpting of their dendritic arborization from pyramidal to stellate. In addition, these cells are passively displaced to deeper positions in the cerebral cortex because of its gradual thickening during development, further defining their stellate appearance. However, a small proportion of layer 4 neurons continue growing and elaborating their apical dendrite, persisting as pyramidal neurons through maturity. These findings have important implications for understanding the cellular and molecular mechanisms that give rise to the adult patterns of dendritic arborization.
Pyramidal origin of layer 4 spiny stellate neurons
In most layers of the cerebral cortex, excitatory neurons exhibit a thick and long apical dendrite that outstands over multiple shorter and thinner basal dendrites, giving these cells a pyramidal appearance. In layer 4, however, a majority of excitatory neurons have a markedly short apical dendrite, which confers their dendritic arborizations a star-like appearance (Lund, 1973, 1988; Lund et al., 1979). Whereas the dendritic development of pyramidal neurons has been well studied (Whitford et al., 2002), understanding the mechanisms regulating the development of spiny stellate neurons in layer 4 has received little attention (Lund et al., 1977, 1991; Lund and Holbach, 1991; Callaway and Katz, 1992; Vercelli et al., 1992). Here we demonstrate that spiny stellate neurons in layer 4 do not develop as such from the onset. Rather, we show that layer 4 spiny neurons are all pyramidal in origin and that, later on, the differential growth and arborization of apical versus basal dendrites is responsible for the eventual distinction between spiny stellates and pyramids. Our present findings in mouse and ferret are in agreement with pioneer observations in cat, in which callossally projecting layer 4 stellate neurons were proposed to transform from an early pyramidal morphology to a late stellate appearance (Vercelli et al., 1992). The existence of distinct subclasses of neuronal morphologies within a single layer is not unique to layer 4 but rather a feature common with several other cortical layers (Katz, 1987; Koester and O'Leary, 1992; Dantzker and Callaway, 1998; Briggs and Callaway, 2001). For example, layer 5 contains two types of pyramidal neurons that differ in the span and elaboration of their apical dendrite. As in layer 4, these two different types of layer 5 pyramids also emerge during development by differential sculpting of their dendrites from an early common pattern (Koester and O'Leary, 1992). Together with those early findings, our current observations suggest that differential development of dendritic arborizations from an early common pattern is a general mechanism in the cerebral cortex for the emergence of different dendrite morphologies among distinct neuron subclasses.
Mechanisms of dendritic development: outgrowth versus elimination
Mechanisms of process outgrowth and retraction operate simultaneously during axonal development to refine and optimize target selectivity in multiple neural systems, including the retinocollicular and retinothalamic projections (McLaughlin et al., 2003; McLaughlin and O'Leary, 2005; Huberman et al., 2008), thalamocortical projections (Katz and Crowley, 2002; López-Bendito and Molnár, 2003; Huberman, 2007), corticofugal projections (Stanfield et al., 1982; Stanfield and O'Leary, 1985), intracortical microcircuitry (Borrell and Callaway, 2002; Bender et al., 2003), and hippocampal connections (Borrell et al., 1999; Barallobre et al., 2000; Bagri et al., 2003). As for dendrite development, exuberant growth followed by retraction has been documented for retinal ganglion cells and cortical neurons (Ramoa et al., 1988; Koester and O'Leary, 1992). In cortical neurons, active retraction had been reported for collateral branches of apical dendrite, or for basal dendrites leading to changes in the orientation of the basal dendritic arbor, similar to those we illustrate in layer 4 neurons of the mouse barrel cortex (Fig. 1) (Greenough and Chang, 1988). Major dendritic remodeling of apical dendrites had also been demonstrated for a subclass of mouse layer 5 pyramidal neurons (Koester and O'Leary, 1992) and suggested for cat layer 4 neurons (Vercelli et al., 1992). Our present study indicates that, in the ferret primary visual cortex, a significant proportion of layer 4 spiny neurons suffer a partial or complete elimination of their apical dendrite. Our analyses also demonstrate that elimination of the apical dendrite is not part of a general degenerative process, because it is paralleled by an increase in basal dendrite growth and elaboration in those same neurons. Thus, the developmental mechanisms responsible for dendrite elimination or outgrowth in layer 4 spiny stellate neurons are not only highly effective but also highly specific for each type of dendrite. Previous studies of cortical neuron dendrite development in slice cultures demonstrated that several neurotrophic factors can exert a profound influence on this process. Addition of brain-derived neurotrophic factor (BDNF) onto the culture medium of cortical slices induced the outgrowth and arborization of basal dendrites, whereas blocking endogenous BDNF caused the retraction of basal dendrites in layer 4 neurons. Neurotrophin 3, conversely, had the opposite effect on basal dendritic growth and also counteracted the effects of BDNF (McAllister et al., 1995, 1997, 1999).
The emergence of both pyramidal and stellate morphologies within a single layer during development strongly suggests the existence of differential mechanisms controlling dendrite development. On the one hand, such differences could be underlined by genetic heterogeneity, in which the expression of different combinations of developmentally relevant genes would impinge directly on dendrite development and elimination (McAllister et al., 1997; Krishna et al., 2009). Indeed, genetic combinatorial codes have been shown to control axonal development in various systems (Simpson et al., 2000; Alcamo et al., 2008; Britanova et al., 2008; Luria et al., 2008). On the other hand, the electrophysiological properties of developing neurons may influence the final maturation of their dendrites, and differences in neuronal physiology may determine different sensibilities of the dendritic tree to activity-dependent modifications. For example, inhibition of electrical or synaptic activity in cortical slice cultures enhances elongation and branching of basal dendrites in layer 4 neurons. In contrast, the growth-promoting influence of BDNF on dendrites appears to be neutralized by activity blockade (McAllister et al., 1996). Hence, the combination of neuronal activity-dependent effects of BDNF, with the BDNF-independent effects of neuronal activity, may explain the selective and simultaneous elimination of apical dendrite and elaboration of basal dendrites in layer 4 spiny stellate neurons, as well as the effects of binocular enucleation (see below).
The role of sensory input in shaping dendritic arbors
Our experiments of sensory impairment by binocular enucleation revealed that the capacity of layer 4 pyramids to transform into stellates depends on retinal input. In the absence of retinal axons, a large proportion of layer 4 neurons in the visual cortex conserved a long apical dendrite and failed to acquire a stellate morphology, remaining as pyramidal neurons. These findings are in agreement with previous studies showing that the pharmacological blockade of spontaneous activity or synaptic transmission enhances dendritic outgrowth in layer 4 pyramidal neurons (McAllister et al., 1996). The reception of afferent input has been shown to be important for normal dendrite development in other systems (López-Mascaraque et al., 2005; Tran et al., 2008). In the cerebral cortex, experimental perturbation of visual, whisker, or auditory input modifies the direction of growth and the refinement of basal dendrites, resulting in altered orientation of the dendritic arbor in layer 4 neurons of rodents and rabbits (Harris and Woolsey, 1981; McMullen et al., 1988). Here we find that complete elimination of retinal input changes the patterns of dendrite arborization in layer 4 neurons, with an increased proportion of pyramidal neurons in detriment of stellate neurons. Specifically, our results suggest that a large percentage of neurons failed to stall apical dendrite growth, which instead continued growing prominently. Even the neurons that successfully eliminated the apical dendrite then developed excessively large basal dendrites. What mechanisms could mediate the influence of retinal afferents on the dendritic development of layer 4 neurons? Previous studies demonstrated that binocular enucleation in the ferret results in a significant loss of neurons in the lateral geniculate nucleus (LGN) (Williams et al., 2002). However, LGN axons still target the primary visual cortex and form ocular dominance columns with remarkably normal features (Crowley and Katz, 1999), indicating that the dendritic phenotype we observe is not caused by an absence of afferent LGN axons onto layer 4 neurons. An alternative possibility is that the dendritic development of layer 4 neurons depends on “normal firing activity” of the thalamocortical circuit. In vivo electrophysiological recordings in enucleated ferrets revealed that optic nerve transection causes a dramatic increase in the synchronization of the spontaneous firing activity in the LGN (Weliky, 1999; Chiu and Weliky, 2001). It is possible that the generation of excessively coherent patterns of spontaneous activity during eye removal could contribute to the persistence of pyramidal cell morphologies in the primary visual cortex, by a failure to sculpt layer 4 neurons into the more specialized stellate morphology. Although much needs to be learned about the role of sensory input in the development of cortical circuitry, our study supports the notion that sensory input is important for dendritic maturation (Huberman et al., 2008).
Footnotes
This work was generously supported by The International Human Frontier Science Program Organization, Spanish Ministry of Science and Innovation Grants BFU2006-08961/BFI and SAF2009-07367, and CONSOLIDER Grant CSD2007-00023 (V.B.). We are thankful to L. Katz for his involvement in preliminary experiments, M. de la Parra for technical assistance, and M. Maravall for ideas and for advice on statistical analysis.
References
- Alcamo EA, Chirivella L, Dautzenberg M, Dobreva G, Fariñas I, Grosschedl R, McConnell SK. Satb2 regulates callosal projection neuron identity in the developing cerebral cortex. Neuron. 2008;57:364–377. doi: 10.1016/j.neuron.2007.12.012. [DOI] [PubMed] [Google Scholar]
- Bagri A, Cheng HJ, Yaron A, Pleasure SJ, Tessier-Lavigne M. Stereotyped pruning of long hippocampal axon branches triggered by retraction inducers of the semaphorin family. Cell. 2003;113:285–299. doi: 10.1016/s0092-8674(03)00267-8. [DOI] [PubMed] [Google Scholar]
- Barallobre MJ, Del Río JA, Alcántara S, Borrell V, Aguado F, Ruiz M, Carmona MA, Martín M, Fabre M, Yuste R, Tessier-Lavigne M, Soriano E. Aberrant development of hippocampal circuits and altered neural activity in netrin 1-deficient mice. Development. 2000;127:4797–4810. doi: 10.1242/dev.127.22.4797. [DOI] [PubMed] [Google Scholar]
- Bender KJ, Rangel J, Feldman DE. Development of columnar topography in the excitatory layer 4 to layer 2/3 projection in rat barrel cortex. J Neurosci. 2003;23:8759–8770. doi: 10.1523/JNEUROSCI.23-25-08759.2003. [DOI] [PMC free article] [PubMed] [Google Scholar]
- Borrell V. In vivo gene delivery to the postnatal ferret cerebral cortex by DNA electroporation. J Neurosci Methods. 2010;186:186–195. doi: 10.1016/j.jneumeth.2009.11.016. [DOI] [PubMed] [Google Scholar]
- Borrell V, Callaway EM. Reorganization of exuberant axonal arbors contributes to the development of laminar specificity in ferret visual cortex. J Neurosci. 2002;22:6682–6695. doi: 10.1523/JNEUROSCI.22-15-06682.2002. [DOI] [PMC free article] [PubMed] [Google Scholar]
- Borrell V, Del Río JA, Alcántara S, Derer M, Martínez A, D'Arcangelo G, Nakajima K, Mikoshiba K, Derer P, Curran T, Soriano E. Reelin regulates the development and synaptogenesis of the layer- specific entorhino-hippocampal connections. J Neurosci. 1999;19:1345–1358. doi: 10.1523/JNEUROSCI.19-04-01345.1999. [DOI] [PMC free article] [PubMed] [Google Scholar]
- Borrell V, Yoshimura Y, Callaway EM. Targeted gene delivery to telencephalic inhibitory neurons by directional in utero electroporation. J Neurosci Methods. 2005;143:151–158. doi: 10.1016/j.jneumeth.2004.09.027. [DOI] [PubMed] [Google Scholar]
- Briggs F, Callaway EM. Layer-specific input to distinct cell types in layer 6 of monkey primary visual cortex. J Neurosci. 2001;21:3600–3608. doi: 10.1523/JNEUROSCI.21-10-03600.2001. [DOI] [PMC free article] [PubMed] [Google Scholar]
- Britanova O, de Juan Romero C, Cheung A, Kwan KY, Schwark M, Gyorgy A, Vogel T, Akopov S, Mitkovski M, Agoston D, Sestan N, Molnár Z, Tarabykin V. Satb2 is a postmitotic determinant for upper-layer neuron specification in the neocortex. Neuron. 2008;57:378–392. doi: 10.1016/j.neuron.2007.12.028. [DOI] [PubMed] [Google Scholar]
- Callaway EM. Local circuits in primary visual cortex of the macaque monkey. Annu Rev Neurosci. 1998;21:47–74. doi: 10.1146/annurev.neuro.21.1.47. [DOI] [PubMed] [Google Scholar]
- Callaway EM, Katz LC. Development of axonal arbors of layer 4 spiny neurons in cat striate cortex. J Neurosci. 1992;12:570–582. doi: 10.1523/JNEUROSCI.12-02-00570.1992. [DOI] [PMC free article] [PubMed] [Google Scholar]
- Chiu C, Weliky M. Spontaneous activity in developing ferret visual cortex in vivo. J Neurosci. 2001;21:8906–8914. doi: 10.1523/JNEUROSCI.21-22-08906.2001. [DOI] [PMC free article] [PubMed] [Google Scholar]
- Crowley JC, Katz LC. Development of ocular dominance columns in the absence of retinal input. Nat Neurosci. 1999;2:1125–1130. doi: 10.1038/16051. [DOI] [PubMed] [Google Scholar]
- Dantzker JL, Callaway EM. The development of local, layer-specific visual cortical axons in the absence of extrinsic influences and intrinsic activity. J Neurosci. 1998;18:4145–4154. doi: 10.1523/JNEUROSCI.18-11-04145.1998. [DOI] [PMC free article] [PubMed] [Google Scholar]
- Greenough WT, Chang FL. Dendritic pattern formation involves both oriented regression and oriented growth in the barrels of mouse somatosensory cortex. Brain Res. 1988;471:148–152. doi: 10.1016/0165-3806(88)90160-5. [DOI] [PubMed] [Google Scholar]
- Harris RM, Woolsey TA. Dendritic plasticity in mouse barrel cortex following postnatal vibrissa follicle damage. J Comp Neurol. 1981;196:357–376. doi: 10.1002/cne.901960302. [DOI] [PubMed] [Google Scholar]
- Huberman AD. Mechanisms of eye-specific visual circuit development. Curr Opin Neurobiol. 2007;17:73–80. doi: 10.1016/j.conb.2007.01.005. [DOI] [PubMed] [Google Scholar]
- Huberman AD, Feller MB, Chapman B. Mechanisms underlying development of visual maps and receptive fields. Annu Rev Neurosci. 2008;31:479–509. doi: 10.1146/annurev.neuro.31.060407.125533. [DOI] [PMC free article] [PubMed] [Google Scholar]
- Jackson CA, Peduzzi JD, Hickey TL. Visual cortex development in the ferret. I. Genesis and migration of visual cortical neurons. J Neurosci. 1989;9:1242–1253. doi: 10.1523/JNEUROSCI.09-04-01242.1989. [DOI] [PMC free article] [PubMed] [Google Scholar]
- Jones EG. Varieties and distribution of non-pyramidal cells in the somatic sensory cortex of the squirrel monkey. J Comp Neurol. 1975;160:205–267. doi: 10.1002/cne.901600204. [DOI] [PubMed] [Google Scholar]
- Katz LC. Local circuitry of identified projection neurons in cat visual cortex brain slices. J Neurosci. 1987;7:1223–1249. doi: 10.1523/JNEUROSCI.07-04-01223.1987. [DOI] [PMC free article] [PubMed] [Google Scholar]
- Katz LC, Crowley JC. Development of cortical circuits: lessons from ocular dominance columns. Nat Rev Neurosci. 2002;3:34–42. doi: 10.1038/nrn703. [DOI] [PubMed] [Google Scholar]
- Koester SE, O'Leary DD. Functional classes of cortical projection neurons develop dendritic distinctions by class-specific sculpting of an early common pattern. J Neurosci. 1992;12:1382–1393. doi: 10.1523/JNEUROSCI.12-04-01382.1992. [DOI] [PMC free article] [PubMed] [Google Scholar]
- Krishna K, Nuernberger M, Weth F, Redies C. Layer-specific expression of multiple cadherins in the developing visual cortex (V1) of the ferret. Cereb Cortex. 2009;19:388–401. doi: 10.1093/cercor/bhn090. [DOI] [PubMed] [Google Scholar]
- López-Bendito G, Molnár Z. Thalamocortical development: how are we going to get there? Nat Rev Neurosci. 2003;4:276–289. doi: 10.1038/nrn1075. [DOI] [PubMed] [Google Scholar]
- López-Mascaraque L, García C, Blanchart A, De Carlos JA. Olfactory epithelium influences the orientation of mitral cell dendrites during development. Dev Dyn. 2005;232:325–335. doi: 10.1002/dvdy.20239. [DOI] [PubMed] [Google Scholar]
- Lund JS. Organization of neurons in the visual cortex, area 17, of the monkey (Macaca mulatta) J Comp Neurol. 1973;147:455–496. doi: 10.1002/cne.901470404. [DOI] [PubMed] [Google Scholar]
- Lund JS. Anatomical organization of macaque monkey striate visual cortex. Annu Rev Neurosci. 1988;11:253–288. doi: 10.1146/annurev.ne.11.030188.001345. [DOI] [PubMed] [Google Scholar]
- Lund JS, Holbach SM. Postnatal development of thalamic recipient neurons in the monkey striate cortex. I. Comparison of spine acquisition and dendritic growth of layer 4C alpha and beta spiny stellate neurons. J Comp Neurol. 1991;309:115–128. doi: 10.1002/cne.903090108. [DOI] [PubMed] [Google Scholar]
- Lund JS, Boothe RG, Lund RD. Development of neurons in the visual cortex (area 17) of the monkey (Macaca nemestrina): a Golgi study from fetal day 127 to postnatal maturity. J Comp Neurol. 1977;176:149–188. doi: 10.1002/cne.901760203. [DOI] [PubMed] [Google Scholar]
- Lund JS, Henry GH, MacQueen CL, Harvey AR. Anatomical organization of the primary visual cortex (area 17) of the cat. A comparison with area 17 of the macaque monkey. J Comp Neurol. 1979;184:599–618. doi: 10.1002/cne.901840402. [DOI] [PubMed] [Google Scholar]
- Lund JS, Holbach SM, Chung WW. Postnatal development of thalamic recipient neurons in the monkey striate cortex. II. Influence of afferent driving on spine acquisition and dendritic growth of layer 4C spiny stellate neurons. J Comp Neurol. 1991;309:129–140. doi: 10.1002/cne.903090109. [DOI] [PubMed] [Google Scholar]
- Luria V, Krawchuk D, Jessell TM, Laufer E, Kania A. Specification of motor axon trajectory by ephrin-B:EphB signaling: symmetrical control of axonal patterning in the developing limb. Neuron. 2008;60:1039–1053. doi: 10.1016/j.neuron.2008.11.011. [DOI] [PubMed] [Google Scholar]
- Mates SL, Lund JS. Neuronal composition and development in lamina 4C of monkey striate cortex. J Comp Neurol. 1983;221:60–90. doi: 10.1002/cne.902210106. [DOI] [PubMed] [Google Scholar]
- McAllister AK, Lo DC, Katz LC. Neurotrophins regulate dendritic growth in developing visual cortex. Neuron. 1995;15:791–803. doi: 10.1016/0896-6273(95)90171-x. [DOI] [PubMed] [Google Scholar]
- McAllister AK, Katz LC, Lo DC. Neurotrophin regulation of cortical dendritic growth requires activity. Neuron. 1996;17:1057–1064. doi: 10.1016/s0896-6273(00)80239-1. [DOI] [PubMed] [Google Scholar]
- McAllister AK, Katz LC, Lo DC. Opposing roles for endogenous BDNF and NT-3 in regulating cortical dendritic growth. Neuron. 1997;18:767–778. doi: 10.1016/s0896-6273(00)80316-5. [DOI] [PubMed] [Google Scholar]
- McAllister AK, Katz LC, Lo DC. Neurotrophins and synaptic plasticity. Annu Rev Neurosci. 1999;22:295–318. doi: 10.1146/annurev.neuro.22.1.295. [DOI] [PubMed] [Google Scholar]
- McLaughlin T, O'Leary DD. Molecular gradients and development of retinotopic maps. Annu Rev Neurosci. 2005;28:327–355. doi: 10.1146/annurev.neuro.28.061604.135714. [DOI] [PubMed] [Google Scholar]
- McLaughlin T, Hindges R, O'Leary DD. Regulation of axial patterning of the retina and its topographic mapping in the brain. Curr Opin Neurobiol. 2003;13:57–69. doi: 10.1016/s0959-4388(03)00014-x. [DOI] [PubMed] [Google Scholar]
- McMullen NT, Goldberger B, Suter CM, Glaser EM. Neonatal deafening alters nonpyramidal dendrite orientation in auditory cortex: a computer microscope study in the rabbit. J Comp Neurol. 1988;267:92–106. doi: 10.1002/cne.902670107. [DOI] [PubMed] [Google Scholar]
- Olson EC, Kim S, Walsh CA. Impaired neuronal positioning and dendritogenesis in the neocortex after cell-autonomous Dab1 suppression. J Neurosci. 2006;26:1767–1775. doi: 10.1523/JNEUROSCI.3000-05.2006. [DOI] [PMC free article] [PubMed] [Google Scholar]
- Ramoa AS, Campbell G, Shatz CJ. Dendritic growth and remodeling of cat retinal ganglion cells during fetal and postnatal development. J Neurosci. 1988;8:4239–4261. doi: 10.1523/JNEUROSCI.08-11-04239.1988. [DOI] [PMC free article] [PubMed] [Google Scholar]
- Ramon y Cajal S. Sur la structure du système nerveux de l'homme et des vertébrés. Cellule. 1891;7:125–178. [Google Scholar]
- Simpson JH, Bland KS, Fetter RD, Goodman CS. Short-range and long-range guidance by Slit and its Robo receptors: a combinatorial code of Robo receptors controls lateral position. Cell. 2000;103:1019–1032. doi: 10.1016/s0092-8674(00)00206-3. [DOI] [PubMed] [Google Scholar]
- Staiger JF, Flagmeyer I, Schubert D, Zilles K, Kötter R, Luhmann HJ. Functional diversity of layer IV spiny neurons in rat somatosensory cortex: quantitative morphology of electrophysiologically characterized and biocytin labeled cells. Cereb Cortex. 2004;14:690–701. doi: 10.1093/cercor/bhh029. [DOI] [PubMed] [Google Scholar]
- Stanfield BB, O'Leary DD. The transient corticospinal projection from the occipital cortex during the postnatal development of the rat. J Comp Neurol. 1985;238:236–248. doi: 10.1002/cne.902380210. [DOI] [PubMed] [Google Scholar]
- Stanfield BB, O'Leary DD, Fricks C. Selective collateral elimination in early postnatal development restricts cortical distribution of rat pyramidal tract neurones. Nature. 1982;298:371–373. doi: 10.1038/298371a0. [DOI] [PubMed] [Google Scholar]
- Tran H, Chen H, Walz A, Posthumus JC, Gong Q. Influence of olfactory epithelium on mitral/tufted cell dendritic outgrowth. PLoS One. 2008;3:e3816. doi: 10.1371/journal.pone.0003816. [DOI] [PMC free article] [PubMed] [Google Scholar]
- Vercelli A, Assal F, Innocenti GM. Emergence of callosally projecting neurons with stellate morphology in the visual cortex of the kitten. Exp Brain Res. 1992;90:346–358. doi: 10.1007/BF00227248. [DOI] [PubMed] [Google Scholar]
- Weliky M. Recording and manipulating the in vivo correlational structure of neuronal activity during visual cortical development. J Neurobiol. 1999;41:25–32. doi: 10.1002/(sici)1097-4695(199910)41:1<25::aid-neu5>3.0.co;2-#. [DOI] [PubMed] [Google Scholar]
- Whitford KL, Dijkhuizen P, Polleux F, Ghosh A. Molecular control of cortical dendrite development. Annu Rev Neurosci. 2002;25:127–149. doi: 10.1146/annurev.neuro.25.112701.142932. [DOI] [PubMed] [Google Scholar]
- Williams AL, Reese BE, Jeffery G. Role of retinal afferents in regulating growth and shape of the lateral geniculate nucleus. J Comp Neurol. 2002;445:269–277. doi: 10.1002/cne.10171. [DOI] [PubMed] [Google Scholar]