

Abstract
The antitumor activity of shikonin derivatives is largely dependent on the generation of superoxide radicals and the alkylation activity of their naphthoquinone moiety. However, our recent study showed that 1,4-dioxime-5,8-dimethoxynaphthalene (DMAKO-05), a novel shikonin derivative, displayed more potential antitumor activity and less toxicity compared to fluorouracil (5-FU) both in vitro and in vivo, even though the hydroxyl and carbonyl groups of its naphthoquinone structure were shielded. To understand the underlying mechanisms, we investigated the metabolism of DMAKO-05 in rat liver microsomes. The kinetic analysis indicated that DMAKO-05 underwent a biphasic metabolism in rat liver microsomes. The inhibition experiments showed that CYP1A and CYP3A were the major enzymes in the metabolism of DMAKO-05, along with partial contribution from CYP2A. In addition, the structures of eight DMAKO-05 metabolites, which were characterized by accurate mass and MS/MS fragmentograms, implied that DMAKO-05 was mainly metabolized through the oxygenation of its naphthoquinone nucleus and the hydrolysis of its side chain, instead of the oxidation of hydroxyimine to ketone. Therefore, DMAKO-05 should not be considered as a traditional naphthoquinone prodrug.
KEY WORDS: antitumor, LC-TOF-MS/MS, metabolism, method validation, rat hepatic microsomes, shikonin oxime
INTRODUCTION
Shikonin and its derivatives, isolated from the roots of the plant Lithospermum erythrorhizon Sieb. et Zucc, have been used in Chinese traditional medicine for many years as a cancer treatment (1). It is widely believed that the naphthazarin ring acted as the pharmacophore of shikonin and its derivatives (2). On one hand, the generation of superoxide radical initiated by the naphthazarin may cause cellular damage (3). On the other hand, a highly potent alkylating agent derived from the same structure may capture cellular nucleophiles such as DNA, protein, or glutathione (4) to generate nonspecific cytotoxicity. Therefore, modification of the naphthazarin structure to increase the selective binding of shikonin and its derivatives to tumor cells and to decrease nonselective binding to cellular nucleophiles would yield promising derivatives for its use in therapy.
Our previous study had shown that most of 5,8-O-dimethyl acylshikonin derivatives displayed selective cytotoxic activities to MCF-7, with no cytotoxicity towards normal cells. The 5,8-O-dimethyl acylshikonin derivatives also showed a higher selectivity to S-180 carcinoma and less toxicity in vivo than the parent shikonin (5). Meanwhile, it was observed that 6-isomers of 5,8-O-dimethyl acylshikonin derivatives exhibited greater antitumor activities than the corresponding 2-isomers of 5,8-O-dimethyl acylshikonin derivatives (5). This conclusion was supported by another report that 6-substituted 5,8-dimethoxy-1,4-naphthoquinone (DMNQ) derivatives showed more potent ability to capture cellular nucleophiles than 2-substituted DMNQs and naphthazarins (6). Although these modifications on the naphthazarin mother nucleus provided some advantages, no significant change in the in vivo side effects was observed. In hope to further decrease the cytotoxicity, we designed oxime derivatives to protect carbonyl groups and expected to reduce the extensive cytotoxicity caused by 1,4-naphthoquinone as a prodrug. Surprisingly, unlike the prodrugs, 1,4-dioxime-5,8-dimethoxynaphthalene derivatives displayed promising antitumor activities both in vitro and in vivo by an unknown mechanisms. To our knowledge, the intact naphthazarin scaffold of shikonin and its derivatives is closely associated with the generation of superoxide radical and potential bioalkylation, which further enhanced their antitumor activities in vitro and in vivo. We hypothesized that the shikonin oxime compounds may be converted to their active cytotoxic metabolites through oxidative deoximation. To investigate the possible underlying antitumor mechanism, we have characterized the metabolic pathway of 1,4-dioxime-5,8-dimethoxynaphthalene (DMAKO-05) (Fig. 1) using rat liver microsomal fraction. Additionally, a series of specific inhibitors of P450 isoforms were applied to investigate their effects on the rat liver microsome metabolism of DMAKO-05.
Fig. 1.
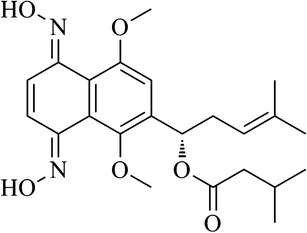
Chemical structure of DMAKO-05
MATERIALS AND METHODS
Chemicals and Reagents
The compound DMAKO-05 was synthesized in our laboratory (7,8) with purity greater than 97% by HPLC. RPMI 1640 medium and fetal bovine serum (FBS) were purchased from HyClone Laboratories, Inc. (Logan, UT, USA). HPLC grade methanol and acetonitrile were purchased from J&K Scientific Ltd. (Shanghai, China). Distilled water was produced by a Milli-Q purification system (Millipore, Billerica, MA, USA). Sodium dihydrogen phosphate and disodium hydrogen phosphate were from Sinopharm Chemical Reagent Co., Ltd. (Shanghai, China). Anhydrous magnesium chloride, nicotinamide adenine dinucleotide phosphate (NADP+), glucose-6-phosphate (G-6-P), glucose-6-phosphate dehydrogenase (G-6-P-DH), alpha-naphthoflavone (ANF), 8-methoxypsoralen(8-MOP), sulfaphenazole (Sulp), tranylcypromine (Tra), quinidine (Quin), 4-methylpyrazole (4-MP), and ketoconazole (Ket) were obtained from Sigma-Aldrich (St. Louis, MO, USA).
Cell Culture
Human colorectal carcinoma cell lines HCT 116 and mouse colonic carcinoma cell lines CT 26 were obtained from the Cell Bank of the Chinese Academy of Sciences (Shanghai, China). HCT 116 and CT 26 cells were cultured in RPMI 1640 supplemented with 10% FBS, 1 mM nonessential amino acids, 0.1 mM sodium pyruvate, 100 U/mL penicillin, and 100 μg/mL streptomycin. The cells were incubated at 37°C in a humidified atmosphere with 5% CO2.
Animals
Healthy male Sprague Dawley (SD) rats (200 ± 20 g) were purchased from SLAC Laboratory Animal Co. Ltd. (Shanghai, China). Seven-week-old specific pathogen-free (SPF) male Kun Ming (KM) mice with the weight of 18–22 g each were obtained from Shanghai Laboratory Animal Center, Chinese Academy of Sciences (Shanghai, China). All the animal procedures were performed according to the Guidelines of the Experimental Animal Ethics Committee of Shanghai Jiao Tong University. Animals were fed under normal conditions. Temperature, humidity, and photoperiod were controlled at 21°C ± 2°C, 50 ± 10%, and 12 h light/12 h dark cycles, respectively.
Microsomal Preparation
Rat liver microsomes were prepared from six animals using glass and handheld homogenizers (Health Life Co. Ltd., Nantong, China). In brief, rats were sacrificed by cervical dislocation, and livers were removed without delay, weighed, and homogenized (1:3 w/v) in ice-cold homogenizing buffer containing 0.1 M Tris-Cl (pH 7.4), 10 mM EDTA, and 150 mM KCl. The homogenate was transferred to polypropylene centrifuge tubes and centrifuged at 12,500×g for 15 min at 4°C in a L-80XP Beckman ultracentrifuge (Beckman, Carlsbad, CA, USA). The supernatant was removed and ultracentrifuged at 105,000×g for 70 min at 4°C to obtain the microsomal pellets. The pellets were washed and resuspended in 0.1 M sodium pyrophosphate buffer (pH 7.4), containing 10 mM EDTA, and centrifuged at 105,000×g for 45 min at 4°C. The pellets were finally resuspended in 0.05 M Tris-Cl (pH 7.5), containing 10 mM EDTA and 20% glycerol and stored at −80°C. Microsomal protein concentration was quantified using a BCA kit (Beyotime Biotechnology, Haimen, China).
Bioactivity Experiments
Cytotoxicity Against Cancer Cells (9)
HCT 116 cells at 70%–80% confluency were trypsinized and plated into 96-well plates at a density of 1 × 10⁴ cells/mL. After culturing for 24 h, cells were treated with serial dilutions of DMAKO-05 or fluorouracil (5-FU) for 12, 24, 48, and 72 h, and control cells were treated with buffer alone. The supernatants were removed and replaced by 200 μL RPMI 1640 medium without serum, and 20 μL 3-(4,5-dimethylthiazol-2-yl)-2,5-diphenyltetrazolium bromide (MTT) solution (5 mg/mL) was added to each well. After incubation for 4 h, the medium was aspirated and 100 μL of dimethyl sulfoxide (DMSO) was added to dissolve the formazan crystals in each well. The absorbance was measured at 570 nm using a Multiskan MK3 microplate reader (Thermo, USA). The percentage of cell survival was calculated as the absorbance ratio of treated cells compared to untreated cells. Half maximal inhibitory concentration (IC50) is defined as the concentration of an inhibitor that is required for the inhibition of 50% of cells relative to untreated control cells and was obtained from linear regression analysis using IBM SPSS Statistics software (21.0).
Antitumor Activity In Vivo
The right flanks of KM mice were injected subcutaneously with CT 26 (2 × 10⁶). After 24 h, the mice were treated with DMAKO-05 (12 mg/kg/day) via an intraperitoneal (i.p.) injection, followed by 5-FU (25 mg/kg/day) administered as a positive control. Mice were sacrificed on day 11, and the tumors were removed and weighed. Tumor growth inhibition was calculated as the ratio of the average weight of treatment group to that of the control group (5).
HPLC Experiments
Apparatus and Chromatography Conditions
Chromatographic analysis was conducted using an Agilent 1260 HPLC system (Agilent Technologies, Palo Alto, CA, USA), which consisted of a binary pump (G1312B), a vacuum solvent delivery degasser (G1322A), an autosampler (G1329B), a column oven (G1316A), and a diode array detector (G4212B). Samples were separated on a Sepax GP-C18 column (25 cm × 4.6 mm i.d., 5 μm) which was purchased from Sepax Technologies, Inc. (Newark, DE, USA). The system was operated at a flow rate of 0.8 mL/min using an acetonitrile-water linear gradient under the following conditions: 0–3 min, 20% acetonitrile; 3–5 min, 20%–30% acetonitrile; 5–32 min, 30%–40% acetonitrile; 32–34 min, 40%–50% acetonitrile; 34–42 min, 50% acetonitrile; 42–50 min, 50%–100% acetonitrile; 50–60 min, 100% acetonitrile; and 60.01 min, 20% acetonitrile. The column temperature was maintained at 37°C, the wavelength was set at 318 nm, and the injection volume was 20 μL.
Extraction Procedure
After incubation of the samples (200 μL), four volumes (800 μL) of methanol/ethyl acetate (3:1 v/v) were added to terminate the metabolic processes. The samples were shaken for 5 min on a Vortex Genie (Scientific Industries, New York, NY, USA) and were then centrifuged at 10,000×g for 5 min at 4°C. The supernatant was evaporated to dryness at 50°C under a slow stream of nitrogen, and the residue was reconstituted in 100 μL of the initial mobile phase.
Method Validation
To ensure the efficacy of sample pretreatment and to eliminate background interference, the specificity of the method was investigated through the analysis of drug-free rat liver microsomes. The linearity of the method was evaluated by processing a calibration curve with a range from 0.05 to 100 μM, and each calibration standard was assayed five times. A linear least squares regression analysis was conducted to demonstrate the linearity of the method.
Limits of detection (LODs) and limits of quantitation (LOQs) were estimated from the signal-to-noise ratio. The LOD was defined as the lowest concentration to give a response three times the average baseline noise. The LOQ was determined as the lowest concentration that provided a peak area with a signal-to-noise ratio >10 (10).
Accuracy was defined as the percent of deviation between the true value and the measured value, and precision was expressed as relative standard deviation (RSD%) (11). The accuracy and precision of the method were determined by analyzing a set of quality control (QC). DMAKO-05 samples at three different concentrations (1, 10, and 50 μM) were used. The intraday accuracy and precision were determined from the results of each concentration repeated five times, and the interday accuracy and precision were assessed by the analysis of the QC samples performed on three consecutive days.
The recoveries of DMAKO-05 were determined by comparing the peak area obtained from DMAKO-05 extracted from rat microsome samples with a DMAKO-05 standard (0.5, 5, and 50 μM) prepared in mobile phase, and repeated three times for each concentration.
The short-term stability at room temperature was determined using DMAKO-05 extracted from rat microsomes spiked with different concentrations of DMAKO-05. Triplicate aliquots of each low- and high-concentration sample were analyzed at 0, 4, 12, and 24 h.
Determination of Km and Vmax in Rat Liver Microsomes
The assays were performed in triplicates for the rat liver microsomes by measuring the disappearance of parent compound. A stock solution of DMAKO-05 (10 mM) in DMSO was freshly prepared. The incubation mixture consisted of 0.1 M potassium phosphate buffer (pH 7.4), microsomes, a substrate, 3.3 mM MgCl2, and a NADPH-regenerating system in a total volume of 200 μL. The NADPH-regenerating system consisted of 0.25 mM NADP+, 5 mM glucose-6-phosphate, and 0.5 units of glucose-6-phosphate dehydrogenase. After pre-warming for 5 min at 37°C, the reaction was initiated by the addition of rat liver microsomes. Reactions were terminated and handled as described in “Extraction Procedure.” The optimal conditions for microsomal incubation were as follows: the microsomal protein concentration was evaluated from 0 to 5 mg/mL at first and was incubated for 0 to 60 min. After the linear range for the disappearance of DMAKO-05 was determined, the concentration of DMAKO-05 was set from 0.1 to 50 μM. The Michaelis-Menten enzyme kinetic constants for in vitro metabolism of DMAKO-05 were calculated by nonlinear regression using SigmaPlot Software (version 12.0, Systat Software, Inc., Point Richmond, CA, USA).
CYP450 Inhibition Experiments
A series of specific inhibitors of P450 isoforms were applied to investigate their effects on the metabolism of DMAKO-05 in rat liver microsomes. The inhibitors ANF (CYP1A), 8-MOP (CYP2A), Sulp (CYP2C9), Tra (CYP2C19), Quin (CYP2D6), 4-MP (CYP2E1), and Ket (CYP3A) were added to reaction incubations at various concentrations (0.1–100 μM). Incubations consisted of 0.1 mg/mL microsomal protein, 0.1 M potassium phosphate buffer (pH 7.4), 3.3 mM MgCl2, and NADPH-regenerating system (0.25 mM NADP+, 5 mM G-6-P, and 0.5 U G-6-P-DH) in a final volume of 200 μL. The inhibition reactions were incubated in the presence or absence of DMAKO-05 (2.5 μM) at 37°C for 10 min (reaction rate was linear with incubation time under this condition), and reactions were terminated and handled as described in “Extraction Procedure.” The inhibitor-insensitive activity of CYP enzymes was used to express the P450-mediated activity in the presence of an inhibitor; in brief, it means that the activity of CYP enzymes in the absence of an inhibitor subtracts the corresponding activity in the presence of an inhibitor (12).
LC-MS/MS Experiments
Sample Preparation
DMAKO-05 was incubated with rat liver microsomes to examine the potential P450-mediated metabolism. The 1-mL incubation mixture contained microsomal protein 1 mg/mL, 0.1 M potassium phosphate buffer (pH 7.4), 10 μM DMAKO-05, and the same NADPH-regenerating system described above. After incubation for 30 min at 37°C, all samples were extracted by ethyl acetate and evaporated under a slow stream of nitrogen at room temperature. The residue was reconstituted with 100 μL of 70% methanol. Negative control incubation was extracted immediately at zero time.
LC-MS/MS Analysis
The controls and samples (described in “Sample Preparation”) were analyzed on a TripleTOF 4600 MS/MS system (AB Sciex, Foster City, CA, USA) coupled to Agilent 1260 HPLC system. Chromatographic conditions were described in “Apparatus and Chromatography Conditions.” The mass spectrometer was operated in the positive ESI mode with a DuoSpray™ source (AB Sciex, USA), and mass range was set at m/z 100–650. The following parameter settings were also used: ion spray voltage, 5500 V; ion source heater, 700°C; curtain gas, 35 psi; and ion source gas, 45 psi; MS/MS experiments were run with 150-ms accumulation time for TOF-MS and 80-ms accumulation time in MS/MS experiments. Collision energy was 35 eV; collision energy spread was 15 in the MS/MS experiments.
RESULTS AND DISCUSSION
Antitumor Activity of DMAKO-05 In Vitro and In Vivo
HCT 116 colorectal carcinoma cells were treated with DMAKO-05 or 5-FU at five different concentrations (0.1, 0.5, 1, 5, and 10 μM) for 0, 12, 24, 48, and 72 h, respectively. The results showed that the cell survival rate was affected in a dose- and time-dependent manner. As demonstrated in Fig. 2, the IC50 of DMAKO-05 for 48 h was 0.42 μM. Extending the incubation period to 72 h had no effect on the IC50, as seen by MTT assays performed over 48 h. However, the optimum time of 5-FU was 72 h and its IC50 was 3.22 μM. Obviously, DMAKO-05 displayed more potent cytotoxicity than 5-FU in vitro.
Fig. 2.
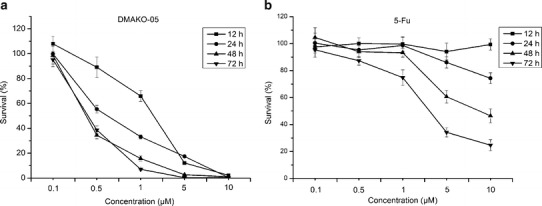
Dose- and time-dependent inhibitory effect of DMAKO-05 (a) and 5-FU (b) on the cell growth of HCT 116 colorectal carcinoma cells using a MTT assay
Next, we determined the antitumor effect of DMAKO-05 using an animal model with a subcutaneous xenograft CT 26 tumor. 5-FU and physiological saline were used as positive and negative controls, respectively. As shown in Table I, DMAKO-05 significantly inhibited the growth of CT 26 by 79.05% when administered at 12 mg/kg/day for 10 days. However, although 5-FU demonstrated 75.23% inhibition at the higher concentration (25 mg/kg/day), the average weight of the treated mice decreased significantly (P < 0.01) in comparison with the negative control group, suggesting a typical symptom of weight loss due to cytotoxicity. Interestingly, DMAKO-05 had no influence on the weights of KM mice tested. Taken together, DMAKO-05 exhibited more potential antitumor activity and less toxicity than 5-FU in vivo as well.
Table I.
Tumor Growth Inhibition in KM Mice Implanted with CT 26 Cells
| Group | Body weight at different times (g) | Tumor weight (g) | Tumor inhibition rate (%) | |
|---|---|---|---|---|
| Initial drug injection | Last drug injection | |||
| DMAKO-05 | 27.82 ± 1.91 | 34.85 ± 2.21 | 0.22 ± 0.08 | 79.05 |
| 5-FU | 26.94 ± 2.13 | 23.33 ± 2.63** | 0.26 ± 0.13 | 75.23 |
| Control | 26.91 ± 2.27 | 33.02 ± 2.77 | 1.05 ± 0.16 | |
Data were presented as mean ± S.D., and significance was assessed with Student’s t test. Differences were considered significant at **P < 0.01, compared with control group
HPLC Method Validation
The maximum absorption wavelength of DMAKO-05 was determined using a diode array detector (DAD), and the detection wavelength was set at 318 nm via scanning in the UV spectrum. As illustrated in Fig. 3, DMAKO-05 and its metabolites were separated well at baseline under these chromatographic conditions. No interfering peaks were observed with the same retention time of DMAKO-05 or the produced metabolites, sufficiently implying that this method had an adequate resolution under the described chromatographic conditions.
Fig. 3.
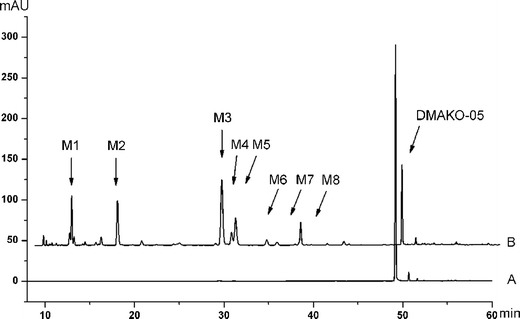
HPLC chromatograms of eight metabolites and the parent compound DMAKO-05, extracted from rat liver microsome incubations at zero time (a) and 30 min (b)
The method showed that linear response over the DMAKO-05 concentration range was 0.05–100 μM. The correlation coefficient of the calibration curve was greater than 0.999. The typical regression equation was y = 11.479x − 0.1795 (r2 = 0.9998), where y means the peak area of DMAKO-05 and x represents the concentration of DMAKO-05 in the microsomal system.
The LOD at a signal-to-noise ratio of 3 (S/N = 3) was 0.01 μM using a step-by-step dilution method, and the LOQ at a signal-to-noise ratio of 10 (S/N = 10) was 0.05 μM.
The intra- and interday precision and accuracy of this method were determined by analyzing spiked samples DMAKO-05 (n = 5) at concentrations of 1, 10, and 50 μM within 1 day and in three consecutive days. The variations around the mean value should not exceed 15% of the RSD, and the LOQ should not exceed 20% of the RSD. The obtained values were in agreement with the recommended values in the literature (13).
The absolute recovery was measured as the response of a processed spiked matrix standard, and it was expressed as a percentage of the response of a pure standard, which had not been subjected to sample pretreatment, and it also indicated whether this method provided a response for the entire amount of analyte present in the sample (14). Spiked with the serial concentrations of DMAKO-05 (1, 10, and 50 μM), the absolute recovery of DMAKO-05 extracted from the rat liver microsomes was 71.2%, 74.3%, and 79.7%, respectively, and its RSD was below 15%.
The short-term stability of DMAKO-05 in working solution was determined at the final concentrations of 1 and 50 μM with an indication that DMAKO-05 was stable in the evaluated conditions within 24 h (RSD <5.0%).
Estimates of In Vitro Kinetic Parameters for DMAKO-05 in Rat Liver Microsomes
Several in vitro models are now increasingly applied for quantitative and qualitative predictors of in vivo pharmacokinetics in the drug discovery process in a “fail early, fail cheaply” philosophy (15). Liver microsomes are the most widely used in vitro system for understanding the metabolism of a new drug candidate, because of the rich expression of phase I enzymes and their long-term availability. To achieve accurate estimates of in vitro kinetic parameters, we must optimize the metabolic reaction and determine parameters under conditions where substrate depletion was less than 10% (16). The consumption rate of the parent compound should be ensured to be linear in relation to microsomal protein concentration and incubation time. Initially, the rat liver microsomal protein concentration ranging from 0.1 to 5.0 mg/mL was used, and the linearity was observed in the range between 0.1 and 0.5 mg/mL (r2 = 0.925). Optimization of the incubation time was done at 0.1 mg/mL protein concentration. In the tested time range of 0 to 60 min, linearity was obtained between 0 and 15 min (r2 = 0.963). A 10-min time point was applied in the determination of the kinetic parameters. Figure 4a demonstrates the Michaelis-Menten plot for DMAKO-05 metabolism at different substrate concentrations (17).
Fig. 4.
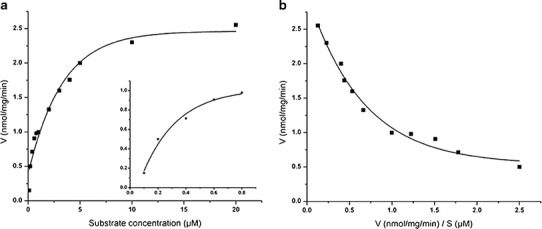
A Michaelis-Menten kinetics plot and its magnified illustration of rat liver microsomes metabolism of DMAKO-05 at low substrate concentrations (a). Eadie-Hofstee analysis of DMAKO-05 (b)
DMAKO-05 in vitro metabolism exhibited biphasic kinetics (18), as evidenced by nonlinear Eadie-Hofstee plots (Fig. 4b), indicating the apparent catalytic participation of at least two enzymes. The results of enzyme kinetic data analyzed by nonlinear least square regression indicated that data fit best using a two-enzyme model based on the equation below (V is reaction velocities; S is substrate concentrations):
Km1 and Vmax1 were 0.1168 ± 0.0975 μM and 0.6532 ± 0.1885 nmol/mg/min, respectively, while Km2 and Vmax2 were 4.0664 ± 0.9335 μM and 2.3166 ± 0.148 nmol/mg/min, respectively. An enzyme with a low Km has a high affinity for its substrate and requires a lower concentration to achieve Vmax. Conversely, high Km indicates low affinity for the substrate. Therefore, from Fig. 4b, we could conclude that DMAKO-05 was catalyzed by two enzymes: a high-affinity-low-capacity enzyme (Km1 0.0193–0.2143 μM, Vmax1 0.4647–0.7205 nmol/mg/min) and a low-affinity-high-capacity enzyme (Km2 3.1329–4.9999 μM, Vmax2 2.1686–2.4646 nmol/mg/min). The intrinsic clearance (Clint) of DMAKO-05 in rat liver microsomes was also calculated as Vmax1 / Km1 using kinetic parameters for the high-affinity enzyme, and the Clint of DMAKO-05 was 5.5925 mL/min/mg protein.
Identification of P450 Isoform(s) Responsible for DMAKO-05 Metabolism
Chemical inhibitors of CYP450 are a very powerful tool for defining the effects of individual P450 isoforms involved in drug metabolism. To confirm which isoform was responsible for the metabolism of DMAKO-05, seven selective inhibitors were selected to estimate their effects on its metabolism. As shown in Fig. 5, alpha-naphthoflavone, a CYP1A-specific inhibitor in human and rat liver microsomes (19), showed the most potent inhibition against DMAKO-05 metabolism. At a concentration of as low as 10 μM, the inhibitory activity was more than 80%. Ketoconazole, a selective inhibitor of human and rat CYP3A (20), also caused a significant inhibition of DMAKO-05 metabolism in a concentration-dependent manner. CYP3A inhibited the metabolism of DMAKO-05 by >60% at 10 μM. In contrast, Sulp, Tra, Quin, and 4-MP did not inhibit the metabolism of DMAKO-05. It is probably worth pointing out that 8-MOP, a CYP2A-specific inhibitor, showed a moderate inhibition of the DMAKO-05 metabolism. These results suggest that the major isozymes responsible for the metabolism of DMAKO-05 are CYP1A and CYP3A, with CYP2A being involved to a smaller extent.
Fig. 5.
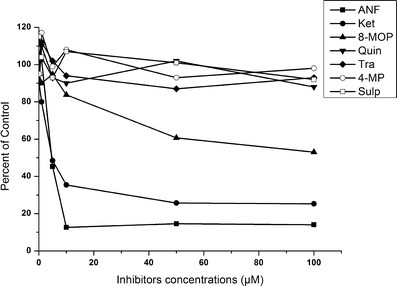
Effects of various inhibitors on CYP450-mediated reactions in rat liver microsomes. (The Y axis means a percentage of the inhibitor-insensitive activity with the addition of different concentrations of inhibitors)
Metabolite Profiles in Rat Liver Microsomes
The HPLC chromatograms of DMAKO-05 before and after exposure to rat liver microsomes were illustrated in Fig. 4. Using a Q-TOF instrument, the structures as well as the retention time of the metabolites (M1–M8) and the parent compound DMAKO-05 were analyzed. Protonated molecules, major fragment ions, and elemental composition are listed in Table II. To identify DMAKO-05 metabolites, the major fragment patterns of the parent compound were investigated first. A protonated DMAKO-05 [M + H]+ was observed at m/z 431.2174, and it yielded a major product ion at m/z 329.1487. The decrease in the size/mass can be accounted for by the cleavage of the C–O bond in the side chain. Although M3, M4, and M5 had the same pseudomolecular ions, different retention times were observed on the HPLC profile of DMAKO-05, with an indication that they are not the same metabolites. More interestingly, the major fragment ions showed an m/z of 345.1448 instead of 329.1487. Since the phase I metabolites of shikonin were formed by the action of mixed function oxidases, resulting in the hydroxylation on the naphthoquinone nucleus (16), the M3, M4, and M5 are probably a product of hydroxylation at different positions of the naphthoquinone nucleus. M1 was inferred as the di-hydroxylated metabolite of DMAKO-05 as seen by the increase of molecular weight by +31.9901. It is easy to assume that two hydroxyl groups may be incorporated on the naphthoquinone nucleus, similar to the metabolites of shikonin (21). If so, some desired fragment ions could appear from the easy cleavage of the side chain C–O. This is supported by the analysis of fragments ions of other metabolites of DMAKO-05. However, it is more intriguing that M1 showed a very similar m/z profile compared to the major fragment ions of M3. Therefore, it is possible that one hydroxyl group was attached on the naphthoquinone nucleus and another to the side chain. Several human CYP enzymes are known to catalyze the hydroxyimine structure of a drug to the corresponding active ketone (22). M6 and M7 were supposed to be a result of oxidation of one hydroxyimine structure to ketone. When the elemental composition of M6 and M7 were analyzed, we found that an N atom was missing in comparison with parent compound, together with the addition of one hydroxyl group. The major fragment ions of M8 have a mass shift of +13.9803 Da compared to parent compound. Thus, M8 is inferred as an allylic carbonylation on the side chain because the hydroxylation and oxidation on the allyl group in the phase I metabolism is the most predominant biotransformation step in vivo (23). The structure of M2, characterized by comparing to the standard synthesized by our lab, was in fact a hydrolyzed product of the esterase of liver microsomes (data not shown).
Table II.
Accurate Mass Data for DMAKO-05 and Its Metabolites
| Compounds | T R (min) | [M + H]+ | MS/MS fragment ions | Predicted molecular formula |
|---|---|---|---|---|
| DMAKO-05 | 49.1 | 431.2174 | 329.1487, 314.1261, 297.1232, 295.1440, 281.1281, 263.1177 | C23H30N2O6 |
| M1 | 12.2 | 463.2075 | 345.1435, 327.1330, 313.1176, 295.1071, 277.0843, 227.0812 | C23H30N2O8 |
| M2 | 17.3 | 347.1607 | 297.1233, 280.1205, 261.0868, 243.0765, 226.0737 | C18H22N2O5 |
| M3 | 28.9 | 447.2123 | 345.1448, 327.1339, 295.1077, 277.0829 | C23H30N2O7 |
| M4 | 30.0 | 447.2123 | 345.1448, 327.1339, 295.1077, 277.0829 | C23H30N2O7 |
| M5 | 30.5 | 447.2123 | 345.1448, 327.1339, 295.1077, 277.0829 | C23H30N2O7 |
| M6 | 33.9 | 432.2021 | 330.1326, 313.1302, 280.0966, 266.0807, 230.0800, 218.0442 | C23H29NO7 |
| M7 | 35.1 | 432.2021 | 330.1326, 313.1302, 280.0966, 266.0807, 230.0800, 218.0442 | C23H29NO7 |
| M8 | 37.8 | 445.1977 | 343.1273, 311.1012, 293.0907, 227.0804 | C23H28N2O7 |
In summary, as described in the above analysis, M1 was inferred as a di-hydroxylated metabolite (+31.9901 Da); M2 as a hydrolyzed product (−84.0567 Da); M3, M4, and M5 are hydroxylated metabolites (+15.9949 Da); M6 and M7 are hydroxylated derivatives in which an additional oxime functional group has been converted to ketone (+0.9847 Da); and M8 is a ketone metabolite (+13.9803 Da). The metabolite profiles of DMAKO-05 and their probable fragmentation patterns were summarized in Fig. 6. As seen in the figure, the major metabolic pathway of DMAKO-05 appeared similar to that of shikonin. This showed that hydroxylation played a primary role in the metabolism. Since oxidative deoximation was not the major metabolic route, DMAKO-05 may not observe the typical prodrug activation mechanism of the naphthoquinone nucleus. Ongoing research in our lab is using new structural analogs to further explore the antitumor activity displayed by these compounds.
Fig. 6.
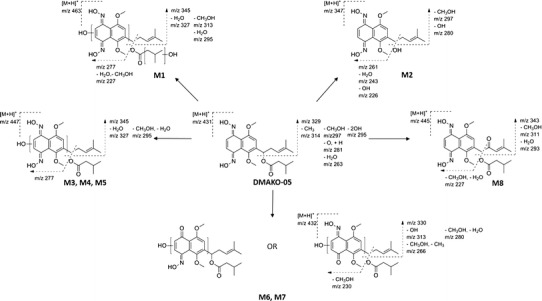
Metabolic products and the probable fragmentation patterns of DMAKO-05
CONCLUSION
In summary, we have reported the metabolism of DMAKO-05 by rat liver microsomes. The HPLC method we developed is reliable and applicable to analyze the in vitro metabolism of DMAKO-05. The kinetic parameters indicated a biphasic metabolism that involved at least two enzymes. CYP450 inhibition experiments suggested that CYP1A and CYP3A were the major enzymes responsible for metabolism of DMAKO-05 in rat liver microsomes. More importantly, all the eight metabolites of DMAKO-05 from rat liver microsomes were characterized using an LC-MS/MS system, which strongly suggests that the major metabolic pathway of DMAKO-05 involved oxygenation and hydroxylation. These results can be applied to analyze the metabolic mechanism of new 1,4-dioxime-5,8-dimethoxynaphthalene derivatives and provide evidence and experimental support for in vivo metabolism of DMAKO-05.
ACKNOWLEDGMENTS
This work was supported by the Shanghai Committee of Science and Technology, China (Grant No. 12431900602), and the State Key Laboratory Cultivation Base for the Chemistry and Molecular Engineering of Medicinal Resources, Ministry of Science and Technology of China (CHEMR2012-B08). We also thank Vijaykanth Pagadala and Tim O’Leary for their critical reading of the manuscript.
Footnotes
Xu Zhang and Ru-Bing Wang contributed equally to this work.
Contributor Information
Wen Zhou, Phone: +86 21 34204775, Email: wzhou60@sjtu.edu.cn.
Shao-Shun Li, Phone: +86 21 34204775, Email: ssli@sjtu.edu.cn.
REFERENCES
- 1.Hübotter F. Beiträge zur Kenntnis der chinesischen sowie der tibetisch-mongolischen Pharmakologie. Urban & Schwarzenberg; 1913.
- 2.Kim H, Ahn BZ. Antitumor effects of acetylshikonine and some synthesized naphthazarins on L1210 and S-180 systems. Yakhak Hoeji. 1990;34(4):262–266. [Google Scholar]
- 3.Miller MG, Rodgers A, Cohen GM. Mechanisms of toxicity of naphthoquinones to isolated hepatocytes. Biochem Pharmacol. 1986;35(7):1177–1184. doi: 10.1016/0006-2952(86)90157-7. [DOI] [PubMed] [Google Scholar]
- 4.Moore HW. Bioactivation as a model for drug design bioreductive alkylation. Science. 1977;197(4303):527–532. doi: 10.1126/science.877572. [DOI] [PubMed] [Google Scholar]
- 5.Zhou W, Zhang X, Xiao L, Ding J, Liu QH, Li SS. Semi-synthesis and antitumor activity of 6-isomers of 7, 8-O-dimethyl acylshikonin derivatives. Eur J Med Chem. 2011;46(8):3420–3427. doi: 10.1016/j.ejmech.2011.05.006. [DOI] [PubMed] [Google Scholar]
- 6.Papageorgiou VP, Assimopoulou AN, Couladouros EA, Hepworth D, Nicolaou KC. The chemistry and biology of alkannin, shikonin, and related naphthazarin natural products. Angew Chem Int Ed. 1999;38(3):270–301. doi: 10.1002/(SICI)1521-3773(19990201)38:3<270::AID-ANIE270>3.0.CO;2-0. [DOI] [PubMed] [Google Scholar]
- 7.Wang RB, Zhou SS, Jiang HDGL, Zheng XG, Zhou W, Li SS. An efficient multigram synthesis of alkannin and shikonin. Eur J Org Chem. 2012;2012(7):1373–1379. doi: 10.1002/ejoc.201101505. [DOI] [Google Scholar]
- 8.Feng LS, Lv K, Liu ML, Wang S, Zhao J, You XF, et al. Synthesis and in vitro antibacterial activity of gemifloxacin derivatives containing a substituted benzyloxime moiety. Eur J Med Chem. 2012;55:125–136. doi: 10.1016/j.ejmech.2012.07.010. [DOI] [PubMed] [Google Scholar]
- 9.Zhou W, Peng Y, Li SS. Semi-synthesis and anti-tumor activity of 5,8-O-dimethyl acylshikonin derivatives. Eur J Med Chem. 2010;45(12):6005–6011. doi: 10.1016/j.ejmech.2010.09.068. [DOI] [PubMed] [Google Scholar]
- 10.Sistla R, Tata VSSK, Kashyap YV, Chandrasekar D, Diwan PV. Development and validation of a reversed-phase HPLC method for the determination of ezetimibe in pharmaceutical dosage forms. J Pharm Biomed Anal. 2005;15(3–4):517–522. doi: 10.1016/j.jpba.2005.04.026. [DOI] [PubMed] [Google Scholar]
- 11.Messiano GB, Santos RAS, Ferreira LDS, Simões RA, Jabor VAP, Kato MJ, et al. In vitro metabolism study of the promising anticancer agent the lignan (−)-grandisin. J Pharm Biomed Anal. 2013;72:240–244. doi: 10.1016/j.jpba.2012.08.028. [DOI] [PubMed] [Google Scholar]
- 12.Newton DJ, Wang RW, Lu AYH. Cytochrome P450 inhibitors. Evaluation of specificities in the in vitro metabolism of therapeutic agents by human liver microsomes. Drug Metab Dispos. 1994;23(1):154–158. [PubMed] [Google Scholar]
- 13.Guidance for Industry: bioanalytical method validation. Center for Drug Evaluation and Research. United States Food and Drug Administration; 2001.
- 14.Causon R. Validation of chromatographic methods in biomedical analysis viewpoint and discussion. J Chromatogr B Biomed Appl. 1997;689(1):175–180. doi: 10.1016/S0378-4347(96)00297-6. [DOI] [PubMed] [Google Scholar]
- 15.Ekins S, Ring BJ, Grace J, McRobie-Belle DJ, Wrighton SA. Present and future in vitro approaches for drug metabolism. J Pharmacol Toxicol Methods. 2000;44(1):313–324. doi: 10.1016/S1056-8719(00)00110-6. [DOI] [PubMed] [Google Scholar]
- 16.Fasinu P, Bouic PJ, Rosenkranz B. Liver-based in vitro technologies for drug biotransformation studies–a review. Curr Drug Metab. 2012;13(2):215–224. doi: 10.2174/138920012798918426. [DOI] [PubMed] [Google Scholar]
- 17.Zhang DL, Zhu MS, Humphreys WG. Drug metabolism in drug design and development: basic concepts and practice. 2007;426. doi: 10.1002/9780470191699.
- 18.Kharasch ED, Labroo R. Metabolism of ketamine stereoisomers by human liver microsomes. Anesthesiology. 1992;77(6):1201–1207. doi: 10.1097/00000542-199212000-00022. [DOI] [PubMed] [Google Scholar]
- 19.Shi Q, Greenhaw J, Salminen WF. Inhibition of cytochrome P450s enhances (+)-usnic acid cytotoxicity in primary cultured rat hepatocytes. J Appl Toxicol. 2013 doi: 10.1002/jat.2892. [DOI] [PubMed] [Google Scholar]
- 20.Chiba M, Hensleigh M, Lin JH. Liver and intestinal metabolism of indinavir, an HIV protease inhibitor, in rat and human microsomes. Major role of CYP3A. Biochem Pharmacol. 1997;53(8):1187–1195. doi: 10.1016/S0006-2952(97)00100-7. [DOI] [PubMed] [Google Scholar]
- 21.Li H, Luo S, Zhou T. Studies on in vitro metabolism of shikonin. Phytother Res. 1999;13(3):236–238. doi: 10.1002/(SICI)1099-1573(199905)13:3<236::AID-PTR417>3.0.CO;2-F. [DOI] [PubMed] [Google Scholar]
- 22.Kumpulainen H, Mähönen N, Laitinen ML, Jaurakkajärvi M, Raunio H, Juvonen RO, et al. Evaluation of hydroxyimine as cytochrome P450-selective prodrug structure. J Med Chem. 2006;49(3):1207–1211. doi: 10.1021/jm0510124. [DOI] [PubMed] [Google Scholar]
- 23.Roberts AB, Lamb LC, Sporn MB. Metabolism of all-trans-retinoic acid in hamster liver microsomes: oxidation of 4-hydroxy- to 4-keto-retinoic acid. Arch Biochem Biophys. 1980;199(2):374–383. doi: 10.1016/0003-9861(80)90293-3. [DOI] [PubMed] [Google Scholar]