Abstract
To incorporate quality by design concepts into the management of leachables, an emphasis is often put on understanding the extractable profile for the materials of construction for manufacturing disposables, container-closure, or delivery systems. Component manufacturing processes may also impact the extractable profile. An approach was developed to (1) identify critical components that may be sources of leachables, (2) enable an understanding of manufacturing process factors that affect extractable profiles, (3) determine if quantitative models can be developed that predict the effect of those key factors, and (4) evaluate the practical impact of the key factors on the product. A risk evaluation for an inhalation product identified injection molding as a key process. Designed experiments were performed to evaluate the impact of molding process parameters on the extractable profile from an ABS inhaler component. Statistical analysis of the resulting GC chromatographic profiles identified processing factors that were correlated with peak levels in the extractable profiles. The combination of statistically significant molding process parameters was different for different types of extractable compounds. ANOVA models were used to obtain optimal process settings and predict extractable levels for a selected number of compounds. The proposed paradigm may be applied to evaluate the impact of material composition and processing parameters on extractable profiles and utilized to manage product leachables early in the development process and throughout the product lifecycle.
KEY WORDS: design of experiments, extractables, injection molding, leachables, process parameters, quality by design
INTRODUCTION
The ICH Q8 and Q9 guidances (1,2) have initiated an alternate way of thinking about drug product development. A scientifically sound risk-based approach coupled with the linkage of multiple process inputs to critical quality attributes (CQA) are key focal points. Leachables are often thought of as a critical quality attribute for products that are comprised of liquid formulations and/or that are delivered by inhalation or injection. The linkage of material attributes or process parameters to this CQA typically would occur late in the development process, as compounds (e.g., polymer additives or degradants) that have migrated into the formulation during processing or storage (referred to as leachables) are evaluated during stability studies. By taking a risk-based approach and evaluating those compounds that could leach into the formulation (referred to as extractables), the probable sources of leachables can be identified early in development. The linkage of material attributes and process parameters to the appearance of extractables produced under laboratory conditions can be ascertained by a set of carefully designed experiments. The correlation of extractables to leachables can then be used to predict and ultimately understand the linkage of those material attributes and process parameters to the leachables that are actually observed.
Typically, the correlation of extractables in the manufacturing stream or delivery system to leachables in the drug product has been treated as a material composition issue (3–5). The effect of processing parameters that may produce a change in composition or extractability of the material is the focus of this article. Although it has been demonstrated in the past that process parameters (e.g., molding conditions) may or may not affect the extractable profile of a material (6,7), a generalized systematic approach for such an evaluation has not been described. The International Pharmaceutical Aerosol Consortium on Regulation and Science (IPAC-RS) Leachables and Extractables Development Paradigm Working Group has investigated if quantitative models can be developed that predict the effect of key manufacturing process parameters on extractables and therefore leachables. In this paper, we illustrate a risk-based assessment of various unit operations, development of the designed experiments for key process parameters, and statistical treatment of the extractable results to develop predictive models. Although these examples are not exhaustive, they serve to establish a paradigm that can be adapted and applied to various pharmaceutical products. It was anticipated that this would facilitate the incorporation of extractable evaluation as an element of the material characterization activities that are typically performed as part of component fabrication process development and verification.
The working group first selected a pressurized meter dose inhaler (pMDI)-based product as a model system on which to perform a risk assessment to identify key process parameters. A diagram of the typical components in a pMDI is shown in Fig. 1. The formulation is contained in a canister and upon actuation is delivered by a metering valve to the patient through the actuator that also functions as the mouthpiece. Following the decision tree shown in Fig. 2, it was determined that the most critical unit operations for the metering valve were the injection molding of plastic components and vulcanization of the elastomers that make up the valve assembly.
Fig. 1.
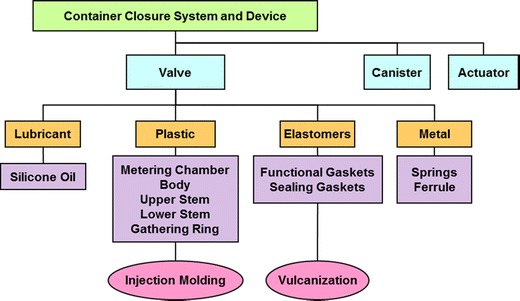
Critical components and unit processes for a pMDI
Fig. 2.
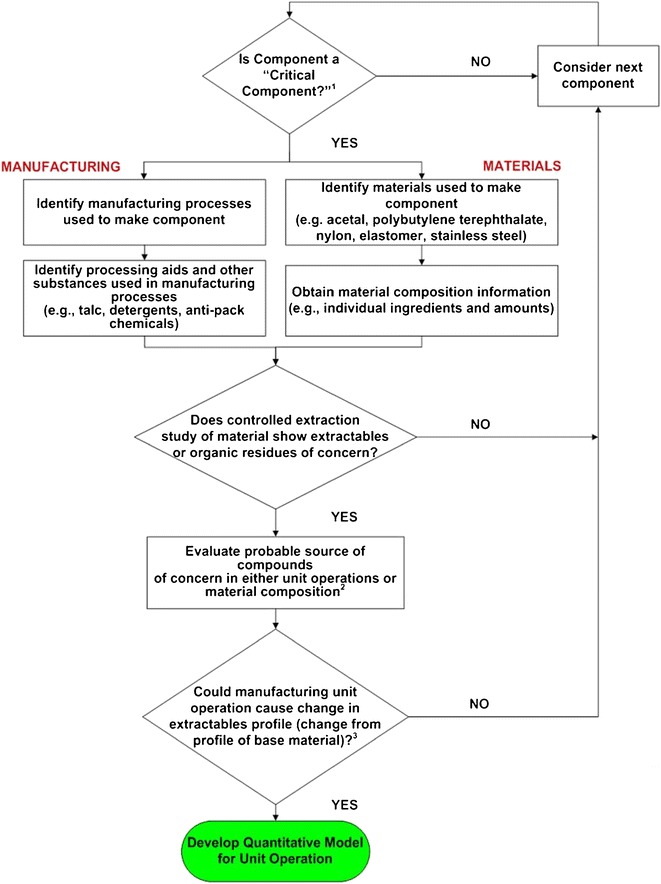
Decision tree for assessment of component criticality and key unit operations. (1) “Critical Components” are those components of the container/closure system or device that contact the patient, the formulation, that affect the mechanics of the overall performance of the device, or any necessary secondary protective packaging [3]. (2) This evaluation is a risk assessment investigating the possible sources of compounds. (3) This decision could in some cases be based on results of controlled extraction studies on manufactured component
A decision was taken to focus on the injection molding process (Figs. 3 and 4) to study the linkage between process parameters and extractable profiles. The process parameters were ranked on a scale of 1 to 5 for their ability to impact the extractable profile (see Table I). This activity was completed by a group of engineers and chemists familiar with both the molding process and extractable analysis and resulted in five process parameters with a ranking of 4 or higher. The three parameters that were ranked as a 3 can be mitigated to 1 by the actions listed in Table I. The details of the work described in this paper include the following: development of a design of experiments (DoE) varying the key process parameters, extractable testing on a component molded from acrylonitrile butadiene styrene (ABS), and statistical assessment of the extractable results. The development of a statistical model for process parameter impact on extractable profile is discussed with regard to the practical significance of the results.
Fig. 3.
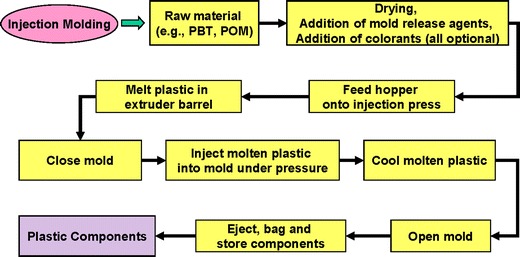
Example of injection molding process steps for production of plastic parts
Fig. 4.
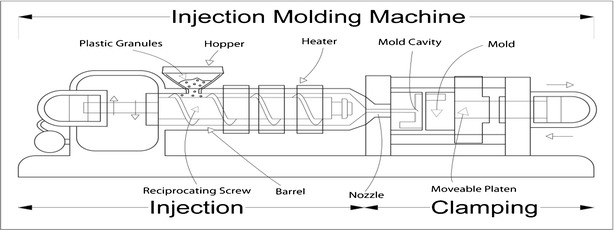
Illustration of an injection molding machine (taken from http://www.professional-plastic-mold-manufacturer.com/knowledge-advice-plastic-injection-molding/an-introduction-on-plastic-injection-molding/)
Table I.
Key Parameters in the Injection Molding Process
| Process parameter | Importance | Mitigated values | Comment |
|---|---|---|---|
| Residence time | 5 | 5 | Longer time, more degradation |
| Injection speed | 4–5 | 4–5 | Material stress due to shear |
| Back pressure | 4 | 4 | Shear stress, potential degradation |
| Screw speed | 4 | 4 | Higher speed, more degradation |
| Barrel temperature | 4 | 4 | Higher temperature, more degradation |
| Injection pressure | 2 | 2 | Inversely linked to barrel temperature |
| Holding pressure | 2 | 2 | Affects density of part |
| Location and size of injection gates | 3 | 1 | Affects shear—can minimize impact by proper tool design |
| Cooling time | 1 | 1 | Affects crystallinity |
| Colorant blending | 3 | 1 | Minimize effect—use same base polymer |
| Mold temperature | 1 | 1 | Lower temperature than barrel, less concern |
| Melt flow index | 1 | 1 | Affects machine set up |
| Injection press type (hydraulic/electric) | 1 | 1 | Could affect precision |
| Mold design and cavitation | 1 | 1 | Not changeable |
| Mold venting | 3 | 1 | Scorching—fixable by tool modification |
METHODS
Molding Design of Experiment
The molding DoE was a randomized, two-level, and fractional factorial design with 16 different experimental conditions that spanned the qualified ranges of parameter settings. One additional experimental condition that represented the “nominal” molding practice was added in triplicate at the beginning, middle, and end of the molding experiments for reference and to confirm the expected extractable profile; however, these replicate “nominal” reference conditions were not used in the final statistical analysis of the data.
Table II displays all of the 16 DoE plus the three replicate nominal reference (ref) experimental molding conditions. The top five molding process parameters in Table I (residence time, injection speed, back pressure, screw speed, and barrel temperature) were varied in order to evaluate their impact on the extractable compounds. The ABS component was molded one time at each of the 16 different combinations and three times at the nominal reference condition.
Table II.
DOE for Key Molding Process Parameters
| Condition | Residence time | Injection speed | Back pressure | Screw speed | Barrel temperature |
|---|---|---|---|---|---|
| 1 | Ref | Ref | Ref | Ref | Ref |
| 2 | +(147) | −(83) | −(75) | −(67) | −(93) |
| 3 | −(94) | +(117) | − | − | − |
| 4 | − | − | +(125) | − | − |
| 5 | + | + | + | − | − |
| 6 | − | − | − | +(167) | − |
| 7 | + | + | − | + | − |
| 8 | + | − | + | + | − |
| 9 | − | + | + | + | − |
| 10 | Ref | Ref | Ref | Ref | Ref |
| 11 | − | − | − | − | +(107) |
| 12 | + | + | − | − | + |
| 13 | + | − | + | − | + |
| 14 | − | + | + | − | + |
| 15 | + | − | − | + | + |
| 16 | − | + | − | + | + |
| 17 | − | − | + | + | + |
| 18 | + | + | + | + | + |
| 19 | Ref | Ref | Ref | Ref | Ref |
Ref: nominal conditions included for reference, taken as 100%; +: high level of molding process parameter (values relative to nominal in parentheses); −: low level of molding process parameter (values relative to nominal in parentheses)
Extractable Testing
The ABS components were extracted in isopropanol (IPA) at 90°C for 30 min. Three true replicate samples were prepared for each of the 16 experimental and the three replicate nominal reference conditions from the molding DoE. Each extract was analyzed by gas chromatography (GC) utilizing a USP phase G2 column with flame ionization detection (GC-FID) resulting in a total of 57 unique extraction data sets (chromatograms). The triplicate sample preparation and analyses for each molding condition was performed with the instrumentation listed in Table III and are labeled runs 1, 2, and 3. The peak area for each of the chromatographic peaks (see Fig. 5) detected in each sample was tabulated. The peak areas were normalized using the peak area of an internal standard to compensate for injection to injection differences. Since there were slight differences in retention time for each chromatogram, the peaks were aligned according to relative retention time.
Table III.
Instrument Details for Three Replicate Runs
| Analytical run 1 | Analytical runs 2 and 3 | |
|---|---|---|
| Extraction apparatus | ASE 200 | ASE 200 |
| Instrument | GC-FID 7890 | GC-FID-MSD 6890 |
| Column | Brand A | Brand B |
| Chromatography data system | Brand A | Brand B |
Fig. 5.
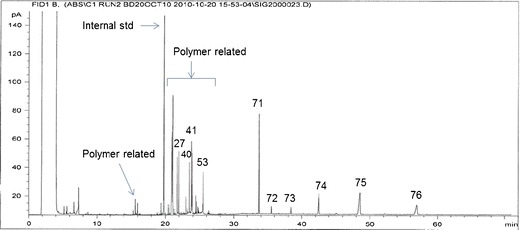
Extractable profile (GC-FID chromatogram) from run 2, condition 12
Across all 57 chromatograms, there were a total of 76 peaks at unique retention times. Of these, there were 44 peaks below the limit of quantification (LOQ) threshold that were not utilized for further analysis. Out of the 32 quantitative peaks in the extractable profiles, a total of 26 peaks were selected for statistical analysis according to two criteria applied to the peaks in the three nominal molding condition sample reference chromatograms from analytical runs 2 and 3 (see Principal components analysis (PCA) results section for rationale; six true replicates):
The peak area had to be above the limit of quantification in all 3 “nominal” molding condition reference samples, and
The coefficient of variation (%CV) of the selected peak had to be less than 20% across replicate analytical runs
These criteria ensured that any variability in the extractable peaks would not be due to the analytical method and could be quantitatively linked to effects of the molding process. Table IV shows the peaks selected according to these criteria, their relative retention time (RRT), and their chemical compound category.
Table IV.
Chemical Compound Category and Relative Retention Time (RRT) of 26 Peaks Selected for Analysis of Variance
| Peak number | RRT | Category | Peak number | RRT | Category |
|---|---|---|---|---|---|
| 9 | 0.7875 | Polymer related | 42 | 1.2082 | Polymer related |
| 11 | 0.8029 | Polymer related | 43 | 1.2109 | Polymer related |
| 15 | 0.9807 | Polymer related | 46 | 1.2381 | Polymer related |
| 18 | 1.0280 | Polymer related | 47 | 1.2435 | Polymer related |
| 22 | 1.0607 | Polymer related | 48 | 1.2529 | Polymer related |
| 23 | 1.0630 | Polymer related | 52 | 1.2872 | Unknown |
| 24 | 1.0684 | Polymer related | 53 | 1.2908 | Stabilizer |
| 27 | 1.0986 | Mold release ingredient | 71 | 1.7024 | Antioxidant additive |
| 29 | 1.1029 | Polymer related | 72 | 1.8028 | Unknown |
| 31 | 1.1139 | Polymer Related | 73 | 1.9336 | Unknown |
| 36 | 1.1644 | Polymer related | 74 | 2.1280 | Slip agent ingredient |
| 40 | 1.1886 | Mold release ingredient | 75 | 2.3737 | Slip agent ingredient |
| 41 | 1.2045 | Mold release ingredient | 76 | 2.8298 | Slip agent ingredient |
Statistical Methods
Statistical analysis of the tabulated gas chromatography data was performed to identify process parameters potentially impacting the level of extractables as measured by peak area. The SAS for PC v. 9.1, SIMCA P+ v. 11, MODDE v. 9.0, and the Design Expert v. 8 statistical software programs were used for the analysis of the data from this DoE.
Principal components analysis (PCA) was used as a screening tool to compare the chromatographic results from each molding experimental condition and to identify potential clustering of results between the analytical measurements from runs 1–3; through PCA, it was determined that runs 2 and 3 were the most representative of the DoE results (see the “Results” section).
Analysis of variance (ANOVA), with run number (2 and 3) used as a blocking factor, was performed to further assess the association between extractable levels and the five process parameters (factors) in the DoE. The ANOVA statistical analysis included assessment of the relative importance of each of the main five factors and any potential two-way interaction between these; all three-way interactions were considered negligible and not included in the multiple linear regression (MLR) modeling. Model selection was based on the F statistic; all factor model terms with F values less than 1 were initially excluded from consideration. However, the final model for a specific extractable profile peak included only those main factors that were either independently significant at α0.10 or were part of a significant two-way interaction (p < 0.10). The alpha of 0.10 was chosen to increase the likelihood of detecting a potential signal in the extractable profiles in this study.
Traditional model assumptions, such as distributional properties of the extractable levels, normality of final model residuals, outlier detection, and influence, were assessed and data/model adjustments performed wherever necessary. Part of the model fit assessment was a calculation of the adequate precision, which is automatically produced by the Design Expert software. Essentially, this fit statistic measures the signal/noise ratio, with results preferably greater than 4 to ensure accurate response prediction (results are included in Table VI). It is calculated as
- p
Number of model parameters (including intercept (b0) and any block coefficients)
- σ2
Residual MS from ANOVA table
- n
Number of experiments
Table VI.
Summary of ANOVA Modeling for Selected Extractable Peaks: Individual Model Fit Statistics
| GC peak | CV% | R 2 | Adequate precision1 | Model p value |
|---|---|---|---|---|
| 9 | 6.89 | 0.32 | 5.43 | 0.0133 |
| 11 | 6.20 | 0.30 | 5.11 | 0.0208 |
| 15 | 6.94 | 0.34 | 7.77 | 0.0089 |
| 18 | 7.83 | 0.25 | 5.77 | 0.0966 |
| 22 | 8.19 | 0.32 | 6.06 | 0.0696 |
| 23 | 6.26 | 0.28 | 6.15 | 0.0664 |
| 24 | 7.22 | 0.29 | 6.11 | 0.0561 |
| 27b | 9.09 | 0.29 | 8.44 | 0.0275 |
| 29 | 7.12 | 0.28 | 6.57 | 0.0634 |
| 31 | 7.09 | 0.28 | 5.92 | 0.0602 |
| 36 | 7.26 | 0.32 | 5.68 | 0.0146 |
| 40b | 11.48 | 0.44 | 9.09 | 0.0086 |
| 41 | 7.24 | 0.29 | 5.51 | 0.0234 |
| 42 | 7.07 | 0.32 | 5.57 | 0.0155 |
| 43 | 7.29 | 0.30 | 5.58 | 0.0212 |
| 46 | 7.75 | 0.27 | 5.00 | 0.0358 |
| 47 | 8.42 | 0.30 | 5.62 | 0.0215 |
| 48 | 7.04 | 0.44 | 7.00 | 0.0012 |
| 52 | 7.78 | 0.44 | 8.10 | 0.0089 |
| 53 | 11.98 | 0.53 | 10.19 | 0.0004 |
| 71a | 5.88 | 0.50 | 6.53 | 0.0047 |
| 72 | 9.99 | 0.73 | 10.86 | <0.0001 |
| 73 | 10.37 | 0.52 | 9.46 | 0.0097 |
| 74 | 12.53 | 0.54 | 9.37 | 0.0065 |
| 75 | 14.88 | 0.41 | 7.94 | 0.0628 |
| 76 | 27.99 | 0.27 | 5.68 | 0.0338 |
aTwo outliers detected and excluded
bBox-Cox transformation performed
1: signal to noise ratio; >4 is desirable
After completing ANOVA modeling for the 26 selected GC peaks, only those with adequate fit were considered for further assessment of practical importance of the extractable levels. Adequate fit for this purpose was defined as any model with a coefficient of determination of at least 50% (R2 > 0.50).
Finally, as part of a theoretical exercise, statistical optimization was performed to predict optimal levels of the five process factors which would minimize the levels of these selected GC peaks. Optimization solutions were ranked in desirability based on a method developed by Derringer and Suich, described by Myers et al. (8); this method is used by the Design Expert software.
RESULTS
Principal Components Analysis (PCA)
Multivariate Principal components analysis (PCA) was used as a screening tool to compare the GC results related to each molding condition (16 conditions), and assess qualitative differences between analytical runs 1–3, and any general observations or trends. The assessment highlighted a clear difference between samples from analytical run 1 and runs 2 and 3 (Fig. 6a). This unexpected disparity is attributed to analytical variation given that run 1 was performed using a different instrument and configuration to runs 2 and 3 (Table III). Furthermore, statistical analysis of all three runs combined was less conclusive than that of runs 2 and 3 because differences due to molding conditions were masked by analytical variation. Based on these findings, the results from analytical run 1 were excluded from further analysis. The results from analytical run 1 were excluded from further analyses based on these findings.
Fig. 6.
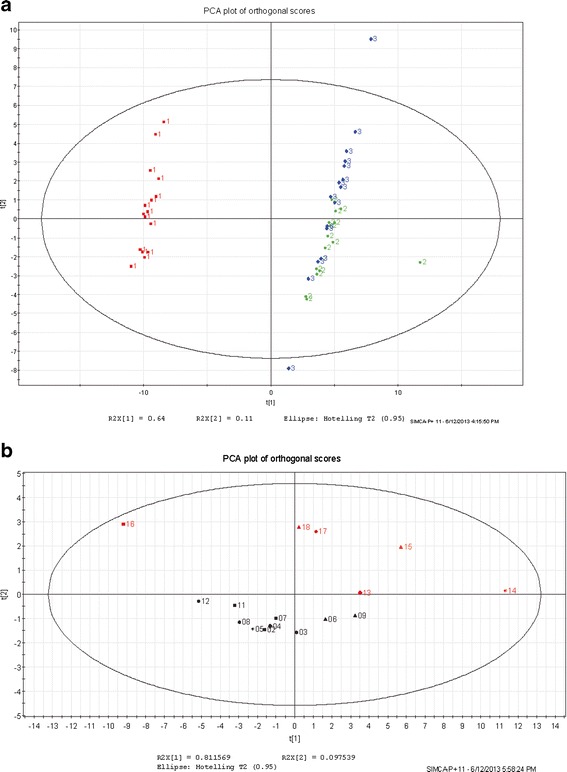
a PCA of analytical runs 1 (red), 2, and 3 (green and blue, respectively). b PCA results, analytical run 3
Additional PCA of analytical runs 2 and 3 suggests potential trends in the extractable profile peaks and the molding process factors. A PCA plot for each analytical run was constructed using a single point (sample) to represent all of the profile peaks from a component molded at one of the DoE molding conditions. Similar patterns in terms of the relative positions of the samples on the plot were observed in each of the replicate analytical runs. In particular, there was a group of samples separated on the second principal component that represent the components that were processed with high barrel temperature and high back pressure or high screw speed. As shown in the plot for analytical run 3 (see Fig. 6b), there is a general separation of measurements with high levels of barrel temperature combined with high back pressure and/or screw speed (red, above the line) compared to those combinations with low barrel temperature (black, below the line). Similar results were obtained using data from analytical run 2 (data not shown).
ANOVA Results
ANOVA modeling was performed on 26 selected extractable profile peaks to further investigate, qualitatively, statistically significant effects of molding conditions on extractable peak levels. Data from runs 2 and 3 were combined and the replicate run number served as a blocking factor in these models. The ANOVA statistical modeling incorporated the main five process factors and all of the ten two-way interactions; however, only potentially significant terms (p < 0.10) were retained in each of the final models.
Table V displays the ANOVA results for the 26 selected extractable profile peaks and includes p values for all terms included in the model; only those terms with a p value <0.10 presented in this table were included in the final model. Correspondingly, Table VI displays the fit statistics for each of the models included in Table V.
Table V.
Summary of ANOVA Modeling for Selected Extractable Profile Peaks: p Values for Terms Included in Individual Models
| GC peak | RT | IS | BP | SS | BT | BP × BT | IS × BT | SS × BT | RT × BT | BP × SS |
|---|---|---|---|---|---|---|---|---|---|---|
| 9 | − | − | 0.12 | − | 0.09 | 0.01 | − | − | − | − |
| 11 | − | − | 0.09 | − | 0.18 | 0.02 | − | − | − | − |
| 15 | − | − | 0.13 | − | 0.04 | 0.01 | − | − | − | − |
| 18 | − | − | 0.25 | − | 0.69 | 0.04 | − | − | − | − |
| 22 | − | 0.46 | 0.15 | − | 0.50 | 0.09 | 0.03 | − | − | − |
| 23 | − | − | 0.20 | 0.09 | 0.61 | 0.04 | − | − | − | − |
| 24 | − | − | 0.16 | 0.08 | 0.85 | 0.03 | − | − | − | − |
| 27 | − | − | 0.09 | − | 0.09 | 0.04 | − | − | − | − |
| 29 | − | − | 0.19 | 0.09 | 0.86 | 0.03 | − | − | − | − |
| 31 | − | − | 0.16 | 0.09 | 0.97 | 0.03 | − | − | − | − |
| 36 | − | − | 0.15 | − | 0.06 | 0.02 | − | − | − | − |
| 40 | − | − | 0.03 | 0.23 | 0.07 | 0.06 | − | 0.03 | − | − |
| 41 | − | − | 0.12 | − | 0.13 | 0.02 | − | − | − | − |
| 42 | − | − | 0.09 | − | 0.09 | 0.02 | − | − | − | − |
| 43 | − | − | 0.14 | − | 0.08 | 0.02 | − | − | − | − |
| 46 | − | − | 0.13 | − | 0.10 | 0.04 | − | − | − | − |
| 47 | − | − | 0.25 | − | 0.03 | 0.04 | − | − | − | − |
| 48 | − | − | 0.17 | − | 0.002 | 0.01 | − | − | − | − |
| 52 | − | − | 0.09 | 0.08 | 0.30 | 0.04 | − | 0.01 | − | − |
| 53 | − | − | 0.002 | 0.29 | 0.31 | − | − | 0.001 | − | − |
| 71 | 0.72 | 0.15 | − | − | 0.16 | − | 0.0004 | − | 0.06 | − |
| 72 | − | 0.82 | 0.13 | 0.02 | <0.0001 | 0.03 | 0.09 | 0.01 | − | − |
| 73 | − | 0.85 | 0.24 | 0.94 | 0.01 | 0.03 | 0.03 | − | − | 0.04 |
| 74 | − | 0.98 | 0.32 | 0.79 | 0.003 | 0.03 | 0.05 | − | − | 0.03 |
| 75 | − | 0.86 | 0.37 | 0.34 | 0.28 | 0.05 | 0.05 | − | − | 0.05 |
| 76 | − | − | − | 0.07 | 0.15 | − | − | 0.05 | − | − |
RT residence time, IS injection speed, BP back pressure, SS screw speed, BT barrel temperature, BP × BT interaction between back pressure and barrel temperature
− = term not in the model
Two major signals emerged from the ANOVA analysis. Most models indicated an involvement of the barrel temperature (BT) and back pressure (BP), and the interaction between these two process factors as potential signals of statistical association with extractables observed (Table V). In addition, the levels of some of the GC peaks were associated with the screw and injection speed as well (Table V). From the ANOVA results, it is also evident that residence time (RT) had no impact on nearly all of the extractable levels in this study.
After reviewing the fit statistics for each of these models (Table VI), it was determined that only models with coefficient of determination of at least 50% (R2 ≥ 0.50) would be considered as ANOVA models representing an adequate signal for potential association between the process factors and resulting level of the extractable peak. These criteria were met by models dealing with GC peaks 53 and 71–74.
Models whose R2 was <0.50 were considered as a negative signal in terms of the molding process impact on the model-associated compound (GC peak); i.e., varying the five process parameters within this DoE did not clearly influence the level of the GC peak in the extractable profile. Graphical presentations of the final ANOVA models for peaks 53, 71–74 can be seen in Fig. 7a–e.
Fig. 7.
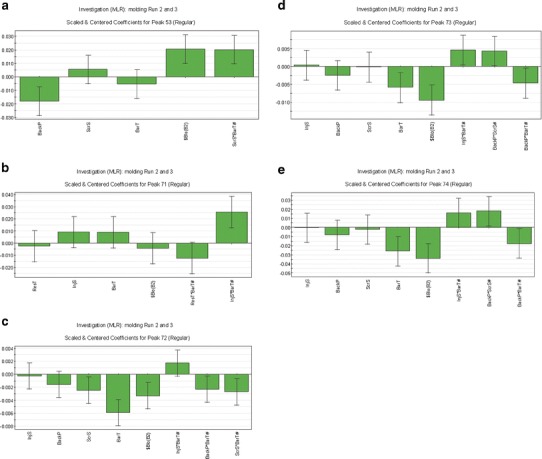
a Coefficient plots for GC peak 53—five terms: back pressure (BackP), screw speed (ScrS), barrel temperature (BarT), run number as blocking factor ($Blo(B2)), interaction between screw speed and barrel temperature (ScrS*BarT#). b Coefficient plots for GC peak 71—six terms: residence time (ResT), injection speed (InjS), barrel temperature (BarT), run number as blocking factor ($Blo(B2)), interaction between residence time and barrel temperature (ResT*BarT#), interaction between injection speed and barrel temperature (InjS*BarT#). c Coefficient plots for GC peak 72—eight terms: injection speed (InjS), back pressure (BackP), screw speed (ScrS), barrel temperature (BarT), run number as blocking factor ($Blo(B2)), interaction between injection speed and barrel temperature (InjS*BarT#), interaction between back pressure and barrel temperature (BackP*BarT#), interaction between screw speed and barrel temperature (ScrS*BarT#). d Coefficient plots for GC peak 73—eight terms: injection speed (InjS), back pressure (BackP), screw speed (ScrS), barrel temperature (BarT), run number as blocking factor ($Blo(B2)), interaction between injection speed and barrel temperature (InjS*BarT#), interaction between back pressure and screw speed (BackP*ScrS#), interaction between back pressure and barrel temperature (BackP*BarT#). e Coefficient plots for GC peak 74—eight terms: injection speed (InjS), back pressure (BackP), screw speed (ScrS), barrel temperature (BarT), run number as blocking factor ($Blo(B2)), interaction between injection speed and barrel temperature (InjS*BarT#), interaction between back pressure and screw speed (BackP*ScrS#), interaction between back pressure and barrel temperature (BackP*BarT#)
Models for GC peaks 72–74 appear to have common factors of barrel temperature (BT), back pressure (BP), screw speed (SS), and injection speed (IS) either as independent factors or mostly being part of various interactions (Tables V and VII, Fig. 7a–e). The models for GC peaks 53 and 71 each have fewer combinations of some of these common factors observed for GC peaks 72–74.
Table VII.
Summary for Selected GC Peaks: Direction of the Association Between the Response and Independent Significant Model Terms
| GC peak | RT | IS | BP | SS | BT | BP × BT | IS × BT | SS × BT | RT × BT | BP × SS |
|---|---|---|---|---|---|---|---|---|---|---|
| 53 | 1/α | HiBT:α LoBT:1/α |
||||||||
| 71 | HiBT:α LoBT:1/α |
HiBT:1/α LoBT:0/α |
||||||||
| 72 | 1/α | 1/α | HiBT:1/α LoBT:0 |
HiBT:α LoBT:1/α |
HiBT:1/α LoBT:0 |
|||||
| 73 | 1/α | HiBT:1/α LoBT:0/α |
HiBT:α LoBT:1/α |
HiSS:0/α LoSS:1/α |
||||||
| 74 | 1/α | HiBT:1/α LoBT:0/α |
HiBT:α LoBT:1/α |
HiSS:0/α LoSS:1/α |
1/α = inverse (negative linear association)
α = positive association (linear)
0 = no association (slope ~0)
0/α = small positive association (slope is small)
HiBT:1/α (in BP × BT interaction term) = indicates a significant inverse relationship between BP and the GC peak at the high BT level
Table VII displays, in addition to the significant model factors, the trend relationships between the factors and the selected extractable GC peaks 53 and 71–74. For illustrative purposes, GC peak 73 is used to graphically represent the general interpretation of the modeling results as they are displayed in Table VII (Fig. 8a–d).
Fig. 8.
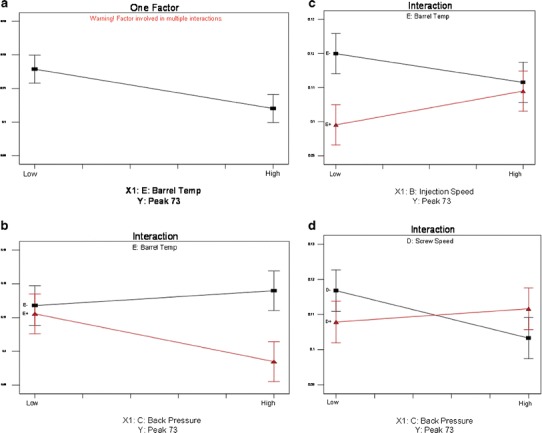
a GC peak 73, process factor barrel temperature. b GC peak 73, interaction between barrel temperature and back pressure (red = high, black = low levels of BT). c GC peak 73, interaction between barrel temperature and injection speed (red = high, black = low levels of BT). d GC peak 73, interaction between screw speed and back pressure (red = high, black = low levels of SS)
In general, among GC peaks 72–74, an independently significant inverse relationship was found for BT; with increasing BT, a decreasing level of a GC peak was observed as shown in Fig. 8a. The predominant significant interaction terms with BT included BP, IS, and SS. In BT interactions with BP, this inverse relationship was observed only at the high level of BT; e.g., for GC peak 73, the model indicates a decreasing peak level with increasing BP, but only at the high level of BT (Table VII, Fig. 8b). At the low level of BT, this association was not observed. A similar but opposite statistical association was observed with the BT and IS interactions in these models (Table VII, Fig. 8c). For the BP and SS interaction, an inverse relationship was observed between the BP and GC peak levels, but only at the low level of SS (Table VII, Fig. 8d).
Optimization Results
Optimization analysis was performed to obtain estimates for optimal levels of the specific ANOVA model significant process factors that would minimize the levels of the selected GC peaks based on good model “fit” (R2 > 0.50). This statistical analysis was considered as a theoretical exercise to demonstrate how the quantitative model could be used. Whether the peaks should be minimized or maximized is dependent on the compound type and optimization goal (e.g., patient safety—minimize extracted compounds or component functionality—minimize polymer degradation). In this case, the goal was minimization of the GC peak response and the process factors were constrained within their low and high DoE settings. It should be noted that only statistically significant factors identified during ANOVA modeling were included in the optimization process. The other nonsignificant factors were excluded as they did not yield influence on the responses. Because the final model for peak 71 excluded two outliers and was the only model that included residence time as significant factor, the optimization was done separately for GC peaks 53, 72–74, and for GC peak 71.
The top optimization results for the selected GC peaks are listed in Table VIII. The statistical solutions for the factor levels were obtained as numerical values and have been represented as descriptive terms, e.g., high, low, for proprietary reasons. There were over 100 statistical solutions; however, only the top solution for each GC peak is listed in Table VIII.
Table VIII.
Optimization Solutions for GC Peaks 53, 71–74
| GC peak number | Process factorsa | Predicted response (GC peak level) | ||||
|---|---|---|---|---|---|---|
| Residence time | Injection speed | Back pressure | Screw speed | Barrel temp | ||
| 53 | Low | High | Low | High | 0.194 | |
| 71 | High | Low | High | 0.539 | ||
| 72 | Low | High | Low | High | 0.049 | |
| 73 | Low | High | Low | High | 0.088 | |
| 74 | Low | High | Low | High | 0.269 | |
aWherever blank, the process factor was not significant in the final ANOVA model
In summary, each combination of the statistically significant process factor levels is expected to produce the theoretically desired responses for minimal values for the respective GC peaks. From the optimization analysis, it is evident that high barrel temperature and back pressure and low injection and screw speeds will result in minimal amount of extractables as represented by the levels of GC peaks 53 and 72–74 in this DoE. In addition to low injection speed and high barrel temperature, GC peak 71 can be minimized by high residence time.
DISCUSSION
A molding process DoE, statistical analysis, and modeling have been used to demonstrate that process parameters can be quantitatively linked to the levels of extractables in a critical delivery system component. At the outset, PCA was useful to discriminate between the extractable data sets and eliminate results that might otherwise have confounded the analysis of the linkage between the process parameters and extractable profiles. The use of replicate nominal reference molding conditions along with true replicate analysis also facilitated an understanding of the noise associated with the extractable results. This coupled with an understanding of the analytical method capability resulted in a reduction in the number of peaks for analysis to a manageable number.
Regardless of the statistical technique used (PCA or MLR), the DoE study results demonstrate that barrel temperature and back pressure are two of the most important process factors associated with all of the extractable GC peaks included in the evaluation. Screw and injection speeds were found to have an impact as well, but to a much lesser degree involving only a few of the GC peaks. Barrel temperature appears to be consistently important for all peaks, since it was identified as significant either individually or as an interaction product for all 26 GC peaks.
The barrel temperature is important both functionally and chemically. From the plastic molder’s perspective, barrel temperature is an important factor in molding, since this is the process parameter that if not properly set may lead to scorching or structural defects in the molded component. It is reasonable that changes in extractable behavior could be related to this factor, since many of the additives and the polymer itself may be degraded by high temperature. As noted in Table VII, barrel temperature played a strong part as an inversely related factor and a moderating role in the impact of other factors on the levels of additives in the polymer as represented by GC peaks 53, 71–74.
It is interesting to note that in the MLR results, the BP × BT interaction was statistically more significant than either term by itself. An increase in back pressure will tend to compress the material and may create shear forces that could increase the material temperature. This coupled effect of barrel temperature and back pressure could be more influential on chemical degradation of the polymer composition. The GC peaks representing polymer related degradants (9–48) did not seem to be strongly impacted by these two factors or their combination since the model fit statistics were not strong (R2 < 0.50). This is likely due to the fact that the components were molded within parameter settings that were known to produce high quality parts.
For the theoretical optimization experiments, a minimization exercise was performed using the quantitative models for GC peaks that represented some of the polymer additives but not the polymer related degradants, since those models had inadequate fits. From a pharmaceutical perspective, lower levels of extractables are generally better. However, from a component manufacturer perspective, a minimum level of each additive is needed to give the desired functional characteristics and shelf life. Ideally, suitable models for polymer degradants would have been obtained and optimization experiments would have included minimization of those levels while optimizing those of specific additives, e.g., antioxidants, with consideration given to both component stability and patient safety. While this theoretical exercise demonstrates feasibility, it is recognized that the effort required to develop such models may exceed the benefit obtained from such quantitative information. It is quite possible that many pharmaceutical manufacturers may not have access to the needed proprietary molding information and it may not be practically feasible to implement statistically derived optimal processing conditions.
The results from the statistical evaluation suggest that the molding process can have some effects on an extractable profile, e.g., peak area. The levels of polymer related degradants as well as additives varied depending on the combination of molding parameters. However, the level of additive degradation was not significant enough to generate quantifiable new peaks in the chromatogram. Wider ranges of molding parameters or subsequent storage at elevated temperatures could increase the rate of chemical reaction and increase these degradation levels. In the current study, the levels of the compounds represented by the peaks in the chromatograms are well below safety concern levels in this particular case, which means that if they were to appear as leachables, there would be no cause for concern. However, each application must have its own evaluation with regard to the significance with respect to the patient. A different range of molding process parameters on the same component may affect the extractable profile differently and would need to be evaluated similarly. Whether the molding process parameters would have significant effect on an extractable profile of another component molded from the same ABS would need to be similarly determined. The overall impact of the molding process on the quality and safety of the final drug product will depend specifically on the identity of the leached compounds and exposure levels at which those compounds are considered safe.
CONCLUSION
We have demonstrated a conceptual approach to exemplify how quality by design concepts may be applied to management of extractables and leachables. While there has been much theoretical discussion in recent years regarding the practice of quality by design, there has been very little published to practically illustrate how this can be accomplished. One approach that has been discussed and applied involves consideration of the material of construction and utilization of the extractable profile of that material to manage leachables (3,9). In this article, we have provided a comprehensive practical paradigm that involves the following steps: identification of critical components, identification of materials and key unit operations, identification of key process parameters, designed experiments, statistical analysis, and quantitative model development to link key process parameters with extractable profile. To complete this paradigm for a specific drug product, the safety evaluation of extractables and linkage of extractables to leachables would need to be performed. Although the safety evaluation and linkage of extractables to leachables were not the focus of this article, this topic has been dealt with extensively elsewhere (10). Through identification of key process parameters that may affect extractable profiles early in development, it may be possible to mitigate product leachables that could arise later in development. This could be readily facilitated by incorporation of extractable evaluation into the suite of material and mechanical testing that is performed during critical component development.
Acknowledgments
The authors wish to thank the members of the IPAC-RS L&E Development Paradigm Working Group for their valuable contributions to this work. The ABS component molding was kindly performed by Plastiape.
Footnotes
Statistical analysis of extractable data from parts processed via a design of experiments is used to investigate risk-based approaches to leachable management.
References
- 1.International Conference on Harmonization (ICH). ICH Q8 Pharmaceutical Development. 2009 [cited 2014 Apr 9]. Available from: http://www.ich.org/products/guidelines/quality/article/quality-guidelines.html.
- 2.International Conference on Harmonization (ICH). ICH Q9 Quality Risk Management. 2005 [cited 2014 Apr 9]. Available from: http://www.ich.org/products/guidelines/quality/article/quality-guidelines.html.
- 3.Norwood DL, Ball D, Blanchard J, Celado L, Deng TJ, DeGrazio F, et al. Safety thresholds and best practices for extractables and leachables in orally inhaled and nasal drug products. Product Quality Research Institute. 2006 [cited 2014 Apr 9]. Available from: http://www.pqri.org/pdfs/LE_Recommendations_to_FDA_09-29-06.pdf.
- 4.Ding W, Martin J. Implementation of single-use technology in biopharmaceutical manufacturing: an approach to extractables and leachables studies, part three—single use systems. BioProcess International. 2010;52–9.
- 5.Jenke D. Compatibility of pharmaceutical products and contact materials. Safety considerations associated with extractables and leachables. Hoboken: Wiley; 2009. [DOI] [PubMed] [Google Scholar]
- 6.Lam M, Knotts N, Jones G, Duffield W, Shaw AJ, Roan S, Stults CLM. Use of designed experiments to understand and control variability of extractables. Poster presented at IPAC-RS Conference: Doing the Right Thing in the Changing Culture of Design and Development of Inhalation and Nasal Drug Products: Science, Quality, and Patient-Focus; 2008 Sept 22–24; Bethesda, Maryland.
- 7.Stults CLM, Ansell JM, Shaw AJ, Nagao LM. Evaluation of extractables in processed and unprocessed polymer materials used for pharmaceutical applications. AAPS Pharm Sci Tech (in press). [DOI] [PMC free article] [PubMed]
- 8.Myers RH, Montgomery DC, Anderson-Cook CM. Response surface methodology: product and process optimization using designed experiments. 3. New York: Wiley; 2009. [Google Scholar]
- 9.Jenke D. Application of quality by design (QbD) principles to extractables/leachables assessment. Establishing a design space for terminally sterilized aqueous drug products stored in a plastic packaging system. PDA J Pharm Sci Technol. 2010;527–35. [PubMed]
- 10.Ball DJ, Norwood DL, Stults CLM, Nagao LM, editors. Leachables and extractables handbook: safety evaluation, qualification, and best practices applied to inhalation drug products. Hoboken: Wiley; 2012. [Google Scholar]


