

Abstract
Lamotrigine (LTG), a sodium and calcium channel blocker, has demonstrated efficacy for the treatment of neuropathic pain in multiple, randomized, controlled trials. However, its potential clinical applications in neuropathic pain are limited due to the risk of dose-dependent severe rashes associated with high dose and prompt dose escalation. Further, the poor pharmacokinetic profile due to non-selective distribution to organs other than brain reduces the efficacy of dosage regimen. Therefore, the aim of present investigation is to develop surface-engineered LTG nanoparticles (NPs) using transferrin and lactoferrin as ligand to deliver higher amount of drug to brain and improve the biodistribution and pharmacokinetic profile of drug with prolonged duration of action and reduced accumulation in non-target organs. The LTG NPs were prepared by nanoprecipitation and optimized by factorial design for high entrapment and optimized particle size. The optimized NPs were surface functionalized by conjugating with the lactoferrin (Lf) and transferrin (Tf) as ligands. The developed NPs were characterized for different physicochemical parameters and stability. The in vivo biodistribution showed preferential targeting to brain and reduced accumulation in non-target organs over a prolonged duration of time. Finally, partial sciatic nerve injury model was used to demonstrate the increased pharmacodynamic response as antinociceptive effect. Both biodistribution and pharmacodynamic study in mice confirmed that the approach used for LTG can help to increase clinical applications of LTG due to brain targeting and reduced side effects.
KEY WORDS: brain targeting, factorial design, lactoferrin, lamotrigine, transferrin
INTRODUCTION
Chronic pain affects over 100 million Americans annually (1). Patients are frequently dissatisfied due to inadequate drug dosing and unavailability of appropriate drug therapy (2). Analgesics, found to be very effective for acute inflammatory traumatic pain, are not very helpful in treating the majority of chronic pain conditions (3). Additionally, the level of efficacy reaches only 5–30% for any particular drug due to poor pharmacokinetic profile of the drugs.
Non-opioid drugs are generally used for postoperative and chronic pain due to its low side effects as compared to opioids (4). Surprisingly, most of these have evolved from efficacy noted in non-pain indications of anti-epileptics and depressants. Lamotrigine (LTG), a sodium and calcium channel blocker, has demonstrated efficacy for the treatment of neuropathic pain in multiple, randomized, controlled trials (5). However, its potential clinical applications in neuropathic pain are limited due to the risk of dose-dependent severe rashes, as well as Stevens-Johnson syndrome, a potentially fatal epidermal necrosis associated with high dose and rapid dose escalation as a result of ability of LTG to activate T lymphocytes (6). Although LTG has sufficient lipophilicity (log P of 1.87) ensuring a rapid onset of action, it is not retained in the brain for longer time, and a rapid decline in the brain concentration occurs diminishing the analgesic action of drug (7). The poor pharmacokinetic profile due to non-selective distribution LTG in free form to organs other than the site of action, i.e., brain, is the major cause of reduced efficacy of dosage regimen and side effects (8,9). Therefore, it is desired to enhance the drug efficacy by selective targeting and retention of LTG in the brain and also reduce the systemic exposure of free drug minimizing the adverse effects.
Colloidal systems have been successfully used for changing tissue distribution pattern of drug and selective targeting to the brain (10). Polymeric nanoparticles (NPs) can entrap the drug and act as drug reservoirs with sustained release and reduce the systemic exposure to free drug and toxicity associated with the same (11,12). Specifically, nanoparticles of biodegradable polymers such as poly(lactic-co-glycolic acid) (PLGA), with established safety profile, have been approved by USFDA (13). Additionally, they have been reported to offer ease of processability (14,15).
However, drug delivery to the brain is severely limited by the presence of blood–brain barrier (BBB). The BBB comprising of the endothelial cells forming tight junctions restricts the entry of therapeutics to the brain (16). Several approaches have been employed and still being investigated to enhance drug delivery across BBB (17). One of the ways is to exploit the presence of active transport mechanisms for supply of nutrients and ions to the brain. The ion transport generally occurs via receptor-mediated endocytosis of non-heme iron-binding glycoproteins, transferrin (Tf), lactotransferrin (Lf), and melanotransferrin by their respective cognate receptors on endothelial cells (18). The Tf is of particular interest because of substantial expression of Tf receptors on brain capillaries (19). On the other hand, though Lf has been demonstrated to cross the BBB via receptor-mediated transcytosis (20), there are very few studies signifying the potential of Lf as brain delivery vector (21,22).
Thus, the aim of the present investigation is to develop surface-engineered LTG NPs using transferrin and lactoferrin as ligand to deliver higher amount of drug to the brain and improve the biodistribution and pharmacokinetic profile of drug with prolonged duration of action, at the same time reduced systemic exposure to free drug due to entrapment within NPs will reduce the possibility of side effects. The pharmacokinetic features were evaluated by using radiolabeling method, and pharmacodynamic study was performed on partial sciatic nerve injury model.
MATERIALS AND METHODS
Materials
PLGA 502H (lactide/glycolide ratio 50:50, Mw 12,000 Da) was a gift from Boehringer Ingelheim (Germany). LTG was a gift sample from Wockhardt Research Centre, India. Polyglycidyl glycerol ether (SR-4GL, Mw 648 Da, hexa-epoxy) was a gift by Sakamoto Yakuhin Kogyo Co., Ltd., Japan. Polyvinyl alcohol (PVA, Mw 30,000–70,000 kDa; hydrolyzed 87–89%) and lactoferrin (bovine colostrums) were procured from Sigma (India). Transferrin (bovine) was obtained from Calbiochem, Merck Specialities (USA). Zinc tetrafluoroborate hydrate was obtained from Acros Organics, Belgium. Bicinchoninic acid (BCA) protein estimation kit was purchased from Genei, Bangalore. Instant thin-layer chromatography (ITLC) plates were obtained from Gelman Science Inc. (Ann Arbor, MI). HPLC grade acetone was purchased from Merck. All other reagents used were of analytical grade.
Preparation and Optimization of NPs
NPs of LTG were prepared by nanoprecipitation method (23). From preliminary studies, the drug/polymer ratio, organic/aqueous phase ratio, and percent PVA concentration (independent variables) were found to significantly affect particle size (PS) and entrapment efficiency (EE) (dependent variable) and, therefore, were chosen for further optimization. Briefly, PLGA 40, 60, and 80 mg (drug/polymer ratio of 1:5, 1:7.5, and 1:10, respectively) and LTG 8 mg were dissolved in acetone 2.5, 3.3, and 5 mL (organic/aqueous phase volume ratio of 1:4, 1:3, and 1:2, respectively). The organic phase was added dropwise (0.5 mL/min) into 10 mL of aqueous phase containing PVA (0.5, 1, and 1.5% w/v) solution using syringe and stirred by a magnetic stirrer at 600 rpm until acetone gets completely evaporated leading to the formation of nanoparticle dispersion. The PLGA-NP dispersion was centrifuged at 25,000 rpm for 30 min, and the supernatant was discarded. The precipitate was washed twice with distilled water to remove the excess PVA. The collected NPs were dispersed in water and lyophilized using trehalose as lyoprotectant at a ratio of 1:2 (NPs/lyoprotectant) (Heto Drywinner, Denmark) (24).
The study was done using 33 factorial design and contour plots, by choosing the above-mentioned independent variables and dependent variables. The coded and actual values for independent variables are shown in Table I.
Table I.
Translation of Coded Levels to Actual Quantities for LTG-NPs
| Coded values | Actual values | ||
|---|---|---|---|
| Stabilizer concentration | Polymer concentration | Volume of organic phase | |
| X 1 (% w/v) | X 2 (mg) | X 3 (mL) | |
| −1 | 0.5 | 50/40 | 2.5 |
| 0 | 1 | 75/60 | 3.3 |
| 1 | 1.5 | 100/80 | 5 |
Further, multiple regression analysis was performed using Microsoft Excel software, and Eq. 1 was selected to yield a second-order polynomial (25):
| 1 |
where Y is the dependent variable, b0 is the arithmetic mean response of the 27 trials, and bi (b1, b2, b3, b11, b22, b33, b12, b13, b23, and β123 are the regression coefficients for the corresponding variable Xi (X1, X2, X3, X21, X22, X32, X1X2, X1X3, X2X3, and X1X2X3) which represents the average result of changing one factor at a time from its low to high value. The interaction term (X1X2, X1X3, X2X3, and X1X2X3) shows how the response changes when two or three factors are simultaneously changed. The polynomial terms (X21, X22, and X32) were included to investigate non-linearity.
The method of best fit was used to (26) define the relationship between dependent variables, PS (YPS) and EE (YEE) and the independent variables. Analysis of variance (ANOVA) was applied to determine the level of significance of full model and reduced model. Further, NCSS software was used to construct 2D contour plots, and check point analysis was performed using Student’s t test.
Finally, the desirability function, as a multi-response optimization technique, was applied for simultaneous optimization of PS and EE, wherein total desirability was calculated using Design Expert software. The desirability value, which defines the closeness of a response to its ideal value, lies between 0 and 1. The total desirability is reported as mean of the individual desirability for PS and EE (27).
| 2 |
where D is the total desirability, and dPS and dEE are individual desirability for PS and EE.
Functionalization of LTG-PLGA-NPs
Surface Modification of PLGA-NPs
The two-step procedure as described by Sahoo and Labhasetwar, i.e., activation of NPs and subsequent conjugation, was used for conjugation of optimized NPs with Tf or Lf (28). The activation was done by reaction of hydroxyl group of residual PVA in NPs (75 mg) with epoxy group of polyglycidyl glycerol ether (10 mg) in the presence of zinc tetrafluoro borohydrate as a catalyst in borate buffer (pH 5.0, 50 mM). A solution of SR-4GL (10 mg) was added as a linker, and the reaction mixture was stirred on a magnetic stirrer at 37°C for 30 min. The NPs were separated by centrifugation (25,000 rpm for 30 min, 4°C) and were washed thrice with borate buffer to remove unreacted SR-4GL. In second step, Tf or Lf borate buffer (1 mg/mL) solution was added to the dispersion of the epoxy-activated nanoparticles, and the resulting reaction mixture was stirred on magnetic stirrer at 37°C for 2 h. Once again, NPs were separated by centrifugation as in step one to remove unreacted Tf or Lf. The NPs were washed twice with borate buffer and were stored at −40°C for 48 h followed by lyophilization.
Estimation of Surface Transferrin/Lactoferrin Density
The amount of the Tf and Lf conjugated to the surface of NPs was estimated using the BCA protein estimation kit. The NPs were centrifuged at 25,000 rpm for 30 min, and 0.2 mL of the supernatant was separated to which 2 mL of the BCA working reagent (BWR) was added and incubated at 60°C for 30 min. The incubated samples were allowed to cool down to ambient temperature and the absorbance measured at 562 nm against water as blank. The test concentration was determined from developed calibration curve. The amount of the Tf or Lf conjugated was equal to the difference of the total Tf or Lf taken for conjugation and the amount of unconjugated Tf estimated in supernatant. The density of Tf or Lf molecules on nanoparticle was calculated by dividing the number of proteins bound to NPs by the calculated average number (n) of NPs as shown in Eq. 3 (29):
| 3 |
where m is the NP weight, D the number-based mean NP diameter determined by DLS, and ρ the NPs weight per volume unit (density), estimated to be 1.1 g/cm3.
Characterization of NPs
The conjugated and unconjugated Tf-LTG-PLGA-NPs and Lf-LTG-PLGA-NPs were characterized for the particle size and zeta potential by using Zetasizer (Malvern Zeta Sizer, Nano ZS, UK). For the determination of drug entrapment, 2 mg of NPs was added to acetonitrile and shaken on cyclomixer to extract the drug. The supernatant was separated by centrifugation (rpm, time) and diluted appropriately to get absorbance in calibration range over UV spectrophotometer (Shimadzu 1700, Japan) at 278 nm.
The surface morphology of the nanoparticles was established using transmission electron microscopy (TEM) (Morgagni, Philips, Eindhoven, Netherlands) following positive staining with phosphotungstic acid (0.5%). Differential scanning calorimeter (Mettler Toledo DSC, Japan) was used for DSC analysis using a heating rate of 10°C/min over a range of 30°C to 300°C under inert nitrogen atmosphere maintained at a flow rate of 40 mL/min. The obtained thermograms were recorded in Mettler Toledo Star SW 7.01 software. The in vitro drug release of conjugated and unconjugated NPs was performed in PBS (pH 7.4) containing 1% sodium lauryl sulfate as dissolution media at 37°C. In screw-capped tubes containing 20 mL of dissolution media maintained at 37°C, NPs equivalent to 2 mg drug were suspended and shaken at 60 rpm over a horizontal shaker bath. Samples were taken out at specific time intervals and centrifuged at 25,000 rpm for 30 min. The pellet (sediment) was collected and dissolved in acetonitrile, and drug remaining in the NPs after release was measured using UV spectrophotometer.
Estimation of Residual PVA
The estimation of residual PVA coupled with NPs was based on colorimetric complex formation between two adjacent hydroxyl groups of PVA and an iodine molecule (30). Briefly, 2 mg of NP sample was reacted with 2 mL of 0.5 N NaOH for 15 min at 60°C which was subsequently neutralized with 900 μL of 1 N HCl, and the volume was adjusted to 5 mL with distilled water (DW). Then, 3 mL of a 0.65 M solution of boric acid, 0.5 mL of a solution of I2/KI (0.05 M/0.15 M), and 1.5 mL of DW were added to each sample. The samples were incubated for 15 min and subjected to colorimetric measurement at 690 nm. Test concentration was determined from calibration curve of PVA prepared under identical conditions.
Pharmacokinetic Evaluation
Radiolabeling
The labeling of drug solution (DS) and NPs with technetium (99mTc) was performed by direct labeling as per the reported method with some modifications (31). Briefly, the labeling was performed by separately incubating DS and NPs with pertechnetate solution (18.5–22.2 MBq) at room temperature using stannous chloride (5 mg/mL) as a reducing agent and 0.5 M sodium bicarbonate solution for pH adjustment in sterile NaCl solution. The conditions were optimized to get highest labeling efficiency. The quality control (percentage labeling efficiency and stability of the labeled complexes) was performed as described (32).
Labeling Efficiency
The labeling efficiency of 99mTc-DS and 99mTc-NPs was determined using ascending ITLC using silica gel (SG)-coated fiber glass sheets (Gelman Sciences Inc., Ann Arbor, MI). Approximately, 2 to 3 μL of the radiolabeled complex was applied at one end of an ITLC-SG strip and eluted using acetone as mobile phase. The strip was cut horizontally into two halves, and the radioactivity in each half was determined in a gamma ray counter (gamma ray spectrometer, Captec-R, Capintec, USA). The free 99mTc-pertechnetate that moved with the solvent (Rf = 0.9) was determined, while the radiocolloid (reduced/hydrolyzed) technetium along with the labeled complex remained at the point of application.
The amount of radiocolloids was determined using ITLC with pyridine/acetic acid/water (3:5:1.5 v/v) as mobile phase (33,34). The radiocolloids remained at the point of application, while both the free pertechnetate and the labeled complex were carried in solvent front. The activity migrated using pyridine/acetic acid/water as a mixture was subtracted from that with the solvent front using acetone, and the net amount of 99mTc-DS and 99mTc-NPs was calculated.
In Vitro Stability of Labeled Complex
The in vitro stability of radiolabeled formulations was determined in rat serum. The complex (0.1 mL) was mixed with 1.9 mL of rat serum and incubated at 37°C. The samples at different time points up to 48 h were subjected to ITLC using acetone solvent systems. The percent labeling efficiency for LTG solution and NPs was determined.
Biodistribution Studies
All experiments conducted on animals were approved by the Social Justice and Empowerment Committee, Ministry of Government of India. All animals were received and handled humanely in compliance with the principles of laboratory animal care. Animals for experiment were housed in individual cages in a temperature- and humidity-maintained room with a 12-h light–dark cycle. Healthy Swiss albino mice, of either sex, weighing 25 to 30 g, were chosen for pharmacokinetic biodistribution study. The mice were divided into four groups labeled as group I, group II, group III, and group IV. The four groups were administered 99mTc-lamotrigine solution (LTGS), 99mTc-LTG-NPs, 99mTc-Tf-LTG-NPs, and 99mTc-Lf-LTG-NPs, respectively. Solution of LTG was used for comparison. One hundred microliters was injected via tail vein containing 74–88.8 MBq/kg of radioactivity. The mice were sacrificed and blood was collected via cardiac puncture at time intervals of 0.17, 0.5, 1, 2, 4, 24, and 48 h. At each time point, three mice were sacrificed, and various organs including the brain, liver, kidney, heart, lungs, and spleen were dissected. The isolated organs were washed twice with normal saline, cleared off any adhering tissues, dried between adsorbent paper folds, placed in tared plastic tubes, and weighed. The radioactivity present in each tissue/organ was determined using shielded well-type gamma scintillation counter along with three samples of standard solution representing 100% of the administered dose. The radioactivity fraction of administered dose per gram of the tissue (%A/g) was calculated in each organ/tissue as given below,
| 4 |
The total radioactivity in a tissue includes the radioactivity in the vascular space as well as in the tissue parenchyma. Hence, a correction was made for exact determination of the radioactivity in tissue using the formula reported by Hatakeyama et al. (35):
| 5 |
where V0 is the total volume of the vascular space and tissue parenchyma, as determined by the radioactivities in the whole organ samples divided by the blood concentration 10 min after i.v. injection. Non-compartmental pharmacokinetic model, with i.v. bolus dosing, was applied for determining kinetic parameters using Kinetica (version 4.40, Innaphase, Philadelphia, PA, USA). Further statistical evaluations were done using ANOVA considering p < 0.05 as significant.
Intradermal Skin Tests
ISO 10993-10, “Tests for Irritation and Sensitization,” recommends intradermal skin test to prove the irritation and skin sensitization potential (36). Therefore, intradermal skin tests were performed to check for the ability of NPs to reduce LTG-induced rashes and epidermal necrosis as per the procedure previously described (37). Briefly, mice weighing 25–30 g were selected, and the abdominal skin was shaved. LTG-NPs and LTG (10 μL, 1 mg/mL) were injected intradermally under isoflurane anesthesia. Histamine (27 μg/mL) and saline were used as positive and negative controls, respectively. The reaction of the skin was examined for immediate as well as late response. Based on the size of the wheal by visual examination and palpation, a score (0–4) was applied to each injection site. A score of 0 was given for wheals equivalent to those seen for the negative control (saline), and a score of 4 was given to the wheals matching those seen for the positive control (histamine). A score of 2 was given to wheals that were intermediate between the two controls. Wheals with a score of 2 or greater were considered positive reactions. The average score was calculated by dividing the total score with number of animals (n = 6).
Pharmacodynamic Evaluation
With LTG being indicated for neuropathic pain, the partial sciatic nerve injury model was employed for inducing nerve injury in rats (38). Rats were anesthetized with ketamine (70 mg/kg, intraperitoneal) along with xylazine (7 mg/kg, intramuscular). The skin of the lateral left thigh was incised and the overlying musculature separated to expose the sciatic nerve. Silk ligature was tied tightly approximately 1/3 to 1/2 of the diameter around sciatic nerve. The muscle was then closed in layers and the skin sutured together. Topical antibiotic powder was applied to the wound and the animals were housed individually. The total period of anesthesia did not exceed 30 min. Animals were allowed to recover from surgical trauma. Responses to thermal stimuli were measured before and 6 h, 1, 3, 7, and 14 days after the surgical procedure. Non-injured paw (contralateral) was used as control. Appropriate time was decided for evaluation of formulation based on the above results for thermal hyperalgesia.
The thermal nociceptive threshold was measured according to the method of Hargreaves et al. (39). The rats were placed beneath a clear plastic cage (10 × 20 × 24 cm) upon an elevated floor of clear glass. A radiant heat source (halogen projector lamp) was placed beneath the glass floor on a movable holder and positioned such that it focuses at the plantar area of one hind paw. The time interval between the application of the light beam and the brisk hind paw withdrawal response was measured. The experimental cutoff to prevent damage to the skin was set at 20 s. Licking of their hind paws or jumping (whichever occurred first) was used as the end point for the determination of pain response latencies. Failure to respond within 20 s resulted in the termination of the test. Animals presenting training latencies higher than 8 s were excluded. Rats were divided into five groups, which were intravenously administered saline control, LTGS, LTG-NPs, Tf-LTG-NPs, and Lf-LTG-NPs, respectively.
Each rat was then tested before and 0.5, 1, 2, 4, 8, 16, 24, 36, and 48 h after administration of above-mentioned formulations. The response was converted to maximum possible effect (%MPE) calculated as [(T1 − T0) / (T2 − T0)] × 100, where T0 and T1 were paw withdrawal latency before and after administration of formulation or saline and T2 was the cutoff time. The data were expressed as mean of six determinations.
Stability Study
The stability studies were carried out for the NP formulations at different storage conditions mentioned in ICH for products intended to be stored in a refrigerator, i.e., 5 ± 3°C for 6 months and 25 ± 2°C/60 ± 5% relative humidity (RH) up to 6 months. The NPs were filled in glass vials, closed with rubber closures, and sealed with aluminum caps. The contents of the vials were evaluated at specific time intervals for physical appearance, particle size (PS), zeta potential (ZP), and drug content. The obtained stability data for Tf-LTG-NPs and Lf-LTG-NPs was subjected to appropriate statistical evaluation.
RESULTS AND DISCUSSIONS
Preparation and Optimization of Nanoparticles
Twenty-seven batches for each of LTG NPs were prepared by nanoprecipitation method using 33 factorial design, as shown in Table II. In order to determine major contributing variables, the full model second-order polynomial equation (Eqs. 6 and 7) obtained by multiple regressions was converted to reduced model equation (Eqs. 8 and 9) by omitting non-significant (p > 0.01) terms from the full model (23).
| 6 |
| 7 |
Table II.
33 Factorial Experimental Design for LTG-NPs
| Batch | X 1 | X 2 | X 3 | PS (±SD) nm | EE (±SD) % |
|---|---|---|---|---|---|
| 1 | −1 | −1 | −1 | 142.7 (4.4) | 64.14 (1.5) |
| 2 | −1 | −1 | 0 | 128.6 (3.4) | 60.10 (1.8) |
| 3 | −1 | −1 | 1 | 114.3 (3.9) | 58.59 (1.9) |
| 4 | −1 | 0 | −1 | 156.6 (5.0) | 74.38 (2.0) |
| 5 | −1 | 0 | 0 | 146.7 (4.7) | 72.74 (1.6) |
| 6 | −1 | 0 | 1 | 129.5 (4.1) | 69.13 (1.3) |
| 7 | −1 | 1 | −1 | 170.7 (6.3) | 83.36 (1.8) |
| 8 | −1 | 1 | 0 | 154.4 (4.0) | 81.78 (1.5) |
| 9 | −1 | 1 | 1 | 143.0 (4.1) | 79.17 (1.9) |
| 10 | 0 | −1 | −1 | 136.3 (3.7) | 61.67 (1.3) |
| 11 | 0 | −1 | 0 | 122.3 (3.2) | 57.93 (2.0) |
| 12 | 0 | −1 | 1 | 109.1 (5.3) | 56.21 (1.2) |
| 13 | 0 | 0 | −1 | 148.6 (3.6) | 73.59 (2.1) |
| 14 | 0 | 0 | 0 | 137.2 (5.6) | 70.38 (1.9) |
| 15 | 0 | 0 | 1 | 122.7 (4.3) | 68.65 (1.7) |
| 16 | 0 | 1 | −1 | 161.5 (3.4) | 81.78 (1.1) |
| 17 | 0 | 1 | 0 | 149.7 (3.2) | 80.59 (1.8) |
| 18 | 0 | 1 | 1 | 133.9 (3.6) | 78.28 (1.7) |
| 19 | 1 | −1 | −1 | 129.5 (2.9) | 57.90 (2.1) |
| 20 | 1 | −1 | 0 | 113.4 (4.9) | 54.66 (0.9) |
| 21 | 1 | −1 | 1 | 101.0 (3.1) | 52.39 (1.4) |
| 22 | 1 | 0 | −1 | 142.6 (4.5) | 70.24 (1.2) |
| 23 | 1 | 0 | 0 | 132.9 (3.0) | 66.84 (1.5) |
| 24 | 1 | 0 | 1 | 115.7 (4.7) | 65.25 (1.5) |
| 25 | 1 | 1 | −1 | 154.5 (4.0) | 78.80 (2.4) |
| 26 | 1 | 1 | 0 | 141.6 (6.2) | 75.99 (1.2) |
| 27 | 1 | 1 | 1 | 125.5 (3.5) | 73.26 (1.6) |
Values are represented as mean ± SD, n = 3
The significance of omission of non-significant terms of equations was confirmed by ANOVA of full model and reduced model for PS and EE as shown in Tables III and IV, respectively. Since the calculated F value was less than the tabled F value for PS as well EE, it was concluded that the neglected terms have insignificant effect on the prediction and reduced model can be applied. Further, the goodness of fit of the model was concluded from the high values of the determination coefficient R2 for PS and EE indicating a high significance.
| 8 |
| 9 |
Table III.
Analysis of Variance of PS for Full and Reduced Model for LTG-NPs
| df | SS | MS | F | R 2 | ||
|---|---|---|---|---|---|---|
| Regression | FM | 10 | 7,582.598 | 752.860 | 348.312 | 0.995 |
| RM | 3 | 7,501.685 | 2,500.561 | 935.234 | 0.992 | |
| Error | FM | 16 | 34.583 (E1) | 2.161 | ||
| RM | 23 | 61.496 (E2) | 2.674 |
Number of parameters omitted (N) = 7; F calculated = [(SSE2 − SSE1) / N] / MS of error for FM = 1.78, F tabulated = 2.66 (α = 0.05, V1 = 7, and V2 = 16)
FM full model, RM reduced model, df degree of freedom, SS sum of squares, MS mean squares, F Fischer ratio, E1 and E2 sum of squares of error of full and reduced model, respectively
Table IV.
Analysis of Variance of EE for Full and Reduced Model LTG-NPs
| df | SS | MS | F | R 2 | ||
|---|---|---|---|---|---|---|
| Regression | FM | 10 | 2,255.001 | 225.500 | 597.521 | 0.997 |
| RM | 5 | 2,253.13 | 450.625 | 1,195.786 | 0.997 | |
| Error | FM | 16 | 6.038 (E1) | 0.377 | ||
| RM | 21 | 7.914 (E2) | 0.377 |
Number of parameters omitted (N) = 5; F calculated = [(SSE2 − SSE1) / N] / MS of error for FM = 0.99, F tabulated = 2.85 (α = 0.05, V1 = 5, and V2 = 16)
FM full model, RM reduced model, df degree of freedom, SS sum of squares, MS mean squares, F Fischer ratio, E1 and E2 sum of squares of error of full and reduced model, respectively
When the coefficient values of three independent key variables (X1, X2, and X3) in Eq. 8 were compared ignoring the sign, the value for variables X2 (b1 = 13.20) and X3 (b2 = −13.88) was found to be higher, and hence, the variables polymer concentration (X2) and volume of organic phase (X3) were considered to be major contributing variables for PS. Similarly, when the coefficient values of three independent key variables (X1, X2, and X3) in Eq. 9 were compared, the value for variable X2 (b1 = 10.52) was found to be higher, and hence, the variable polymer concentration (X2) was considered to be a major contributor for EE. The optimum formulation offered by software based on desirability was found at 0, 1, and 1 level of X1, X2, and X3, respectively. The calculated desirability factor for offered formulations was 1.00 indicating suitability of the designed factorial model.
The study design was used to study the effect of PLGA concentration, and it was found that an increase in PLGA concentration led to an increase in the PS of the NPs. Availability of PVA on the surface of NPs prevents the aggregation of NPs during solvent evaporation, but in case of higher concentrations of PLGA, deposition of PVA on the particle surface may not be uniform and sufficient leading to an increase in PS. However, an increase in the concentration of PLGA increases the EE. The increase in PS with the increasing PLGA concentration can increase the length of diffusion pathways of drug from the organic phase to the aqueous phase, thus reducing the drug loss through diffusion and increasing EE (24). PS of NPs decreased with the increase of PVA concentration. The decrease in EE with the increase of PVA concentration was probably due to a decrease in PS (40). The PS and EE were found to be inversely proportional to the organic/aqueous phase ratio. As the organic/aqueous phase ratio was increased, the PS and drug EE were decreased, which is in congruence with observation in our previous study (24).
By keeping the minor contributing independent variable (X1) fixed at −1, 0, and +1, the contours were constructed between the other independent variables (X2 and X3) for PS and EE separately. As shown in Fig. 1a–c, the contour plots for PS were found to be a curved sector signifying a non-linear relationship between variables X2 and X3. From the figure, it was concluded that with X2 between 40 and 50 mg and X3between 4.5 and 5 mL, minimum PS (<120 nm) could be achieved. Similarly, panels d to f of Fig. 1 are the contour plots of PLGA-NPs for EE, which were curved sector, and through Fig. 1d, f, it was concluded that maximum EE (>72%) could be obtained with X2 between 70 and 80 mg and entire range of X3.
Fig. 1.
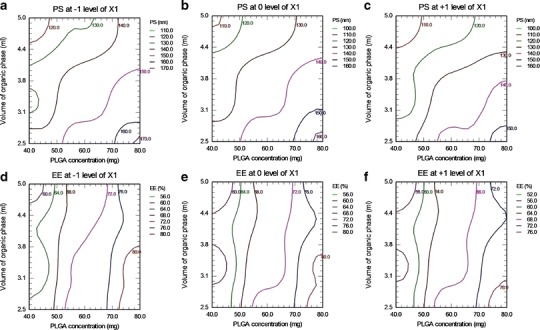
Contour plots of LTG-NPs. Effect on PS of polymer concentration (X 2) and volume of organic phase (X 3) at stabilizer concentration (X 1) of −1 level (a), 0 level (b), and +1 level (c). Effect on EE of X 2 and X 3 at X 1 of −1 level (d), 0 level (e), and +1 level (f)
To get the desired attribute for unconjugated NPs (PS <150 nm and EE >70%), the overlay of PS and EE contour at 0 level of X1 (overlay of 1B and 1D) was obtained as in Fig. 2. It was found that the area between 130 and 140 nm PS curves crossed by 72% EE curve, marked with arrow, is most favorable.
Fig. 2.
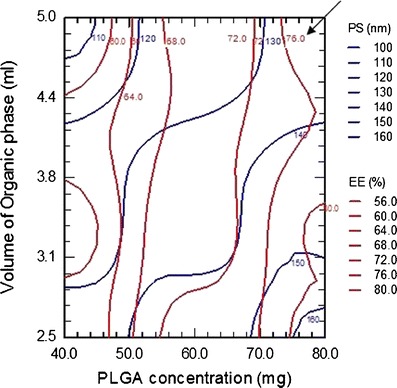
Contour plots of PS and EE for LTG-NPs at 0 level of stabilizer concentration (X 1)
The checkpoint batches were selected from contours plotted at fixed levels of −1, 0, and 1 of independent variable X1 (for PS) and X2 (for EE). The computed values from contours and the experimental values are recorded in Table V for PS and EE. Both experimentally obtained and theoretically computed PS and EE values were compared using Student’s t test, and the difference was found to be non-significant (p > 0.05).
Table V.
Checkpoint Analysis for LTG-NPs
| X 1 | Values from contour plots | PS (nm) | %EE | |||
|---|---|---|---|---|---|---|
| X 2 | X 3 | Calculated | Experimentala,b | Calculated | Experimentala,b | |
| 0.5 | 44.71 | 2.79 | 140.3 | 136.4 ± 3.2 | 64.63 | 65.20 ± 2.12 |
| 0.5 | 72.94 | 3.24 | 154.1 | 146.6 ± 4.4 | 79.35 | 76.36 ± 1.40 |
| 0.5 | 51.76 | 4.85 | 127.9 | 121.4 ± 2.9 | 66.88 | 68.82 ± 1.94 |
| 1 | 77.65 | 2.65 | 160.2 | 165.8 ± 6.2 | 81.35 | 80.87 ± 1.75 |
| 1 | 61.18 | 3.09 | 138.2 | 137.5 ± 4.1 | 70.66 | 71.11 ± 0.97 |
| 1 | 42.35 | 4.56 | 113.9 | 110.2 ± 3.4 | 58.71 | 60.67 ± 2.24 |
| 1.5 | 47.06 | 2.65 | 129.2 | 135.9 ± 3.3 | 60.41 | 61.25 ± 1.35 |
| 1.5 | 63.53 | 3.38 | 133.2 | 141.2 ± 2.8 | 67.09 | 69.91 ± 1.57 |
| 1.5 | 75.29 | 4.26 | 129.6 | 135.6 ± 5.5 | 71.00 | 73.36 ± 1.68 |
PS particle size, EE entrapment efficiency
aExperimental values are represented as mean ± SD, n = 3
bDifference from the calculated values was not significant (p > 0.05)
This proves the role of a derived reduced polynomial equation and contour plots in the preparation of NPs of TMD and LTG of predetermined PS and drug entrapment efficiency within the selected range of the independent variables.
Finally, the batch with PS of 133.9 ± 3.6 nm and drug entrapment efficiency of 78.28 ± 1.7% prepared at 0 level of X1 (1% w/v PVA in aqueous solution), +1 level of X2 (100 mg polymer), and +1 level of X3 (organic/aqueous phase of 1:2, i.e., 5 mL of organic phase and 10 mL of aqueous phase) was considered to be optimum based on the preset criteria of PS <150 nm with highest EE. To validate the reproducibility of the work, tolerance limits were established to prepare the optimized batch having the desired PS and entrapment characteristic. The tolerance for PVA concentration (1 ± 0.05%), polymer concentration (100 ± 5 mg), and volume of organic phase (5 ± 0.25 mL) were observed, and any deviations away from these were found to result in non-desirable values. Further, the process parameters were set as revolutions per minute (600 ± 50 rpm), rate of addition of internal phase (0.5 ± 0.1 mL/min), and processing temperature (25 ± 2°C).
Functionalization of LTG-NP
It is reported that PVA cross-links with PLGA surface in the form of residual PVA (41). One of the epoxy of SR-4GL conjugated to the hydroxyl group of PVA and the other to the amine group of Tf/Lf. The aim of optimization was to achieve a minimum increase in PS and a maximum Tf/Lf density on the surface of NPs. The influence of the amount of epoxy compound on the density of surface Tf/Lf and PS was evaluated keeping the amount of NPs and the amount of Tf/Lf constant at 75 and 1 mg, respectively, and the results are graphically shown in Fig. 3. The amount of epoxy compound was varied at 5, 10, and 20 mg. With the increase in the amount of the epoxy from 5 to 10 mg, the surface Tf density for Tf-LTG-NPs increased from 6.7 to 10.7 μg/mg and the PS increased from 146.9 to 151.0 nm. Increasing the epoxy compound further to 20 mg did not considerably increase the surface Tf density. However, the PS increased from 151.0 to 168.7 nm. Similar results were observed for Lf conjugation. Hence, the epoxy amount was optimized at 10 mg for both Tf and Lf conjugation with LTG-NPs. Conjugation efficiency of Tf and Lf to LTG-NPs at 10 mg concentration of SR-4GL was 80.3% and 85.5%, respectively.
Fig. 3.
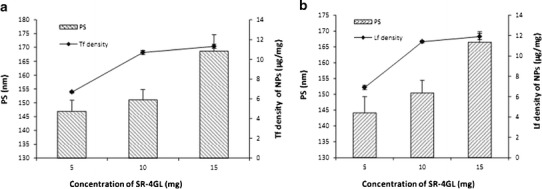
The influence of the amount of epoxy compound on the density of surface Tf/Lf and PS
Similarly, the influence of the amount of ligand on the density of surface Tf/Lf and PS was evaluated keeping the amount of NPs and the amount of SR-4GL constant at 75 and 10 mg, respectively, and the results are graphically shown in Fig. 4. The amount of Tf was varied from 0.25 to 1.5 mg. For LTG-NPs, with an increase in the amount of Tf from 0.25 to 1.0 mg, the surface Tf density increased from 3.3 to 10.7 μg/mg and the PS increased from 140.2 to 151.0 nm. Further increasing the amount of Tf from 1.0 to 1.5 mg and the Lf density increased from 10.7 to 13.0 μg/mg, the PS increased from 151.0 to 163.5 nm. Also, the conjugation efficiency dropped from 80.3% to 65.0% with an increase in Tf from 1.0 to 1.5 mg. For, intravenous administration, the preferable PS is below 200 nm, and hence considering the size and conjugation efficiency, 1.0 mg of Tf/Lf was considered as optimized amount (42). The conjugation of amino group of the Tf and Lf to the epoxy group was estimated and found to be 10.6 μg Tf/mg NPs and 11.1 Lf/mg NPs, which represents approximately 186 Tf molecules per NP and 185 Lf molecules per NP.
Fig. 4.
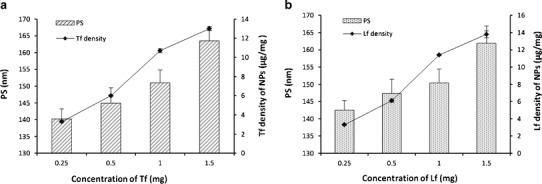
The influence of the amount ligand on the density of surface Tf/Lf and PS
Characterization of NPs
The PS, ZP, %EE, and residual PVA for LTG NPs are recorded in Table VI. The PS of unconjugated NPs was found in the range of 141.1–158.8 nm. Lower PS (<200 nm) suggests suitability of formulation for intravenous applications, while the polydispersity index (PDI) of <0.1 suggests uniform PS distribution. Further, during conjugation, it was ensured to get an insignificant increase in size. ZP of NPs was found in the range of −12.88 to −9.35 mV. The negative value was attributed to the presence of terminal carboxylic groups in the polymers. The ZP values in the range of ± (10–30) are ideal for stability against particle–particle agglomeration. A marginal decrease was observed in ZP with Tf; however, the ZP increases after conjugation with Lf due to its electropositive nature. The drug encapsulation efficiency was found to be higher than 70% for all NP formulations indicating the efficiency of the nanoprecipitation method for selected drugs.
Table VI.
PS, PDI, ZP, %EE, and %Residual PVA of Unconjugated and Conjugated NPs
| Formulations | Evaluation parameters | ||||
|---|---|---|---|---|---|
| PS (nm) | PDI | ZP (mV) | %EE | % residual PVA | |
| LTG-NPs | 133.9 ± 3.6 | 0.048 | −12.07 ± 0.33 | 78.28 ± 1.7 | 5.6 ± 0.3 |
| Tf-LTG-NPs | 151.0 ± 3.8 | 0.107 | −12.88 ± 0.46 | 76.05 ± 1.8 | – |
| Lf-LTG-NPs | 150.4 ± 4.0 | 0.083 | −11.21 ± 0.35 | ± 1.3 | – |
Each value is represented as mean ± SD, n = 3
PS particle size, PDI poly dispersity index, ZP zeta potential, EE entrapment efficiency, PVA polyvinyl alcohol
TEM study (Fig. 5) confirmed the size, uniform distribution, and spherical nature of unconjugated and surface-modified NPs. DSC study (Fig. 6) was performed to investigate the physical state of the drug in the NPs. LTG had endothermic peak at 217–220°C, while the drug-loaded NPs had no such peak, indicating molecular dispersion of drug in polymer matrix.
Fig. 5.
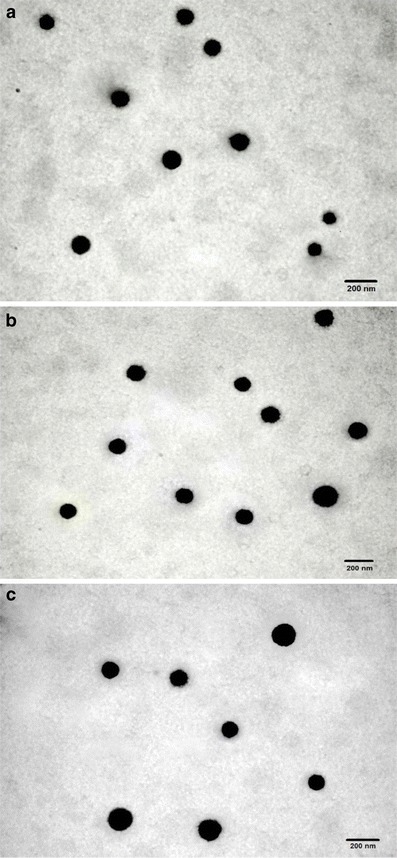
TEM images of a LTG-NPs, b Lf-LTG-NPs, and c Tf-LTG-NPs
Fig. 6.
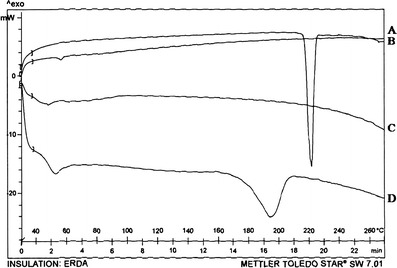
DSC thermogram of a LTG-NPs, b LTG, c PLGA, and d PVA
In vitro drug release from LTG-loaded NPs (conjugated and unconjugated) is shown in Fig. 7. An initial burst release of approximately 20% was observed within 4 h, which may be attributed to the LTG present at the surface of the NPs. More than 50% of drug was released within 1 day for all NP formulations. The prolonged release was observed up to 5 days, showing a typical sustained drug release. Further, the conjugation of the NPs does not affect the in vitro release of the LTG from NPs. The general mechanism by which an active agent is released from a delivery vehicle is a combination of diffusion of an active agent from the polymer matrices, bulk erosion, and degradation of the polymer. Since the degradation of PLGA (ester hydrolysis) is slow, the release of LTG from NPs is governed by drug diffusion from PLGA matrix (43).
Fig. 7.
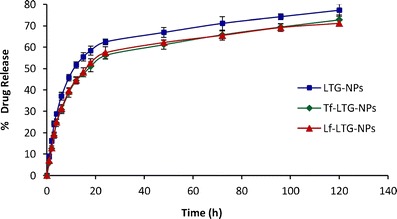
Comparative in vitro release profile of LTG from LTG-NPs, Lf-LTG-NPs, and Tf-LTG-NPs
Pharmacokinetic Evaluation
For tagging the formulations, generally the 99mTc is reduced in the presence of formulations or the previously reduced technetium is used directly. The former method was preferred for drug solutions while direct labeling method was used for NPs. Table VII shows the optimized processing conditions for radiolabeling. Labeled complex was evaluated for labeling efficiency and stability using ascending TLC.
Table VII.
Radiolabeling Summary of DS and NP Formulations
| LTGS | LTG-NPs | Tf-LTG-NPs | Lf-LTG-NPs | |
|---|---|---|---|---|
| Method | Direct labeling | Direct labeling with reduced technetium | Direct labeling with reduced technetium | Direct labeling with reduced technetium |
| Amount of SnCl2 (μg) | 150 | 150 | 150 | 150 |
| pH | 6.5 | 6.5 | 6.5 | 6.5 |
| Incubation duration (min) | 15 | 30 | 30 | 30 |
| Labeling efficiency (%) | 98.16 | 97.14 | 96.87 | 97.53 |
| Activity added (MBq) | 18.5–22.2 | 18.5–22.2 | 18.5–22.2 | 18.5–22.2 |
The in vitro stability of radiolabeled preparations was checked in presence of rat serum and 0.9% w/v sodium chloride up to 48 h. The labeling efficiency of 99mTc-labeled formulation at all the time points was found to be greater than 90%. The serum stability of the labeled complexes indicated the suitability of labeled complex for the biodistribution studies.
The 99mTc-labeled LTG and LTG-loaded NPs were administered to mice by intravenous route. The resultant blood and brain levels of LTG and LTG-loaded NPs as detected by percent radioactivity measurement are shown in Figs. 8 and 9. The LTG and NPs exhibited significantly different pharmacokinetic profiles.
Fig. 8.
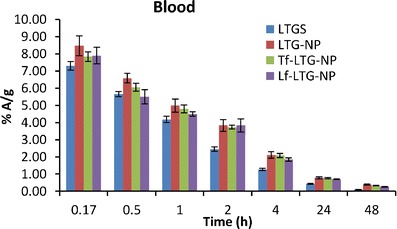
The blood levels of LTG, LTG-NPs, Lf-LTG-NPs, and Tf-LTG-NPs
Fig. 9.
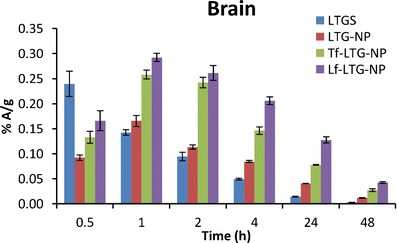
The brain levels of LTG, LTG-NPs, Lf-LTG-NPs, and Tf-LTG-NPs
As shown in Fig. 8, it was observed that LTG displays biphasic plasma behavior and undergoes initial distribution phase followed by prolonged elimination phase which is in congruent with the previous reports (8). The result can be attributed to combined effect of elimination as well as distribution to other organs as shown in organ distribution study. The liver, owing to the lipophilic nature of drug, extracts most of drug from plasma (Fig. 10). This decline in plasma concentration can lead to termination of drug action by redistribution of drug from the brain into blood and other tissues where drug has no action or can result into adverse reaction (9). The α values, distribution rate constant, were calculated as an indicator of rate of decline in blood concentration during distribution phase using the method of residual (Table VIII) (44). It was found that LTGS removed from blood at highest rate (0.965 h−1). The NPs were found to decrease the rate of distribution, reduced α value, which indicates that drug was confined to the blood compartment as a result of decreased uptake of nanoparticles compared to drug into organs like the liver and spleen during the distribution phase. Although not significant, the marginal higher α values of conjugated NPs over unconjugated could be because of receptor-mediated uptake in the liver and spleen which was confirmed in organ distribution study. The blood area under curve (AUC)(0→48) of unconjugated NPs was much higher than that of LTG; about ~1.65-fold greater indicates LTG-NPs’ ability to enhance bioavailability. At the same time, the elimination t1/2 of drug was significantly increased by the NPs with Lf-LTG-NPs, showing a 1.9-fold increase in t1/2 signifying that NPs also slow the decline in blood concentration in elimination phase as well. The fact was further supported by subjecting the data for non-compartmental analysis to determine the mean retention time (MRT) values. There was an increase in the MRT (h) value for LTG by ~2-fold on encapsulation of LTG into NPs. The comparison of conjugated and unconjugated NPs shows that unconjugated NPs have longer MRT (22.27 h) in blood than Lf and Tf-conjugated NPs, 19.5 and 17.83 h, respectively (Table VIII).
Fig. 10.
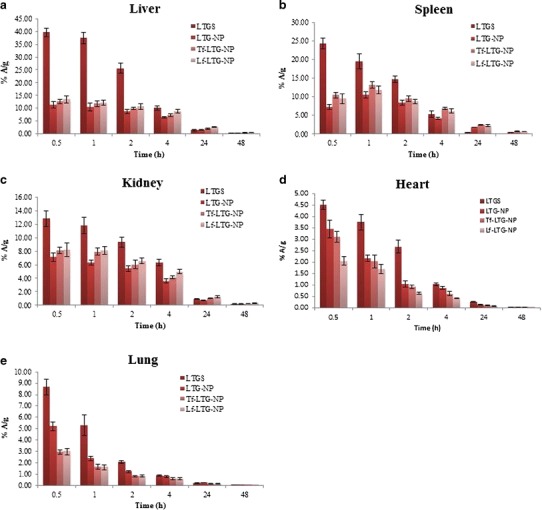
Biodistribution of 99mTc-labeled LTGS and LTG NP formulations in a liver, b spleen c, kidney, d heart, and e lung
Table VIII.
Pharmacokinetic Parameters of Formulation in Brain and Blood
| Formulation | Brain and blood sample | α (h−1) | β (h−1) | t 1/2 β (h) | AUC0–48 | MRT (h) |
|---|---|---|---|---|---|---|
| LTGS | Brain | – | 0.069 ± 0.005 | 10.09 ± 0.54 | 1.26 ± 0.01 | 10.67 ± 0.22 |
| Blood | 0.965 ± 0.048 | 0.061 ± 0.006 | 11.34 ± 0.78 | 36.03 ± 0.44 | 11.60 ± 0.60 | |
| LTG-NPs | Brain | – | 0.046 ± 0.006 | 15.01 ± 1.14 | 2.34 ± 0.03 | 19.31 ± 0.41 |
| Blood | 0.618 ± 0.031 | 0.037 ± 0.003 | 18.82 ± 0.98 | 59.48± 1.02 | 22.27 ± 0.89 | |
| Tf-LTG-NPs | Brain | – | 0.038 ± 0.006 | 18.10 ± 1.08 | 4.32 ± 0.11 | 23.26 ± 1.11 |
| Blood | 0.633 ± 0.041 | 0.041 ± 0.003 | 16.80 ± 1.28 | 57.83 ± 1.56 | 19.50 ± 0.48 | |
| Lf-LTG-NPs | Brain | – | 0.037 ± 0.002 | 18.60 ± 1.19 | 6.37 ± 0.18 | 25.51 ± 0.59 |
| Blood | 0.651 ± 0.028 | 0.044 ± 0.003 | 15.83 ± 0.82 | 52.81 ± 2.09 | 17.83 ± 0.86 |
α distribution rate constant, β and t 1/2 β elimination rate constant and elimination half-life, respectively
The brain concentration profile of LTGS shows that the higher concentration was achieved initially in the brain which decreases rapidly to below 50% A/g within 1.5 h. However, the NPs were able to maintain the concentration for prolonged period of time. The AUC(0→48) values of the brain for LTG-NP, Tf-LTG-NPs, and Lf-LTG-NPs were found to be 1.86-fold, 3.43-fold, and 5.05-fold, respectively, higher than LTGS after i.v. administration. This shows that the NP formulation significant increased the availability of drug at target site than the LTGS, while conjugation with the Tf and Lf leads to further augmentation and brain targeting. This was further supported by t1/2 values which showed an approximate 1.8-fold increase in case of NPs. The MRT values of LTG-NP, Tf-LTG-NPs, and Lf-LTG-NPs were found to have a 1.8-, 2.18-, and 2.39-fold increase than LTGS, respectively.
The brain/blood radioactivity ratios of 0.120 > 0.075 > 0.039 > 0.035 for Lf-LTG NPs, Tf-LTG NPs, LTG-NPs, and LTG solution, respectively, at 48 h also indicate the relative superiority of the prepared NPs for brain delivery. Further, it was observed that the relative targeting ratio (Table IX) for LTG-NPs is higher than the LTGS. Encapsulation of LTG in NPs significantly enhanced the targeting of the LTG to the brain. Further, the conjugation of NPs with Lf and Tf results in 2.14- and 3.45-folds higher brain targeting than LTGS and 1.90- and 3.07-folds higher brain targeting than unconjugated NPs. Finally, the targeting ratio of 1.61 for Lf-conjugated NPs over Tf conjugated NPs shows the superiority of Lf-LTG NPs, than Tf-LTG NPs for brain targeting.
Table IX.
Relative Targeting Ratio of LTG formulations
| Comparison mode | Formulations | Ratio value |
|---|---|---|
| Targeting with respect to drug solution | LTG-NPs/LTGS | 1.12 |
| Tf-LTG-NPs/LTGS | 2.14 | |
| Lf-LTG-NPs/LTGS | 3.45 | |
| Targeting with respect to plain NPs | Tf-LTG-NPs/LTG-NPs | 1.90 |
| Lf-LTG-NPs/LTG-NPs | 3.07 | |
| Lf-conjugated NPs with respect to Tf-conjugated NPs | Lf-LTG-NPs/Tf-LTG-NPs | 1.61 |
The mechanism behind the brain uptake of Tf and Lf conjugated NPs could be due to receptor-mediated endocytosis/transcytosis. The observation of superior uptake of Lf-conjugated nanoparticles against Tf-conjugated NPs corroborates our previous study (24). This was attributed to the low circulating concentration of endogenous Lf and to the approximately 5 nM higher Kd for brain affinity, thereby avoiding the competitive uptake of endogenous Lf to Lf-conjugated nanoparticles as compared to Tf (45). At the same time, relatively cationic nature of Lf might be imparting higher affinity for interaction with negatively charged cell membranes and the phenomena of unidirectional transport of Lf across the BBB from the apical side to the basolateral side, with no apparent intra-endothelial degradation could be the other contributors for superiority of Lf over Tf (46,47).
Tissue distribution study shows the concentration–time profile of LTG in different organs following i.v. administration (Table X). LfR has been identified in many tissues, including monocytes, lymphocytes, liver, and mammary epithelial cells, while TfR are expressed in the liver, spleen, and kidney (48,49). Figure 10 shows that LTGS displayed significantly higher accumulation in these organs as compared to the NP formulations. This reduced uptake of LTG in organs other than the site of action will contribute to the decrease in side effects of the drug (11,12). On the other hand, the entrapment of LTG in NPs reduces the exposure to free drug in systemic circulation which can significantly reduce the chances of adverse reactions (11).
Table X.
AUC(0→48) Values of Different Organs for LTGS and LTG NP Formulations
| Organ | Formulation | |||
|---|---|---|---|---|
| LTGS | LTG-NPs | Tf-LTG-NPs | Lf-LTG-NPs | |
| Liver | 231.72 ± 13.45 | 132.83 ± 6.48 | 157.33 ± 7.11 | 193.93 ± 8.34 |
| Spleen | 118.39 ± 7.65 | 115.16 ± 8.11 | 166.10 ± 8.59 | 151.63 ± 4.15 |
| Kidney | 121.58 ± 4.78 | 74.50 ± 5.34 | 90.48 ± 5.28 | 104.97 ± 6.21 |
| Lungs | 26.18 ± 1.31 | 21.42 ± 2.02 | 14.38 ± 1.37 | 14.49 ± 1.21 |
| Heart | 26.50 ± 3.12 | 17.87 ± 1.02 | 13.92 ± 0.96 | 9.38 ± 0.65 |
Values are represented as mean ± SD, n = 3
When organ distributions of NPs were compared with each other, it was observed that ligand-conjugated NPs showed higher accumulation in the liver than unconjugated NPs, which could be because of the presence of Tf (49) and Lf receptors in the liver (20). In the spleen, Tf-conjugated NPs displayed slightly higher accumulation than their Lf counterpart possibly because of modest presence of LfR against TfR. The findings were confirmed from literature citing the existence of LfR and TfR in the liver, spleen, and kidney (49,50). Similarly, LfR has been identified in many tissues, including monocytes, lymphocytes, and liver (48). Figure 11 shows images of gamma scintigraphy 2 h post-intravenous administration. The major radioactivity was seen in the liver and spleen which gradually decreases in NPs.
Fig. 11.
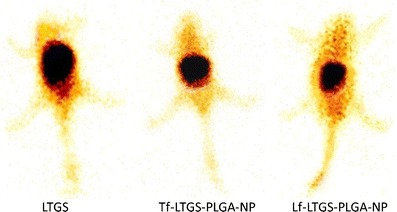
Gamma scintigraphy image 2 h post-i.v. administration of a TMDS, b Tf-TMD-PLGA-NP, and c Tf-TMD-PLGA-NP to mice
Intradermal Skin Test
The skin tests showed very little visible irritation after injection of LTG-NPs. The average score values for LTGs and LTGS were found to be 2.93 ± 0.40 and 1.20 ± 0.5, respectively. In addition, there were no immediate response (within 20 min) observed in both the formulations; however, the LTGS induced wheal formation as a result of late hypersensitivity response, while the same was absent for LTG-NPs. This is because of the property of LTG which induces severe rashes and epidermal necrosis through the activation of T lymphocytes; on the other hand, entrapment of LTG inside NPs decreases the exposure of free drugs to the skin and decreases toxicity (6).
Pharmacodynamic Evaluation
Antinociception, produced by the i.v. administration of the drug solution and different NP formulations, was tested using radiant heat method in neuropathic rats. The analgesic effect of LTG NP formulations, determined as paw withdrawal latency, at different time point is shown in Fig. 12. Conjugated NP formulation of LTG displayed significantly higher antinociceptive effect, when compared against unconjugated NPs as well drug solution (p < 0.05). Also, the antinociceptive effect of conjugated NPs was sustained for a period of 48 h. The data obtained after converting the paw withdrawal latency into %MPE for LTG-NPs is shown in Fig. 13. Tf-LTG-NPs and Lf-LTG-NPs showed MPE of 64.53% and 74.85%, respectively, after 1 h of administration, and antinociceptive effect was sustained for a period of 48 h.
Fig`. 12.
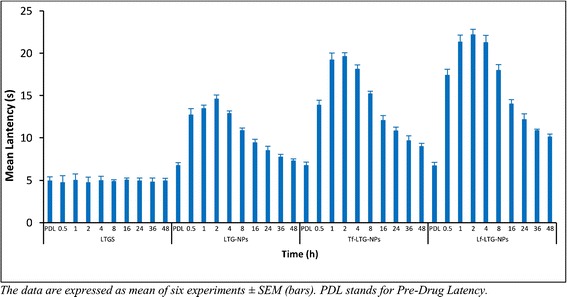
The paw withdrawal latency at different time points for LTGS, LTG-PLGA-NP, Tf-LTG-PLGA-NP, and Lf-LTG-PLGA-NP
Fig. 13.
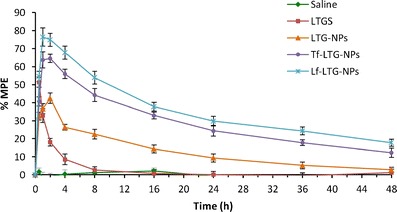
Comparison of anti-nociceptive effects of LTGS, LTG-PLGA-NP, Tf-LTG-PLGA-NP, and Lf-LTG-PLGA-NP
The study reveals the enhanced efficacy of ligand-conjugated NPs against unconjugated NPs and Lf-conjugated NPs against Tf-conjugated NPs. The improved efficacy of conjugated NP formulation shows the possibility of site-specific targeting with prolonged therapeutic response leading to dose reduction and minimized side effects. The antinociceptive effect of solution and NP formulations was in agreement with blood and brain distribution of the formulations observed in biodistribution studies.
Stability Study
The results for the stability studies are represented in Table XI. No significant change from initial characteristics was observed in PS, zeta potential, drug content, and redispersibility of protein-conjugated NPs at 5 ± 3°C after 6 M and at 25 ± 2°C/60% RH ± 5% RH after 3 M. Figure 14 shows the drug release profile for formulation after 6 M storage at 5 ± 3°C. The storage of the conjugated NPs at accelerated conditions led to a slight increase in the PS which was significant only after 6 M. The zeta potential values after 6 M at accelerated conditions were found to be decreased slightly. In addition, the NPs displayed poor redispersibility and increased polydispersity index. This could be attributed to the acidic conditions produced due to the degradation of PLGA into lactic and glycolic acid.
Table XI.
Stability Study Data of Tf-LTG-PLGA-NPs and Lf-LTG-PLGA-NPs
| Condition | Duration | Parameters evaluated | |||
|---|---|---|---|---|---|
| Redispersibilitya | PS (nm) | ZP (mV) | % drug content | ||
| – | Initial | 0 | 151.0 ± 3.8 | −12.88 ± 0.46 | 100.00 |
| 5 ± 3°C | 3 M | 0 | 152.1 ± 3.3 | −12.65 ± 1.27 | 99.62 ± 1.01 |
| 6 M | 0 | 154.3 ± 3.5 | −12.14 ± 0.36 | 99.21 ± 0.87 | |
| 25 ± 2°C/60 ± 5% RH | 1 M | 0 | 155.6 ± 4.2 | −11.89 ± 0.47 | 99.51 ± 0.85 |
| 2 M | 0 | 161.4 ± 4.9 | −11.37 ± 1.44 | 99.18 ± 1.34 | |
| 3 M | 0 | 170.8 ± 5.2 | −10.78 ± 0.35 | 98.64 ± 0.95 | |
| 6 M | 1 | 208.5 ± 3.2 | −9.24 ± 0.56 | 97.56 ± 0.74 | |
| 5 ± 3°C | 3 M | 0 | 153.4 ± 3.5 | −10.54 ± 1.26 | 99.82 ± 1.27 |
| 6 M | 0 | 156.2 ± 4.3 | −10.22 ± 0.28 | 99.34 ± 1.19 | |
| 25 ± 2°C/60 ± 5% RH | 1 M | 0 | 158.2 ± 3.2 | −10.88 ± 0.57 | 99.68 ± 1.09 |
| 2 M | 0 | 164.7 ± 6.1 | −10.17 ± 1.38 | 99.29 ± 0.52 | |
| 3 M | 0 | 166.3 ± 5.8 | −9.86 ± 0.42 | 98.77 ± 1.23 | |
| 6 M | 1 | 221.2 ± 4.3 | −8.05 ± 1.23 | 98.16 ± 0.78 | |
Values are represented as mean ± SD, n = 3
PS particle size, ZP zeta potential
a0 easy redispersibility, 1 poor redispersibility
Fig. 14.
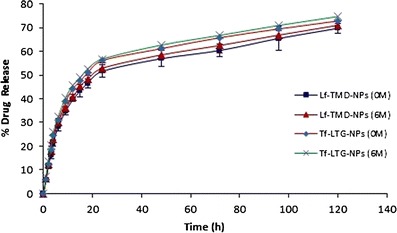
Drug release profile from Lf and Tf-conjugated nanoparticle before and after stability study
CONCLUSION
PLGA-NPs containing LTG were successfully prepared by nanoprecipitation technique and optimized by 33 factorial design. The optimized formulation was obtained using 100 mg of PLGA, 1% of PVA, and 1:2 ratio of acetone/water phase. Further, the study showed that preparation of NPs and surface functionalization using LF and Tf improve the poor pharmacokinetic profile of LTG in order to achieve brain targeting and retention with sustained release to overcome short duration due to redistribution. Lf was proved to be superior to Tf for brain targeting after intravenous administration. The low endogenous concentration, cationic charge, and unidirectional transport in case of Lf could be major reasons for enhanced uptake of Lf-conjugated nanoparticles in the brain when compared against Tf-conjugated nanoparticles. At the same time, the entrapment of LTG within the NPs ensures minimum exposure to free drug which can reduce the chances of side effects. Finally, additional in vivo studies on higher animal model in the future can confirm the findings and help in further optimization of the delivery system.
REFERENCES
- 1.Walid MS, Donahue SN, Darmohray DM, Hyer LA, Jr, Robinson JS., Jr The fifth vital sign—what does it mean? Pain Pract Off J World Inst Pain. 2008;8(6):417–22. doi: 10.1111/j.1533-2500.2008.00222.x. [DOI] [PubMed] [Google Scholar]
- 2.Colombo B, Annovazzi PO, Comi G. Medications for neuropathic pain: current trends. Neurol Sci Off J Ital Neurol Soc Ital Soc Clin Neurophysiol. 2006;27(Suppl 2):S183–9. doi: 10.1007/s10072-006-0598-7. [DOI] [PubMed] [Google Scholar]
- 3.Nitu AN, Wallihan R, Skljarevski V, Ramadan NM. Emerging trends in the pharmacotherapy of chronic pain. Expert Opin Investig Drugs. 2003;12(4):545–59. doi: 10.1517/13543784.12.4.545. [DOI] [PubMed] [Google Scholar]
- 4.Benyamin R, Trescot AM, Datta S, Buenaventura R, Adlaka R, Sehgal N, et al. Opioid complications and side effects. Pain Phys. 2008;11(2 Suppl):S105–20. [PubMed] [Google Scholar]
- 5.Eisenberg E, Shifrin A, Krivoy N. Lamotrigine for neuropathic pain. Expert Rev Neurother. 2005;5(6):729–35. doi: 10.1586/14737175.5.6.729. [DOI] [PubMed] [Google Scholar]
- 6.Sachs B, Ronnau AC, Ruzicka T, Gleichmann E, Schuppe H-C. Lamotrigine and toxic epidermal necrolysis. Lancet. 1996;348(9041):1597. doi: 10.1016/S0140-6736(05)66227-7. [DOI] [PubMed] [Google Scholar]
- 7.Castel-Branco M, Lebre V, Falcao A, Figueiredo I, Caramona M. Relationship between plasma and brain levels and the anticonvulsant effect of lamotrigine in rats. Eur J Pharmacol. 2003;482(1–3):163–8. doi: 10.1016/j.ejphar.2003.09.065. [DOI] [PubMed] [Google Scholar]
- 8.Walker MC, Tong X, Perry H, Alavijeh MS, Patsalos PN. Comparison of serum, cerebrospinal fluid and brain extracellular fluid pharmacokinetics of lamotrigine. Br J Pharmacol. 2000;130(2):242–8. doi: 10.1038/sj.bjp.0703337. [DOI] [PMC free article] [PubMed] [Google Scholar]
- 9.Loscher W, Ganter M, Fassbender CP. Correlation between drug and metabolite concentrations in plasma and anesthetic action of ketamine in swine. Am J Vet Res. 1990;51(3):391–8. [PubMed] [Google Scholar]
- 10.Fielding RM, Smith PC, Wang LH, Porter J, Guo LS. Comparative pharmacokinetics of amphotericin B after administration of a novel colloidal delivery system, ABCD, and a conventional formulation to rats. Antimicrob Agents Chemother. 1991;35(6):1208–13. doi: 10.1128/AAC.35.6.1208. [DOI] [PMC free article] [PubMed] [Google Scholar]
- 11.De Jong WH, Borm PJ. Drug delivery and nanoparticles: applications and hazards. Int J Nanomedicine. 2008;3(2):133–49. doi: 10.2147/IJN.S596. [DOI] [PMC free article] [PubMed] [Google Scholar]
- 12.Xie Y, Bagby TR, Cohen MS, Forrest ML. Drug delivery to the lymphatic system: importance in future cancer diagnosis and therapies. Expert Opin Drug Deliv. 2009;6(8):785–92. doi: 10.1517/17425240903085128. [DOI] [PMC free article] [PubMed] [Google Scholar]
- 13.Bala I, Hariharan S, Kumar MN. PLGA nanoparticles in drug delivery: the state of the art. Crit Rev Ther Drug Carrier Syst. 2004;21(5):387–422. doi: 10.1615/CritRevTherDrugCarrierSyst.v21.i5.20. [DOI] [PubMed] [Google Scholar]
- 14.Kreuter J. Nanoparticulate systems for brain delivery of drugs. Adv Drug Deliv Rev. 2001;47(1):65–81. doi: 10.1016/S0169-409X(00)00122-8. [DOI] [PubMed] [Google Scholar]
- 15.Misra A, Ganesh S, Shahiwala A, Shah SP. Drug delivery to the central nervous system: a review. J Pharm Pharm Sci Publ Can Soc Pharm Sci Soc Can Sci Pharm. 2003;6(2):252–73. [PubMed] [Google Scholar]
- 16.Begley DJ. The blood–brain barrier: principles for targeting peptides and drugs to the central nervous system. J Pharm Pharmacol. 1996;48(2):136–46. doi: 10.1111/j.2042-7158.1996.tb07112.x. [DOI] [PubMed] [Google Scholar]
- 17.Su Y, Sinko PJ. Drug delivery across the blood–brain barrier: why is it difficult? How to measure and improve it? Expert Opin Drug Deliv. 2006;3(3):419–35. doi: 10.1517/17425247.3.3.419. [DOI] [PubMed] [Google Scholar]
- 18.Smith MW, Gumbleton M. Endocytosis at the blood–brain barrier: from basic understanding to drug delivery strategies. J Drug Target. 2006;14(4):191–214. doi: 10.1080/10611860600650086. [DOI] [PubMed] [Google Scholar]
- 19.Jefferies WA, Brandon MR, Hunt SV, Williams AF, Gatter KC, Mason DY. Transferrin receptor on endothelium of brain capillaries. Nature. 1984;312(5990):162–3. doi: 10.1038/312162a0. [DOI] [PubMed] [Google Scholar]
- 20.Fillebeen C, Descamps L, Dehouck MP, Fenart L, Benaissa M, Spik G, et al. Receptor-mediated transcytosis of lactoferrin through the blood–brain barrier. J Biol Chem. 1999;274(11):7011–7. doi: 10.1074/jbc.274.11.7011. [DOI] [PubMed] [Google Scholar]
- 21.Hu K, Li J, Shen Y, Lu W, Gao X, Zhang Q, et al. Lactoferrin-conjugated PEG-PLA nanoparticles with improved brain delivery: in vitro and in vivo evaluations. J Control Release Off J Control Release Soc. 2009;134(1):55–61. doi: 10.1016/j.jconrel.2008.10.016. [DOI] [PubMed] [Google Scholar]
- 22.Huang R, Ke W, Han L, Liu Y, Shao K, Jiang C, et al. Lactoferrin-modified nanoparticles could mediate efficient gene delivery to the brain in vivo. Brain Res Bull. 2010;81(6):600–4. doi: 10.1016/j.brainresbull.2009.12.008. [DOI] [PubMed] [Google Scholar]
- 23.Fessi H, Puisieux F, Devissaguet JP, Ammoury N, Benita S. Nanocapsule formation by interfacial polymer deposition following solvent displacement. Int J Pharm. 1989;55(1):R1–4. doi: 10.1016/0378-5173(89)90281-0. [DOI] [Google Scholar]
- 24.Lalani J, Raichandani Y, Mathur R, Lalan M, Chutani K, Mishra AK, et al. Comparative receptor based brain delivery of tramadol-loaded poly(lactic-co-glycolic acid) nanoparticles. J Biomed Nanotechnol. 2012;8(6):918–27. doi: 10.1166/jbn.2012.1462. [DOI] [PubMed] [Google Scholar]
- 25.Huang YB, Tsai YH, Lee SH, Chang JS, Wu PC. Optimization of pH-independent release of nicardipine hydrochloride extended-release matrix tablets using response surface methodology. Int J Pharm. 2005;289(1–2):87–95. doi: 10.1016/j.ijpharm.2004.10.021. [DOI] [PubMed] [Google Scholar]
- 26.Akhnazarova S, Kafarov V. Experiment optimization in chemistry and chemical engineering. 1982.
- 27.Derringer G, Suich R. Simultaneous-optimization of several response variables. J Qual Technol. 1980;12(4):214–9. [Google Scholar]
- 28.Sahoo SK, Labhasetwar V. Enhanced antiproliferative activity of transferrin-conjugated paclitaxel-loaded nanoparticles is mediated via sustained intracellular drug retention. Mol Pharm. 2005;2(5):373–83. doi: 10.1021/mp050032z. [DOI] [PubMed] [Google Scholar]
- 29.Olivier JC, Huertas R, Lee HJ, Calon F, Pardridge WM. Synthesis of pegylated immunonanoparticles. Pharm Res. 2002;19(8):1137–43. doi: 10.1023/A:1019842024814. [DOI] [PubMed] [Google Scholar]
- 30.Joshi DP, Lan-Chun-Fung YL, Pritchard JG. Determination of poly(vinyl alcohol) via its complex with boric acid and iodine. Anal Chim Acta. 1979;104(1):153–60. doi: 10.1016/S0003-2670(01)83825-3. [DOI] [Google Scholar]
- 31.Babbar A, Kashyap R, Chauhan UP. A convenient method for the preparation of 99mTc-labelled pentavalent DMSA and its evaluation as a tumour imaging agent. J Nucl Biol Med (Turin, Italy : 1991) 1991;35(2):100–4. [PubMed] [Google Scholar]
- 32.Theobald AE. Textbook of radiopharmacy: theory and practice. Gordon and Breach Science Publishers; 1994.
- 33.Saha GB, Go RT, MacIntyre WJ. Radiopharmaceuticals for cardiovascular imaging. Int J Radiat Appl Instrum B Nucl Med Biol. 1992;19(1):1–20. doi: 10.1016/0883-2897(92)90179-3. [DOI] [PubMed] [Google Scholar]
- 34.Saha GB, MacIntyre WJ, Go RT. Radiopharmaceuticals for brain imaging. Semin Nucl Med. 1994;24(4):324–49. doi: 10.1016/S0001-2998(05)80022-4. [DOI] [PubMed] [Google Scholar]
- 35.Hatakeyama H, Akita H, Maruyama K, Suhara T, Harashima H. Factors governing the in vivo tissue uptake of transferrin-coupled polyethylene glycol liposomes in vivo. Int J Pharm. 2004;281(1–2):25–33. doi: 10.1016/j.ijpharm.2004.05.025. [DOI] [PubMed] [Google Scholar]
- 36.ISO 10993-10:2010 Biological evaluation of medical devices—part 10: tests for irritation and skin sensitization ISO. 2010.
- 37.Proust B, Astier C, Renaudin JM, Magueur E, Maurice D, Belcourt C, et al. A murine model of cow’s milk protein-induced allergic reaction: use for safety assessment of hidden milk allergens. Eur Ann Allergy Clin Immunol. 2009;41(3):85–94. [PubMed] [Google Scholar]
- 38.Seltzer Z, Dubner R, Shir Y. A novel behavioral model of neuropathic pain disorders produced in rats by partial sciatic nerve injury. Pain. 1990;43(2):205–18. doi: 10.1016/0304-3959(90)91074-S. [DOI] [PubMed] [Google Scholar]
- 39.Hargreaves K, Dubner R, Brown F, Flores C, Joris J. A new and sensitive method for measuring thermal nociception in cutaneous hyperalgesia. Pain. 1988;32(1):77–88. doi: 10.1016/0304-3959(88)90026-7. [DOI] [PubMed] [Google Scholar]
- 40.Manoocheheri S, Darvishi B, Kamalinia G, Amini M, Fallah M, Ostad SN, et al. Surface modification of PLGA nanoparticles via human serum albumin conjugation for controlled delivery of docetaxel. Daru J Fac Pharm Tehran Univ Med Sci. 2013;21(1):58. doi: 10.1186/2008-2231-21-58. [DOI] [PMC free article] [PubMed] [Google Scholar]
- 41.Sahoo SK, Panyam J, Prabha S, Labhasetwar V. Residual polyvinyl alcohol associated with poly (D,L-lactide-co-glycolide) nanoparticles affects their physical properties and cellular uptake. J Control Release Off J Control Release Soc. 2002;82(1):105–14. doi: 10.1016/S0168-3659(02)00127-X. [DOI] [PubMed] [Google Scholar]
- 42.Desai N. Challenges in development of nanoparticle-based therapeutics. AAPS J. 2012;14(2):282–95. doi: 10.1208/s12248-012-9339-4. [DOI] [PMC free article] [PubMed] [Google Scholar]
- 43.Feng SS. Nanoparticles of biodegradable polymers for new-concept chemotherapy. Expert Rev Med Devices. 2004;1(1):115–25. doi: 10.1586/17434440.1.1.115. [DOI] [PubMed] [Google Scholar]
- 44.Gabrielsson J, Weiner D. Pharmacokinetic and pharmacodynamic data analysis: concepts and applications. CRC Press; 2001.
- 45.Talukder MJ, Takeuchi T, Harada E. Receptor-mediated transport of lactoferrin into the cerebrospinal fluid via plasma in young calves. J Vet Med Sci Jpn Soc Vet Sci. 2003;65(9):957–64. doi: 10.1292/jvms.65.957. [DOI] [PubMed] [Google Scholar]
- 46.Chang J, Jallouli Y, Kroubi M, Yuan XB, Feng W, Kang CS, et al. Characterization of endocytosis of transferrin-coated PLGA nanoparticles by the blood–brain barrier. Int J Pharm. 2009;379(2):285–92. doi: 10.1016/j.ijpharm.2009.04.035. [DOI] [PubMed] [Google Scholar]
- 47.Broadwell RD, Baker-Cairns BJ, Friden PM, Oliver C, Villegas JC. Transcytosis of protein through the mammalian cerebral epithelium and endothelium. III. Receptor-mediated transcytosis through the blood–brain barrier of blood-borne transferrin and antibody against the transferrin receptor. Exp Neurol. 1996;142(1):47–65. doi: 10.1006/exnr.1996.0178. [DOI] [PubMed] [Google Scholar]
- 48.Suzuki YA, Lonnerdal B. Characterization of mammalian receptors for lactoferrin. Biochem Cell Biol Biochim Biol Cell. 2002;80(1):75–80. doi: 10.1139/o01-228. [DOI] [PubMed] [Google Scholar]
- 49.Kawabata H, Germain RS, Ikezoe T, Tong X, Green EM, Gombart AF, et al. Regulation of expression of murine transferrin receptor 2. Blood. 2001;98(6):1949–54. doi: 10.1182/blood.V98.6.1949. [DOI] [PubMed] [Google Scholar]
- 50.Fleming RE, Migas MC, Holden CC, Waheed A, Britton RS, Tomatsu S, et al. Transferrin receptor 2: continued expression in mouse liver in the face of iron overload and in hereditary hemochromatosis. Proc Natl Acad Sci U S A. 2000;97(5):2214–9. doi: 10.1073/pnas.040548097. [DOI] [PMC free article] [PubMed] [Google Scholar]