Abstract
Free-flowing proniosomal powders of acemetacin (AC) were prepared using the slurry method and maltodextrin as carrier. Positively charged proniosomes composed of 70:20:10 of Span 60/cholesterol (Chol)/stearylamine (SA), respectively, were successively compressed into tablets using direct compression method. The tablets were characterized for weight variability, friability, hardness, drug content uniformity, and dissolution properties. The in vivo evaluation of the prepared proniosomes (powder or tablet forms) after oral administration was investigated by the determination of AC and its active metabolite indomethacin (IND) in the blood of albino rabbits. Results indicated that the increase of Chol from 10% to 20% markedly reduced the efflux of the drug. Further Chol addition from 30% to 50% led to increased AC release rates. The proniosome tablets of AC showed greater hardness and disintegration time and less friability than AC plain tablets. The dissolution of proniosomal tablets indicated a lower drug release percentage compared to powdered proniosomes and AC plain tablets. The mean pharmacokinetic parameters of AC and IND from different formulations indicated increased t1/2 and area under the curve (AUC) of both AC and IND for proniosomal tablets compared with both proniosomal powders and AC plain tablets. This study suggested the formulation of AC proniosomal powder into tablets to control and extend its pharmacologic effects.
KEY WORDS: acemetacin, proniosomes, sustained-release tablet, pharmacokinetics
INTRODUCTION
The use of phospholipid vesicles (liposomes) as drug carriers has several disadvantages due to physical instability and oxidative or hydrolysis degradation of the phospholipids (1,2). This pharmaceutical problem requires special handling and storage conditions, which increase the cost and make it impossible to scale up and manufacture liposomal formulations except for highly important drugs used in tumor targeting (3). On the other hand, nonionic surfactant vesicles “niosomes” offer high chemical stability and improved drug bioavailability via several routes of administration. Niosomal technology is believed to improve drug solubility, enhance drug permeability by their adhesive and surface-active properties, and protect the drug against gastrointestinal enzymatic degradation probabilities (4). Unlike liposomes, niosomal vesicles can survive the gastrointestinal acidic, bile, and enzymatic conditions (5). However, niosomal dispersion also suffers physical instability such as vesicle aggregations, fusion, size changes, and drug leaks to the outside buffer medium. A possible solution for the defect in physical stability is the proniosome strategy. Proniosomes are anhydrous free-flowing formulations of water-soluble carrier coated with the suitable noisome-forming surfactants. They are easily reconstituted with water to form niosomal vesicles (6–8). The dry niosomes “proniosomes” offer the additional convenience of transportation, distribution, storage, and dosing (8). Additionally, to improve proniosomal handling, stability, and adjustment of the drug dosage, processing of the proniosomal powder into tablets is promising from industrial and pharmaceutical point of view.
Acemetacin (AC) “Emflex®” is a glycolic acid ester of indomethacin (IND) “nonsteroidal anti-inflammatory drug” that may inhibit prostaglandin synthesis and produce anti-inflammatory, analgesic, and antipyretic effects. The drug is practically insoluble in water. Its pharmacological activity is due to both AC and its major metabolite, indomethacin. It is indicated for the treatment of rheumatoid arthritis, osteoarthritis, low back pain, acute gout, dysmenorrhea, toothache, and postoperative pain. The daily doses of AC are 120 to 180 mg by mouth in divided doses. AC is eliminated through hepatic and renal routes, although pharmacokinetic parameters are not affected by moderate renal or hepatic impairment and appear to be unchanged in the elderly.
The aim of the present work was to prepare, characterize, and evaluate AC proniosomes prepared by the slurry method in both powdered and tablet formulations. The pharmacokinetic properties of the proniosomal formulations will be tested following oral administration to rabbits as model animals.
MATERIALS AND METHODS
Materials
Acemetacin and indomethacin were a gift sample kindly supplied by Delta Pharma, Egypt. Sorbitan monostearate (Span 60), cholesterol (Chol), dicetylphosphate (DCP), and stearylamine (SA) were purchased from Sigma Chemical Co., St. Louis, MO, USA. Diethyl ether was purchased from S.D. Fine Chem. Ltd. (India). Maltodextrin and Avicel® were gift samples kindly supplied by the Egyptian International Pharmaceutical Industries Co., EPICO, Egypt. Chloroform and all other chemicals were obtained from El-Nasr Pharmaceutical Chemical Co., Cairo, Egypt.
Methods
Preparation of Proniosomes
The slurry method is selected for the preparation of proniosome powder using maltodextrin as a carrier. The lipid mixture (250 μmol), either neutral, positively charged, or negatively charged, and AC (60 mg) were dissolved in a chloroform/diethyl ether mixture (1:1 v/v). The resultant solution is added to a 100-ml round-bottom flask containing the maltodextrin carrier (maltodextrin/surfactant, 1:1). Additional chloroform/diethylether mixture was added to form slurry. A rotary evaporator at reduced pressure was used to evaporate the solvent at 70 rpm and temperature of 60°C ± 2°C until the mass in the flask become dry and free-flowing product (9). The resulting proniosomal powder was further dried under vacuum in a desiccator at room temperature overnight. The resulting proniosome powders were stored in tightly closed containers in a refrigerator (4°C) and were used for the preparation of proniosome-derived niosomes and for further evaluation and study on powder properties. Proniosomes were prepared with different micromolar ratios of Span 60 and Chol such as 225:25, 200:50, 175:75, 150:100, and 125:125, respectively, while drug loading (60 mg) was kept constant.
Measurement of Angle of Repose
Flow properties of the proniosomes were evaluated by determining the angle of repose. The angle of repose of the dried proniosome powders and the carrier maltodextrin was determined according to the fixed funnel and cone method (10). A funnel was set perpendicular to the axis of symmetry at a given height (5 cm) above a graph paper placed on horizontal surface. The proniosomal powder was poured carefully through the funnel until the apex of conical pile just reached the tip of the funnel (11). Thus; with r being the radius of the base of the conical pile, the angle of repose was calculated using the following equation:
Where θ is the angle of repose, L is the height of the conical pile, and r is the radius of conical pile.
Microscopic Examination
Small proportions of the proniosome powders and niosomal suspension were spread on a glass slide and examined for the proniosomal and niosomal structure and the presence of drug crystals using light microscopy with magnification power of ×40. Photomicrographs were taken for different formulations using a Fujifilm digital camera.
Preparation of Niosomes from Proniosomes
The prepared niosomal suspensions were obtained by the hydration of the proniosomal powder with 5 ml phosphate buffered solution (PBS) pH 7.4 at 80°C ± 1°C using a vortex mixer for 2 min (12). The resulting niosomal dispersion was used for the determination of the entrapment efficiency and morphological study.
Determination of AC Entrapment Efficiency in Proniosome-Derived Niosomes
Entrapment efficiency of drug in proniosome-derived niosomes can be done by freeze thawing/centrifugation method (13). Frozen samples (1 ml each at −20°C) of niosomes prepared from proniosomes as described above were let to thaw at room temperature. The obtained niosomal dispersions were centrifuged at 14,000 rpm for 40 min at 4°C. Niosomal pellets were separated and reconstituted in PBS (pH 7.4), then centrifuged again to wash the un-entrapped free AC. The washing procedure was repeated twice to ensure the absence of the un-entrapped drug in the niosomal dispersion. The supernatants were collected each time and prepared for the UV assay of the free drug concentrations. The drug content was determined spectrophotometrically at 320 nm using PBS (pH 7.4) as a blank. Each result was recorded as the mean of three determinations (±SD). The entrapment efficiency was defined as the percentage ratio of the entrapped drug concentration to the total drug concentration and calculated according to the following equation:
AC In Vitro Release from Proniosome-Derived Niosomes
The in vitro release of AC from proniosome-derived niosomes was estimated by a simple dialysis method. An accurate volume of AC niosomes, equivalent to 60 mg AC, was placed into a glass tube to which a cellophane membrane (MWCO 2000–15,000) was attached to one side, and the tube was suspended in a 250-ml beaker containing 100 ml PBS (pH 7.4). The solution was maintained at 37°C ± 0.5°C and stirred at 100 rpm in a thermostatically controlled water bath shaker. At different time intervals for 24 h, 2 ml samples were withdrawn from the receptor compartment and replaced with equal volume of fresh PBS (pH 7.4) at the same temperature (37°C ± 0.5°C) to keep the volume of the solution constant during the experiment (14). The samples were analyzed spectrophotometrically at 320 nm against PBS (pH 7.4) as a blank; the results were the mean values of three runs.
Tablet Manufacture
Proniosomal tablets were prepared from proniosomal powders of AC according to the following formula which used to prepare 20 tablets each containing 60 mg of AC and the average weight of each tablet was 300 mg:
On the other hand, plain tablets of AC (60 mg/tablet) were prepared by direct compression method using 1.2 g AC/4.8 g Avicel® mixture. Compression was performed on a single-punch tablet machine (Korsch Frogerais, type AO, Berlin, Germany) equipped with flat-faced 10-mm punches.
Evaluation of Tablet (15)
Tablet Weight Variation
Tablets from each batch (20 tablets) were randomly selected for the test of average weight, and the standard deviation (SD) of the 20 tablets was calculated.
Tablet Thickness
The tablet thickness was evaluated using a Pfizer hardness tester. A number of 20 tablets were selected randomly from each batch and the thickness was determined.
Tablet Hardness
The tablet hardness was determined accurately using a Pfizer hardness tester. Twenty tablets were selected randomly from each batch and the tablet hardness was measured in kilogram per square centimeter.
Friability
Ten tablets were weighed and placed in the Roche friabilator, and apparatus was rotated at 25 rpm for 4 min. After revolution, the tablets were de-dusted and weighed to check the variation.
Drug Content Uniformity
Twenty tablets were selected randomly, weighed, and powdered. A quantity of powdered tablet equal to 100 mg was dissolved in PBS pH 7.4 in a 100-ml volumetric flask. Samples were filtered and diluted and the absorbance was measured at 320 nm against PBS (pH 7.4) as a blank and the percent drug content was estimated.
Disintegration Time
Tablets were reciprocated in the disintegration apparatus using pH 1.2 at 37°C as the immersion liquid.
In Vitro Release of AC from Proniosome Tablet in Comparison to Proniosome Powders
AC release from the tablets and proniosome powders was evaluated using the USP XXIII tablet dissolution test apparatus-I (rotating basket) at a rotation speed of 50 rpm maintained at 37.0°C ± 0.5°C. The release study was performed in 500 ml HCl buffer (pH 1.2) for 2 h, changed to PBS (pH 7.4) till the end of the 24 h to simulate the pHs pertaining to the stomach and small intestine, respectively (16). Measured amount of proniosome powder equivalent to 60 mg and one tablet were placed in each basket and immersed in the dissolution medium. Samples of 2 ml were withdrawn at specified time intervals of 0, 0.25, 0.5, 1, 2, 2.25, 2.5, 3, 4, 5, 6, 8, and 24 h and the volume was compensated to the initial volume by adding fresh dissolution medium after each sampling. The collected samples were filtered and analyzed spectrophotometrically at 320 nm. The experiment was carried out in triplicate and the data of in vitro release were expressed as mean ± SD.
In Vivo Study
Study Design
Male rabbits (weighing 1.5–2 kg) were used for the bioavailability study. Animals were housed in the standardized conditions at the animal house of the Faculty of Pharmacy, Zagazig University, Egypt. All animals were acclimatized and kept under constant temperature (25°C ± 2°C). All animal procedures were performed in accordance to the approved protocol for use of experimental animals set by the standing committee on animal care of the Faculty of Pharmacy, Zagazig University, Egypt. Animals were divided into three groups of three rabbits in each group. The study was designed as a single oral dose. All groups received an equivalent of 30 mg AC/kg body weight of rabbits (17). Group 1 received AC plain tablets, group 2 received AC proniosomal powders (the best formulation that exhibited the maximum EE% and the slowest release rate), and group 3 received AC proniosomal tablets. Blood samples (about 1 ml) were withdrawn from the sinus orbital into heparinized tubes at 0, 0.5, 1, 2, 3, 4, 6, 8, and 24 h after each administration. The blood samples were centrifuged immediately at 3000 rpm for 10 min to obtain the plasma samples and were stored at −20°C for subsequent assay.
High-Performance Liquid Chromatography Analysis
Determination of AC and its active metabolite in the plasma was done by reverse-phase high-performance liquid chromatography (HPLC) with ultraviolet detection method reported by Chávez-Piña et al. (17) with some modifications. In brief, plasma (100 μl) was spiked with carbamazepine (10 μl of 30 μg/ml internal standard) and methanol (1.1 ml) was added. The extraction was carried out by vortex agitation at maximum speed for 1 min followed by centrifugation of the samples at 3000 rpm for 15 min. A 20 μl amount of aliquots of the supernatant was injected into the HPLC system. The HPLC system consisted of a Nova-Pak C18 column (150 × 3.9 mm ID, particle size 4 μm, Waters Assoc., Milford, MA, USA) eluted with a mobile phase consisting of a mixture of 0.025 M PBS (pH 6.0) with methanol, 45:55 v/v at a constant flow of 1.0 ml/min at room temperature. The effluent from the column was monitored spectrophotometrically at 260 nm. Retention times were 3.594, 6.732, and 8.094 min for the internal standard, IND, and AC, respectively (Fig. 1). It can be clearly appreciated that there were no peaks due to endogenous compounds that could interfere with the assay. AC and IND recovery from plasma samples, as established by comparison with standard solutions, was 85%–95%. Calibration curves were constructed for AC and IND in the 5–100 μg/ml range, being linear (r2 > 0.98) for both compounds. Accuracy and precision of the assay, determined by replicate analysis of spiked plasma samples of known concentration, was within the 100% ± 15% range.
Fig. 1.
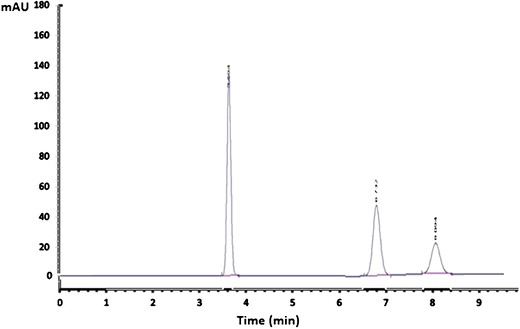
HPLC chromatogram of carbamazepine “internal standard”, IND, and AC showing the retention times at 3.594, 6.732, and 8.094 min, respectively
Data Analysis
The pharmacokinetic parameters were calculated from the plasma drug level data obtained for the individual rabbit per each group and were presented as mean ± SD. The pharmacokinetic parameters including the maximum plasma concentration (Cmax, ng/ml), the time required to reach maximum plasma concentration (Tmax, h), the area under the plasma concentration–time curve from time 0 to 24 h (area under the curve (AUC)0–24, ng/ml/h), the area under the plasma concentration–time curve from time 0 to ∞ h (AUC0–∞, ng/ml/h), the elimination rate constant (Kel, h), and the elimination half life (t1/2, h) were calculated using EquivTest pharmacokinetic parameters software.
Statistical Analysis
A one-way analysis of variance (ANOVA) followed by the least significant difference (LSD) as a post hoc test was applied, using SPSS program version 9 software. The differences were considered significant if P < 0.05.
RESULTS AND DISCUSSION
Preparation of Proniosomes
Dried proniosomal formulations of AC were successfully prepared using Span 60 with and without Chol. Charging lipids were also included to prepare either positively charged (using stearylamine) or negatively charged proniosomes (using dicetylphosphate). Proniosomal formulations were easily and directly forming niosomal vesicles upon hydration using hot water (55°C–60°C). Niosomes appeared to be multilamellar in morphology and drug crystals were shown using ordinary microscope at magnification power of ×40 (Fig. 2).
Fig. 2.
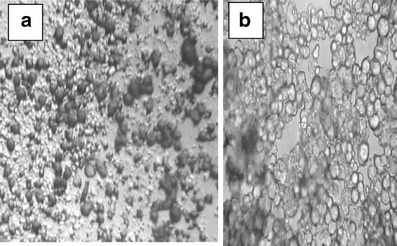
Optical photomicrograph (×40) of proniosomal AC moist powder (a) and niosomal AC after hydration of the powdered proniosomes by hot distilled water (b)
Evaluation of Proniosome
Angle of Repose Measurement
The proniosomal powder angle of repose was found to be lower than that of pure carrier powder “maltodextrin” (Table I). In addition, when the amount of maltodextrin in the formulation was increased, the angle of repose of proniosomal powder was also increased (18). Hence, the results indicated that the flowability of proniosomal powders is equal to or better than that of pure maltodextrin powder and further processing of powdered proniosomes could be straightforward.
Table I.
Angle of Repose of Maltodextrin and Proniosomal Formulations
| Formulation | Angle of repose (Degrees) |
|---|---|
| Maltodextrin | 45.86° ± 0.64° |
| Span 60 proniosomes | 36.66° ± 0.90° |
| Span 60 proniosomesa | 38.89° ± 0.83° |
aMass of maltodextrin was doubled, but the mass of surfactant was kept constant. Each result is the mean of three determinations ± SD
Entrapment Efficiency
The AC entrapment efficiency was high as a result of its poor water solubility and expected dissolve in the lipid bilayers of niosomal vesicles (Table II). Neutral niosomes showed about 69.57% AC entrapment which increased by Chol addition to 75.75% at a Chol concentration of 20%. It was extensively reported that Chol can improve the bilayer rigidity and can fill defects and gaps on the niosomal membranes, which in turn decrease the drug leakage and increased its entrapment efficiency (19). Here, the case at which further increase in Chol content had decreased the entrapment efficiency of AC (the lipid-soluble drug) to about 67.44% when Chol content was 50%. The result could be due to the Chol–AC competition for packing in the limited sites in the bilayer structure of niosomes (20). Better drug entrapment efficiencies could be obtained using SA as positively charging lipid. The best AC entrapment efficiency of 85.94% was obtained at a Span 60/Chol/SA ratio of 70:20:10, respectively. The result might be due to the free carboxylic group in AC which imparts a negative charge to the drug and improves the drug SA interaction in the lipid bilayer to form the lipophilic ion pair that increased the AC entrapment efficiency (21). Conversely, AC could compete with DCP for packing in the bilayer structure as they carry the same charge (22). Hence, AC entrapment showed a lower value (74.09%) in niosomes of a Span 60/Chol/DCP ratio of 70:20:10 when compared with niosomal vesicles of the same Chol content (75.75%).
Table II.
Entrapment Efficiency of Different Formulations
| Formulation | Entrapment efficiency % |
|---|---|
| Span 60 (100:0) | 69.57 ± 2.10 |
| Span 60/Chol (90:10) | 73.09 ± 1.57 |
| Span 60/Chol (80:20) | 75.75 ± 2.22 |
| Span 60/Chol (70:30) | 72.15 ± 1.52 |
| Span 60/Chol (60:40) | 68.79 ± 1.74 |
| Span 60/Chol (50:50) | 67.44 ± 1.76 |
| Span 60/Chol/SA (70:20:10) | 85.94 ± 1.13 |
| Span 60/Chol/DCP (70:20:10) | 74.09 ± 1.84 |
| Span 60/Chol/SA (77.5:20:2.5) | 81.27 ± 0.97 |
| Span 60/Chol/SA (75:20:5) | 82.97 ± 1.29 |
| Span 60/Chol/SA (65:20:15) | 81.53 ± 2.22 |
Span 60 sorbitan monostearate, Chol cholesterol, DCP dicetylphosphate, SA stearylamine
In Vitro Release of Acemtacin from Proniosome-Derived Niosome
From Fig. 3 of in vitro release of AC, all niosomal vesicles appeared to be of slower release percentages than that obtained from free drug. Therefore, it was noticed that there is an efficiency of the proniosomal preparations in slowing down the rate of release of the drug compared with the free drug, which released about 95% within 2 h.
Fig. 3.
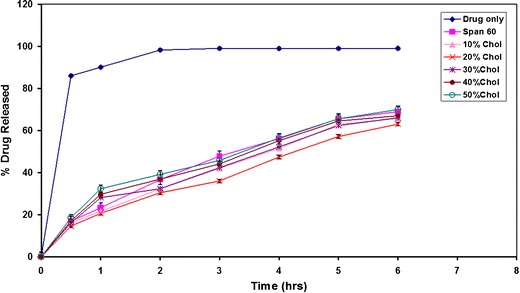
Effect of Chol concentration on the in vitro release of AC from Span 60 proniosome-derived niosomes
It is obvious that the increase of Chol molar ratio from 10% to 20% markedly reduced the efflux of the drug in comparison with proniosome-derived noisome composed only of surfactant which is due to the membrane stabilization caused by Chol (23). The gel-to-liquid phase transition of niosomal systems is abolished by the effect of Chol incorporation resulting in rigid vesicles. These vesicles at certain Chol percent are well known as less leaky to the encapsulated drugs (24). However, a further increase of the Chol molar ratio from 30% to 50% starts disrupting the regular linear bilayer structure of the vesicular membrane leading to loss of the entrapped drug.
The release profiles of AC from neutral and charged proniosomal formulations showed that negatively charged proniosomes showed the greatest rate of AC release, followed by niosomes with neutral charges on the membrane, and finally the positively charged ones (Fig. 4). The electrostatic attraction forces existing between the acid moiety of AC and the amine moiety of the SA could explain the previous order of drug release. Additionally, the charging lipids may serve to tighten the drug packaging of the bilayer structure (25), resulting in a decreased rate of drug release from charged proniosomes. However, the electrostatic repulsion that may occur between AC and DCP (negatively charging lipid) in the noisome bilayers could result in a greater percentage of AC release. Statistical analysis of data revealed that differences are significant at (P < 0.05). The results are in accordance to those of Guinedi et al. (26) and Abdallah et al. (27) who reported that positively charged niosomes of piroxicam showed the lowest rate and extent of drug release and drug entrapment levels and an increase in the percentage of drug released. The proniosomal formulation composed of Span 60/Chol molar ratio of 8:2 is advantageous for further investigations and was the most stable among other tested neutral formulations. Chol could produce an optimum hydrophobicity in this molar ratio that decreases the transient hydrophilic holes existing in the bilayer structure, by increasing the vesicular membrane rigidity (28). However, positively charged niosomal vesicles were found more stable when compared to the neutral one of Span 60/Chol ratio of 8:2 (Fig. 4). Hence, a positively charged proniosomal formulation of Span 60/Chol/SA ratio of 70:20:10 was chosen for further tablet processing and pharmacokinetic evaluation.
Fig. 4.
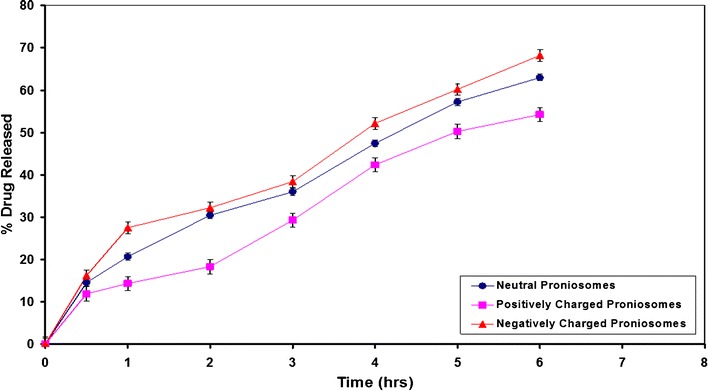
Effect of charged lipid on the in vitro release of AC from Span 60 proniosomes derived niosomes
Tablet Evaluation
The tablets were prepared by direct compression method using an 8-mm punch. The prepared tablets were subject to several evaluations such as weight variation, thickness, hardness, friability, drug content, disintegration time, and dissolution properties. All formulations successfully passed the evaluation tests and showed comparable results (Table III). The thickness was found to be 2.92 and 3.31 mm for AC plain tablets and AC proniosome-loaded tablets, respectively. Hardness was found to be 4.61 and 8.21 kg/cm2 for AC plain tablets and AC proniosome-loaded tablets, respectively. The increased hardness of the AC proniosome-loaded tablets could be ascribed to the fatty nature of the ingredients of proniosomes that resulted in strong adhesive bonds between tablet excipients. That fatty nature of proniosomal powder produced a lubricating effect to tablet machine where no lubricant was needed in the proniosomal tablet formulation. In all formulations, the friability was less than 1%. The average weight was found to be 300.4 and 298.9 mg for AC plain tablets and AC proniosome-loaded tablets, respectively. The disintegration time was found to be 10.15 and 45.65 min for AC plain tablets and AC proniosome-loaded tablets, respectively. The 4.5-fold increase in the disintegration time of AC proniosome-loaded tablet could be ascribed to their greater hardness value.
Table III.
Physical Characters of AC Plain Tablet and AC Proniosome-Loaded Tablet
| Formula | Weight (mg) ± SD | Thickness (mm) ± SD | Diameter (mm) ± SD | Hardness (kg/cm2) ± SD | Friability (%) ± SD | Drug content (mg) ± SD | Disintegration time (min) ± SD |
|---|---|---|---|---|---|---|---|
| AC plain tablet | 300.4 ± 1.2 | 2.92 ± 0.13 | 10.03 ± 0.01 | 4.61 ± 0.75 | 0.98 | 59.12 ± 0.95 | 10.15 ± 0.60 |
| AC proniosomes tablet | 298.9 ± 1.32 | 3.31 ± 0.19 | 10.06 ± 0.03 | 8.21 ± 0.63 | 0.72 | 59.55 ± 1.09 | 45.65 ± .50 |
AC acemetacin, SD standard deviation
Dissolution Studies
Figure 5 shows reduced rate of AC release in acid medium where pH was adjusted to 1.2 for powdered proniosomes, proniosomal tablets, and AC plain tablets in the first 2 h. However, both plain tablets and powdered proniosomes showed greater dissolution results compared with proniosomal tablets in the first 2 h due to the very slow disintegration rate of proniosomal tablets. Changing the pH to 7.4 caused rapid AC release from all formulations due to rapid dissolution of the acid drug in the alkaline media. In the alkaline pH, plain tablets released 100% of the drug after 8 h whereas powdered proniosomes and proniosomal tablets released 75% and 58% of AC at the same time. The rest of AC in powdered proniosomes and proniosomal tablets was released very slowly where only 80% and 60% AC were released after 24 h from powdered proniosomes and proniosomal tablets, respectively. The differences in the dissolution properties between powdered and tableted proniosomes could affect the pharmacokinetic behavior of both formulations as discussed in the next section.
Fig. 5.
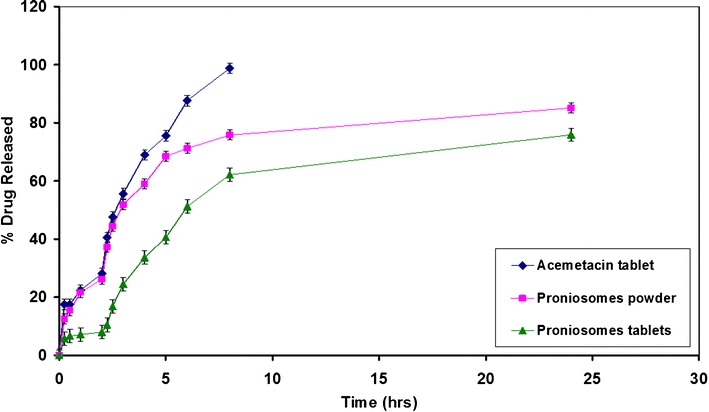
In vitro release of AC from proniosomes powder and tablet in comparison to AC plain tablet
Pharmacokinetics
Using the developed and validated chromatographic method, AC and IND were separated from rabbit blood. Figure 6 shows the plasma AC and IND concentration profiles as a function of time after its administration as plain AC tablets, AC proniosome powder, and AC proniosome-loaded tablets. The mean pharmacokinetics parameters of AC and IND from different formulations represented by Cmax (ng/ml), Tmax (h), Kel (h), t1/2 (h), AUC0–24 (ng/ml/h), and AUC0–∞ (ng/ml/h) are summarized in Table IV. The calculated parameters showed that AC plain tablet exhibited AUC0–∞ of 26,730 ± 2174 (ng/ml/h) for IND, compared to AUC0–∞ 48,292 ± 4040 and 69,273 ± 1193 for IND exhibited by AC proniosome powered and AC proniosome-loaded tablet, respectively. Additionally, the calculated parameters showed that AC plain tablet exhibited mean Cmax, Tmax, and AUC0–24 of 2827 ± 510 (ng/ml), 4 h, and 20,643 ± 1856 (ng/ml/h) for IND, compared to 3427 ± 524 (ng/ml), 8 h, and 37,512 ± 5623 (ng/ml/h) for IND obtained by AC proniosome powder and 2534 ± 473 (ng/ml), 12 h, and 39,533 ± 4071 (ng/ml/h) for IND obtained by AC proniosome-loaded tablet for Cmax, Tmax, and AUC0–24, respectively. From the previous results, it is clear that, formulation of AC as proniosome and proniosome-loaded tablet enhanced the blood residence time of the active metabolite IND compared to AC plain tablet, which was emphasized by a significant increase of their Tmax and AUC0–∞. The formulation of AC as proniosome-loaded tablet led to a significant increase in its bioavailability by 2.6- and 2.8-fold for IND and AC, respectively. Additionally, the formulation of AC as proniosome powder led to a significant increase in its bioavailability by 1.8- and 1.5-fold for IND and AC, respectively, compared with plain tablets. The enhanced permeability of the drug obtained by AC proniosome-loaded tablet could be attributed to two factors: firstly, the sustained release effect of proniosome and secondly, the compression effect of the tablet that retarded their disintegration time. The contribution of both factors on enhancing the blood residence time of drug is still under investigation.
Fig. 6.
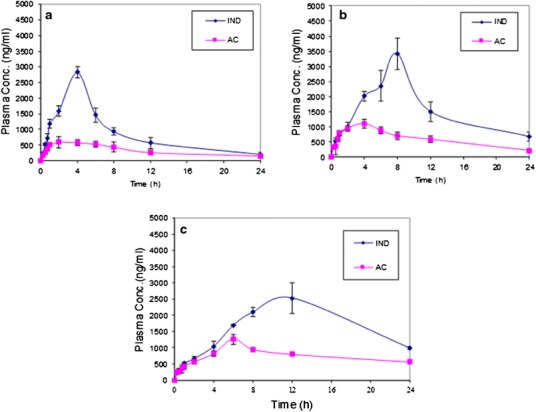
Mean plasma concentrations (ng/ml) of AC and IND, after oral administration of AC plain tablet (a), AC proniosome powder (b), and AC proniosome-loaded tablet (c)
Table IV.
Pharmacokinetic Parameters After Administration of AC Plain Tablet, AC Proniosome Powder, and AC Proniosome-Loaded Tablet
| Formulation | C max (ng/ml) | T max (h) | K ele (h) | t 1/2 ele (h) | AUC0–24 (ng/ml/h) | AUC0–∞ (ng/ml/h) | Cl (ml/h) | Relative bioavailability (%) |
|---|---|---|---|---|---|---|---|---|
| AC plain tablet | ||||||||
| IND | 2827 ± 510 | 4 | 0.104 ± 0.019 | 6.75 ± 1.24 | 20,643 ± 1856 | 26,730 ± 2174 | 0.033 ± 0.005 | − |
| AC | 596 ± 98 | 2 | 0.066 ± 0.005 | 10.21 ± 0.63 | 7919 ± 2079 | 11,517 ± 2718 | 0.053 ± 0.011 | − |
| AC proniosome powder | ||||||||
| IND | 3427 ± 524 | 8 | 0.081 ± 0.019 | 8.87 ± 2.24 | 37,512 ± 5623 | 48,292 ± 4040 | 0.013 ± 0.005 | 180.06 |
| AC | 1102 ± 146 | 4 | 0.077 ± 0.018 | 9.37 ± 2.33 | 14,278 ± 1150 | 17,314 ± 1940 | 0.033 ± 0.005 | 150.33 |
| AC proniosome-loaded tablet | ||||||||
| IND | 2534 ± 473 | 12 | 0.037 ± 0.003 | 18.61 ± 1.38 | 39,533 ± 4071 | 69,273 ± 1193 | 0.013 ± 0.005 | 259.15 |
| AC | 1261 ± 151 | 6 | 0.041 ± 0.006 | 17.55 ± 2.42 | 17,996 ± 777 | 32,248 ± 3465 | 0.016 ± 0.005 | 280.00 |
AC acemetacin, IND indomethacin
CONCLUSION
Proniosomes are prepared as free-flowing solid powders, which can be further processed into tablets easily. Both proniosomal powder and tablet formulations showed enhanced pharmacokinetic properties of AC drug when compared to plain AC tablets. Tablet formulations of proniosomes showed a greater AUC, t1/2, Tmax, and relative bioavailability that could be promising in enhancing the anti-inflammatory effects of AC and using AC at a reduced dose regimen.
REFERENCES
- 1.Storm G, Crommelin DJA. Liposomes: quo vadis? PSTT. 1998;1(1):19–31. [Google Scholar]
- 2.Dua JS, Rana AC, Bhandari AK. Liposomes: methods of preparation and application. Int J Pharm Sci Res. 2012;3(2):14–20. [Google Scholar]
- 3.Ulrich AS. Biophysical aspects of using liposomes as delivery vehicles. Biosci Rep. 2002;22(2):129–50. doi: 10.1023/A:1020178304031. [DOI] [PubMed] [Google Scholar]
- 4.Smola M, Vandamme T, Sokolowski A. Nanocarriers as pulmonary drug delivery systems to treat and to diagnose respiratory and non-respiratory diseases. Int J Nanomedicine. 2008;3(1):1–19. doi: 10.2217/17435889.3.1.1. [DOI] [PMC free article] [PubMed] [Google Scholar]
- 5.Kumar D, Sharma D, Singh G, Singh M, Rathore MS. Lipoidal soft hybrid biocarriers of supramolecular construction for drug delivery. ISRN Pharm. 2012;2012:1–14. doi: 10.5402/2012/941068. [DOI] [PMC free article] [PubMed] [Google Scholar]
- 6.Hu C, Rhodes DG. Proniosomes: a novel drug carrier preparation. Int J Pharm. 1999;185:23–35. doi: 10.1016/S0378-5173(99)00122-2. [DOI] [PubMed] [Google Scholar]
- 7.Blazek-Welsh AI, Rhodes DG. SEM imaging predicts quality of niosomes from maltodextrin-based proniosomes. Pharm Res. 2001;18:656–61. doi: 10.1023/A:1011037527889. [DOI] [PubMed] [Google Scholar]
- 8.Solanki A, Parikh J, Parikh R. Preparation, characterization, optimization, and stability studies of aceclofenac proniosomes. Int J Pharm Res. 2008;7(4):237–46. [Google Scholar]
- 9.Raja K, Jestin PU, Athul PV, Tamizharasi S, Sivakumar T. Formulation and evaluation of maltodextrin based proniosomal drug delivery system containing anti-diabetic (Glipizide) drug. Int J Pharm Tech Res. 2011;3(1):471–7. [Google Scholar]
- 10.Carter SJ. In: Tutorial pharmacy. 6. Copper J, Gunn S, editors. New Delhi: CBS Publishers and Distributors; 1986. pp. 211–33. [Google Scholar]
- 11.Basak SC, Kumar KS, Ramalingam M. Design and release characteristics of sustained release tablet containing metformin HCL. Braz J Pharm Sci. 2008;44:477–83. [Google Scholar]
- 12.Marwa HA, Omaima AS, Hanaa AE, Hanan ME. Optimizing proniosomes for controlled release of ketoprofen using Box-Behnken experimental design. Int J Pharm Sci Res. 2011;2(8):2195–205. [Google Scholar]
- 13.Mokhtar M, Sammour OA, Hammad MA, Megrab NA. Effect of some formulation parameters on flurbiprofen encapsulation and release rates of niosomes prepared from proniosomes. Int J Pharm. 2008;361:104–11. doi: 10.1016/j.ijpharm.2008.05.031. [DOI] [PubMed] [Google Scholar]
- 14.Goud BA, Raju G, Rambhau D. Formulation and evaluation of megestrol proniosomal systems. IJPBS. 2012;2(2):67–76. [Google Scholar]
- 15.Velmurugan S, Deepa RD, Nagarjuna RG. Formulation and evaluation of etoricoxib orodispersible tablets. Int J Pharm Tech Res. 2013;5(2):475–85. [Google Scholar]
- 16.Pawar PS, Saleem MA. Formulation and evaluation of oral colon targeted tablet of budesonide. Pharm Lett. 2013;5(3):1–12. [Google Scholar]
- 17.Chávez-Piña AE, Favari L, Castañeda-Hernández G. Pharmacokinetics of acemetacin and its active metabolite indomethacin in rats during acute hepatic damage and liver regeneration. Ann Hepatol. 2009;8(2):141–7. [PubMed] [Google Scholar]
- 18.Parthibarajan R, Rubinareichal R, Loganathan S. Formulation and evaluation of methotrexate proniosomal powder. Int J Pharm Pharm Sci. 2012;4(11):175–8. [Google Scholar]
- 19.Sankar V, Ruckmani K, Durga S, Jailani S. Proniosomes as drug carriers. Pak J Pharm Sci. 2010;23(1):103–7. [PubMed] [Google Scholar]
- 20.Mokhtar MI, Salma AT, Mahdi M. Liposomal diltiazem HCl as ocular drug delivery system for glaucoma. Drug Dev Ind Pharm. 2013 doi: 10.3109/03639045.2013.783589. [DOI] [PubMed] [Google Scholar]
- 21.Marwa HA, Omaima AS, Hanaa AE, Mohammed EA. Design and development of piroxicam-entrapped niosomes as an oral drug delivery system. Int J Adv Pharm Res. 2013;4(6):1873–86. [Google Scholar]
- 22.El-Ridy MS, Badawi AA, Safar MM, Mohsen AM. Niosomes as a novel pharmaceutical formulation encapsulating the hepatoprotective drug silymarin. Int J Pharm Pharm Sci. 2012;4(1):549–59. [Google Scholar]
- 23.Betageri GV. Liposomal encapsulation and stability of dideoxyinosine triphosphate. Drug Dev Ind Pharm. 1993;19:531–9. doi: 10.3109/03639049309062965. [DOI] [Google Scholar]
- 24.Sammour OA, Al-Zuhair HH, El-Sayed MI. Inhibitory effect of liposome-encapsulated piroxicam on inflammation and gastric mucosal damage. Pharm Ind. 1998;60(12):1084–7. [Google Scholar]
- 25.Omaima NE, Ahmed HH. Preparation and evaluation of acetazolamide liposomes as an ocular delivery system. Int J Pharm. 1997;158:121–5. doi: 10.1016/S0378-5173(97)00186-5. [DOI] [Google Scholar]
- 26.Guinedi AS, Mortada ND, Mansour S, Hathout RM. Preparation and evaluation of reverse-phase evaporation and multilamellar niosomes as ophthalmic carriers of acetazolamide. Int J Pharm. 2005;306:71–82. doi: 10.1016/j.ijpharm.2005.09.023. [DOI] [PubMed] [Google Scholar]
- 27.Abdallah M, Sammour O, EL-Ghamry H, Abu-Selem M. Preparation and in-vitro evaluation of diclofenac sodium niosomal formulations. Int J Pharm Sci Res. 2013;4(5):1757–65. [Google Scholar]
- 28.El-Samaligy MS, Afifi NN, Mahmoud EA. Increasing system: preparation and experimental design investigation. Int J Pharm. 2006;308:140–8. doi: 10.1016/j.ijpharm.2005.11.006. [DOI] [PubMed] [Google Scholar]


