Abstract
The design, synthesis, and application of novel biodegradable and biocompatible pentablock (PB) copolymers, i.e., polyglycolic acid-polycaprolactone-polyethylene glycol-polycaprolactone-polyglycolic acid (PGA-PCL-PEG-PCL-PGA) and polylactic acid-polycaprolactone-polyethylene glycol-polycaprolactone-polylactic acid (PLA-PCL-PEG-PCL-PLA) for sustained protein delivery, are reported. The PB copolymers can be engineered to generate sustained delivery of protein therapeutics to the posterior segment of the eye. PB copolymers with different block arrangements and molecular weights were synthesized by ring-opening polymerization and characterized by proton nuclear magnetic resonance (1H-NMR), gel permeation chromatography (GPC), and X-ray diffraction (XRD) spectroscopy. Immunoglobulin G (IgG) was selected as a model protein due to its structural similarity to bevacizumab. The influence of polymer molecular weight, composition, and isomerism on formulation parameters such as entrapment efficiency, drug loading, and in vitro release profile was delineated. Crystallinity and molecular weight of copolymers exhibited a substantial effect on formulation parameters. A secondary structure of released IgG was confirmed by circular dichroism (CD) spectroscopy. In vitro cytotoxicity, cell viability, and biocompatibility studies performed on human retinal pigment epithelial cells (ARPE-19) and/or macrophage cell line (RAW 264.7) demonstrated PB copolymers to be excellent biomaterials. Novel PB polymers may be the answer to the unmet need of a sustained release protein formulation.
KEY WORDS: block copolymers, controlled drug delivery, IgG, intravitreal, nanoparticles, ocular delivery, pentablock copolymers, posterior segment, protein therapeutics, sustained drug delivery
INTRODUCTION
Advancement in biotechnology has enabled the large-scale production of therapeutic macromolecules such as peptides, proteins, growth factors, hormones, siRNA, and other biologics. Age-related macular degeneration (AMD) is a vision-threatening ocular disease affecting the macular region of the retina, retinal pigment epithelium (RPE), Bruch’s membrane, and choriocapillaries (1). The disease is typically manifested in two forms: “dry” and “wet.” In wet AMD, choroidal neovascularization (CNV) is accompanied by leakage of blood and fluid into subretinal space and subsequent scar formation leading to irreversible vision loss (2). Vascular endothelial growth factor (VEGF) is a naturally occurring large lipoprotein molecule, involved in various pathophysiological processes including AMD and diabetic retinopathy (DR) (3). Bevacizumab is a 149 kDa full-length recombinant humanized murine monoclonal antibody (rhumAb-anti-VEGF antibody) specific to all isoforms of VEGF (4). It specifically binds to the extracellular VEGF and blocks the angiogenic action of VEGF. Due to the chronic nature of the disease and short intravitreal half-life of bevacizumab (5), frequent intravitreal injections are indicated to maintain therapeutic concentrations at the retina/choroid. Such frequent administrations are inconvenient and cause potential ocular complications such as endophthalmitis, retinal detachment, retinal hemorrhage and, more importantly, patient noncompliance (6–8).
A considerable amount of research has been carried out on the development of peptide or protein sustained delivery systems for the treatment of posterior segment diseases such as wet AMD and DR. However, physical and chemical instability and rapid enzymatic degradation of protein therapeutics are a few of the many challenges encountered by formulation scientists. To date, biodegradable micro- and nanoparticles (NPs) are proven to be the most promising carrier system, which provide peptide/protein protection against catalytic enzymes allowing improvement of their biological half-lives.
Among all biomaterials, biodegradable polymers such as polylactic acid (PLA) (9), polycaprolactone-b-polyethylene glycol-b-polycaprolactone (PCL-PEG-PCL) (10), and polylactic-co-glycolic acid (PLGA) (11) have been extensively investigated for the development of peptide/protein-encapsulated drug delivery formulation. However, it is widely reported that protein and peptide can undergo loss of biological activity during formulation, storage, and/or release (12–15). The presence of hydrophobic/hydrophilic interfaces (16), reduction in pH during polymer degradation (17), and degradation product (lactic acid and glycolic acid)-induced acylation processes (18,19) are potential sources of irreversible aggregation or inactivation of therapeutic proteins inside. The three-dimensional structure of protein is very important for its pharmacological activity. A small structural change may cause toxicity or immunogenicity as well as loss of pharmacological effect. Response to antibody may cause safety concerns and, thus, restricts the efficacy of subsequent applications (20). Hence, there is an urgent need to develop a biodegradable sustained release system, which does not compromise protein stability. In addition, sustained release of therapeutic agent for longer duration can eliminate repeated intravitreal injections.
In this study, we have investigated novel pentablock (PB) copolymers which are composed of FDA-approved individual polymer blocks such as PEG, PCL, and PLA/PGA. We have prepared PB copolymers with block arrangements of PLA-PCL-PEG-PCL-PLA and PGA-PCL-PEG-PCL-PGA for the development of protein-loaded sustained release formulation. The effects of molecular weight, isomerism, and polymer composition on various NP parameters such as entrapment efficiency, drug loading, and in vitro drug release profiling are studied. Human immunoglobulin G (IgG, 150 kDa), a full-length antibody, has been selected as a model protein, which is similar in structure to bevacizumab.
MATERIALS AND METHODS
Poly(ethylene glycol) (PEG, 4 kDa), stannous octoate, ε-caprolactone, poly(vinyl alcohol) (PVA), and lipopolysaccharide were procured from Sigma-Aldarich (St. Louis, MO, USA). l-Lactide and d,l-lactide were purchased from Acros Organics (Morris Plains, NJ, USA). Human IgG (plasma) was procured from Lee Biosolutions (Catalog no. 340–21) as a freeze-dried product. As per supplier’s indication, IgG was reconstituted in phosphate buffer saline prior to use. Micro BCATM was obtained from Fisher Scientific. Mouse TNF-α, IL-6, and IL-1β (Ready-Set-Go) ELISA kits were purchased from eBioscience Inc. Lactate dehydrogenase estimation kit and CellTiter 96® AQueous nonradioactive cell proliferation assay (MTS) kit were obtained from Takara Bio Inc. and Promega Corp., respectively. All other reagents utilized in this study were of analytical grade. ARPE-19 and RAW 264.7 cells were procured from the American Type Culture Collection (ATCC).
Synthesis of Triblock and Pentablock Copolymers
Triblock (TB) and PB copolymers were synthesized by ring-opening bulk copolymerization (21). In the first step, PCL-PEG-PCL copolymers were synthesized by copolymerization of ε-caprolactone on the hydroxyl ends of PEG (4 kDa). In this reaction, PEG was utilized as a macroinitiator and stannous octoate (0.5 wt%) acted as a catalyst. To synthesize PCL-PEG-PCL, a predetermined amount of PEG was vacuum-dried for 4 h followed by the addition of ε-caprolactone and catalyst. The reaction was carried out in a closed vessel under nitrogen environment, at 130°C for 36 h. The reaction mixture was solubilized in dichloromethane (DCM) followed by precipitation in ice-cold diethyl ether. Precipitated polymer was vacuum-dried to remove any residual solvent and analyzed to evaluate the reaction yield. The structure and molecular weight of TB copolymers were confirmed by proton nuclear magnetic resonance (1H-NMR) and gel permeation chromatography (GPC).
In order to prepare PB copolymers, a predetermined amount of TB copolymer was added as a macroinitiator and stannous octoate (0.5 wt%) as a catalyst. For the synthesis of PB-A and PB-D, l-lactide was polymerized on the hydroxyl ends of the TB copolymer. Similarly, PB-B/PB-E and PB-C/PB-F were synthesized by polymerizing d,l-lactide and glycolide, respectively. For the synthesis of PB-A, PB-B, PB-D, and PB-E, reaction was carried out at 130°C for 36 h. However, in the synthesis of PB-C and PB-F, reaction was performed at 200°C for 24 h.
In order to remove catalyst and unreacted monomers, the reaction mixture was dissolved in DCM and precipitated by the addition of ice-cold diethyl ether. Polymers were vacuum-dried and characterized for their structure and polydispersity by employing 1H-NMR and GPC as analytical techniques. Purified polymers were stored at −20°C until further use. The reaction scheme for the synthesis of TB-A, TB-B, PB-A, PB-B, PB-D, and PB-E is described in Fig. 1a, whereas the synthesis of PB-C and PB-F is described in Fig. 1b.
Fig. 1.
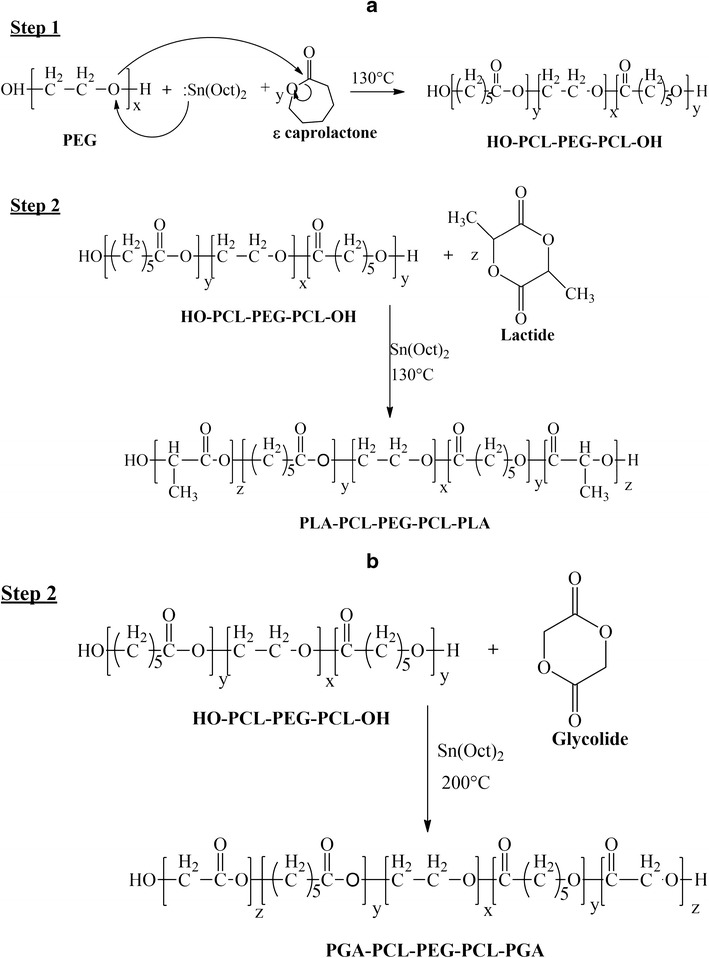
Synthesis scheme for a TB-A, TB-B, PB-A, PB-B, PB-D, and PB-E; b PB-C and PB-F. Note: For the synthesis of PB-C and PB-F, step 1 was similar as described in a
Characterization of Polymers
Polymers were characterized for purity, molecular weight, and polydispersity by 1H-NMR and GPC. The materials were further evaluated by powder X-ray diffraction (XRD) to determine their crystalline state.
1H-NMR
To perform 1H-NMR spectroscopy, polymeric material was dissolved in CDCl3 and analyzed by a Varian-400 NMR spectrometer. Purity and average number molecular weight (Mn) of the polymers were confirmed from the 1H-NMR spectrum.
Gel Permeation Chromatography
To further confirm purity, molecular weight, and polydispersity, polymeric samples were analyzed via the Polymer Standards Service (PSS) WinGPC Unity version 7.5.0 system equipped with a light scattering detector coupled to the Tosoh Ecosec system. The eluent solvent tetrahydrofuran (THF) was pumped at a flow rate of 1 mL/min. Separation was carried out on a Styragel HR-3 column. The calibration curve was established by the use of five polystyrene standards from ranging from 8,000 to 90,000 Da. Briefly, 5 mg of polymeric material was dissolved in THF and characterized by GPC.
X-Ray Diffraction Analysis of Copolymers
Diffraction patterns were obtained to understand the effects of polymer composition (TB vs PB), molecular weight, and block types (P(L)LA, P(DL)LA, and PGA) on the crystallinity of copolymers. MiniFlex automated X-ray diffractometer (Rigaku, The Woodlands, TX) with Ni-filtered Cu-Kα radiation (30 kV and 15 mA) was employed to study diffraction patterns. XRD analysis was carried out at room temperature.
In Vitro Cytotoxicity Studies
Cell Culture
A mouse leukemic monocyte macrophage cell line (RAW 264.7) has been widely utilized as an in vitro model for the evaluation of polymer toxicity. RAW 264.7 cells were cultured and maintained in Dulbecco’s modified Eagle medium (DMEM) supplemented with 10% fetal bovine serum (FBS), 100 mg/L of streptomycin, and 100 U/L of penicillin. Human retinal pigment epithelial cells (ARPE-19) were cultured and maintained according to a protocol reported from our laboratory (22). In brief, ARPE-19 cells were cultured in DMEM/F-12 medium containing 10% heat-inactivated FBS, 29 mM of sodium bicarbonate, 15 mM of HEPES, 100 mg/L of streptomycin, and 100 U/L of penicillin. Both cell lines were maintained in a humidified atmosphere at 37°C and 5% CO2.
Lactate Dehydrogenase Assay
Cytotoxicity of block copolymers was evaluated according to a previously published protocol with minor modifications (23). Briefly, several concentrations (1–20 mg/mL) of TB and PB copolymers were prepared in acetonitrile (ACN). One hundred microliters of solutions were added to each well of 96-well cell culture plates. In order to evaporate ACN and to sterilize block copolymers, cell culture plates were exposed to UV overnight (laminar flow). After ACN evaporation, 1.0 × 10⁴ of RAW 264.7 cells were seeded in each well and incubated for 48 h at 37°C and 5% CO2 in a humidified atmosphere. After appropriate incubation, the cell supernatant was analyzed for lactate dehydrogenase (LDH) release by a detection kit. LDH assay was performed according to the manufacturer’s protocol. Samples were analyzed at 450 nm by a 96-well plate reader. The amount of released LDH is directly proportional to polymer cytotoxicity. In this study, more than 10% of LDH release was considered as cytotoxic. To evaluate the toxicity of block copolymers on retinal cell line, a similar experiment was performed with ARPE-19 cells. LDH release (%) was calculated according to the following equation:
| 1 |
MTS Assay
In order to confirm safety of PB copolymers, in vitro cell viability (MTS) assay was performed. It was carried out according to a previously published protocol with minor modifications (24). A series of block copolymer solutions was prepared, aliquoted, and sterilized according to a procedure described earlier. After sterilization, RAW 264.7 cells at a density of 1.0 × 10⁴ cells per well were seeded in a 96-well plate. Cells were incubated for 48 h at 37°C and 5% CO2 in a humidified atmosphere. After incubation, the cell culture medium was replaced with 100 μL of serum-free medium containing 20 μL MTS solution. Cells were further incubated at 37°C and 5% CO2 for 4 h. Absorbance of each well was determined at 450 nm. Polymer concentrations at which more than 90% of cell viability was observed were considered as nontoxic. Percent cell viability was estimated by Eq. 2. A similar experiment was repeated with ARPE-19 cells.
| 2 |
In Vitro Biocompatibility Studies
As described in the previous section, various concentrations (1–20 mg/mL) of block copolymer solutions were prepared in ACN. An aliquot (200 μL) of polymer solution was added to each well of a 48-well cell culture plate. After UV sterilization and evaporation of ACN, RAW 264.7 cells were plated at the cell density of 5.0 × 10⁴ per well. Cells were exposed to the polymer for 48 h at 37°C and 5% CO2. After incubation, the cell supernatant was analyzed for three different cytokines, i.e., TNF-α, IL-6, and IL-1β. Cytokine levels were estimated by standard ELISA method. It was performed according to the manufacturer’s protocol. Calibration curves for TNF-α, IL-6, and IL-1β were prepared in the range of 10–750, 5–500, and 10–500 pg/mL, respectively.
Preparation of Nanoparticles
NPs were prepared by W1/O/W2 double emulsion solvent evaporation method (Fig. 2) according to a previously published protocol with minor modifications (25). Briefly, a predetermined amount of IgG was dissolved in water (1 mL) containing 50 μL of Tween-80 (W1 phase). One hundred milligrams of respective block copolymer was dissolved in 4 mL of DCM comprising 50 μL of Span-20 (organic phase). W1/O primary emulsion was prepared by dropwise addition of W1 phase into the organic phase under constant sonication for 1 min at 4 W. Immediately, W1/O primary emulsion was added (dropwise) to 20 mL of 2% PVA solution (W2) and sonicated for 4 min at 5 W. W1/O/W2 double emulsion was stirred for 30 min at room temperature followed by evaporation of DCM under vacuum. Resulting NPs were centrifuged at 20,000 rpm for 30 min at 4°C followed by two washing cycles with distilled deionized water (DDW). NPs were freeze-dried in 5% mannitol solution and stored at −20°C until further characterization. NPs were prepared utilizing three different drug to polymer ratios, i.e., 1:10, 1:15, and 1:20. Freeze-dried NPs were characterized for size, entrapment efficiency (EE), drug loading (DL), and in vitro drug release.
Fig. 2.
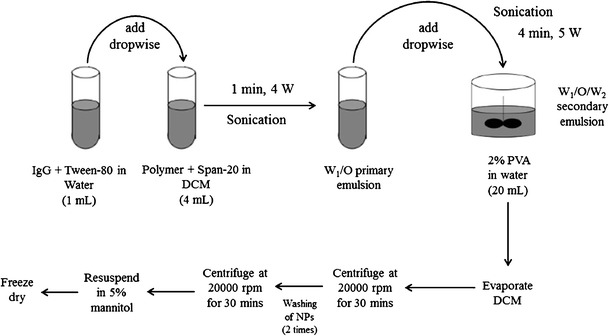
A schematic diagram for the preparation of IgG-loaded NPs by double emulsion solvent evaporation method utilizing different block copolymers
Characterization of Nanoparticles
Particle Size
NPs (1 mg/mL) were suspended in DDW and subjected to particle size analysis. Particle size was evaluated at room temperature and 90° scattering angel utilizing Zetasizer (Zetasizer Nano ZS, Malvern Instruments Ltd, Worcestershire, UK). All the samples were analyzed in triplicate and average particle size was reported.
Entrapment Efficiency (%) and Drug Loading (%)
IgG-loaded freeze-dried NPs were examined for the estimation of drug loading and entrapment efficiency, which were calculated by analyzing supernatants (collected during NP preparation) with Micro BCATM protein estimation kit. To evaluate drug loading, 2 mg equivalent drug-encapsulated NPs were dissolved in 200 μL of DMSO. The resulting solution was subjected to protein estimation via UV absorbance spectroscopy. A standard curve of IgG ranging from 31.25 to 2,000 μg/mL was prepared in DMSO. Entrapment efficiency (%) and drug loading (%) were estimated according to following equations.
Entrapment efficiency (%EE) was calculated by Eq. 3
| 3 |
Drug loading (%DL) was calculated by Eq. 4
| 4 |
In Vitro Release Studies
For in vitro drug release studies, 1 mg protein equivalent IgG-encapsulated NPs were dispersed in 1 mL of 0.1 M phosphate buffer saline (pH 7.4). NP suspension was incubated in a water bath, at 37°C. In order to collect the release samples, at predetermined time intervals, NP suspensions were centrifuged at 13,000 rpm for 30 min and 4°C. Two hundred microliters of clear supernatant was withdrawn for protein estimation and replaced with the same volume of 0.1 M PBS. NPs were then resuspended and the release study was continued at 37°C. In vitro release experiments were repeated in triplicate and mean value ± SD was expressed as cumulative % drug released with time.
Stability Estimation of IgG
Secondary Structure Analysis by Circular Dichroism Spectroscopy
To confirm the stability of the secondary structure of released IgG, circular dichroism (CD) spectroscopy was conducted with Jasco 720 spectropolarimeter at 25°C. CD spectra were recorded at a scanning speed of 5 nm/min within a range of 200 to 250 nm utilizing 1 cm cell and 1 nm band width. CD measurements were transformed into molar ellipticity [θ]. CD spectrum of PBS was considered as blank. After 15 days, release samples were diluted with PBS (release medium) to the concentration of 0.2 mg/mL. Structural stability of the released IgG was evaluated, and the results were compared with the CD spectrum of native IgG at the same protein concentration.
Statistical Analysis
All experiments were performed in triplicates. The results are indicated as mean ± standard deviation. Student’s t test was applied to evaluate any statistical significance between two sets of results. A level of p < 0.05 was considered as statistically significant.
RESULTS AND DISCUSSION
In this study, we report the synthesis of novel PB copolymers which are composed of FDA-approved polymer blocks such as PEG, PCL, and PLA/PGA. Each block plays an important role, such as the presence of PEG helps to improve the stability of NPs by reducing NP aggregation (26). It also prevents phagocytosis by macrophages resulting in longer biological half-life (27). PCL is a slow-degrading semicrystalline polymer, which improves protein loading in NPs and sustains drug release over a longer duration. Such a slow degradation is also disadvantageous particularly for intravitreal injections. It is very important for formulation scientists to synchronize polymer degradation profile with drug release in order to avoid accumulation of empty particle shells in vitreous cavity. Previous reports suggest that poor degradation of PCL is attributed to crystalline nature. Hence, reduction in the crystallinity of PCL may catalyze hydrolytic and enzymatic degradations (28). According to Huang et al., conjugation of PLA/PGA to PCL chains can significantly reduce the crystallinity resulting in faster degradation of PCL (29). With the novel PB copolymers, we are anticipating a stable formulation with significantly improved entrapment efficiency and drug loading. Moreover, incorporation of PCL and PLA/PGA blocks will also improve the sustained release profile. In addition, it is anticipated that degradation of PCL blocks will be significantly improved by covalently integrating PLA/PGA.
Synthesis and Characterization of Various TB and PB Copolymers
Triblock and pentablock copolymers were successfully synthesized by ring-opening bulk copolymerization of ε-caprolactone and l-lactide/d,l-lactide/glycolide. In the first step, triblock copolymers (PCL-PEG-PCL) with different molecular ratios of PEG/PCL were synthesized utilizing PEG (4 kDa) as the macroinitiator and stannous octoate as the catalyst. Purified triblock copolymers were used as the macroinitiator for the synthesis of pentablock copolymers. The purity and Mn of block copolymers were confirmed by 1H-NMR spectroscopy. As described in Fig. 3a, typical 1H-NMR characteristic peaks of PCL units were observed at 1.40, 1.65, 2.30, and 4.06 ppm representing methylene protons of -(CH2)3-, -OCO-CH2-, and -CH2OOC-, respectively. A sharp proton peak observed at 3.65 ppm was attributed to methylene protons (-CH2CH2O-) of PEG. 1H-NMR spectra of PB copolymers with PLA as terminals (PB-A, PB-B, PB-D, and PB-E) exhibited two additional peaks at 1.50 (-CH3) and 5.17 (-CH-) ppm (Fig. 3b). However, PB-C and PB-E exhibited cluster of singlets between 4.6 and 4.9 ppm representing methylene protons (-CH2-) of PGA units (data not shown). The [EO]-[CL]-[LA] (ethylene oxide (EO), ɛ-caprolactone (CL), and lactic acid (LA)) molar ratio of the final products was calculated from the integration values of PEG signal at 3.65 ppm, PCL signal at 2.30 ppm, and PLA signal at 5.17 ppm. In case of PB-C and PB-F copolymers, proton signals between 4.6 and 4.9 ppm were selected for the calculation of molar ratio. These integration values provided the average number of monomers covalently attached in each polymer chain. Multiplying the number of monomers with their molecular weight allowed us to calculate the Mn of the respective block copolymers.
Fig. 3.
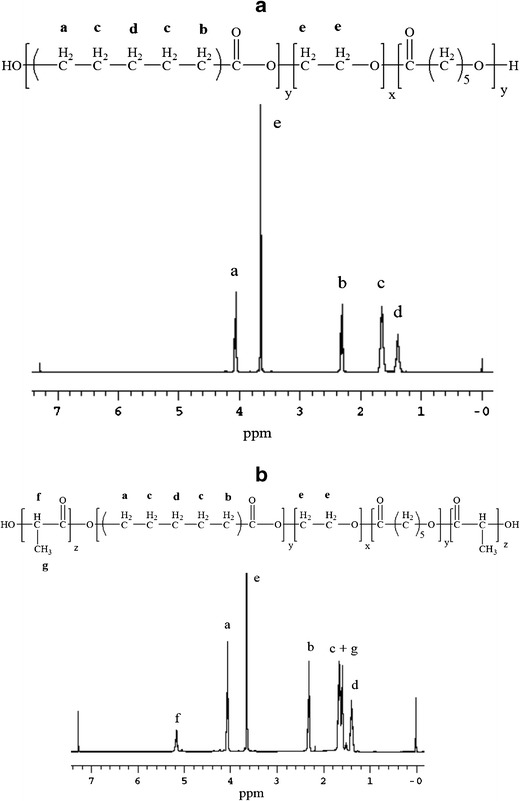
1H NMR spectroscopy was performed by dissolving polymers in CDCl3. a 1H-NMR of TB-A (PCL5000-PEG4000-PCL5000) and b 1H-NMR of PB-A (PL(L)A2000-PCL5000-PEG4000-PCL5000-PL(L)A2000)
In order to confirm the molecular weight and purity, all the block copolymers were further analyzed by GPC. Block copolymers exhibited monodistribution of molecular weight without any other homopolymers such as PEG, PCL, PLA, or PGA. The calculated molecular weights were very close to the feed ratio and polydispersity of block copolymers was well below 1.45 indicating narrow distribution of molecular weights. Table I presents the theoretical molecular weights, calculated molecular weights (1H-NMR and GPC), and polydispersity. Mn values obtained from 1H-NMR were noticeably higher relative to Mn values calculated from GPC analysis. This observation may be attributed to the difference in hydrodynamic diameter of block copolymers relative to parent homopolymers. As reported in Table I, the observed molecular weights were very similar to theoretical molecular weights. Therefore, in the manuscript, theoretical molecular weights are mentioned instead of the calculated molecular weights.
Table I.
List of TB and PB Copolymers Studied
| Polymers | Structures | Total Mna (theoretical) | Total Mnb (calculated) | Total Mnc (calculated) | Mwc (GPC) | PDc | Hydrophilic to hydrophobic segment ratios (PEG/PCL or PEG/PCL-PLA) |
|---|---|---|---|---|---|---|---|
| TB-A | PCL5000-PEG4000-PCL5000 | 14,000 | 13,348 | 10,989 | 14,520 | 1.32 | 1/2.5 |
| TB-B | PCL7000-PEG4000-PCL7000 | 18,000 | 16,654 | 14,560 | 18,796 | 1.29 | 1/3.5 |
| PB-A | PL(l)A2000-PCL5000-PEG4000-PCL5000-PL(l)A2000 | 18,000 | 16,948 | 14,990 | 20,803 | 1.39 | 1/2.5–1 |
| PB-B | PL(dl)A2000-PCL5000-PEG4000-PCL5000-PL(dl)A2000 | 18,000 | 16,876 | 13,813 | 19,563 | 1.42 | 1/2.5–1 |
| PB-C | PGA2000-PCL5000-PEG4000-PCL5000-PGA2000 | 18,000 | 17,212 | 13,449 | 19,211 | 1.43 | 1/2.5–1 |
| PB-D | PL(l)A3000-PCL7000-PEG4000-PCL7000-PL(l)A3000 | 24,000 | 21,354 | 17,644 | 23,826 | 1.35 | 1/3.5–1 |
| PB-E | PL(dl)A3000-PCL7000-PEG4000-PCL7000-PL(dl)A3000 | 24,000 | 21,334 | 18,214 | 24,936 | 1.37 | 1/3.5–1 |
| PB-F | PGA3000-PCL7000-PEG4000-PCL7000-PGA3000 | 24,000 | 21,294 | 16,184 | 23,212 | 1.43 | 1/3.5–1 |
Mn average number molecular weight, Mw molecular weight, PD polydispersity, GPC gel permeation chromatography, PEG polyethylene glycol, PCL polycaprolactone, PLA polylactic acid, PGA polyglycolic acid, TB triblock, PB pentablock
aTheoretical value, calculated according to the feed ratio
bCalculated from 1H-NMR results
cDetermined by GPC analysis
Several reports suggested that covalent conjugation between PLA and PCL significantly reduces the crystallinity of PCL (21,30–33). However, the effects of various isomers of PLA (L or DL) and PGA on the crystallinity of PCL-PEG-PCL triblock copolymers have not been reported previously. Hence, we have analyzed TB and PB copolymers for XRD patterns. PLA with d,l-lactide presents an amorphous structure, whereas PLA with l-lactide is semicrystalline (28). Both polymers may act differently to reduce the crystallinity of PCL. It may have a direct effect on various formulation parameters such as entrapment efficiency, drug loading, and in vitro release. Moreover, we have also evaluated the effect of PGA to reduce the crystallinity of PCL-PEG-PCL triblock copolymers.
Figure 4 describes the XRD patterns of various TB and PB copolymers. As reported in Fig. 4a, TB-A exhibited two strong characteristic crystalline peaks of PCL blocks at diffraction angle (2θ) 21.5° and 23.8°. l-Lactide containing PB copolymer (PB-A) exhibited reduced intensity of PCL peaks, which suggests that conjugation of PLA (l-lactide) has significantly diminished the crystallinity of TB-A. Noticeably, conjugation of d,l-lactide has further reduced the crystalline peaks of PCL blocks. These results may be attributed to the fact that PLA with l-lactide is more crystalline than PLA with d,l-lactide (34). Moreover, PLA with d,l-lactide has a random arrangement of l-lactide and d-lactide in its polymer chain which does not allow systemic arrangement of polymer chains resulting in reduced crystallinity. Surprisingly, PB-C demonstrated an amorphous structure, suggesting that conjugation of PGA at the terminals of TB-A totally eliminated the crystallinity of PCL. To confirm this behavior, solid states of TB-B, PB-D, PB-E, and PB-F by XRD were evaluated. Figure 4b demonstrated a similar pattern, where PB-F with PGA block was amorphous in nature. PLA with l-lactide reduced the peak intensity of PCL to an extent, while PLA with d,l-lactide has significantly diminished crystalline peaks of PCL. These results indicate that crystallinity of PB copolymers can be easily controlled by changing the terminal blocks (PLA/PGA) or by changing the isomers of PLA (l or d,l).
Fig. 4.
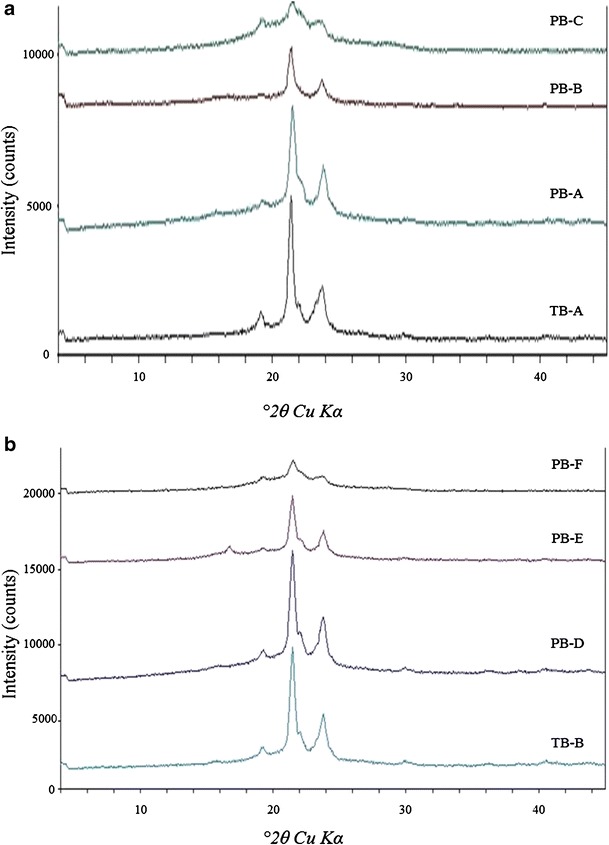
XRD patterns of various TB and PB copolymers where a TB-A, PB-A, PB-B, and PB-C; (b) TB-B, PB-D, PB-E, and PB-F
In Vitro Cytotoxicity Studies
LDH Assay
LDH is the cytosolic enzyme, secreted in the culture medium following cell membrane disintegration (23). As the cell membrane is the potential site for polymer-cell interaction, measuring the amount of LDH release has been the preferred way to estimate membrane damage and, hence, the cytotoxicity of a polymer (23). As described in Fig. 5a (RAW 264.7 cells) and b (ARPE-19), LDH release following block copolymer exposure was less than 10% at any given concentrations. It is comparable with the negative control indicating negligible or no toxicity.
Fig. 5.
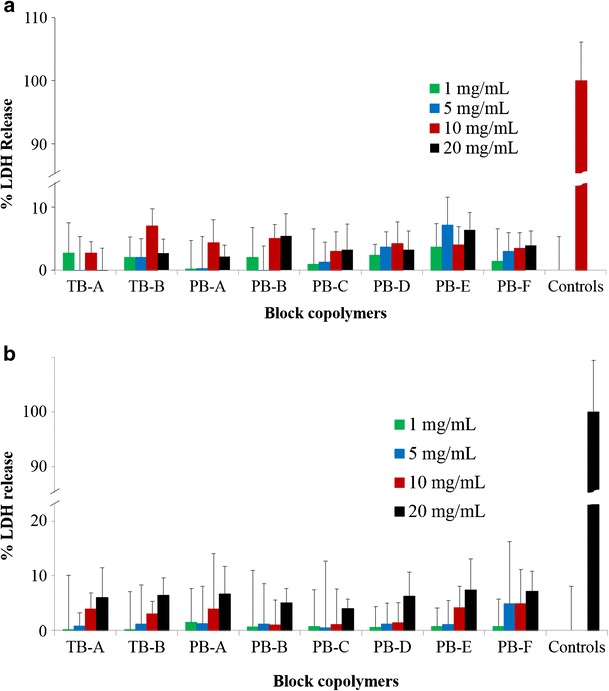
In vitro cytotoxicity (LDH) assay of various block copolymers at different concentrations was performed on a RAW 264.7 and b ARPE-19 cells. Results are described as mean ± SD, n = 6
MTS Assay
In order to confirm the lack of cytotoxicity (LDH assay), safety of block copolymers was further evaluated by MTS assay. Block copolymers exhibited more than 90% cell viability upon exposure to various concentrations ranging from 1 to 20 mg/mL (Fig. 6a, b). Moreover, the results were comparable to the negative control indicating no observable toxicity of PB copolymers. Results observed in LDH and MTS assays clearly indicate that block copolymers are very safe for intravitreal applications.
Fig. 6.
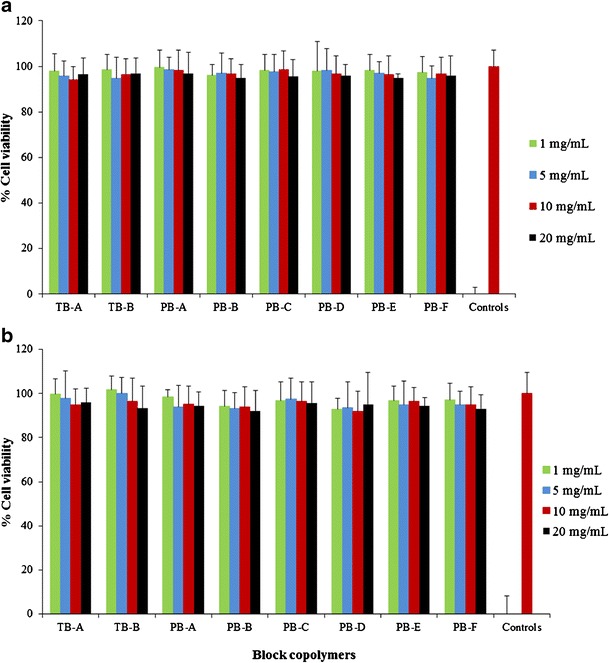
In vitro cell viability (MTS) assay of various block copolymers at different concentrations was performed on a RAW 264.7 and b ARPE-19 cells. Results are described as mean ± SD, n = 6
In Vitro Biocompatibility Studies
It is also important to confirm that newly synthesized PB copolymers are not eliciting any inflammatory responses following intravitreal administration. In vitro release of cytokines upon exposure to polymer is a rapid, cost-effective, and reliable technique to examine the biocompatibility of polymers. RAW 264.7 cells are a well-established in vitro cell culture model to study inflammatory responses of polymers. Figure 7a–c has demonstrated the negligible release of TNF-α, IL-6, and IL-1β, respectively, following 24 h exposure to different concentrations of block copolymers ranging from 1 to 20 mg/mL. The release of any cytokines was not significantly different to their respective negative controls indicating excellent biocompatibility of block copolymers.
Fig. 7.
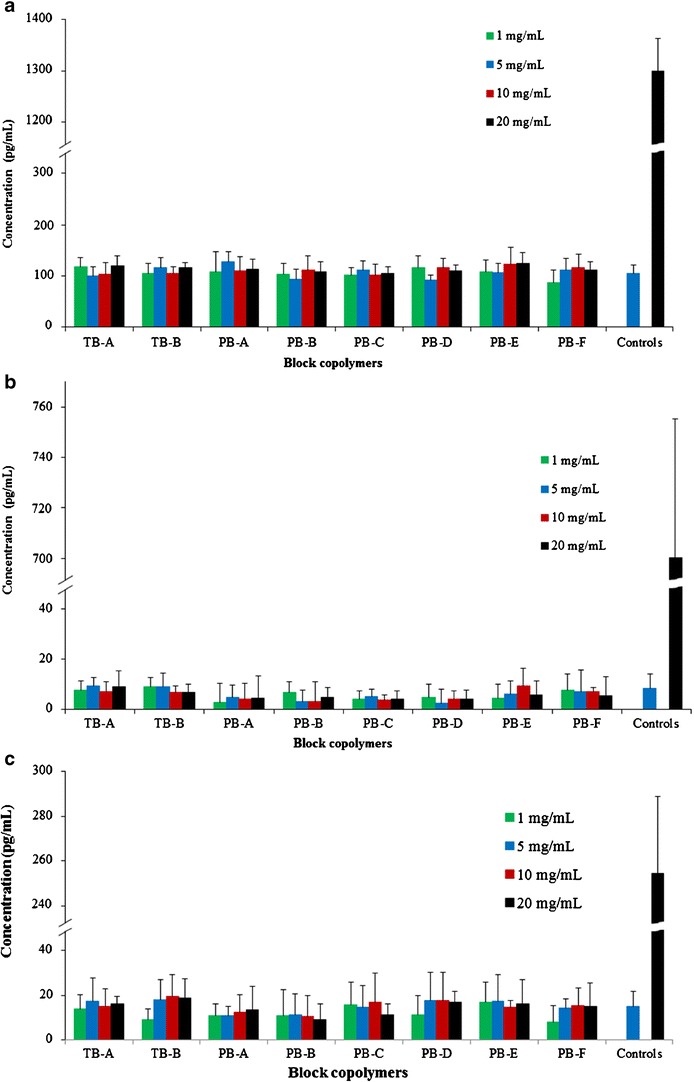
In vitro biocompatibility of block copolymers was evaluated by estimating the levels of a TNF-α, b IL-6, and c IL-1β in the supernatants of polymer-treated RAW 264.7 cells. Results are described as mean ± SD, n = 6
Characterization of Nanoparticles
Particle Size
IgG-loaded TB and PB NPs were prepared by W1/O/W2 double emulsion solvent evaporation method. As described in Tables II, III, and IV, NP diameters are between 285 to 330 nm. No significant effect of polymer composition on the particle size was noted. Moreover, in order to understand the effect of drug to polymer ratio on particle size, we have prepared NPs with three distinct drug to polymer ratios, i.e., 1:10, 1:15, and 1:20. Interestingly, a change in drug to polymer ratio did not exhibit any significant effect on particle size. Therefore, it appears that particle size is controlled by process parameters and not by drug/polymer ratio. However, for the NPs prepared with any of the block copolymers, we have observed a smaller particle size with increasing polymer concentration. It may be possible that a higher polymer concentration (1:20 > 1:15 > 1:10) has generated higher hydrophobic interactions between polymer chains resulting in more compact NPs with reduced particle size.
Table II.
Characterization of TB-A and TB-B NPs. NPs of TB-A Prepared with Three Different Drug/Polymer Ratios (1:10, 1:15, and 1:20) Were Compared with Respective NPs Composed of TB-B. Results Are Described as Mean ± SD, n = 3 (*p < 0.05, Student’s t test)
| Structure | Drug/polymer ratio | Entrapment efficiency (%) | Loading (%) | Particle size (nm) |
|---|---|---|---|---|
| TB-A | 1:10 | 27.30 ± 2.15 | 3.64 ± 0.26 | 326.3 ± 15.9 |
| 1:15 | 28.24 ± 1.95 | 2.29 ± 0.13 | 320.4 ± 31.8 | |
| 1:20 | 29.77 ± 1.86 | 2.04 ± 0.19 | 313.9 ± 29.7 | |
| TB-B | 1:10 | 34.65 ± 3.24* | 4.12 ± 0.29* | 319.7 ± 21.3 |
| 1:15 | 33.73 ± 2.41* | 2.72 ± 0.24* | 307.4 ± 17.8 | |
| 1:20 | 35.71 ± 2.79* | 2.57 ± 0.21* | 303.6 ± 19.5 |
NPs nanoparticles, SD standard deviation, TB triblock, PB pentablock
Table III.
Characterization of PB-A, PB-B, and PB-C NPs. PB-A and PB-B NPs Prepared with Three Different Drug/Polymer Ratios (1:10, 1:15, and 1:20) Were Compared with Respective NPs of PB-C. Results Are Described as Mean ± SD, n = 3 (*p < 0.05, Student’s t test)
| Structure | Drug/polymer ratio | Entrapment efficiency (%) | Loading (%) | Particle size (nm) |
|---|---|---|---|---|
| PB-A | 1:10 | 46.82 ± 2.42* | 5.20 ± 0.31* | 315.4 ± 14.8 |
| 1:15 | 49.59 ± 3.11* | 3.84 ± 0.29* | 301.7 ± 24.1 | |
| 1:20 | 47.69 ± 2.18* | 3.14 ± 0.17* | 295.7 ± 16.7 | |
| PB-B | 1:10 | 51.51 ± 2.67* | 5.45 ± 0.38* | 304.5 ± 9.5 |
| 1:15 | 50.39 ± 4.12* | 4.23 ± 0.43* | 291.9 ± 16.7 | |
| 1:20 | 53.54 ± 4.28* | 3.62 ± 0.25* | 286.8 ± 21.5 | |
| PB-C | 1:10 | 39.72 ± 3.64 | 4.26 ± 0.46 | 310.1 ± 16.2 |
| 1:15 | 41.46 ± 4.21 | 3.18 ± 0.22 | 300.5 ± 20.2 | |
| 1:20 | 40.26 ± 3.13 | 2.82 ± 0.12 | 294.4 ± 7.8 |
NPs nanoparticles, SD standard deviation, TB triblock, PB pentablock
Table IV.
Characterization of PB-D, PB-E, and PB-F NPs. PB-D and PB-E NPs Prepared with Three Different Drug/Polymer Ratios (1:10, 1:15, and 1:20) Were Compared with Respective NPs of PB-F. Results Are Described as Mean ± SD, n = 3 (*p < 0.05, Student’s t test)
| Structure | Drug/polymer ratio | Entrapment efficiency (%) | Loading (%) | Particle size (nm) |
|---|---|---|---|---|
| PB-D | 1:10 | 61.06 ± 4.18* | 5.68 ± 0.18* | 307.1 ± 24.8 |
| 1:15 | 61.80 ± 3.72* | 4.92 ± 0.28* | 302.4 ± 17.7 | |
| 1:20 | 62.65 ± 3.99* | 3.81 ± 0.12* | 293.6 ± 13.6 | |
| PB-E | 1:10 | 63.19 ± 2.16* | 5.79 ± 0.39* | 304.3 ± 22.1 |
| 1:15 | 64.86 ± 3.58* | 5.02 ± 0.28* | 299.9 ± 10.8 | |
| 1:20 | 65.77 ± 3. 81* | 4.34 ± 0.19* | 293.5 ± 9.3 | |
| PB-F | 1:10 | 51.01 ± 2.97 | 5.01 ± 0.13 | 316.5 ± 34.6 |
| 1:15 | 52.38 ± 3.08 | 4.21 ± 0.18 | 306.2 ± 23.9 | |
| 1:20 | 54.06 ± 3.67 | 3.23 ± 0.27 | 289.7 ± 19.4 |
NPs nanoparticles, SD standard deviation, TB triblock, PB pentablock
Entrapment Efficiency and Drug Loading
Entrapment efficiency and drug loading are influenced by many parameters including copolymer composition (isomerism, molecular weight, and polymer structure) and phase volumes (W1, O, and W2). To understand the effect of copolymer compositions on drug loading and entrapment efficiency, volumes of W1, O, and W2 phases were kept constant. In addition, we have also studied the effect of drug to polymer ratio on drug loading and entrapment efficiency. As described in Table II, at any drug to polymer ratios, TB-B NPs exhibited significantly higher drug loading and entrapment efficiency relative to TB-A NPs. PB-D, PB-E, and PB-F (Table IV) having significantly higher molecular weight relative to PB-A, PB-B, and PB-C (Table III), respectively, exhibited improved entrapment efficiency and drug loading. It appears that higher molecular weight block copolymers generate a longer polymer chain with significantly higher hydrophobicity compared to lower molecular weight block copolymers. During the solvent evaporation step, high hydrophobicity (PB-D, PB-E, and PB-F) may allow rapid polymer precipitation to form NPs. It may also prevent diffusion of IgG in external aqueous (W2) phase.
Interestingly, we have also observed significantly higher entrapment and loading efficiency in PLA-based PB copolymers (PB-A, PB-B, PB-D, and PB-E) relative to PGA-based PB copolymers (PB-C and PB-F). The absence of the methyl group (-CH3) in the structure of PGA makes it more hydrophilic relative to PLA (containing -CH3). Due to higher hydrophilicity, PB-C and PB-F copolymers may produce higher interaction with W1 and W2 phase. These interaction energies may allow IgG to escape from W1 to W2 phase (during NP preparation) resulting in lower entrapment efficiency and drug loading. Conversely, PLA-based PB copolymers may have inhibited or reduced the diffusion of IgG from W1 to W2 phase generating higher drug loading and entrapment efficiency.
In Vitro Release Studies
In vitro drug release studies were performed to understand the effects of isomerism ((P(l)LA vs P(d,l)LA)), molecular weight, and polymer composition on drug release. IgG-loaded NPs with drug to polymer ratio of 1:10 were utilized for the release study for all polymer compositions.
In vitro IgG release profiles from TB-A and TB-B NPs are depicted in Fig. 8. Both NPs demonstrated a biphasic release profile, i.e., initial burst release phase followed by a phase of sustained release. Noticeably, TB-A NPs exhibited significantly higher burst release (~64%) relative to TB-B NPs (~55%). In a later stage, TB-A NPs displayed ~95% of IgG release within the first 15 days, whereas TB-B NPs released ~87% of IgG during the same period. These data clearly indicated that the increase in molecular weight exhibited reduced burst release followed by sustained release for longer duration.
Fig. 8.
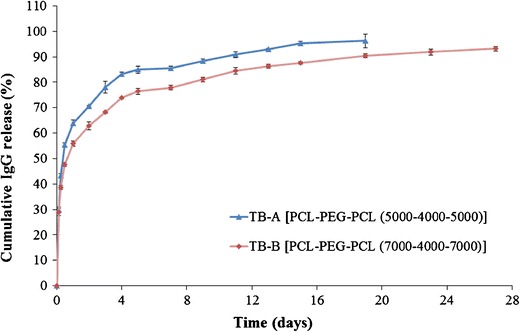
In vitro release of IgG from NPs prepared with TB-A and TB-B block copolymers. Results are described as mean ± SD, n = 3
To evaluate the release of IgG from TB and PB NPs and also to compare the effect of PGA- and PLA-based copolymers, release profiles of IgG from PB-A, PB-B, PB-C, and TB-A NPs were studied (Fig. 9). TB-A NPs exhibited significantly higher burst release (~64%) than any of the PB NPs (~41–49%). Moreover, PB NPs prolonged IgG release for more than 27 days, whereas TB-A NPs sustained the release for only 15 days. In addition, we have observed a noticeable effect of polymer structure on the burst release as well as the duration of the release. Surprisingly, burst release observed for PB-C (~49%) and PB-A (~48%) NPs was significantly higher compared to that for PB-B (~41%). PB-C NPs released ~93% of IgG over the period of 27 days, whereas PB-A (~91%) and PB-B (~90%) NPs prolonged the release to 31 and 35 days, respectively.
Fig. 9.
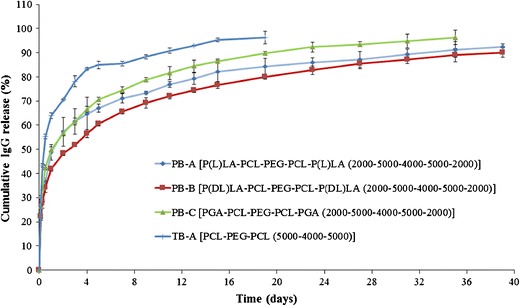
In vitro release of IgG from NPs prepared with TB-A, PB-A, PB-B, and PB-C block copolymers. Results are described as mean ± SD, n = 3
As described earlier, PGA-based PB-C copolymer is relatively hydrophilic than PLA-based PB-A and PB-B copolymers. It is anticipated that PB-C NPs may have a higher affinity for the protein molecules; hence, these NPs may accumulate higher amounts of surface-adsorbed drug. Being hydrophilic, PB-C NPs may get easily hydrated allowing rapid diffusion of water molecules into the polymeric matrix. Both higher amounts of surface-adsorbed drug and higher water affinity contributed to higher burst release and shorter duration of days. The effect of isomerism on drug release was studied by comparing the release profiles of PB-A and PB-B copolymers. PB-A copolymers exhibited a higher burst release with shorter sustained release phase relative to PB-B copolymers. As observed in XRD studies, PB-A copolymer is more crystalline than PB-B copolymer. In other words, polymer chains in PB-A NPs may be in a more ordered arrangement than the PB-B NPs. Due to the ordered arrangements, highly crystalline materials may form channels during the preparation of NPs. Numbers and length of channels in PB-A NPs might be higher than those in PB-B NPs. Water molecules may easily diffuse into the NPs through these channels facilitating the release of IgG. This phenomenon may have contributed to the higher burst release and faster rate of IgG release from PB-A NPs relative to PB-B NPs. Therefore, a specific arrangement of these block copolymers can have a significant effect on drug release.
The molecular structures of PB-D, PB-E, and PB-F are identical with the polymer compositions of PB-A, PB-B, and PB-C, respectively, and just different in terms of molecular weights. If our previous explanations regarding the effect of molecular weight (TB-A vs TB-B) and isomerism (PB-A and PB-B) on burst release and sustained release are correct, then we should also observe the same trends with PB-D, PB-E, and PB-F NPs as well. In order to validate these results, we have studied three more PB NPs, i.e., PB-D, PB-E, and PB-F. As shown in Fig. 10, PB-F exhibited ~92% of IgG release within 52 days with a burst release of ~43%. PB-D and PB-E demonstrated ~84% and ~87% of IgG release over the period of 55 and 59 days, respectively. However, all the PB NPs display longer sustained release and lower burst release compared to TB-B NPs. These results clearly indicate that PB-D, PB-E, and PB-F NPs follow a similar trend of burst release and sustained release as those of PB-A, PB-B, and PB-C NPs.
Fig. 10.
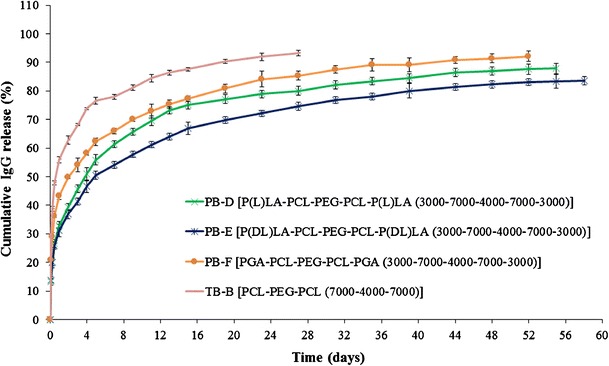
In vitro release of IgG from NPs prepared with TB-B, PB-D, PB-E, and PB-F block copolymers. Results are described as mean ± SD, n = 3
To understand the effect of molecular weights on burst release as well as duration of release, we have compared the release profiles of PB-A and PB-D NPs (Fig. 11a), PB-B and PB-E NPs (Fig. 11b), and PB-C and PB-F NPs (Fig. 11c). As discussed earlier, an increase in molecular weight of hydrophobic segments (PCL-PLA) also enhances hydrophobicity and polymer chain length. Hydrophobic copolymers may have lower affinity with water and, hence, restrict hydration of NPs. This process may have resulted in less diffusion of water in NPs and eventually exhibited prolonged IgG release. Moreover, longer polymer chain length may have increased the mesh-like structure and reduced the effective porosity of NPs resulting in a longer path for diffusion of IgG from NPs. In addition, previous reports suggest that a higher molecular weight slows down the rate of polymer degradation (35). Therefore, PB-D, PB-E, and PB-F exhibit a slower rate of degradation relative to PB-A, PB-B, and PB-C, respectively, resulting in slower IgG release.
Fig. 11.
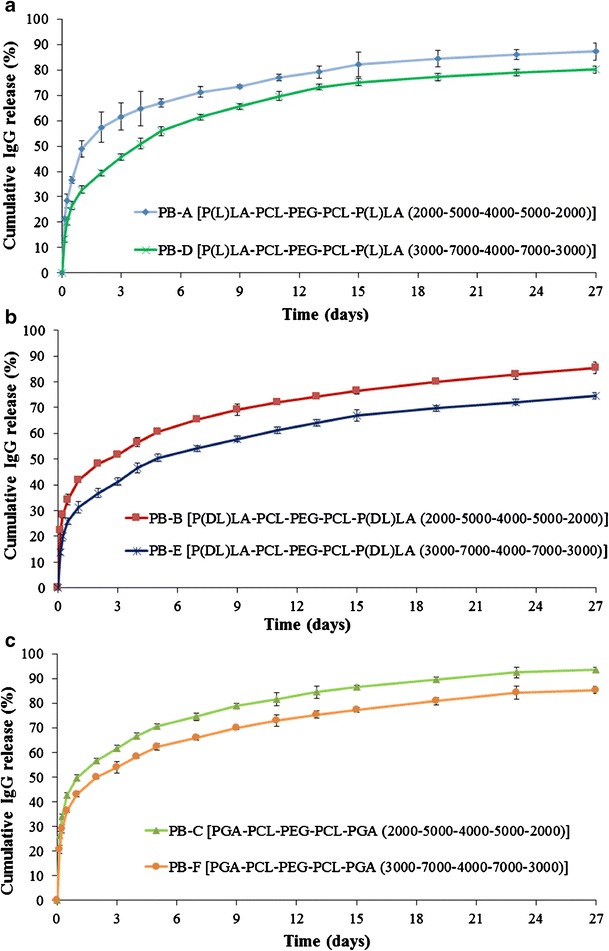
Effect of molecular weights of block copolymers on in vitro release of IgG a PB-A and PB-D NPs, b PB-B and PB-E NPs, and c PB-C and PB-F NPs. Results are described as mean ± SD, n = 3
Secondary Structure Stability Estimation of IgG
It is pivotal for protein therapeutics to maintain structural conformation to retain biological activity. CD spectroscopy is a very sensitive analytical technique utilized for the estimation of secondary and, to some extent, tertiary structures of proteins. It provides conformational information of α-helix and β-sheets and also able to detect any minor changes in conformations. Therefore, we have employed CD spectroscopy to study the conformational stability of released IgG (after 15 days) and compared it with the CD spectra of native IgG. Figure 12 shows λ minima of released IgG at 218 nm, which is similar to the λ minima of native IgG. Moreover, the entire spectra of released IgG ranging from 200 to 250 nm were also identical to native IgG, suggesting retention of secondary conformation of IgG during NP preparation and release from NPs. Previous reports suggest that PLA- and/or PGA-based copolymer produces a large molar mass of lactic acid and/or glycolic acid (18,19). These degradation products can stimulate hydrolytic degradation of protein therapeutics. Retention of protein stability in PB NPs may be attributed to the lower molar mass of PLA or PGA blocks which produce very low amounts of lactic or glycolic acid limiting protein degradation. Therefore, PB copolymers appear to be suitable for the development of sustained release protein formulations.
Fig. 12.
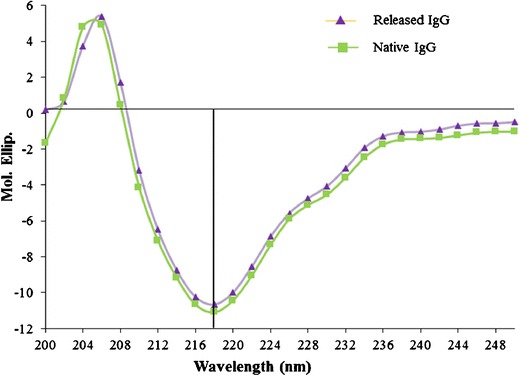
CD spectra of released IgG from PB-E NPs (after 15 days) compared with the CD spectra of native IgG
CONCLUSIONS
We have successfully synthesized and characterized novel PB copolymers with different block ratios of PEG/PCL/PLA or PEG/PCL/PGA. These PB copolymers were utilized for the development of protein-loaded NPs in the treatment of posterior ocular segment diseases such as wet AMD and DR. Results demonstrate that crystallinity of PB copolymers can be easily modulated by changing the ratios of PLA/PCL or PGA/PCL blocks and also by utilizing different isomers of PLA (l or d,l). Moreover, this study suggests that molecular weight, crystallinity, and copolymer composition can produce a significant effect on entrapment efficiency, drug loading, and in vitro release kinetics. PB copolymers composed of PLA with d,l-lactide exhibited higher entrapment efficiency and slower release relative to PB copolymers comprising PLA (l-lactide) or PGA. Conformational stability of released IgG was established by CD spectroscopy. In addition, cytotoxicity, cell viability, and in vitro inflammatory cytokine release study confirmed that PB copolymers are excellent biomaterials for the development of protein-loaded sustained delivery formulation for the treatment of posterior segment ocular diseases.
ACKNOWLEDGMENTS
This study was supported by NIH R01 EY09171-14 and NIH RO1 EY10659-12. We are greatly thankful to Dr. James Murowchick (Department of Geosciences, UMKC) for helping in XRD analysis, Dr. Zhonghua Peng (Department of Chemistry, UMKC) for his assistance in GPC analysis, and Dr. Natalya Shipulina (School of Biological Sciences, UMKC) for helping us during CD spectroscopy analysis.
Conflict of Interest
Authors have declared a conflict of interest with I-Novion Inc.
REFERENCES
- 1.Moutray T, Chakravarthy U. Age-related macular degeneration: current treatment and future options. Ther Adv Chronic Dis. 2011;2(5):325–31. doi: 10.1177/2040622311415895. [DOI] [PMC free article] [PubMed] [Google Scholar]
- 2.Kulkarni AD, Kuppermann BD. Wet age-related macular degeneration. Adv Drug Deliv Rev. 2005;57(14):1994–2009. doi: 10.1016/j.addr.2005.09.003. [DOI] [PubMed] [Google Scholar]
- 3.Leung DW, Cachianes G, Kuang WJ, Goeddel DV, Ferrara N. Vascular endothelial growth factor is a secreted angiogenic mitogen. Science. 1989;246(4935):1306–9. doi: 10.1126/science.2479986. [DOI] [PubMed] [Google Scholar]
- 4.Ozturk BT, Kerimoglu H, Bozkurt B, Okudan S. Comparison of intravitreal bevacizumab and ranibizumab treatment for diabetic macular edema. J Ocul Pharmacol Ther. 2011;27(4):373–7. doi: 10.1089/jop.2010.0195. [DOI] [PubMed] [Google Scholar]
- 5.Bakri SJ, Snyder MR, Reid JM, Pulido JS, Singh RJ. Pharmacokinetics of intravitreal bevacizumab (Avastin) Ophthalmology. 2007;114(5):855–9. doi: 10.1016/j.ophtha.2007.01.017. [DOI] [PubMed] [Google Scholar]
- 6.Peyman GA, Lad EM, Moshfeghi DM. Intravitreal injection of therapeutic agents. Retina. 2009;29(7):875–912. doi: 10.1097/IAE.0b013e3181a94f01. [DOI] [PubMed] [Google Scholar]
- 7.Jager RD, Aiello LP, Patel SC, Cunningham ET., Jr Risks of intravitreous injection: a comprehensive review. Retina. 2004;24(5):676–98. doi: 10.1097/00006982-200410000-00002. [DOI] [PubMed] [Google Scholar]
- 8.Sampat KM, Garg SJ. Complications of intravitreal injections. Curr Opin Ophthalmol. 2010;21(3):178–83. doi: 10.1097/ICU.0b013e328338679a. [DOI] [PubMed] [Google Scholar]
- 9.Lee SH, Zhang Z, Feng SS. Nanoparticles of poly(lactide)-tocopheryl polyethylene glycol succinate (PLA-TPGS) copolymers for protein drug delivery. Biomaterials. 2007;28(11):2041–50. doi: 10.1016/j.biomaterials.2007.01.003. [DOI] [PubMed] [Google Scholar]
- 10.Jia W, Gu Y, Gou M, Dai M, Li X, Kan B, et al. Preparation of biodegradable polycaprolactone/poly (ethylene glycol)/polycaprolactone (PCEC) nanoparticles. Drug Deliv. 2008;15(7):409–16. doi: 10.1080/10717540802321727. [DOI] [PubMed] [Google Scholar]
- 11.Bilati U, Allemann E, Doelker E. Poly(D, L-lactide-co-glycolide) protein-loaded nanoparticles prepared by the double emulsion method—processing and formulation issues for enhanced entrapment efficiency. J Microencapsul. 2005;22(2):205–14. doi: 10.1080/02652040400026442. [DOI] [PubMed] [Google Scholar]
- 12.Perez C, Castellanos IJ, Costantino HR, Al-Azzam W, Griebenow K. Recent trends in stabilizing protein structure upon encapsulation and release from bioerodible polymers. J Pharm Pharmacol. 2002;54(3):301–13. doi: 10.1211/0022357021778448. [DOI] [PubMed] [Google Scholar]
- 13.Putney SD. Encapsulation of proteins for improved delivery. Curr Opin Chem Biol. 1998;2(4):548–52. doi: 10.1016/S1367-5931(98)80133-6. [DOI] [PubMed] [Google Scholar]
- 14.Kumar TR, Soppimath K, Nachaegari SK. Novel delivery technologies for protein and peptide therapeutics. Curr Pharm Biotechnol. 2006;7(4):261–76. doi: 10.2174/138920106777950852. [DOI] [PubMed] [Google Scholar]
- 15.van de Weert M, Hennink WE, Jiskoot W. Protein instability in poly(lactic-co-glycolic acid) microparticles. Pharm Res. 2000;17(10):1159–67. doi: 10.1023/A:1026498209874. [DOI] [PubMed] [Google Scholar]
- 16.Sah H. Stabilization of proteins against methylene chloride/water interface-induced denaturation and aggregation. J Control Release Off J Control Release Soc. 1999;58(2):143–51. doi: 10.1016/S0168-3659(98)00148-5. [DOI] [PubMed] [Google Scholar]
- 17.Fu K, Pack DW, Klibanov AM, Langer R. Visual evidence of acidic environment within degrading poly(lactic-co-glycolic acid) (PLGA) microspheres. Pharm Res. 2000;17(1):100–6. doi: 10.1023/A:1007582911958. [DOI] [PubMed] [Google Scholar]
- 18.Zablotna E, Jaskiewicz A, Legowska A, Miecznikowska H, Lesner A, Rolka K. Design of serine proteinase inhibitors by combinatorial chemistry using trypsin inhibitor SFTI-1 as a starting structure. J Pept Sci. 2007;13(11):749–55. doi: 10.1002/psc.887. [DOI] [PubMed] [Google Scholar]
- 19.Zhang Y, Schwendeman SP. Minimizing acylation of peptides in PLGA microspheres. J Control Release Off J Control Release Soc. 2012;162(1):119–26. doi: 10.1016/j.jconrel.2012.04.022. [DOI] [PMC free article] [PubMed] [Google Scholar]
- 20.Wang J, Chua KM, Wang CH. Stabilization and encapsulation of human immunoglobulin G into biodegradable microspheres. J Colloid Interface Sci. 2004;271(1):92–101. doi: 10.1016/j.jcis.2003.08.072. [DOI] [PubMed] [Google Scholar]
- 21.Gou M, Gong C, Zhang J, Wang X, Gu Y, Guo G, et al. Polymeric matrix for drug delivery: honokiol-loaded PCL-PEG-PCL nanoparticles in PEG-PCL-PEG thermosensitive hydrogel. J Biomed Mater Res A. 2010;93(1):219–26. doi: 10.1002/jbm.a.32546. [DOI] [PubMed] [Google Scholar]
- 22.Jwala J, Vadlapatla RK, Vadlapudi AD, Boddu SH, Pal D, Mitra AK. Differential expression of folate receptor-alpha, sodium-dependent multivitamin transporter, and amino acid transporter (B (0, +)) in human retinoblastoma (Y-79) and retinal pigment epithelial (ARPE-19) cell lines. J Ocul Pharmacol Ther. 2012;28(3):237–44. doi: 10.1089/jop.2011.0155. [DOI] [PMC free article] [PubMed] [Google Scholar]
- 23.Pissuwan D, Boyer C, Gunasekaran K, Davis TP, Bulmus V. In vitro cytotoxicity of RAFT polymers. Biomacromolecules. 2010;11(2):412–20. doi: 10.1021/bm901129x. [DOI] [PubMed] [Google Scholar]
- 24.Prabhu A, Shelburne CE, Gibbons DF. Cellular proliferation and cytokine responses of murine macrophage cell line J774A.1 to polymethylmethacrylate and cobalt-chrome alloy particles. J Biomed Mater Res. 1998;42(4):655–63. doi: 10.1002/(SICI)1097-4636(19981215)42:4<655::AID-JBM23>3.0.CO;2-B. [DOI] [PubMed] [Google Scholar]
- 25.Bilati U, Allemann E, Doelker E. Sonication parameters for the preparation of biodegradable nanocapsules of controlled size by the double emulsion method. Pharm Dev Technol. 2003;8(1):1–9. doi: 10.1081/PDT-120017517. [DOI] [PubMed] [Google Scholar]
- 26.Tang L, Azzi J, Kwon M, Mounayar M, Tong R, Yin Q, et al. Immunosuppressive activity of size-controlled PEG-PLGA nanoparticles containing encapsulated cyclosporine A. J Transplant. 2012;2012:896141. doi: 10.1155/2012/896141. [DOI] [PMC free article] [PubMed] [Google Scholar]
- 27.Bazile D, Prud’homme C, Bassoullet MT, Marlard M, Spenlehauer G, Veillard M. Stealth Me.PEG-PLA nanoparticles avoid uptake by the mononuclear phagocytes system. J Pharm Sci. 1995;84(4):493–8. doi: 10.1002/jps.2600840420. [DOI] [PubMed] [Google Scholar]
- 28.Sabir MI, Xu X, Li L. A review on biodegradable polymeric materials for bone tissue engineering applications. J Mater Sci. 2009;44:5713–24. doi: 10.1007/s10853-009-3770-7. [DOI] [Google Scholar]
- 29.Huang MH, Li S, Vert M. Synthesis and degradation of PLA–PCL–PLA triblock copolymer prepared by successive polymerization of ε-caprolactone and DL-lactide. Polymer. 2004;45:8675–81. doi: 10.1016/j.polymer.2004.10.054. [DOI] [Google Scholar]
- 30.Frank A, Rath SK, Venkatraman SS. Controlled release from bioerodible polymers: effect of drug type and polymer composition. J Control Release Off J Control Release Soc. 2005;102(2):333–44. doi: 10.1016/j.jconrel.2004.10.019. [DOI] [PubMed] [Google Scholar]
- 31.Huang MH, Li S, Hutmacher DW, Schantz JT, Vacanti CA, Braud C, et al. Degradation and cell culture studies on block copolymers prepared by ring opening polymerization of epsilon-caprolactone in the presence of poly(ethylene glycol) J Biomed Mater Res A. 2004;69(3):417–27. doi: 10.1002/jbm.a.30008. [DOI] [PubMed] [Google Scholar]
- 32.Li S, Molina I, Martinez MB, Vert M. Hydrolytic and enzymatic degradations of physically crosslinked hydrogels prepared from PLA/PEO/PLA triblock copolymers. J Mater Sci Mater Med. 2002;13(1):81–6. doi: 10.1023/A:1013651022431. [DOI] [PubMed] [Google Scholar]
- 33.Li S, Dobrzynski P, Kasperczyk J, Bero M, Braud C, Vert M. Structure–property relationships of copolymers obtained by ring-opening polymerization of glycolide and epsilon-caprolactone. Part 2. Influence of composition and chain microstructure on the hydrolytic degradation. Biomacromolecules. 2005;6(1):489–97. doi: 10.1021/bm049458+. [DOI] [PubMed] [Google Scholar]
- 34.Chen CC, Chueh JY, Tseng H, Huang HM, Lee SY. Preparation and characterization of biodegradable PLA polymeric blends. Biomaterials. 2003;24(7):1167–73. doi: 10.1016/S0142-9612(02)00466-0. [DOI] [PubMed] [Google Scholar]
- 35.Park TG. Degradation of poly (D, L-lactic acid) microspheres: effect of molecular weight. J Control Release. 1994;30:161–73. doi: 10.1016/0168-3659(94)90263-1. [DOI] [Google Scholar]


