

Financial burden is prevalent among cancer survivors and is related to patients' health-related quality of life. Future studies should consider interventions to improve patient education and engagement with regard to financial burden.
Abstract
Purpose:
The impact of financial burden among patients with cancer has not yet been measured in a way that accounts for inter-relationships between quality of life, perceived quality of care, disease status, and sociodemographic characteristics.
Patients and Methods:
In a national, prospective, observational, population- and health care systems–based cohort study, patients with colorectal or lung cancer were enrolled from 2003 to 2006 within 3 months of diagnosis. For this analysis, surviving patients who were either disease free or had advanced disease were resurveyed a median 7.3 years from diagnosis. Structural equation modeling was used to investigate relationships between financial burden, quality of life, perceived quality of care, and sociodemographic characteristics.
Results:
Among 1,000 participants enrolled from five geographic regions, five integrated health care systems, or 15 Veterans Administration Hospitals, 89% (n = 889) were cancer free, and 11% (n = 111) had advanced cancer. Overall, 48% (n = 482) reported difficulties living on their household income, and 41% (n = 396) believed their health care to be “excellent.” High financial burden was associated with lower household income (adjusted odds ratio [OR] = 0.61 per $20k per year, P < .001) and younger age (adjusted OR = 0.63 per 10 years; P < .001). High financial burden was also associated with poorer quality of life (adjusted beta = −0.06 per burden category; P < .001). Better quality of life was associated with fewer perceptions of poorer quality of care (adjusted OR = 0.85 per 0.10 EuroQol units; P < .001).
Conclusion:
Financial burden is prevalent among cancer survivors and is related to patients' health-related quality of life. Future studies should consider interventions to improve patient education and engagement with regard to financial burden.
Introduction
Financial burden is a growing problem for patients. In a study by the Centers for Disease Control and Prevention, nearly a third of families in 2011 reported financial burden related to health care. More than 10% had medical bills they were unable to pay at all.1 To keep up with rising costs, third-party payers have shifted a portion of this growing cost burden to patients in the form of coinsurance, copayments, and tiered formularies, among others.2 As a result of an aging population and expensive interventions, cancer is one of the most expensive diseases to treat in the United States.3 Moreover, patients with cancer pay more out of pocket for their health care compared with those with other chronic diseases.4 As a result, patients with cancer and cancer survivors are at risk of experiencing considerable financial burden—including declaring bankruptcy—despite in many cases having insurance.5–8
The financial burden of patients' cost sharing has also harmed the quality of cancer treatment. Patients with pharmacy benefit plans that require high cost sharing are more likely to discontinue oral chemotherapy.9 Among patients with breast cancer, higher copayments for hormonal therapy are associated with a higher likelihood of nonadherence with those drugs.10 These and other studies demonstrate a link between financial burden and treatment, but little work has been done to understand how financial burden relates to broader measures such as health-related quality of life and perceived quality of care.
The impact of financial burden has not yet been measured in a way that accounts for these inter-relationships. Understanding how financial burden affects patients with cancer and their care is critical for designing well-timed, focused interventions to prevent financial burden before it adversely affect quality of life and care. Using data from the national Cancer Care Outcomes Research and Surveillance (CanCORS) II study, we used a comprehensive analytic method and sought to describe associations between financial burden and disease status, quality of life, comorbidities, sociodemographics, and perceived quality of care. We hypothesized that greater financial burden would be associated with worsened quality of life and perceived quality of care, as moderated by disease status, comorbidities, and key demographic characteristics.
Patients and Methods
Study Design
CanCORS II is a companion study to CanCORS, a prospective, observational, population- and health care systems–based cohort study to determine how characteristics and beliefs of patients with cancer, providers, and health care organizations influence treatments and outcomes.11 CanCORS II collected self-reported survey and medical record data for a subset of the participants originally enrolled in CanCORS. Participants were contacted by phone and invited to participate in the follow-up study, also conducted by phone. Patient surveys were completed in English, Chinese, and Spanish using computer-assisted telephone interviews. A surrogate (relative or household member) familiar with the patient's cancer care was interviewed for patients who had died or were too ill to be interviewed. Trained abstractors at each of the data-collection sites abstracted medical record data, including cancer diagnosis, stage, treatment, and details of medical decision making.
Participants
For CanCORS, patients with colorectal or lung cancer were enrolled from one of the following: five geographic regions, five integrated health care systems in the National Cancer Institute–funded Cancer Research Network, or 15 Veterans Administration (VA) Hospitals from September 2003 to January 2006, within 3 months of diagnosis. For CanCORS II, two patient subcohorts were recontacted at a median of 7.3 years after diagnosis (range 5.9 to 8.7 years): a survivor cohort, defined as patients who underwent successful treatment for stages I-III cancer and remained disease free; and an advanced disease subcohort, defined as patients with recurrent or progressive cancer (or their surrogates) and surrogates for deceased patients. Surrogates for living patients were asked about patient quality of life. Surrogate surveys for deceased patients were not included.
Separate surveys were used for each subcohort. The survey instruments are publically available.12 Human subject committees approved the study protocol at each participating site.
Outcomes and Variables
Two measures of financial burden were assessed: (1) participants were asked how much difficulty they had with living on their total household income, and (2) participants were asked whether the quality of their insurance had changed. Financial burden was defined as greater likelihood of difficulty living on household income (Not at all difficult, Somewhat difficult, Difficult or can barely get by, Very difficult, or Extremely difficult or impossible). Quality of insurance status was not used as an outcome in the model because of the small percentage of patients who reported a change in insurance. Health-related quality of life was measured with the EuroQol self-reported, validated measure (EQ-5D).13,14 Perceived quality of care was measured with a single item scored on a 5-point Likert scale (“Overall, how would you rate the quality of your health care in the past 12 months?”). Disease status was defined as being either cancer free or having advanced cancer. Comorbid diseases at the time of diagnosis were measured with the Adult Comorbidity Evaluation-27.15 Other variables of interest included, all at the time of diagnosis: age, cancer stage, highest educational attainment, living with a partner, sex, race, insurance status, annual household income.
Statistical Analyses
Demographic and clinical characteristics were summarized using frequency and percent (categorical characteristics), and median and range (continuous descriptors). Structural equation modeling was used to investigate relationships between variables. Structural equation modeling is a multivariable statistical framework that uses linear and logistic regression, factor analysis, and path analysis to simultaneously test complex relationships between variables.16 Commonly used in the social sciences, structural equation modeling is also recommended in epidemiologic settings because of its increased statistical efficiency and flexibility.17,18 Structural equation modeling is useful when (1) more than one regression analysis is needed to test multiple, inter-related outcomes of differing types (eg, continuous and binary); or (2) an outcome is influenced directly by predictor variables and by unobserved variables.19
In this analysis, a type of structural equation modeling (path analysis), was used to simultaneously estimate the associations between the potentially inter-related outcomes of financial burden, disease status, quality of life, and perceived quality of care, while taking into account additional associations with the previously listed, prespecified patient characteristics. Model estimation was performed using maximum likelihood with Monte Carlo integration. Because structural equation modeling is not used commonly, we conducted sensitivity analyses using standard multivariable logistic and linear regression as means to confirm results from the structural equation modeling. Statistical analyses were completed using Mplus version 6.11 (Muthén and Muthén, Los Angeles, CA) and SAS version 9.2 (SAS Institute, Cary, NC).
Results
Cohort Characteristics
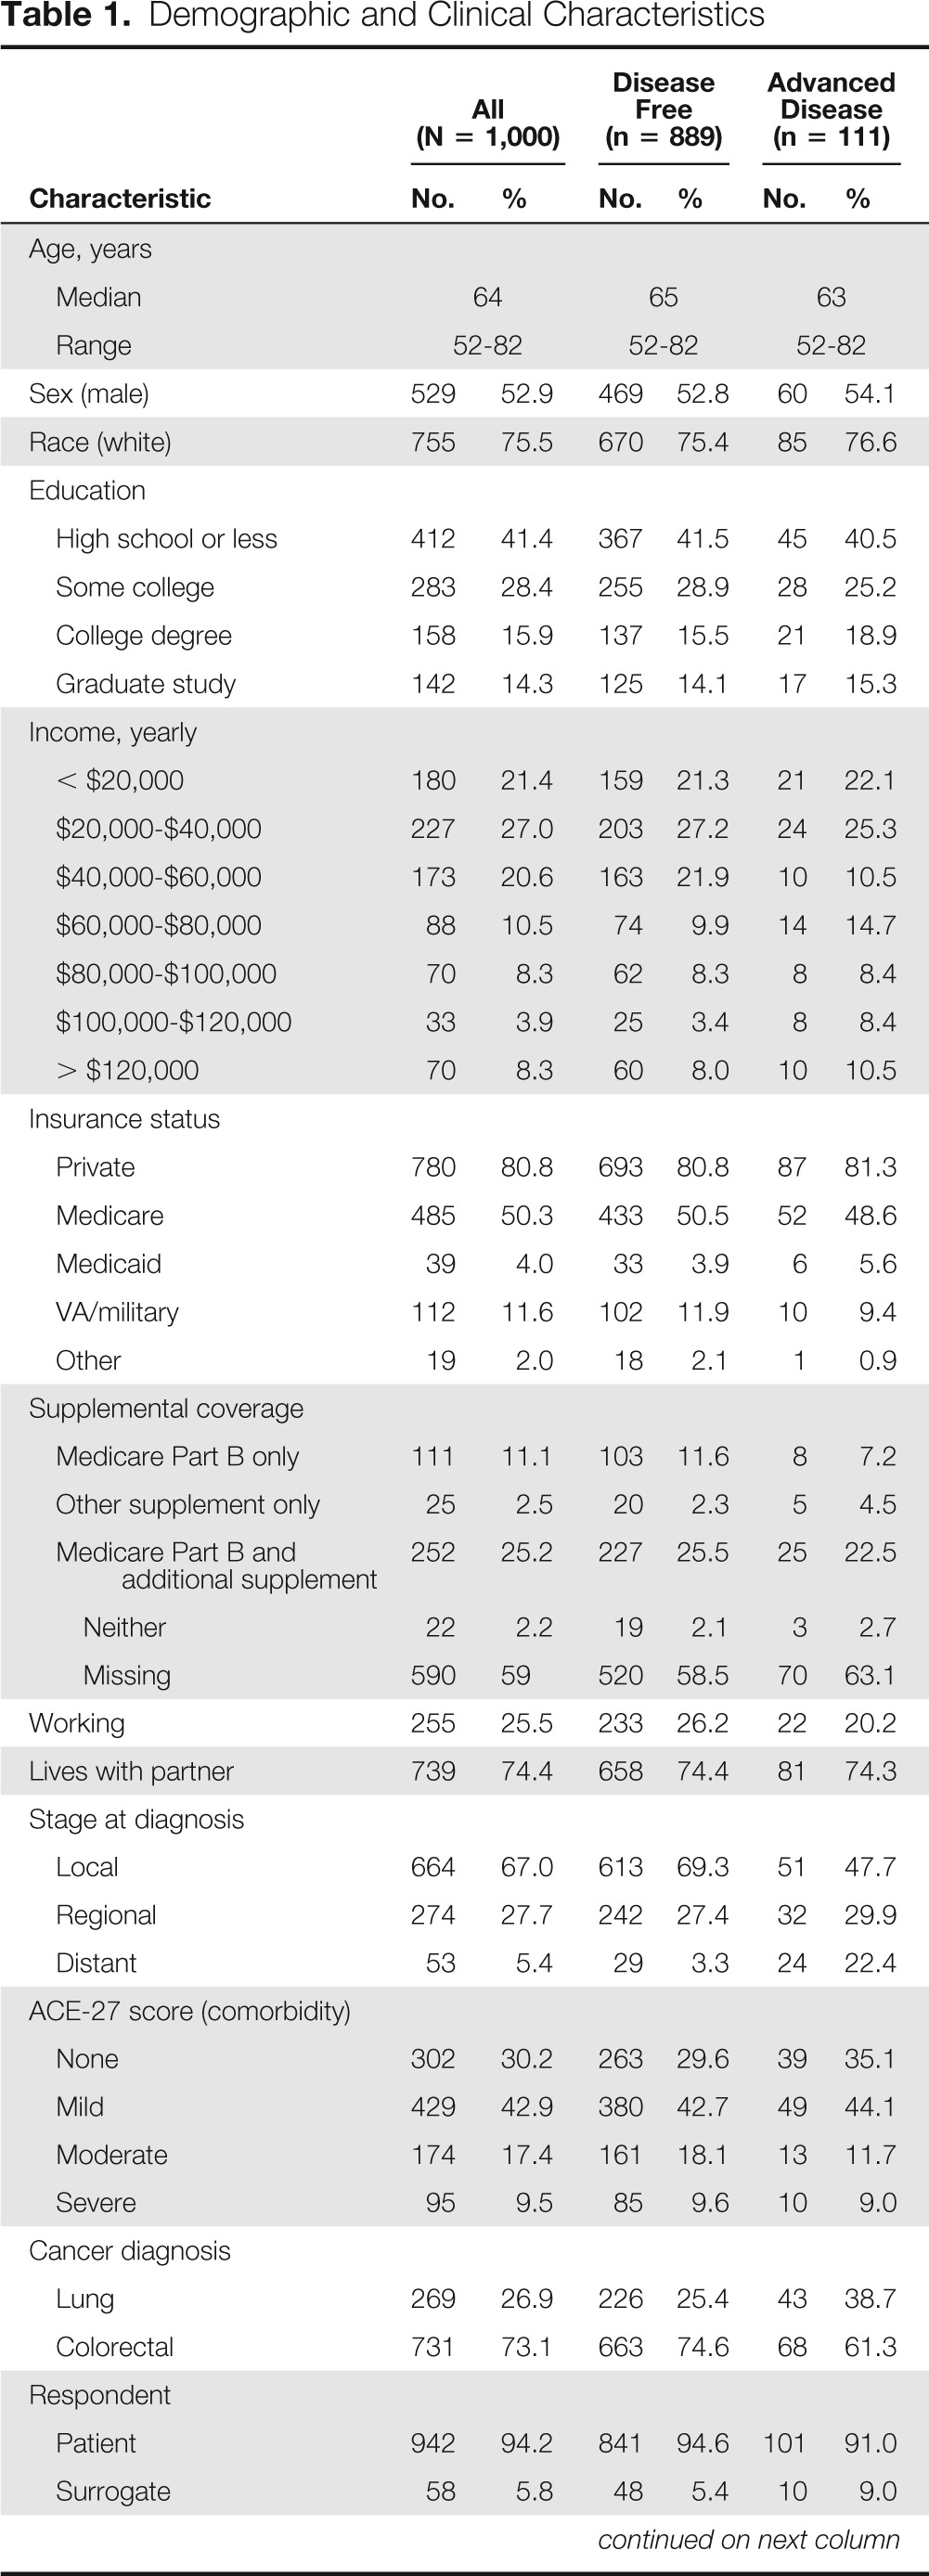
Patient characteristics are summarized in Table 1. Eighty-nine percent (n = 889) of participants were cancer free at the time of completing the survey (survivor subcohort); 11% (n = 111) had advanced and/or recurrent cancer. Fifty-three percent (n = 529) were male, 76% (n = 755) were white, and the median age of the cohort was 64 years. Six percent (n = 58) of surveys were completed by surrogates on behalf of living patients who were too sick to complete the survey. No surrogates for patients known to be deceased at the time of the survey were included.
Table 1.
Demographic and Clinical Characteristics
| Characteristic | All (N = 1,000) |
Disease Free (n = 889) |
Advanced Disease (n = 111) |
|||
|---|---|---|---|---|---|---|
| No. | % | No. | % | No. | % | |
| Age, years | ||||||
| Median | 64 | 65 | 63 | |||
| Range | 52-82 | 52-82 | 52-82 | |||
| Sex (male) | 529 | 52.9 | 469 | 52.8 | 60 | 54.1 |
| Race (white) | 755 | 75.5 | 670 | 75.4 | 85 | 76.6 |
| Education | ||||||
| High school or less | 412 | 41.4 | 367 | 41.5 | 45 | 40.5 |
| Some college | 283 | 28.4 | 255 | 28.9 | 28 | 25.2 |
| College degree | 158 | 15.9 | 137 | 15.5 | 21 | 18.9 |
| Graduate study | 142 | 14.3 | 125 | 14.1 | 17 | 15.3 |
| Income, yearly | ||||||
| < $20,000 | 180 | 21.4 | 159 | 21.3 | 21 | 22.1 |
| $20,000-$40,000 | 227 | 27.0 | 203 | 27.2 | 24 | 25.3 |
| $40,000-$60,000 | 173 | 20.6 | 163 | 21.9 | 10 | 10.5 |
| $60,000-$80,000 | 88 | 10.5 | 74 | 9.9 | 14 | 14.7 |
| $80,000-$100,000 | 70 | 8.3 | 62 | 8.3 | 8 | 8.4 |
| $100,000-$120,000 | 33 | 3.9 | 25 | 3.4 | 8 | 8.4 |
| > $120,000 | 70 | 8.3 | 60 | 8.0 | 10 | 10.5 |
| Insurance status | ||||||
| Private | 780 | 80.8 | 693 | 80.8 | 87 | 81.3 |
| Medicare | 485 | 50.3 | 433 | 50.5 | 52 | 48.6 |
| Medicaid | 39 | 4.0 | 33 | 3.9 | 6 | 5.6 |
| VA/military | 112 | 11.6 | 102 | 11.9 | 10 | 9.4 |
| Other | 19 | 2.0 | 18 | 2.1 | 1 | 0.9 |
| Supplemental coverage | ||||||
| Medicare Part B only | 111 | 11.1 | 103 | 11.6 | 8 | 7.2 |
| Other supplement only | 25 | 2.5 | 20 | 2.3 | 5 | 4.5 |
| Medicare Part B and additional supplement | 252 | 25.2 | 227 | 25.5 | 25 | 22.5 |
| Neither | 22 | 2.2 | 19 | 2.1 | 3 | 2.7 |
| Missing | 590 | 59 | 520 | 58.5 | 70 | 63.1 |
| Working | 255 | 25.5 | 233 | 26.2 | 22 | 20.2 |
| Lives with partner | 739 | 74.4 | 658 | 74.4 | 81 | 74.3 |
| Stage at diagnosis | ||||||
| Local | 664 | 67.0 | 613 | 69.3 | 51 | 47.7 |
| Regional | 274 | 27.7 | 242 | 27.4 | 32 | 29.9 |
| Distant | 53 | 5.4 | 29 | 3.3 | 24 | 22.4 |
| ACE-27 score (comorbidity) | ||||||
| None | 302 | 30.2 | 263 | 29.6 | 39 | 35.1 |
| Mild | 429 | 42.9 | 380 | 42.7 | 49 | 44.1 |
| Moderate | 174 | 17.4 | 161 | 18.1 | 13 | 11.7 |
| Severe | 95 | 9.5 | 85 | 9.6 | 10 | 9.0 |
| Cancer diagnosis | ||||||
| Lung | 269 | 26.9 | 226 | 25.4 | 43 | 38.7 |
| Colorectal | 731 | 73.1 | 663 | 74.6 | 68 | 61.3 |
| Respondent | ||||||
| Patient | 942 | 94.2 | 841 | 94.6 | 101 | 91.0 |
| Surrogate | 58 | 5.8 | 48 | 5.4 | 10 | 9.0 |
| Perceived quality of care | ||||||
| Excellent | 396 | 41.0 | 347 | 40.5 | 49 | 45.4 |
| Very good | 334 | 34.6 | 301 | 35.1 | 33 | 30.6 |
| Good | 166 | 17.2 | 146 | 17.0 | 20 | 18.5 |
| Fair | 58 | 6.0 | 53 | 6.2 | 5 | 4.6 |
| Poor | 11 | 1.1 | 10 | 1.2 | 1 | 0.9 |
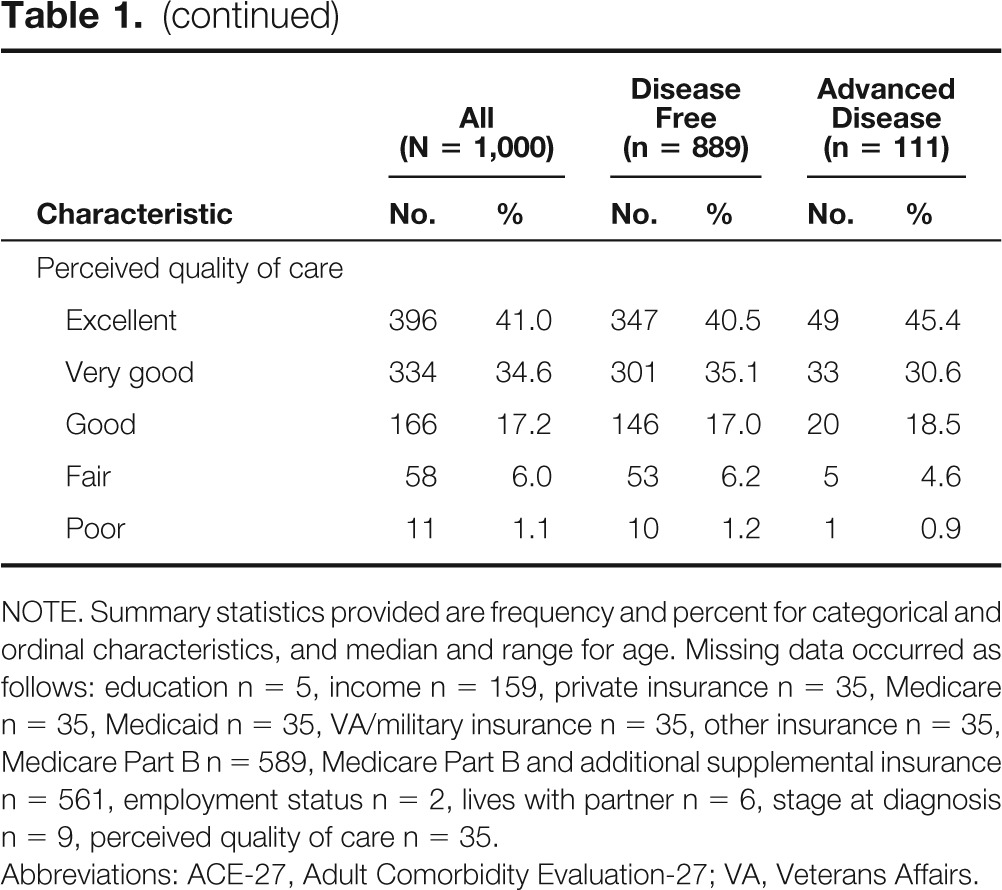
NOTE. Summary statistics provided are frequency and percent for categorical and ordinal characteristics, and median and range for age. Missing data occurred as follows: education n = 5, income n = 159, private insurance n = 35, Medicare n = 35, Medicaid n = 35, VA/military insurance n = 35, other insurance n = 35, Medicare Part B n = 589, Medicare Part B and additional supplemental insurance n = 561, employment status n = 2, lives with partner n = 6, stage at diagnosis n = 9, perceived quality of care n = 35.
Abbreviations: ACE-27, Adult Comorbidity Evaluation-27; VA, Veterans Affairs.
Financial Burden
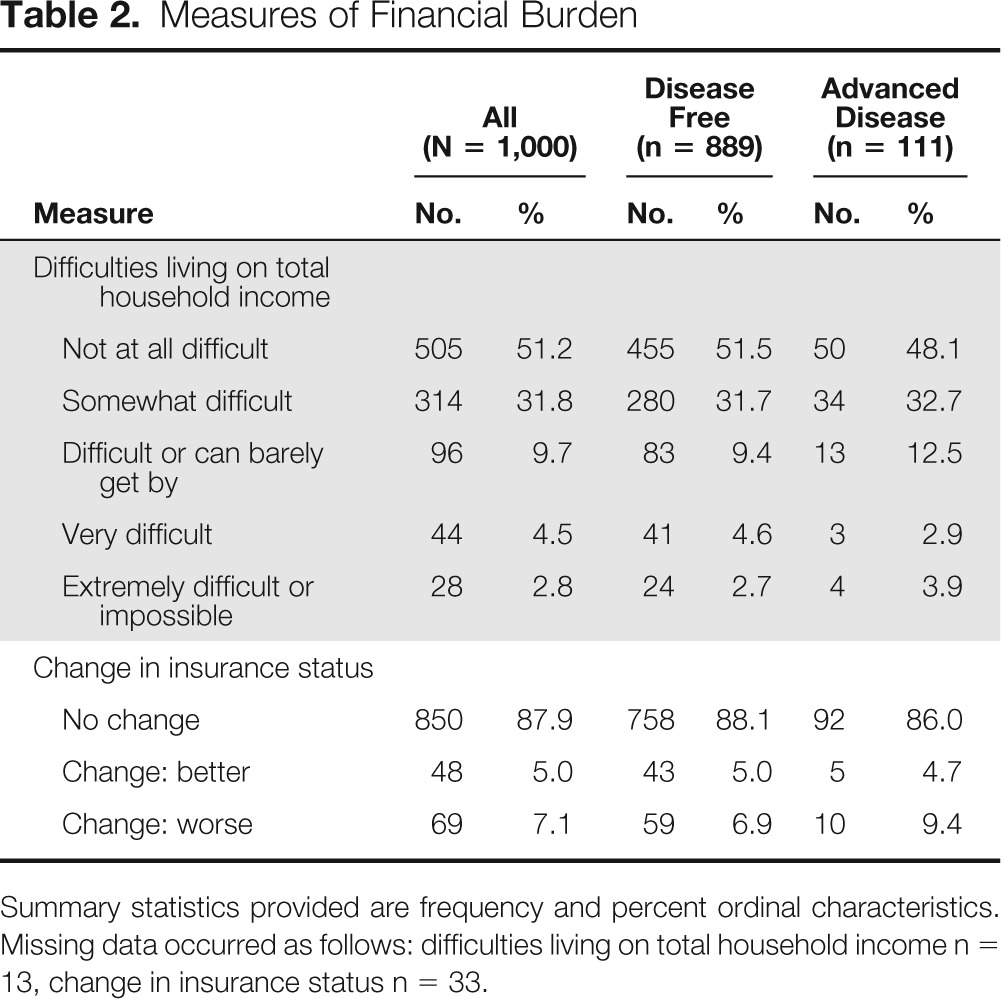
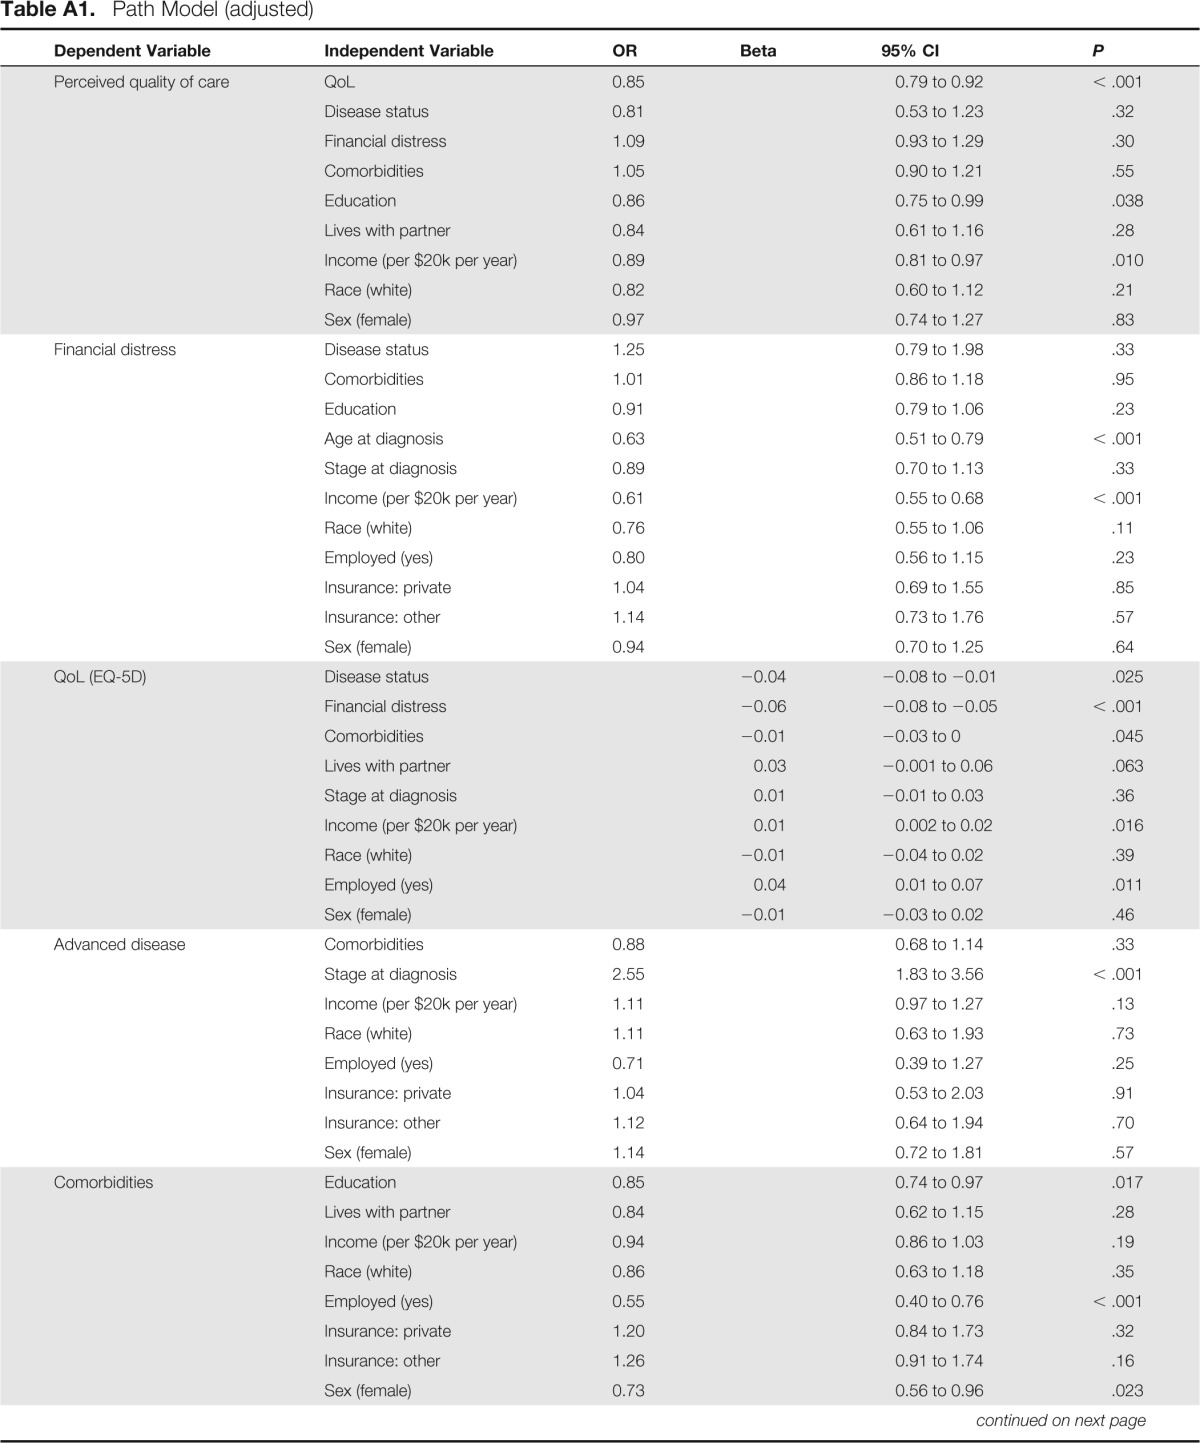
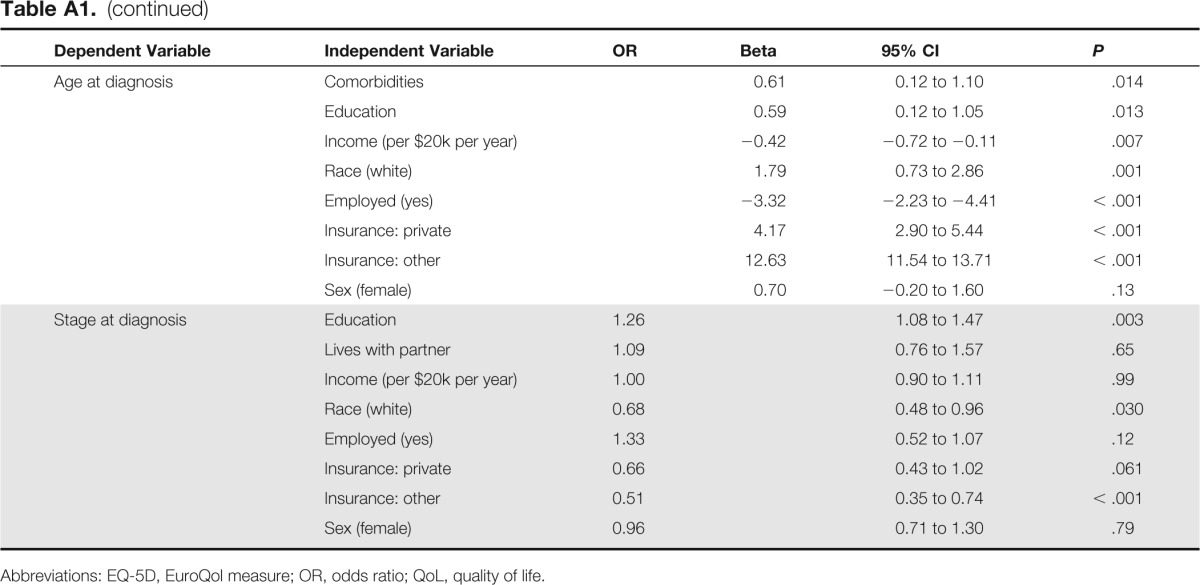
Forty-eight percent of the cohort (n = 482) reported some degree of difficulty in living on their current household income (Table 2). The proportion of patients who reported financial difficulties was similar among patients with advanced disease (49%; n = 54) and those who were cancer free (48%; n = 428). The vast majority had not experienced a change in their insurance status, but 7% (n = 69) reported a change for the worse, whereas 5% (n = 48) reported a change for the better. In unadjusted analyses, higher education, living with a partner, and better quality of life were associated with lower odds of reporting financial difficulties. In the adjusted path model analyses, lower household income and younger age were associated with greater odds of reporting financial burden (Appendix Table A1, online only).
Table 2.
Measures of Financial Burden
| Measure | All (N = 1,000) |
Disease Free (n = 889) |
Advanced Disease (n = 111) |
|||
|---|---|---|---|---|---|---|
| No. | % | No. | % | No. | % | |
| Difficulties living on total household income | ||||||
| Not at all difficult | 505 | 51.2 | 455 | 51.5 | 50 | 48.1 |
| Somewhat difficult | 314 | 31.8 | 280 | 31.7 | 34 | 32.7 |
| Difficult or can barely get by | 96 | 9.7 | 83 | 9.4 | 13 | 12.5 |
| Very difficult | 44 | 4.5 | 41 | 4.6 | 3 | 2.9 |
| Extremely difficult or impossible | 28 | 2.8 | 24 | 2.7 | 4 | 3.9 |
| Change in insurance status | ||||||
| No change | 850 | 87.9 | 758 | 88.1 | 92 | 86.0 |
| Change: better | 48 | 5.0 | 43 | 5.0 | 5 | 4.7 |
| Change: worse | 69 | 7.1 | 59 | 6.9 | 10 | 9.4 |
Summary statistics provided are frequency and percent ordinal characteristics. Missing data occurred as follows: difficulties living on total household income n = 13, change in insurance status n = 33.
Perceived Quality of Care
Participants were asked to rate the quality of their health care. Forty-one percent (n = 396) believed their care to be “excellent,” 35% (n = 334) reported “very good” care, 17% (n = 166) reported “good” care, 6% (n = 58) reported “fair” care, and 1% (n = 11) reported poor-quality care. The latter two categories were collapsed during analysis for reasons of model fit. In unadjusted analyses, lower education, worse quality of life, mild or moderate comorbidity, insurance changes for the worse, and difficulties living on household income were associated with greater likelihood to report poor quality of care. Similarly, in the adjusted path model, worse perceived quality of care was associated with worse health-related quality of life, lower level of education, and lower income (Appendix Table A1).
Relationships Between Primary Outcomes
Structural equation modeling allowed for the evaluation of associations between potentially interrelated variables without the need for variable selection or fitting of multiple separate models. Figure 1 is a simplified representation of the path model focusing on primary outcomes only. Using this adjusted analytic method, greater financial burden was associated with poorer quality of life (adjusted beta = −0.06 EQ-5D units per financial burden category; P < .001). Higher quality of life was associated with reduced likelihood of reporting perceptions of poorer quality of care (adjusted odds ratio = 0.85 per 0.10 EQ-5D units; P < .001); examination of the reverse pathway suggested equivalent model fit (data not shown). Having advanced disease (v being cancer free) was not significantly associated with greater financial burden, but, as expected, it was associated with marginally worse quality of life (adjusted beta = −0.04; P = .025). Apppendix Table A1 presents the same model in greater detail, with associations for additional covariate associations displayed.
Figure 1.

Simplified representation of the path model focusing on primary outcomes only. OR, odds ratio; QoL, quality of life.
Sensitivity Analyses
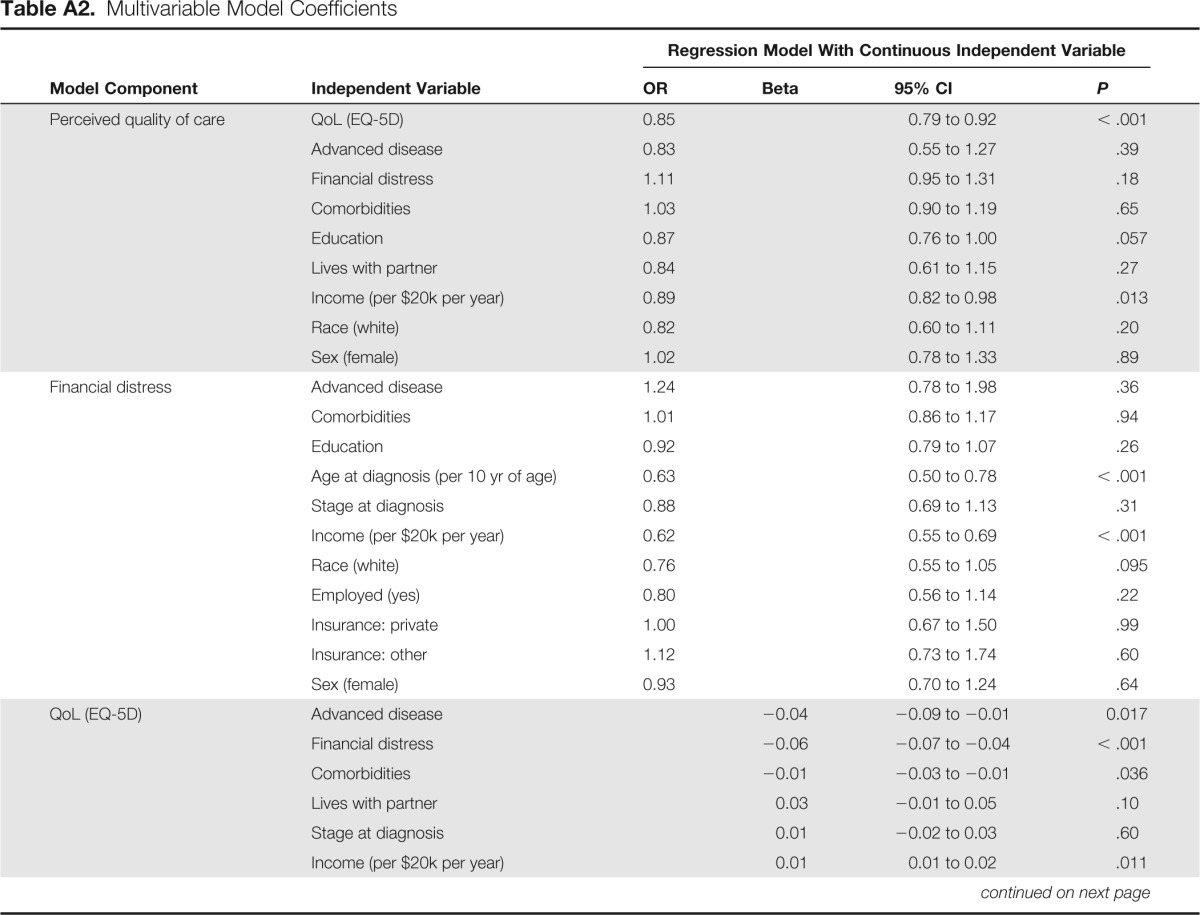
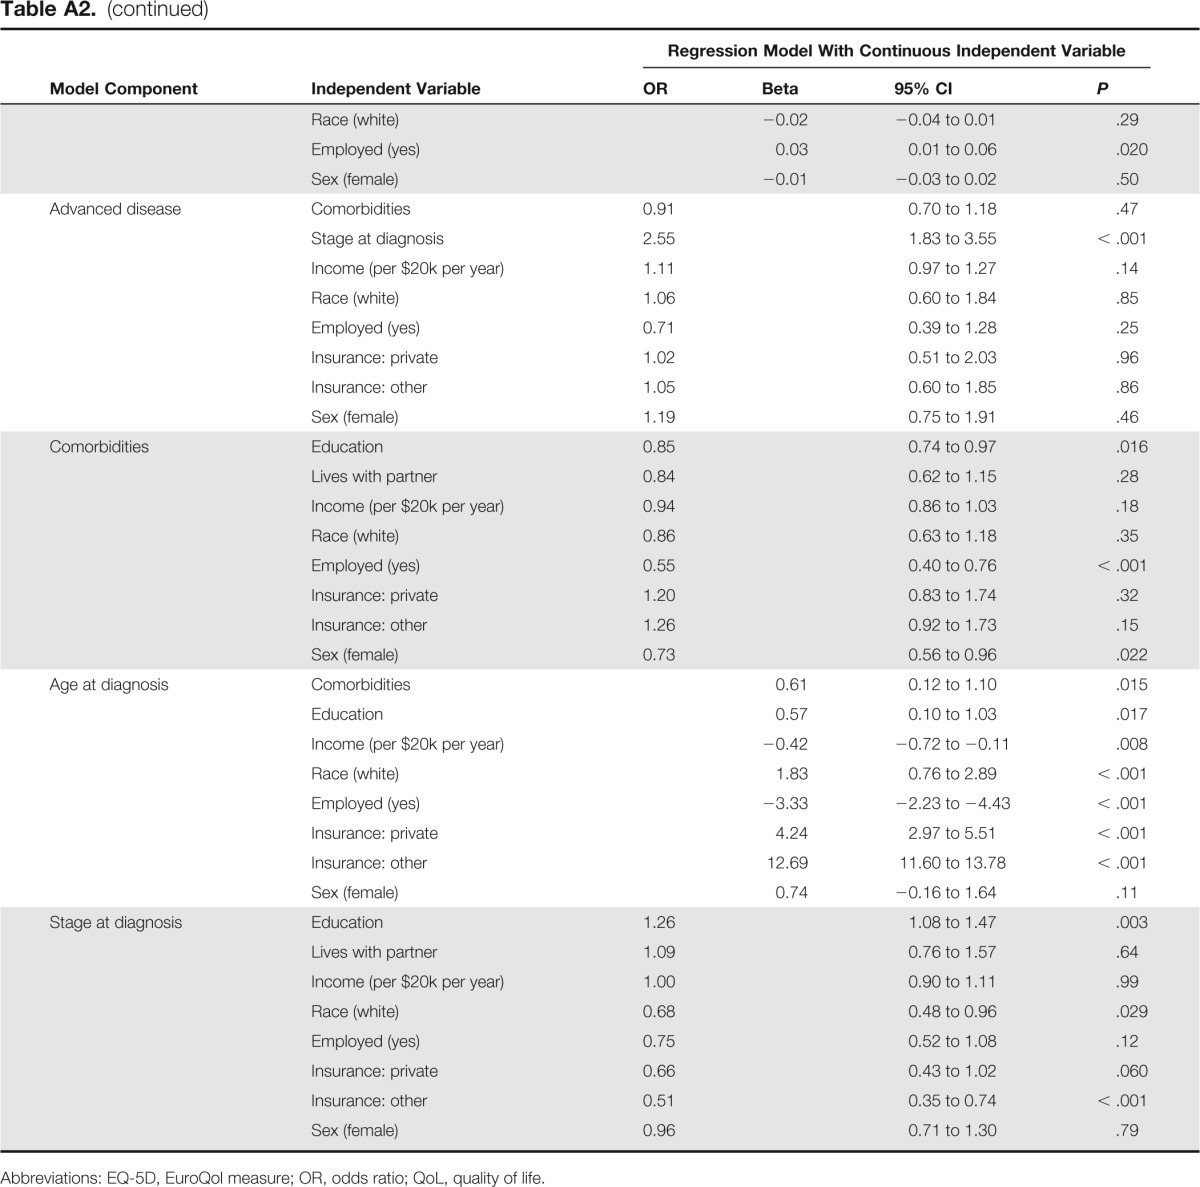
The results of the standard multivariable regression sensitivity analysis were consistent with the adjusted path model analyses (Appendix Table A2, online only). We also explored whether different measures of health-related quality of life might produce different results, in univariable analysis using the 12-item Short Form Survey (SF-12) mental and physical components, the EORTC Quality of Life Questionnaire-Core Questionnaire (QLQ-30), the EuroQol visual analog scale, and the QOL Vitality Scale. The relationships between quality of life and financial burden, and quality of life and perceived quality of care were consistent regardless of quality of life measure (data not shown). In addition, we evaluated the association between responder type (patient v surrogate) and end points. In univariable analysis, the surrogates were somewhat more likely to indicate poor quality of care (odds ratio = 1.81; 95% CI, 1.11 to 2.95).
Discussion
Using data from a national population-based cohort enrolled from academic and community health systems, we evaluated the relationship between financial burden and key patient characteristics and outcomes. Our two key findings were that financial burden is prevalent among cancer survivors and is associated with patients' health-related quality of life, even after adjusting for the effects of income, employment, disease status, comorbidities, and other potential contributors to health-related quality of life. These data are consistent with and build on the findings of a recent study using National Health Interview Survey data, in which increased financial burden was an independent predictor of poor quality of life in cancer survivors.20 Financial burden was not associated with perceived quality of care.
Financial burden is prevalent among cancer patients. Nearly half of our cohort reported some degree of difficulty living on their household income; a minority reported severe difficulties in making ends meet. A growing body of literature describes the “financial toxicity” resulting from cancer and cancer treatment, including depletion of retirement savings, personal bankruptcy, and treatment nonadherence.5–7,21 Cancer treatment–related out-of-pocket expenses can total thousands of dollars per year, and that total on average is higher than expenses of those with other chronic illnesses.4
Not only are patients with advanced cancer at risk for financial burden, but our analysis did not reveal differences in self-reported financial burden between patients with advanced cancer versus those who were cancer free, suggesting the financial burden of cancer may extend beyond the active treatment phase. Similarly, studies have shown that cancer survivors are more likely than healthy controls to be unemployed22 and to be at risk for lost wages.23 Furthermore, cancer survivors who experience financial burden are more likely to forego medical care compared with those without financial burden.24
We found that greater financial burden is negatively associated with quality of life. A growing body of literature has suggested a relationship between financial burden and patient well-being. For example, patients with cancer who experience financial burden are at risk of deferring vacations, spending savings, spending less on basics like groceries, and working longer hours.6 Some patients with cancer may also be unable to return to work because of their illness or treatment.25 Consistent with our results, Fenn et al corroborated a relationship between financial burden and health-related quality of life.20
The clinical implication of a relationship between quality of life and financial burden is clear and supported by the current literature. But unlike other symptoms of cancer and treatment, financial burden is not routinely identified in standard practice. To this end, a recently developed, validated, patient-reported measure could be used to screen for financial burden both in trials and in standard of care.26
With our findings of a relationship between quality of life and financial burden, we can better understand the implications of financial burden on quality of life and quality of cancer care. The next steps involve identifying financial burden early enough that interventions can be applied,27 and engaging patients in decision making regarding the potential costs of their care. Engaging patients in their care and providing cost information is not only a fundamental component of patient-centered care, but it might lower costs of care.28,29 However, when it comes to including costs in medical decision making, only a minority of patients report communicating with their doctors about financial burden.7,30 This finding suggests that much work needs to be done in finding effective ways to inform and engage patients regarding the potential treatment-related costs they might face.
Our study was subject to limitations. It was limited to insured patients with lung and colorectal cancer. Measures of financial burden and perceived quality of care were not validated and were possibly incomplete. However, the CanCORS survey tools were thoroughly pilot tested.13 The financial burden reported by patients might not have been directly related to costs incurred as a result of cancer treatment; patients might have experienced difficulty with living within their income for other unmeasured reasons. In this study, causality cannot be fully established given the cross-sectional nature of the analysis. Although only 6% of respondents were surrogates of living patients, our sensitivity analysis found that surrogates were somewhat more likely to indicate poor quality of care. However, the CanCORS protocol made every effort to ensure surrogates were identified by patients as being familiar with the patient's care. Finally, it was not possible to evaluate hypotheses regarding potential bidirectional associations (eg, between quality of life and perceived quality of care) because of the mixture of continuous and categorical measures in our structural model.32 This suggests additional opportunities for future research using different measures.
This study has several strengths. First, the cohort study design had attributes that aid in generalizability of results. Patients were enrolled from varied geographic regions and diverse health care settings, with few exclusion criteria applied. Patients originally enrolled in CanCORS were demographically representative of the geographic regions from which they were enrolled.33 Second, these data include both medical records and patient-reported sources, allowing for robust analyses. Third, we used structural equation modeling, which can simultaneously test the relationships between numerous variables that potentially have multiple interrelations (eg, quality of life, disease status, financial burden, and perceived quality of care).34 Finally, we conducted sensitivity analyses using standard logistic and linear regression and numerous measures of health-related quality of life; those results were consistent with our primary results.
The results from this population-based study suggest that financial burden is negatively associated with quality of life. As out-of-pocket health care costs continue to rise, more work needs to be done in understanding the relationships between financial burden, timing of costs incurred, and quality of care. The potential financial burden of cancer treatment—even among insured patients—should be integrated into treatment discussions and decision making.35 Future studies should consider interventions to screen for financial burden and improve patient engagement and decision making with regard to cost of care.
Acknowledgment
Supported by grants from the National Cancer Institute (NCI) to the Statistical Coordinating Center (U01 CA093344) and the NCI-supported Primary Data Collection and Research Centers (Dana-Farber Cancer Institute/Cancer Research Network U01 CA093332, Harvard Medical School/Northern California Cancer Center U01 CA093324, RAND/UCLA U01 CA093348, University of Alabama at Birmingham U01 CA093329, University of Iowa U01 CA093339, University of North Carolina U01 CA093326), and by a Department of Veterans Affairs Grant No. CRS 02-164 to the Durham VA Medical Center. S.Y.Z. was supported by American Cancer Society Mentored Research Scholar Grant No. 121276-MRSG-11-171-01-PCSM, the Duke Cancer Control Pilot Award, and Duke Comparative Effectiveness KM1 Award No. 1-KM1-CA-156687-01. The study sponsors played no role in study design, data collection, analysis, interpretation, writing, or decision to submit for publication. We acknowledge the support and guidance of Jane C. Weeks, MD, MSc, FASCO, without whom this work would not have been possible.
Appendix
Table A1.
Path Model (adjusted)
| Dependent Variable | Independent Variable | OR | Beta | 95% CI | P |
|---|---|---|---|---|---|
| Perceived quality of care | QoL | 0.85 | 0.79 to 0.92 | < .001 | |
| Disease status | 0.81 | 0.53 to 1.23 | .32 | ||
| Financial distress | 1.09 | 0.93 to 1.29 | .30 | ||
| Comorbidities | 1.05 | 0.90 to 1.21 | .55 | ||
| Education | 0.86 | 0.75 to 0.99 | .038 | ||
| Lives with partner | 0.84 | 0.61 to 1.16 | .28 | ||
| Income (per $20k per year) | 0.89 | 0.81 to 0.97 | .010 | ||
| Race (white) | 0.82 | 0.60 to 1.12 | .21 | ||
| Sex (female) | 0.97 | 0.74 to 1.27 | .83 | ||
| Financial distress | Disease status | 1.25 | 0.79 to 1.98 | .33 | |
| Comorbidities | 1.01 | 0.86 to 1.18 | .95 | ||
| Education | 0.91 | 0.79 to 1.06 | .23 | ||
| Age at diagnosis | 0.63 | 0.51 to 0.79 | < .001 | ||
| Stage at diagnosis | 0.89 | 0.70 to 1.13 | .33 | ||
| Income (per $20k per year) | 0.61 | 0.55 to 0.68 | < .001 | ||
| Race (white) | 0.76 | 0.55 to 1.06 | .11 | ||
| Employed (yes) | 0.80 | 0.56 to 1.15 | .23 | ||
| Insurance: private | 1.04 | 0.69 to 1.55 | .85 | ||
| Insurance: other | 1.14 | 0.73 to 1.76 | .57 | ||
| Sex (female) | 0.94 | 0.70 to 1.25 | .64 | ||
| QoL (EQ-5D) | Disease status | −0.04 | −0.08 to −0.01 | .025 | |
| Financial distress | −0.06 | −0.08 to −0.05 | < .001 | ||
| Comorbidities | −0.01 | −0.03 to 0 | .045 | ||
| Lives with partner | 0.03 | −0.001 to 0.06 | .063 | ||
| Stage at diagnosis | 0.01 | −0.01 to 0.03 | .36 | ||
| Income (per $20k per year) | 0.01 | 0.002 to 0.02 | .016 | ||
| Race (white) | −0.01 | −0.04 to 0.02 | .39 | ||
| Employed (yes) | 0.04 | 0.01 to 0.07 | .011 | ||
| Sex (female) | −0.01 | −0.03 to 0.02 | .46 | ||
| Advanced disease | Comorbidities | 0.88 | 0.68 to 1.14 | .33 | |
| Stage at diagnosis | 2.55 | 1.83 to 3.56 | < .001 | ||
| Income (per $20k per year) | 1.11 | 0.97 to 1.27 | .13 | ||
| Race (white) | 1.11 | 0.63 to 1.93 | .73 | ||
| Employed (yes) | 0.71 | 0.39 to 1.27 | .25 | ||
| Insurance: private | 1.04 | 0.53 to 2.03 | .91 | ||
| Insurance: other | 1.12 | 0.64 to 1.94 | .70 | ||
| Sex (female) | 1.14 | 0.72 to 1.81 | .57 | ||
| Comorbidities | Education | 0.85 | 0.74 to 0.97 | .017 | |
| Lives with partner | 0.84 | 0.62 to 1.15 | .28 | ||
| Income (per $20k per year) | 0.94 | 0.86 to 1.03 | .19 | ||
| Race (white) | 0.86 | 0.63 to 1.18 | .35 | ||
| Employed (yes) | 0.55 | 0.40 to 0.76 | < .001 | ||
| Insurance: private | 1.20 | 0.84 to 1.73 | .32 | ||
| Insurance: other | 1.26 | 0.91 to 1.74 | .16 | ||
| Sex (female) | 0.73 | 0.56 to 0.96 | .023 | ||
| Age at diagnosis | Comorbidities | 0.61 | 0.12 to 1.10 | .014 | |
| Education | 0.59 | 0.12 to 1.05 | .013 | ||
| Income (per $20k per year) | −0.42 | −0.72 to −0.11 | .007 | ||
| Race (white) | 1.79 | 0.73 to 2.86 | .001 | ||
| Employed (yes) | −3.32 | −2.23 to −4.41 | < .001 | ||
| Insurance: private | 4.17 | 2.90 to 5.44 | < .001 | ||
| Insurance: other | 12.63 | 11.54 to 13.71 | < .001 | ||
| Sex (female) | 0.70 | −0.20 to 1.60 | .13 | ||
| Stage at diagnosis | Education | 1.26 | 1.08 to 1.47 | .003 | |
| Lives with partner | 1.09 | 0.76 to 1.57 | .65 | ||
| Income (per $20k per year) | 1.00 | 0.90 to 1.11 | .99 | ||
| Race (white) | 0.68 | 0.48 to 0.96 | .030 | ||
| Employed (yes) | 1.33 | 0.52 to 1.07 | .12 | ||
| Insurance: private | 0.66 | 0.43 to 1.02 | .061 | ||
| Insurance: other | 0.51 | 0.35 to 0.74 | < .001 | ||
| Sex (female) | 0.96 | 0.71 to 1.30 | .79 |
Abbreviations: EQ-5D, EuroQol measure; OR, odds ratio; QoL, quality of life.
Table A2.
Multivariable Model Coefficients
| Model Component | Independent Variable | Regression Model With Continuous Independent Variable |
|||
|---|---|---|---|---|---|
| OR | Beta | 95% CI | P | ||
| Perceived quality of care | QoL (EQ-5D) | 0.85 | 0.79 to 0.92 | < .001 | |
| Advanced disease | 0.83 | 0.55 to 1.27 | .39 | ||
| Financial distress | 1.11 | 0.95 to 1.31 | .18 | ||
| Comorbidities | 1.03 | 0.90 to 1.19 | .65 | ||
| Education | 0.87 | 0.76 to 1.00 | .057 | ||
| Lives with partner | 0.84 | 0.61 to 1.15 | .27 | ||
| Income (per $20k per year) | 0.89 | 0.82 to 0.98 | .013 | ||
| Race (white) | 0.82 | 0.60 to 1.11 | .20 | ||
| Sex (female) | 1.02 | 0.78 to 1.33 | .89 | ||
| Financial distress | Advanced disease | 1.24 | 0.78 to 1.98 | .36 | |
| Comorbidities | 1.01 | 0.86 to 1.17 | .94 | ||
| Education | 0.92 | 0.79 to 1.07 | .26 | ||
| Age at diagnosis (per 10 yr of age) | 0.63 | 0.50 to 0.78 | < .001 | ||
| Stage at diagnosis | 0.88 | 0.69 to 1.13 | .31 | ||
| Income (per $20k per year) | 0.62 | 0.55 to 0.69 | < .001 | ||
| Race (white) | 0.76 | 0.55 to 1.05 | .095 | ||
| Employed (yes) | 0.80 | 0.56 to 1.14 | .22 | ||
| Insurance: private | 1.00 | 0.67 to 1.50 | .99 | ||
| Insurance: other | 1.12 | 0.73 to 1.74 | .60 | ||
| Sex (female) | 0.93 | 0.70 to 1.24 | .64 | ||
| QoL (EQ-5D) | Advanced disease | −0.04 | −0.09 to −0.01 | 0.017 | |
| Financial distress | −0.06 | −0.07 to −0.04 | < .001 | ||
| Comorbidities | −0.01 | −0.03 to −0.01 | .036 | ||
| Lives with partner | 0.03 | −0.01 to 0.05 | .10 | ||
| Stage at diagnosis | 0.01 | −0.02 to 0.03 | .60 | ||
| Income (per $20k per year) | 0.01 | 0.01 to 0.02 | .011 | ||
| Race (white) | −0.02 | −0.04 to 0.01 | .29 | ||
| Employed (yes) | 0.03 | 0.01 to 0.06 | .020 | ||
| Sex (female) | −0.01 | −0.03 to 0.02 | .50 | ||
| Advanced disease | Comorbidities | 0.91 | 0.70 to 1.18 | .47 | |
| Stage at diagnosis | 2.55 | 1.83 to 3.55 | < .001 | ||
| Income (per $20k per year) | 1.11 | 0.97 to 1.27 | .14 | ||
| Race (white) | 1.06 | 0.60 to 1.84 | .85 | ||
| Employed (yes) | 0.71 | 0.39 to 1.28 | .25 | ||
| Insurance: private | 1.02 | 0.51 to 2.03 | .96 | ||
| Insurance: other | 1.05 | 0.60 to 1.85 | .86 | ||
| Sex (female) | 1.19 | 0.75 to 1.91 | .46 | ||
| Comorbidities | Education | 0.85 | 0.74 to 0.97 | .016 | |
| Lives with partner | 0.84 | 0.62 to 1.15 | .28 | ||
| Income (per $20k per year) | 0.94 | 0.86 to 1.03 | .18 | ||
| Race (white) | 0.86 | 0.63 to 1.18 | .35 | ||
| Employed (yes) | 0.55 | 0.40 to 0.76 | < .001 | ||
| Insurance: private | 1.20 | 0.83 to 1.74 | .32 | ||
| Insurance: other | 1.26 | 0.92 to 1.73 | .15 | ||
| Sex (female) | 0.73 | 0.56 to 0.96 | .022 | ||
| Age at diagnosis | Comorbidities | 0.61 | 0.12 to 1.10 | .015 | |
| Education | 0.57 | 0.10 to 1.03 | .017 | ||
| Income (per $20k per year) | −0.42 | −0.72 to −0.11 | .008 | ||
| Race (white) | 1.83 | 0.76 to 2.89 | < .001 | ||
| Employed (yes) | −3.33 | −2.23 to −4.43 | < .001 | ||
| Insurance: private | 4.24 | 2.97 to 5.51 | < .001 | ||
| Insurance: other | 12.69 | 11.60 to 13.78 | < .001 | ||
| Sex (female) | 0.74 | −0.16 to 1.64 | .11 | ||
| Stage at diagnosis | Education | 1.26 | 1.08 to 1.47 | .003 | |
| Lives with partner | 1.09 | 0.76 to 1.57 | .64 | ||
| Income (per $20k per year) | 1.00 | 0.90 to 1.11 | .99 | ||
| Race (white) | 0.68 | 0.48 to 0.96 | .029 | ||
| Employed (yes) | 0.75 | 0.52 to 1.08 | .12 | ||
| Insurance: private | 0.66 | 0.43 to 1.02 | .060 | ||
| Insurance: other | 0.51 | 0.35 to 0.74 | < .001 | ||
| Sex (female) | 0.96 | 0.71 to 1.30 | .79 | ||
Abbreviations: EQ-5D, EuroQol measure; OR, odds ratio; QoL, quality of life.
Authors' Disclosures of Potential Conflicts of Interest
Although all authors completed the disclosure declaration, the following author(s) and/or an author's immediate family member(s) indicated a financial or other interest that is relevant to the subject matter under consideration in this article. Certain relationships marked with a “U” are those for which no compensation was received; those relationships marked with a “C” were compensated. For a detailed description of the disclosure categories, or for more information about ASCO's conflict of interest policy, please refer to the Author Disclosure Declaration and the Disclosures of Potential Conflicts of Interest section in Information for Contributors.
Employment or Leadership Position: S. Yousuf Zafar, GlaxoSmithKline (C) Consultant or Advisory Role: S. Yousuf Zafar, Genentech (U) Stock Ownership: None Honoraria: None Research Funding: None Expert Testimony: None Patents, Royalties, and Licenses: None Other Remuneration: None
Author Contributions
Conception and design: S. Yousuf Zafar, Christopher S. Lathan, John Z. Ayanian, Dawn Provenzale
Collection and assembly of data: Rebecca B. McNeil
Data analysis and interpretation: All authors
Manuscript writing: All authors
Final approval of manuscript: All authors
References
- 1.Centers for Disease Control and Prevention. Burden of medical care cost: Early release of estimates from the national health interview survey, January-June 2011. www.cdc.gov/nchs/nhis/releases.htm.
- 2.Kaiser Family Foundation. Employer health benefits, 2013 annual survey. http://kaiserfamilyfoundation.files.wordpress.com/2013/08/8465-employer-health-benefits-20131.pdf.
- 3.Agency for Healthcare Research and Quality. Top 10 most costly conditions among men and women, 2008: Estimates for the U.S. civilian noninstitutionalized adult population, age 18 and older. http://meps.ahrq.gov/mepsweb/data_files/publications/st331/stat331.shtml.
- 4.Bernard DS, Farr SL, Fang Z. National estimates of out-of-pocket health care expenditure burdens among nonelderly adults with cancer: 2001 to 2008. J Clin Oncol. 2011;29:2821–2826. doi: 10.1200/JCO.2010.33.0522. [DOI] [PMC free article] [PubMed] [Google Scholar]
- 5.Ramsey S, Blough D, Kirchhoff A, et al. Washington state cancer patients found to be at greater risk for bankruptcy than people without a cancer diagnosis. Health Aff. 2013;32:1143–1152. doi: 10.1377/hlthaff.2012.1263. [DOI] [PMC free article] [PubMed] [Google Scholar]
- 6.Zafar SY, Peppercorn JM, Schrag D, et al. The financial toxicity of cancer treatment: A pilot study assessing out-of-pocket expenses and the insured cancer patient's experience. Oncologist. 2013;18:381–390. doi: 10.1634/theoncologist.2012-0279. [DOI] [PMC free article] [PubMed] [Google Scholar]
- 7.Shankaran V, Jolly S, Blough D, et al. Risk factors for financial hardship in patients receiving adjuvant chemotherapy for colon cancer: A population-based exploratory analysis. J Clin Oncol. 2012;30:1608–1614. doi: 10.1200/JCO.2011.37.9511. [DOI] [PubMed] [Google Scholar]
- 8.Guy GP, Jr, Ekwueme DU, Yabroff KR, et al. Economic burden of cancer survivorship among adults in the united states. J Clin Oncol. 2013;31:3749–3757. doi: 10.1200/JCO.2013.49.1241. [DOI] [PMC free article] [PubMed] [Google Scholar]
- 9.Streeter SB, Schwartzberg L, Husain N, et al. Patient and plan characteristics affecting abandonment of oral oncolytic prescriptions. J Oncol Pract. 2011;7:46s–51s. doi: 10.1200/JOP.2011.000316. [DOI] [PMC free article] [PubMed] [Google Scholar]
- 10.Neugut AI, Subar M, Wilde ET, et al. Association between prescription co-payment amount and compliance with adjuvant hormonal therapy in women with early-stage breast cancer. J Clin Oncol. 2011;29:2534–2542. doi: 10.1200/JCO.2010.33.3179. [DOI] [PMC free article] [PubMed] [Google Scholar]
- 11.Ayanian JZ, Chrischilles EA, Fletcher RH, et al. Understanding cancer treatment and outcomes: The Cancer Care Outcomes Research and Surveillance Consortium. J Clin Oncol. 2004;22:2992–2996. doi: 10.1200/JCO.2004.06.020. [DOI] [PubMed] [Google Scholar]
- 12.Cancer Care Outcomes Research and Surveillance Consortium. Protocol and instruments requests. https://www.cancors.org/public/pub.
- 13.Malin JL, Ko C, Ayanian JZ, et al. Understanding cancer patients' experience and outcomes: Development and pilot study of the Cancer Care Outcomes Research and Surveillance patient survey. Support Care Cancer. 2006;14:837–848. doi: 10.1007/s00520-005-0902-8. [DOI] [PubMed] [Google Scholar]
- 14.Cella D, Li JZ, Cappelleri JC, et al. Quality of life in patients with metastatic renal cell carcinoma treated with sunitinib or interferon alfa: Results from a phase III randomized trial. J Clin Oncol. 2008;26:3763–3769. doi: 10.1200/JCO.2007.13.5145. [DOI] [PubMed] [Google Scholar]
- 15.Piccirillo JF, Tierney RM, Costas I, et al. Prognostic importance of comorbidity in a hospital-based cancer registry. JAMA. 2004;291:2441–2447. doi: 10.1001/jama.291.20.2441. [DOI] [PubMed] [Google Scholar]
- 16.Kline RB. Principles and Practice of Structural Equation Modeling. New York, NY: Guilford Press; 2011. [Google Scholar]
- 17.Tu YK. Commentary: Is structural equation modelling a step forward for epidemiologists? Int J Epidemiol. 2009;38:549–551. doi: 10.1093/ije/dyn346. [DOI] [PubMed] [Google Scholar]
- 18.VanderWeele TJ. Invited commentary: Structural equation models and epidemiologic analysis. Am J Epidemiol. 2012;176:608–612. doi: 10.1093/aje/kws213. [DOI] [PMC free article] [PubMed] [Google Scholar]
- 19.Kupek E. Beyond logistic regression: Structural equations modelling for binary variables and its application to investigating unobserved confounders. BMC Med Res Methodol. 2006;6:13. doi: 10.1186/1471-2288-6-13. [DOI] [PMC free article] [PubMed] [Google Scholar]
- 20.Fenn KM, Evans SB, McCorkle R, et al. Impact of financial burden of cancer on survivors' quality of life. J Oncol Pract. 2014;10:332–338. doi: 10.1200/JOP.2013.001322. [DOI] [PubMed] [Google Scholar]
- 21.Dusetzina SB, Winn AN, Abel GA, et al. Cost sharing and adherence to tyrosine kinase inhibitors for patients with chronic myeloid leukemia. J Clin Oncol. 2014;32:306–311. doi: 10.1200/JCO.2013.52.9123. [DOI] [PubMed] [Google Scholar]
- 22.de Boer AG, Taskila T, Ojajärvi A, et al. Cancer survivors and unemployment: A meta-analysis and meta-regression. JAMA. 2009;301:753–762. doi: 10.1001/jama.2009.187. [DOI] [PubMed] [Google Scholar]
- 23.Lauzier S, Maunsell E, Drolet M, et al. Wage losses in the year after breast cancer: Extent and determinants among Canadian women. J Natl Cancer Inst. 2008;100:321–332. doi: 10.1093/jnci/djn028. [DOI] [PubMed] [Google Scholar]
- 24.Kent EE, Forsythe LP, Yabroff KR, et al. Are survivors who report cancer-related financial problems more likely to forego or delay medical care? Cancer. 2013;119:3710–3717. doi: 10.1002/cncr.28262. [DOI] [PMC free article] [PubMed] [Google Scholar]
- 25.Earle CC, Chretien Y, Morris C, et al. Employment among survivors of lung cancer and colorectal cancer. J Clin Oncol. 2010;28:1700–1705. doi: 10.1200/JCO.2009.24.7411. [DOI] [PMC free article] [PubMed] [Google Scholar]
- 26.de Souza JA, Yap BJ, Hlubocky FJ, et al. The development of a financial toxicity patient-reported outcome in cancer: The cost measure. Cancer. 2014;120:3245–3253. doi: 10.1002/cncr.28814. [DOI] [PubMed] [Google Scholar]
- 27.Smith SK, Nicolla J, Zafar SY. Bridging the gap between financial distress and available resources for patients with cancer: A qualitative study. J Oncol Pract. 2014;10:e368–e372. doi: 10.1200/JOP.2013.001342. [DOI] [PMC free article] [PubMed] [Google Scholar]
- 28.Hibbard JH, Greene J, Overton V. Patients with lower activation associated with higher costs; delivery systems should know their patients' ‘scores’. Health Aff. 2013;32:216–222. doi: 10.1377/hlthaff.2012.1064. [DOI] [PubMed] [Google Scholar]
- 29.Wu S-J, Sylwestrzak G, Shah C, et al. Price transparency for MRIS increased use of less costly providers and triggered provider competition. Health Aff. 2014;33:1391–1398. doi: 10.1377/hlthaff.2014.0168. [DOI] [PubMed] [Google Scholar]
- 30.Bestvina CM, Zullig LL, Rushing C, et al. Patient-oncologist cost communication, financial distress, and medication adherence. J Oncol Pract. 2014;10:162–167. doi: 10.1200/JOP.2014.001406. [DOI] [PMC free article] [PubMed] [Google Scholar]
- 31. Reference deleted.
- 32.Asparouhov T. Bidirectional association. www.statmodel.com/download/Rec.pdf.
- 33.Catalano PJ, Ayanian JZ, Weeks JC, et al. Representativeness of participants in the Cancer Care Outcomes Research and Surveillance Consortium relative to the Surveillance, Epidemiology, and End Results program. Med Care. 2013;51:e9–e15. doi: 10.1097/MLR.0b013e318222a711. [DOI] [PMC free article] [PubMed] [Google Scholar]
- 34.Fischer KE, Stollenwerk B, Rogowski WH. Link between process and appraisal in coverage decision: An analysis with structural equation modeling. Med Decis Making. 2013;33:1009–1025. doi: 10.1177/0272989X13490837. [DOI] [PubMed] [Google Scholar]
- 35.Ubel PA, Abernethy AP, Zafar SY. Full disclosure–out-of-pocket costs as side effects. N Engl J Med. 2013;369:1484–1486. doi: 10.1056/NEJMp1306826. [DOI] [PubMed] [Google Scholar]