

Abstract
Objective
Immunoglobulin free light chains (FLCs) represent biomarkers of B-cell activity in rheumatoid arthritis (RA) and are associated with all-cause mortality in the general population. Our objective was to evaluate the relationships of serum FLCs to pre-clinical disease, RA characteristics, and mortality in RA compared to non-RA subjects.
Methods
A population-based study in Olmsted County, Minnesota, was performed by cross-linking a large cohort in the general population having available serum FLC measurements with established RA incidence and prevalence cohorts. Serum κ, λ, and total FLCs and their trends relative to RA incidence were compared between RA and non-RA subjects. Regression models were used to determine the associations between FLCs, disease characteristics and mortality, testing for differential effects of FLCs on mortality in RA.
Results
Among 16,609 subjects, 270 fulfilled the criteria for RA at the time of FLC measurement. Mean total FLCs were significantly higher in RA compared to non-RA subjects (4.2 vs. 3.3 mg/dL; p<0.001). FLCs became elevated 3 – 5 years before the clinical onset of RA and remained elevated during follow-up. Polyclonal FLCs were found to predict higher mortality in persons with RA, though elevation to the highest decile had a relatively lower impact on mortality in RA compared to non-RA subjects.
Conclusions
Elevation of serum FLCs precedes the development of RA and may be useful in monitoring B-cell activity and disease progression. FLCs are confirmed predictors of mortality, though the highest elevations of FLCs have a lower impact on mortality in RA than the general population.
Keywords: B cell, biomarkers, autoimmunity, mortality
Introduction
B lymphocytes are fundamental to the pathogenesis of rheumatoid arthritis (RA) and other autoimmune rheumatic diseases. Activation of autoreactive B cells, differentiation into plasma cells, and production of autoantibodies are hallmarks of these diseases. Prognosis and RA susceptibility are associated with the development of serum rheumatoid factor or anti-citrullinated protein antibodies (ACPAs) (1, 2), which can be detected >10 years before the onset of clinical disease (3). Accumulation of specific ACPAs against certain peptides, such as citrullinated α-enolase, fibrinogen, or vimentin, occurs during the evolution from preclinical autoimmunity to clinically overt RA (4, 5). Confirmation of the central role of B cells in RA is evident in the proven efficacy of B-cell depletion therapy (6-8).
However, only limited data exist on the relationship between B cell immunoglobulin production and disease course and prognosis. Excess immunoglobulin free light chains (FLC) are produced by terminally differentiated B cells and plasma cells during activation and are released into the blood. Elevated concentrations of FLCs in the serum and urine have been reported in case series of patients with RA (9, 10) and systemic lupus erythematosus (11-13). Recently, a hospital-based correlative study has reported significant elevations of serum FLCs in patients with RA, compared to the controls, with a normal ratio of κ-to-λ FLCs, indicating a polyclonal process (14). Other studies have suggested that serum FLCs correlate with disease activity and with the clinical response to B-cell depletion therapy with rituximab (15, 16). We are unaware of data linking serum FLC concentrations to the disease course, including the preclinical phase, or to long-term outcomes and mortality.
The objectives of this study were to evaluate trends in serum FLC concentrations before and after the clinical onset of RA, the relationship of FLCs to other disease characteristics, and to determine the association of serum total polyclonal immunoglobulin FLCs with mortality. We took advantage of a unique opportunity to cross-link the data set of our population-based RA incidence cohort with a long-term study of the prevalence of monoclonal gammopathy of undetermined significance (MGUS) conducted at our institution.
Materials and Methods
Study design
The previous study of the prevalence of MGUS consisted of 28,038 enumerated individuals aged ≥50 years living in Olmsted County, Minnesota as of January 1, 1995 (17, 18). This sample included 75% of subjects in this demographic of the county population. Serum samples were previously obtained from 21,463 of these individuals between January 1995 and November 2003, with 86% of the acquisitions from January 1995 through December 1997. The frequency of MGUS among subjects who gave permission to perform serum studies was the same as that among subjects who did not give permission. The characteristics of the final study population of 16,609 were similar to the total enumerated population (17). Thus, this cohort was considered representative of the general population living within Olmsted County. Follow-up status and mortality for this cohort was last updated in 2010.
In order to identify patients with RA, the general population sample (MGUS study) was cross-linked to a population-based RA inception cohort, consisting of adult residents of Olmsted County, Minnesota who first fulfilled the 1987 American College of Rheumatology (ACR) classification criteria (19) from January 1, 1995 through December 31, 2009 (20). The date of RA incidence was defined as the earliest date of fulfillment of 4 of the 7 classification criteria. A total of 806 subjects were alive in 1995. Additionally, 349 patients with prevalent RA on January 1, 1995 were identified. Prevalent patients were included on the basis of physician diagnosis when ACR criteria at the time of RA diagnosis were not available. The institutional review boards of Mayo Clinic and Olmsted Medical Center approved this study. All subjects provided written informed consent to participate in this research.
Data collection
Medical records were abstracted to define RA clinical characteristics as previously described (21). The duration of RA was calculated from the RA incidence date. Smoking was categorized as current, ever, or never. Body mass index was defined as kg/m2. Extra-articular manifestations, including the presence of rheumatoid nodules, secondary Sjögren's syndrome, pulmonary fibrosis, and vasculitis, were ascertained. Severe extra-articular manifestations were defined according to the Malmö criteria, and included scleritis/retinal vasculitis, Felty's syndrome, glomerulonephritis, major cutaneous vasculitis, neuropathy, pericarditis/pleuritis, or vasculitis involving other organs (22). Radiographic erosive/destructive changes were based on review of the radiologic reports. Coronary heart disease was defined by angina pectoris, coronary artery disease, myocardial infarction (including silent events), and coronary revascularization procedures. Exposure to RA medications was ascertained, including corticosteroids (oral or parenteral), disease-modifying antirheumatic drugs (methotrexate, hydroxychloroquine, sulfasalazine, leflunomide, or azathioprine), and biologic agents (including tumor necrosis factor inhibitors, anakinra, abatacept, and rituximab), all of which were available during the time-period of this study.
The results of testing for antinuclear antibodies (positive vs. negative), serum creatinine (mg/dL), erythrocyte sedimentation rate (mm/hour), and rheumatoid factor (≥ upper limit of normal) were ascertained from laboratory records. Persistent erythrocyte sedimentation rate (ESR) elevation was defined as ≥3 ESR measurements of ≥60 mm/h in the first year of RA incidence. The estimated glomerular filtration rate (eGFR) was calculated using the CKD-EPI formula.
The concentrations of serum immunoglobulin FLCs were measured using a commercial immunonephelometric assay (Binding Site, Birmingham, England) as previously described (17). The assay reports κ and λ FLC concentrations and the κ-to-λ ratio (23). We defined a result indicative of an FLC MGUS as an FLC ratio outside the normal diagnostic range (0.26–1.65). The reference ranges for κ-FLCs and λ-FLCs were 0.33 to 1.94 mg/dL and 0.57 to 2.63 mg/dL, respectively (23).
Statistical analysis
Characteristics of the patients with and without RA were compared using rank sum or Chi-square tests and also linear or logistic regression models, adjusting for age and sex, as appropriate.
Trends in FLC values, according to time since RA incidence, were examined using linear regression models of the log-transformed FLC values were depicted using smoothing splines. Trends in the percentages of patients with FLC ≥4.72 mg/dL, the cutoff for the highest decile in our previous publication (17), were obtained using generalized additive models with smoothing splines. The non-RA reference lines were age- and sex- adjusted to the RA population.
Cox models were used to examine the associations between FLC variables and mortality in the RA and non-RA cohorts. Patients with MGUS were excluded from this analysis. The presence of RA was treated as a time-dependent covariate, meaning that patients who developed RA during follow-up were counted in the non-RA group prior to development of RA, and in the RA group after development of RA. Interactions between cohort and FLC variables were assessed to determine whether the associations of FLC variables with mortality differed between the RA and non-RA groups. Kaplan-Meier methods were used to estimate the survival curves among subjects with and without RA who did and did not have FLC values ≥4.72 mg/dL. RA status was assessed at the time of FLC measurement for this survival analysis.
Results
Comparison of the RA and non-RA cohorts
As shown in Figure 1, 16,609 subjects were enrolled in this study; at the time of the FLC measurement, 16,339 subjects had no history of inflammatory arthritis, and 270 subjects had RA (195 from our RA inception cohort plus 75 prevalent cases). In addition, 127 subjects developed RA after FLC measurement.
Figure 1.
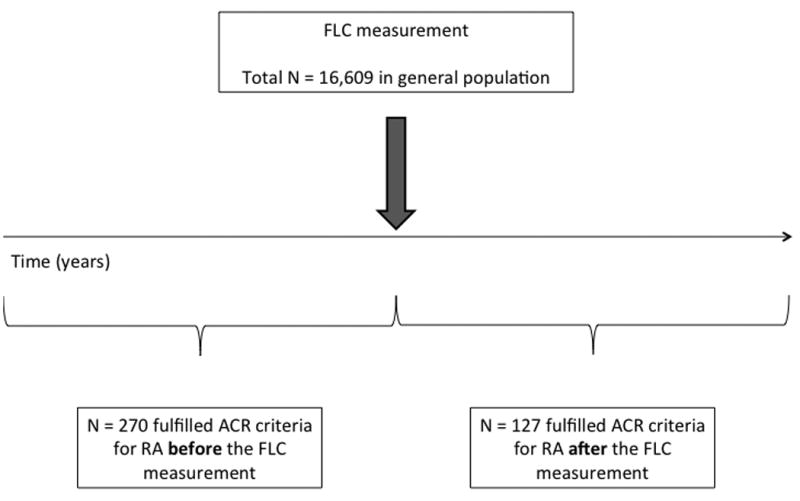
Study design illustrating the identification of subjects with RA with onset either before or after the FLC measurement. ACR = American College of Rheumatology; RA = rheumatoid arthritis; FLC = free light chain.
As shown in Table 1, the RA group was slightly older than the non-RA group (67 vs. 65 years, respectively; P<.001). The percentage of females was higher among the RA subjects than the non-RA subjects (68% vs. 55%; P<.001). For patients who developed RA before the FLC assay, the median RA disease duration was 12.2 years (range 0.0–39.3 years); for patients who developed RA after the FLC assay, the median time to development of RA was 5.4 years (range 0.0–16.1 years). The mean follow-up was similar between the RA and non-RA groups at approximately 10 person-years.
Table 1. Characteristics of patients with and without RA at the time of FLC measurement*.
| Non-RA N=16339 |
RA N=270 |
Crude P |
Adjusted for age and sex P |
|
|---|---|---|---|---|
| Age, years | 64.5 (10.5) | 67.3 (10.0) | <.001 | -- |
| Sex, female | 8947 (54.8%) | 184 (68.1%) | <.001 | -- |
| Follow-up, years | 10.2 (4.2) | 9.6 (4.5) | -- | -- |
| Total FLC | 3.3 (4.1) | 4.2 (3.7) | <.001 | .003 |
| Total FLC ≥4.72 mg/dL | 1816 (11.1%) | 64 (23.7%) | <.001 | <.001 |
| κ FLC, mg/dL | 1.6 (3.2) | 2.0 (2.4) | <.001 | .07 |
| λ FLC, mg/dL | 1.8 (2.2) | 2.2 (1.6) | <.001 | .005 |
| κ-to-λ FLC ratio | 1.0 (5.2) | 1.0 (1.4) | .34 | .90 |
| Light chain MGUS | 537 (3.3%) | 11 (4.1%) | .47 | .48 |
| MGUS (intact Ig) | 517 (3.2%) | 12 (4.4%) | .24 | .34 |
| Serum creatinine, mg/dL | 1.1 (0.5) | 1.1 (0.7) | <.001 | .69 |
| eGFR, mL/min/1.73 m2 | 64.8 (15.7) | 65.2 (17.7) | .56 | <.001 |
Values represent mean (SD) or number (%) as appropriate. Serum creatinine was available for 13,562 non-RA subjects and 182 RA subjects at the time of the FLC assay. eGFR was estimated using the CKD-EPI formula. Abbreviations: RA = rheumatoid arthritis; FLC = free light chains; MGUS = monoclonal gammopathy of undetermined significance; Ig = immunoglobulin; eGFR = estimated glomerular filtration rate.
Comparison of FLC levels between patients with RA and non-RA subjects
The patients with RA had significantly higher mean concentrations of total, κ and λ FLCs as compared to non-RA subjects in the general population (Table 1). The differences between the groups in these FLC concentrations were not explained by age, sex, or kidney function.
Trends in serum FLC levels relative to RA incidence
Although FLCs were only measured once per individual, by identifying patients with RA before (n=270) and after FLC measurement (n=127), as shown in Figure 1, it was possible to examine trends in serum FLC levels occurring before the development of RA. The mean concentration of serum total FLCs appeared to be elevated in subjects with RA, compared to the non-RA subjects in the preclinical period, approximately 5 years before the RA incidence date (Figure 2). A test for trend, applied to the log-transformed total FLC values, revealed that total FLCs increased over time by 1% per year (P<.001), and a test for change in slope at the time of RA incidence revealed a significantly steeper rate of increase (from 1% per year to 3% per year) beginning at RA incidence (P=.008). Additionally, the percentage of patients with RA who had a total FLC concentration of ≥4.72 mg/dL was higher than among non-RA subjects beginning at least 5 years before RA incidence (Figure 2). The higher elevation of serum FLCs in patients with RA compared to non-RA was found to persist for the duration of follow-up. The results separately for κ- and λ-FLCs were similar (data not shown).
Figure 2.
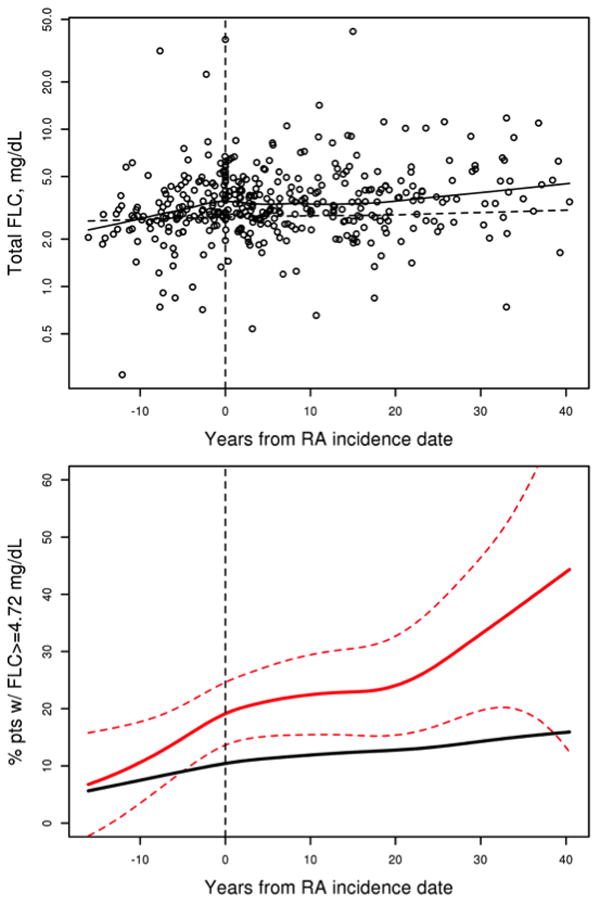
Evidence of preclinical activation of B-cell immunity in patients with RA compared to subjects in the general population. The graphs display trends in (upper) the concentration (mg/dL) of total FLC and in (lower) the percentage of patients with total FLCs ≥4.72 mg/dL, both relative to time from the RA incidence date. In the upper graph, the FLC data points for RA are shown along with a smooth line for trend in the 270 patients with RA (solid line) and a reference line for the 16,339 age- and sex-matched trend in the non-RA group (dashed line). A test for trend revealed that total FLCs increased over time (P<.001), and a test for change in slope at the time of RA incidence among the patients with RA revealed a significant change with a steeper rate of increase following RA incidence (P=.035). In the lower graph, the percentage of RA patients with total FLCs ≥4.72 mg/dL increased over time (solid red line with 95% confidence interval depicted as red dashed lines) and exceeded the age- and sex-matched trend in the non-RA group (solid black line). FLC = free light chains; RA = rheumatoid arthritis.
Predictors of elevated serum FLC in RA
Data on RA disease characteristics were available for the 195 subjects with RA incidence before FLC measurement. Because the rheumatoid factor (RF) is associated with B-cell autoimmunity, we analyzed the association between the RF and FLCs among patients with RA, of whom 128 (66%) were known previously to be RF-positive. As reported in Table 2, no statistically significant differences between RF-positive and RF-negative patients were observed in the mean concentrations of total FLCs (4.3 vs. 4.1 mg/dL; P=.72), κ-FLCs (mean 2.0 vs. 1.8 mg/dL; P=.65), or λ-FLCs (mean 2.2 vs. 2.3 mg/dL; P=.77). Further analysis considered the relationships of serum FLCs to other inflammatory disease characteristics, adjusting for age and sex (Table 2). Strong associations were detected between the highest decile of serum FLCs and the presence of rheumatoid lung disease (OR=8.53; P=.013) or severe extra-articular manifestations (OR=3.64; P=.017). A non-significant trend was observed between higher serum FLCs and disease duration (OR=1.03 per year; P=.09). No other significant associations were detected. Results of linear regression for the associations between the RA disease characteristics and log-transformed total FLCs were similar (data not shown).
Table 2. Association between RA disease characteristics and elevation of serum total FLCs to the highest overall population decile (≥ 4.72 mg/dL) at the time of the FLC assay in 195 patients with incident RA*.
| Characteristic | Value | Odds Ratio (95% CI) | P |
|---|---|---|---|
| RA lung disease | 8 (4%) | 8.53 (1.57, 46.34) | .013 |
| Severe extra-articular manifestations | 17 (9%) | 3.64 (1.26, 10.58) | .017 |
| Sjögren's syndrome | 15 (8%) | 1.66 (0.52, 5.28) | .39 |
| Rheumatoid nodules | 53 (27%) | 1.65 (0.80, 3.41) | .18 |
| Hydroxychloroquine, current use | 33 (17%) | 1.58 (0.68, 3.69) | .29 |
| Antinuclear antibody, positive (>ULN) | 70 (36%) | 1.41 (0.70, 2.83) | .33 |
| Radiographic erosive/destructive changes | 99 (51%) | 1.13 (0.58, 2.22) | .72 |
| Smoking, current at RA incidence | 53 (27%) | 1.08 (0.50, 2.31) | .85 |
| Disease duration, years | 12.2 ± 10.1 | 1.03 (1.00, 1.06) | .09 |
| Body mass index at RA incidence, kg/m2 | 26.7 ± 5.2 | 0.97 (0.90, 1.04) | .41 |
| Persistent ESR elevation in first year of RA incidence | 35 (18%) | 0.88 (0.36, 2.18) | .79 |
| Rheumatoid factor, positive (>ULN) | 128 (66%) | 0.83 (0.41, 1.70) | .61 |
| Smoking, ever | 127 (65%) | 0.82 (0.39, 1.73) | .60 |
| Other DMARDs, current use | 58 (30%) | 0.75 (0.35, 1.62) | .47 |
| Methotrexate, current use | 46 (24%) | 0.75 (0.32, 1.75) | .50 |
| Coronary heart disease | 44 (23%) | 0.65 (0.28, 1.50) | .31 |
| Prednisone, current use | 89 (46%) | 0.59 (0.30, 1.19) | .14 |
Results of logistic regression models adjusted for age and sex. Values represent the mean (SD) or number (%). Abbreviations: RA = rheumatoid arthritis; FLC = free light chains; CI = confidence interval; ULN = upper limit of normal; ESR = erythrocyte sedimentation rate; DMARD = disease-modifying antirheumatic drugs.
Association of FLCs with mortality in RA
Next, we examined the association between serum FLC levels and mortality among the 252 patients with RA and 15,431 non-RA subjects in the general population without MGUS. A total of 4,896 patients died during follow-up.
Total, κ-, and λ-FLCs were observed to predict higher mortality in patients with RA (Table 3). However, the hazard ratio (HR) for the association between total serum FLCs and mortality was lower in patients with RA (HR=1.07; 95% confidence interval [CI], 1.03-1.11) compared to subjects in the general population (HR=1.14; 95% CI, 1.13-1.16), adjusting for age, sex, serum creatinine, and the RA × FLC interaction term above.
Table 3. Association of serum polyclonal FLC variables with mortality among 15,431 non-RA subjects and 252 patients with RA, considering potential interaction between RA and serum FLC variables*.
| FLC Variable | Non-RA | RA | RA × Variable Interaction | ||||
|---|---|---|---|---|---|---|---|
|
|
|
|
|||||
| HR | 95% CI | HR | 95% CI | HR | 95% CI | P | |
| Total FLC | 1.14 | (1.13, 1.16) | 1.07 | (1.03, 1.11) | 0.93 | (0.90, 0.97) | <.001 |
| Total FLC ≥ 4.72 | 2.04 | (1.89, 2.20) | 1.25 | (0.88, 1.80) | 0.62 | (0.43, 0.89) | .009 |
| κ FLC (mg/dL) | 1.30 | (1.27, 1.33) | 1.11 | (1.03, 1.19) | 0.85 | (0.80, 0.91) | <.001 |
| λ FLC (mg/dL) | 1.24 | (1.22, 1.26) | 1.10 | (1.02, 1.18) | 0.91 | (0.85, 0.98) | .008 |
| Log (κ-to-λ ratio) | 1.10 | (1.001, 1.21) | 0.96 | (0.57, 1.63) | 0.88 | (0.51, 1.49) | .62 |
The results of Cox regression analysis are shown; models contain age, sex, creatinine, RA/non-RA status, variable of interest, and the RA × variable interaction term. For this analysis, RA is a time-dependent covariate, meaning that subjects are counted in the non-RA group until the time at which they developed RA during follow-up. The interaction term tests the hypothesis that FLCs have a different effect on mortality among the patients with RA compared to patients without RA. The hazard ratio for the interaction is the differential effect of FLC (per 1 mg/dL of FLC) on mortality among patients with RA. A total of 18 RA and 908 non-RA subjects with abnormal κ-to-λ ratio or detectable monoclonal heavy chains were excluded from this mortality analysis. Abbreviations: FLC = free light chains; RA = rheumatoid arthritis; HR = hazard ratio; log = natural logarithm; pos. = positive.
The interaction between RA and total FLCs was statistically significant (HR=0.93; 95% CI, 0.90-0.97, P<.001). Additionally, the mortality risk of the highest decile of serum total FLCs (≥4.72 mg/dL) appeared to be attenuated in patients with RA (HR=1.25; 95% CI, 0.88-1.80) compared to the general population (HR=2.04; 95% CI, 1.89-2.20). This same statistically significant interaction (≥4.72 mg/dL) was also detected between RA status and total FLC (HR=0.68; 95% CI, 0.48-0.95; P=.024), after adjusting for age, serum creatinine, the total FLC, and the RA/non-RA indicator variable (Table 3). The results were similar for κ- and λ-FLCs. As depicted graphically in Figure 3, the meaning of this interaction is that elevation of serum total FLCs to the highest general population decile has a significantly lower impact on overall mortality than the same elevation in non-RA subjects.
Figure 3.
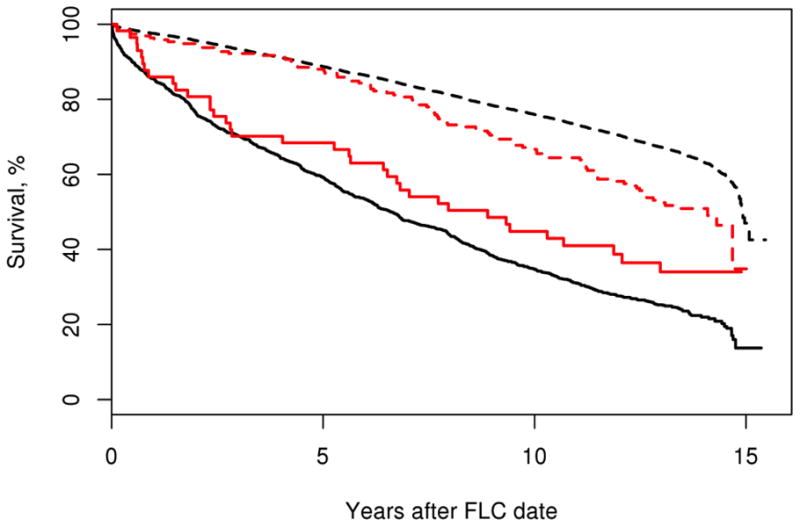
Lesser impact of the highest decile of polyclonal total FLCs on mortality in patients with RA compared to non-RA subjects. Shown are Kaplan-Meier curves comparing the survival experience between 15,431 non-RA subjects without (black dashed line) and with total FLCs ≥4.72 mg/dL (black solid line), and 252 patients with RA without and with serum FLCs in the highest decile (red dashed and red solid lines, respectively). All curves are age- and sex-adjusted to the age/sex distribution of the RA cohort.
Discussion
In this study, we have explored a unique population-based data set to investigate the relationships of serum FLCs, representing biomarkers of polyclonal B-cell activation, to pre-clinical disease, established disease characteristics, and overall mortality in persons with RA. As reported previously (14, 16), the concentrations of serum FLCs are significantly higher in persons with RA compared to members of the general population. The magnitude of total FLCs observed in our study is somewhat higher than the previously reported mean values in patients with established RA, 1.6 mg/dL and 1.93 mg/dL, respectively (14). While the explanation for this is unclear, one possibility is the much earlier time period of our study, which generally occurred prior to the availability of biologic therapies. Patients with RA during this time period may therefore have had higher disease activity, which is known to correlate with higher concentrations of serum FLCs (14, 24).
Because autoantibodies are detectable in the blood for years before the clinical presentation of RA, we assessed the trends in serum FLCs relative to RA incidence. Elevation of serum FLCs preceded the development of clinical RA, beginning at least 5 years and probably up to 10 years prior to the diagnosis. Of relevance, the results of a nested case-control study in Finland performed by Aho et al showed an elevation of serum IgG levels >10 years before the clinical development of RA (25). A study of the ESPOIR cohort reported higher concentrations of serum κ- and λ-FLCs in patients with early RA, compared to patients with undifferentiated arthritis, after one year of follow-up (16). Although caution is warranted, considering we were unable to perform serial FLC measurements before and after the onset of RA, the strengths of our study design underscore the significance of our inferences from this trends analysis.
Of interest, we did not observe any differences in serum FLCs between RF-positive and RF-negative patients. This contrasts with the reported association between both RF and ACPA serum FLCs by Gottenberg, et al. (14). Our study was not designed to evaluate the association between RF and serum FLCs, with three key limitations. First, RF testing was not done at the time of FLC measurement. Second, there are no remaining sera from these patients at the time of the FLC assays to test now for RF or ACPA. Third, the method of RF measurement varied over the time period of this study, precluding analysis of the titers and diagnostic cutoffs. Future studies are needed to address this specific question.
The finding of a strong association of serum FLCs with rheumatoid lung disease is of interest and deserves further evaluation in a larger cohort of patients with lung disease. Recently, B-cell autoimmunity and generation of autoantibodies to citrullinated proteins, especially citrullinated heat shock protein 60 (HSP60) isoforms, have been postulated to be central to the pathogenesis of RA-associated interstitial lung disease (26, 27). Our data highlight a relationship between polyclonal B-cell activation and the pathogenesis of parenchymal lung disease in RA.
A recent study by Dispenzieri et al showed that individuals in the highest overall decile for total serum FLCs had significantly increased mortality (HR=4.38; 95% CI, 4.08-4.70), which remained significant after adjusting for age, sex, and kidney function (17). This compelled us to determine how the presence of rheumatoid disease modifies the effect of serum FLCs on mortality. Our results confirm that serum total FLCs are significant predictors of increased mortality in patients with RA. Of note, the HR for the association between the highest decile of total FLCs and mortality was lower in the current study than the Dispenzieri et al study, probably due to differences in our statistical approach and covariates.
However, we found that elevation of total FLCs, even to the highest population decile, had a significantly lower impact on mortality among individuals with RA than non-RA subjects. Although the explanation is unclear, we can speculate on three possibilities. First, subjects without RA who have an elevation of serum FLCs could have another disease associated with increased mortality, such as an infection or malignancy. Second, the contribution of B-cell activation to mortality could be attenuated in the RA population by treatment of patients with disease-modifying, immunosuppressive medications. For example, B-cell depletion therapy with rituximab leads to significant reductions in serum FLCs (15). Third, other disease mechanisms could play a greater role in the higher mortality of patients with the highest FLC levels. Alternative immune pathways, perhaps upstream of B-cell activation, could be more important. Further research is necessary to understand the prognostic value of serum FLCs in managing early RA.
In summary, this population-based study comparing patients with RA to non-RA subjects reveals evidence of polyclonal elevation of serum FLCs in the pre-clinical period prior to the onset of overt clinical disease. The presence of RA lung disease was observed to predict serum FLC levels. Increased serum FLCs were shown to predict a greater risk of mortality in persons with RA, though the impact of the highest levels of total FLCs on mortality was lower among individuals with established RA than subjects in the general population. The findings highlight the fundamental role of B cells in the pathogenesis of RA and inform future studies of pre-clinical progression of the disease. Clinically, serum FLCs may be helpful in monitoring the disease's course and predicting overall survival in persons with RA.
Acknowledgments
The authors wish to thank Jennifer Gall and Melissa Henry for administrative assistance.
Sources of Support: Supported by the NIH, including grant R01 AR46849 from the National Institute for Arthritis, Musculoskeletal, and Skin Diseases (principal investigator, Dr. Gabriel), grants CA168762 and CA107476 from the National Cancer Institute (principal investigator, Dr. Rajkumar), and grant R01 AG034676 from the National Institute for Aging, supporting the Rochester Epidemiology Project (principal investigator, Dr. Walter A. Rocca). Also supported in part by the Jabbs Foundation (Birmingham, United Kingdom) and the Henry J. Predolin Foundation, USA. Binding Site provided the serum immunoglobulin free light chain reagent.
Contributor Information
Xiaoli Deng, Department of Rheumatology and Immunology, Peking University Third Hospital.
Cynthia S. Crowson, Division of Biomedical Statistics and Informatics, Department of Health Sciences Research, Mayo Clinic.
S. Vincent Rajkumar, Division of Hematology, Department of Medicine, Mayo Clinic.
Angela Dispenzieri, Division of Hematology, Department of Medicine, Mayo Clinic.
Dirk R. Larson, Division of Biomedical Statistics and Informatics, Department of Health Sciences Research, Mayo Clinic.
Terry M. Therneau, Division of Biomedical Statistics and Informatics, Department of Health Sciences Research, Mayo Clinic.
Eric L. Matteson, Division of Rheumatology, Department of Medicine; Division of Epidemiology, Department of Health Sciences Research; Mayo Clinic.
Robert A. Kyle, Division of Hematology, Department of Medicine, Mayo Clinic.
Jerry Katzmann, Department of Laboratory Medicine and Pathology, Mayo Clinic.
Sherine E. Gabriel, Division of Rheumatology, Department of Medicine; Division of Epidemiology, Department of Health Sciences Research; Mayo Clinic.
John M. Davis, III, Division of Rheumatology, Department of Medicine, Mayo Clinic.
References
- 1.Schellekens GA, Visser H, de Jong BA, van den Hoogen FH, Hazes JM, Breedveld FC, et al. The diagnostic properties of rheumatoid arthritis antibodies recognizing a cyclic citrullinated peptide. Arthritis Rheum. 2000;43:155–63. doi: 10.1002/1529-0131(200001)43:1<155::AID-ANR20>3.0.CO;2-3. [DOI] [PubMed] [Google Scholar]
- 2.Kroot EJ, de Jong BA, van Leeuwen MA, Swinkels H, van den Hoogen FH, van't Hof M, et al. The prognostic value of anti-cyclic citrullinated peptide antibody in patients with recent-onset rheumatoid arthritis. Arthritis Rheum. 2000;43:1831–5. doi: 10.1002/1529-0131(200008)43:8<1831::AID-ANR19>3.0.CO;2-6. [DOI] [PubMed] [Google Scholar]
- 3.Rantapaa-Dahlqvist S, de Jong BA, Berglin E, Hallmans G, Wadell G, Stenlund H, et al. Antibodies against cyclic citrullinated peptide and IgA rheumatoid factor predict the development of rheumatoid arthritis. Arthritis Rheum. 2003;48:2741–9. doi: 10.1002/art.11223. [DOI] [PubMed] [Google Scholar]
- 4.Sokolove J, Bromberg R, Deane KD, Lahey LJ, Derber LA, Chandra PE, et al. Autoantibody epitope spreading in the pre-clinical phase predicts progression to rheumatoid arthritis. PLoS One. 2012;7:e35296. doi: 10.1371/journal.pone.0035296. [DOI] [PMC free article] [PubMed] [Google Scholar]
- 5.van der Woude D, Rantapaa-Dahlqvist S, Ioan-Facsinay A, Onnekink C, Schwarte CM, Verpoort KN, et al. Epitope spreading of the anti-citrullinated protein antibody response occurs before disease onset and is associated with the disease course of early arthritis. Ann Rheum Dis. 2010;69:1554–61. doi: 10.1136/ard.2009.124537. [DOI] [PubMed] [Google Scholar]
- 6.Edwards JC, Szczepanski L, Szechinski J, Filipowicz-Sosnowska A, Emery P, Close DR, et al. Efficacy of B-cell-targeted therapy with rituximab in patients with rheumatoid arthritis. N Engl J Med. 2004;350:2572–81. doi: 10.1056/NEJMoa032534. [DOI] [PubMed] [Google Scholar]
- 7.Cohen SB, Emery P, Greenwald MW, Dougados M, Furie RA, Genovese MC, et al. Rituximab for rheumatoid arthritis refractory to anti-tumor necrosis factor therapy: Results of a multicenter, randomized, double-blind, placebo-controlled, phase III trial evaluating primary efficacy and safety at twenty-four weeks. Arthritis Rheum. 2006;54:2793–806. doi: 10.1002/art.22025. [DOI] [PubMed] [Google Scholar]
- 8.Emery P, Fleischmann R, Filipowicz-Sosnowska A, Schechtman J, Szczepanski L, Kavanaugh A, et al. The efficacy and safety of rituximab in patients with active rheumatoid arthritis despite methotrexate treatment: results of a phase IIB randomized, double-blind, placebo-controlled, dose-ranging trial. Arthritis Rheum. 2006;54:1390–400. doi: 10.1002/art.21778. [DOI] [PubMed] [Google Scholar]
- 9.Kelly C, Baird G, Foster H, Hosker H, Griffiths I. Prognostic significance of paraproteinaemia in rheumatoid arthritis. Ann Rheum Dis. 1991;50:290–4. doi: 10.1136/ard.50.5.290. [DOI] [PMC free article] [PubMed] [Google Scholar]
- 10.Sølling K, Sølling J, Rømer FK. Free light chains of immunoglobulins in serum from patients with rheumatoid arthritis, sarcoidosis, chronic infections and pulmonary cancer. Acta Med Scand. 1981;209:473–7. doi: 10.1111/j.0954-6820.1981.tb11632.x. [DOI] [PubMed] [Google Scholar]
- 11.Chiche L, Cournac JM, Mancini J, Bardin N, Thomas G, Jean R, et al. Normalization of serum-free light chains in patients with systemic lupus erythematosus upon rituximab treatment and correlation with biological disease activity. Clin Rheumatol. 2011;30:685–9. doi: 10.1007/s10067-010-1674-1. [DOI] [PubMed] [Google Scholar]
- 12.Aggarwal R, Sequeira W, Kokebie R, Mikolaitis RA, Fogg L, Finnegan A, et al. Serum free light chains as biomarkers for systemic lupus erythematosus disease activity. Arthritis Care Res (Hoboken) 2011;63:891–8. doi: 10.1002/acr.20446. [DOI] [PubMed] [Google Scholar]
- 13.Hopper JE, Sequeira W, Martellotto J, Papagiannes E, Perna L, Skosey JL. Clinical relapse in systemic lupus erythematosus: correlation with antecedent elevation of urinary free light-chain immunoglobulin. J Clin Immunol. 1989;9:338–50. doi: 10.1007/BF00918666. [DOI] [PubMed] [Google Scholar]
- 14.Gottenberg JE, Aucouturier F, Goetz J, Sordet C, Jahn I, Busson M, et al. Serum immunoglobulin free light chain assessment in rheumatoid arthritis and primary Sjogren's syndrome. Ann Rheum Dis. 2007;66:23–7. doi: 10.1136/ard.2006.052159. [DOI] [PMC free article] [PubMed] [Google Scholar]
- 15.Kormelink TG, Tekstra J, Thurlings RM, Boumans MH, Vos K, Tak PP, et al. Decrease in immunoglobulin free light chains in patients with rheumatoid arthritis upon rituximab (anti-CD20) treatment correlates with decrease in disease activity. Ann Rheum Dis. 2010;69:2137–44. doi: 10.1136/ard.2009.126441. [DOI] [PubMed] [Google Scholar]
- 16.Gottenberg JE, Miceli-Richard C, Ducot B, Goupille P, Combe B, Mariette X. Markers of B-lymphocyte activation are elevated in patients with early rheumatoid arthritis and correlated with disease activity in the ESPOIR cohort. Arthritis Res Ther. 2009;11:R114. doi: 10.1186/ar2773. [DOI] [PMC free article] [PubMed] [Google Scholar]
- 17.Dispenzieri A, Katzmann JA, Kyle RA, Larson DR, Therneau TM, Colby CL, et al. Use of nonclonal serum immunoglobulin free light chains to predict overall survival in the general population. Mayo Clin Proc. 2012;87:517–23. doi: 10.1016/j.mayocp.2012.03.009. [DOI] [PMC free article] [PubMed] [Google Scholar]
- 18.Kyle RA, Therneau TM, Rajkumar SV, Larson DR, Plevak MF, Offord JR, et al. Prevalence of monoclonal gammopathy of undetermined significance. N Engl J Med. 2006;354:1362–9. doi: 10.1056/NEJMoa054494. [DOI] [PubMed] [Google Scholar]
- 19.Arnett FC, Edworthy SM, Bloch DA, McShane DJ, Fries JF, Cooper NS, et al. The American Rheumatism Association 1987 revised criteria for the classification of rheumatoid arthritis. Arthritis Rheum. 1988;31:315–24. doi: 10.1002/art.1780310302. [DOI] [PubMed] [Google Scholar]
- 20.Kremers HM, Myasoedova E, Crowson CS, Savova G, Gabriel SE, Matteson EL. The Rochester Epidemiology Project: exploiting the capabilities for population-based research in rheumatic diseases. Rheumatology (Oxford) 2011;50:6–15. doi: 10.1093/rheumatology/keq199. [DOI] [PMC free article] [PubMed] [Google Scholar]
- 21.Myasoedova E, Crowson CS, Nicola PJ, Maradit-Kremers H, Davis JM, 3rd, Roger VL, et al. The influence of rheumatoid arthritis disease characteristics on heart failure. J Rheumatol. 2011;38:1601–6. doi: 10.3899/jrheum.100979. [DOI] [PMC free article] [PubMed] [Google Scholar]
- 22.Turesson C, Jacobsson L, Bergstrom U. Extra-articular rheumatoid arthritis: prevalence and mortality. Rheumatology (Oxford) 1999;38:668–74. doi: 10.1093/rheumatology/38.7.668. [DOI] [PubMed] [Google Scholar]
- 23.Katzmann JA, Clark RJ, Abraham RS, Bryant S, Lymp JF, Bradwell AR, et al. Serum reference intervals and diagnostic ranges for free kappa and free lambda immunoglobulin light chains: relative sensitivity for detection of monoclonal light chains. Clin Chem. 2002;48:1437–44. [PubMed] [Google Scholar]
- 24.Djidjik R, Messaoudani N, Raaf N, Boudjella ML, Abdessmed A, Bahaz N, et al. Are immunoglobulin free light chains levels reliable to assess disease activity in rheumatoid arthritis? Joint Bone Spine. 2013;80:437–8. doi: 10.1016/j.jbspin.2012.12.007. [DOI] [PubMed] [Google Scholar]
- 25.Aho K, Heliovaara M, Knekt P, Reunanen A, Aromaa A, Leino A, et al. Serum immunoglobulins and the risk of rheumatoid arthritis. Ann Rheum Dis. 1997;56:351–6. doi: 10.1136/ard.56.6.351. [DOI] [PMC free article] [PubMed] [Google Scholar]
- 26.Aubart F, Crestani B, Nicaise-Roland P, Tubach F, Bollet C, Dawidowicz K, et al. High levels of anti-cyclic citrullinated peptide autoantibodies are associated with co-occurrence of pulmonary diseases with rheumatoid arthritis. J Rheumatol. 2011;38:979–82. doi: 10.3899/jrheum.101261. [DOI] [PubMed] [Google Scholar]
- 27.Harlow L, Rosas IO, Gochuico BR, Mikuls TR, Dellaripa PF, Oddis CV, et al. Identification of citrullinated hsp90 isoforms as novel autoantigens in rheumatoid arthritis-associated interstitial lung disease. Arthritis Rheum. 2013;65:869–79. doi: 10.1002/art.37881. [DOI] [PubMed] [Google Scholar]