Abstract
Introduction:
Patient-reported outcomes (PROs) are rarely included in quality monitoring systems, surgeon comparative feedback reports, or registries. We present the design and implementation of a secure website in a federally funded research program—Function and Outcomes Research for Comparative Effectiveness in Total Joint Replacement (FORCE-TJR)—to return comparative PRO reports to participating surgeons, in addition to including traditional quality measures, in order to monitor and improve quality and health outcomes.
Methods:
The surgeon-specific comparative PRO reports were designed and structured based on user input for content, data elements, integration, and display. Three questions are addressed regarding the knee and hip joint symptom profiles of patients before TJR, as well as outcomes of surgery. The website is organized with a hierarchical structure to display data at national, practice, and individual surgeon levels, and provides a comprehensive site-level executive summary and surgeon-level data reports that can be downloaded.
Early Results:
As of September 2014, over 22,000 patients were enrolled from more than 130 surgeons in 22 states. The reporting website was launched in September 2012 and has been updated quarterly for all surgeons to review their site- and individual-specific outcomes data compared to national benchmarks.
Discussion:
In this novel system, quarterly comparative surgeon feedback extends beyond traditional measures of complication rates to include PROs of pain relief and functional gain. We anticipate that this enhanced data will facilitate patient-centered quality improvement (QI) and outcomes research from the registry. As the Centers for Medicare & Medicaid Services (CMS) and other insurers consider future implementation of PROs, surgeons will increasingly need comparative data by which to self-monitor their practice outcomes.
Keywords: Surgeon Report Card, Patient-Centered Outcomes, Patient-Reported Outcomes, Quality Improvement, 2014 EDM Forum Symposium
Introduction and Background
The overarching goals of quality improvement (QI) initiatives in health care are to minimize medical errors and adverse events and to improve health outcomes. However, too often, QI programs focus solely on minimizing suboptimal outcomes, and do not quantify improvements in health status. In particular, patients choose total joint replacement (TJR) surgery (hip and knee) to relieve the chronic pain and functional limitations associated with advanced hip and knee osteoarthritis and other degenerative conditions. Overall, TJR surgery successfully relieves these symptoms and, because of this success, has become the most common and costly procedure in the Medicare budget.1 However, traditional TJR quality programs monitor perioperative adverse events including postoperative infections, thromboembolic events, or readmission rates often associated with pre-existing medical conditions and do not include patient-reported outcomes (PROs), such as pain relief and functional gain.2 In parallel, international outcome registries are commonly limited to the survival of the implant device and report years of implant survival as defined by a return to the operating room to revise the implant. While both perioperative adverse events and implant revision data are important quality indicators, they are unable to quantify two important TJR outcomes. First, in the early postsurgical period these measures are unable to quantify the patient’s degree of pain relief and improved physical function. Second, revision rates do not detect problems in implant performance often associated with unusual pain and limitations in daily activities that do not always result in surgical revision. The 2010 recall of metal-on-metal implants3 is an example of patient symptoms serving as the early indicator of poor implant performance requiring revision. If quality monitoring programs had included pain assessments, the systematic implant performance issues may have been detected earlier.
PROs are critical measures to capture whether the TJR surgery improved patients’ health.4 Using validated global health and joint-specific metrics, TJR patients can use PROs to assess their general health, the frequency and severity of joint pain, their ability to walk or climb stairs and walk distances—before and after the surgery. PROs provide a valuable tool to guide patient and surgeon decisions. However, in the United States, PROs are in the early stages of implementation in clinical practices and registries, and patients’ views of their health status are rarely included in health outcomes reporting.5,6
Function and Outcomes Research Registry for Comparative Effectiveness in Total Joint Replacement (FORCE-TJR), a federally funded research program project award, developed a national cohort of TJR patients and quantified both traditional surgical results (e.g., adverse events) and PROs.7 FORCE-TJR is both a research program to develop new knowledge about best TJR surgical practices5 and a quality monitoring system that provides quarterly, comparative feedback data and tools to surgeons and hospitals to manage and monitor outcomes. For the first time, to our knowledge, FORCE-TJR includes comparative surgeon feedback on PROs as well as on complication, infection, and readmission rates.
This paper describes how these comparative web reports are designed and structured following user input for content, data elements, integration, and display. The data capture and reporting methods can be used as a general-purpose template for comparative web reporting to monitor and improve quality and health outcomes.
Users
Typically, TJR outcomes research is conducted in high-volume practices, often in academic medical centers. However, the majority of TJR surgeries in the United States are performed by general orthopedic surgeons in community practices. FORCE-TJR assembled a consortium of diverse orthopedic practices, including high and low volume, urban and rural, and teaching and nonteaching hospitals. Six core sites are high-volume academic hospitals. Community sites consist of over 30 practices, and 75 percent of surgeons in the study are community-based. The FORCE-TJR is planning to enroll more than 30,000 diverse patients receiving care from more than 130 orthopedic surgeons representing all regions of the country and varied hospital and practice settings to ensure that data reflect typical United States practices. Because all patients scheduled for TJR are invited, and more than 80 percent enrolled and complete data, the cohort is representative of practices in all these sites.
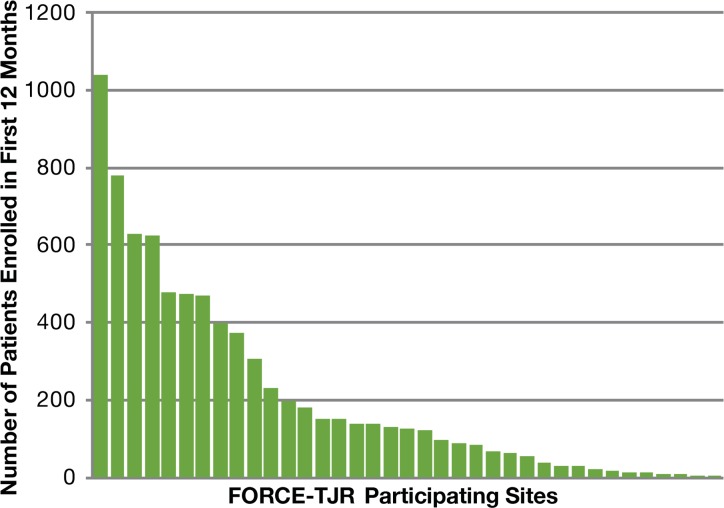
As of September 2014, over 22,000 patients were enrolled from more than 130 surgeons in 22 states. Sites enrolled a median of 126 patients in their first 12 months of participation with a range from 2 to 1038. Nine of the sites enrolled more than 350 patients in their first 12 months (with the range up to 1038); another 9 sites enrolled 100–200; 6 sites enrolled 50–99; 11 sites enrolled fewer than 50. Figure 1 shows the distribution of site enrollment in each site’s first 12 months; each bar represents a participating site and shows the number of patients enrolled in the first 12 months. At surgeon level, 61 percent of surgeons are considered low-volume clinicians who performed fewer than 50 TJR surgeries in their first year of participation.
Figure 1.
Distribution of Site Enrollment in Sites’ First 12 Months
Data Elements in FORCE-TJR Database
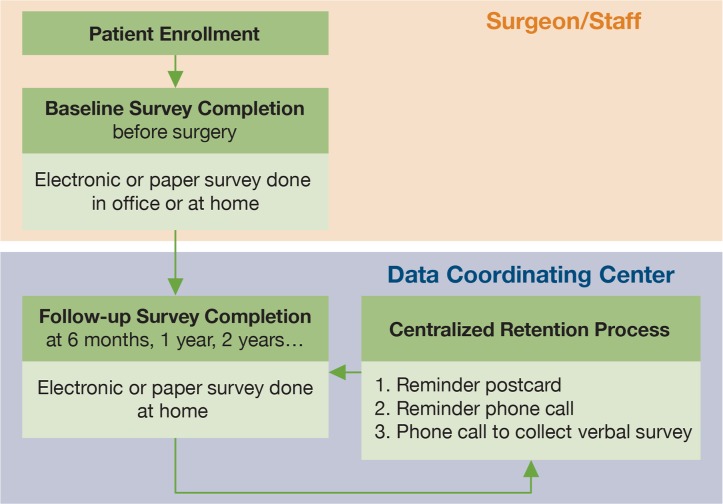
After enrolling a new patient who will undergo TJR, the surgeon and staff have the patient complete two validated PRO surveys. One survey assesses global physical and emotional health status and one assesses joint-specific arthritis symptoms of pain, stiffness, and limited physical function. Besides these two PRO surveys, comorbid conditions, behavioral risks (e.g., smoking), and demographics are assessed as well. By cohort study design, the PROs are completed by patients via scannable paper forms or secure web-based surveys that can be done in the office during the visit or at home. The baseline (preoperative) surveys must be completed within 90 days of surgery. Actually, the majority are completed less than six weeks before surgery. If surgery is delayed for any reason to a date greater than 90 days following PRO completion, a new baseline survey is collected. A centralized Data Coordinating Center (DCC) manages follow-up surveys for all sites at six months, as well as annually, for years into the future. DCC staff control follow-up survey return rates by using email, mail, and telephone reminders to assure complete PRO data. Figure 2 shows the process of survey collection. Based on this process, 91 percent of the patients completed the baseline survey, and 85 percent completed the 6- or 12-month follow-up survey. In the future, the management tools used in DCC to support complete follow-up surveys will be deployed to support surgeons and hospitals to monitor and collect postoperative surveys.
Figure 2.
Process of PRO Survey Collection
At the same time that patients complete the PRO, patients also report any visits to an emergency room, hospital admission, or inpatient or ambulatory surgical procedure related to their knee or hip implant during the first six months following TJR surgery. Annual PROs also inquire about revision surgeries or any operative procedures related to the implant. The Clinical Data Team investigates all patient-reported events by reviewing the medical records from the facility listed on the report. In this way, estimated readmission rates within 30 days of discharge from TJR surgery and 90-day complication rates are monitored. Administrative data from the Centers for Medicare & Medicaid Services (CMS) are obtained annually to verify the adverse event rates for Medicare patients. Event information is presented by age group (over or under 65 years of age) and by hospital location, specifically whether the readmission was to the same hospital where the surgery was performed or to a different hospital. These methods have been reported elsewhere in detail.8
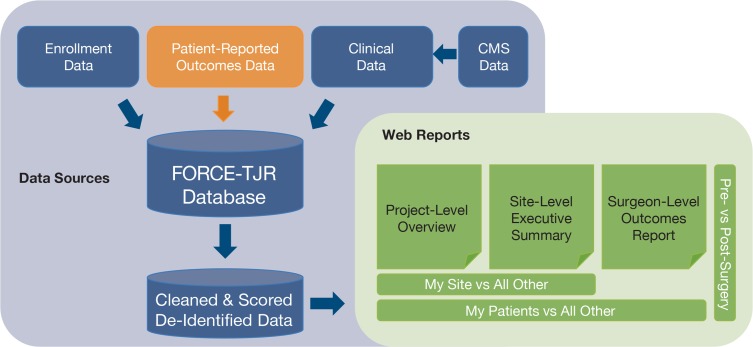
The DCC maintains the centralized secure database that integrates data from patients, surgeons, and hospitals and is updated weekly. Cleaned, scored data are provided quarterly for web reporting. See Figure 3.
Figure 3.
Integration of Data Sources and Reporting Structure
Web Report Content
A multidisciplinary team of surgeons and methodologists determined what information should be included in the surgeon reports and how data should be displayed. Interviews with surgeon users guided iterative improvements in the reports. The initial comparative reports presented comprehensive patient demographics and pre- and post-TJR PRO scores in table format with site data compared to the national cohort. In addition, graphical presentation of key demographic characteristics and trends in PROs across time were provided.
After further discussion with surgeon users, executive summary reports were developed to address three questions: (1) How do my patients compare to the national norms in key risk factors for post-TJR complications, including demographics (age, sex), preoperative medical comorbidities (BMI, diabetes, cardiac conditions), and musculoskeletal comorbidities (severity of pain in lower extremity joints); (2) How do my patients’ preoperative pain and function profiles at time of surgery compare to the national norms; and (3) How do my patients’ outcomes (readmission rates, postoperative pain relief and functional gain) compare to national norms. The aggregate data for a specific site is compared to aggregate data from other sites across the country and to data from all project sites combined to answer these three questions.
Web Report Structure
The secure surgeon website provides comparative feedback to participating surgeons and hospitals. The website is organized using a hierarchical structure and presents data at national, site and practice, and individual-surgeon levels (Figure 3). Surgeons can see the enrollment distribution by site for the national registry cohort, and physical function scores in their affiliated site and practice compared to national norms. A comprehensive executive summary is specifically prepared for each site. Site-specific data provide each site with the preoperative risk profiles and the outcomes of its patients compared with those of other peer hospitals and with national averages. An outcomes report for an individual surgeon’s patient lists detailed risk factors with aggregate descriptive data compared to other peer sites. The report is broken down by surgery type (primary total knee or hip surgery), and time points (presurgery, postoperative 6 months, postoperative 12 months, etc.). The surgeon report is a PDF available on the website for download.
Web Report Security
The reporting website is built on a secure platform with stringent levels of encryption and data storage. User authorization and access control are tightly managed: only FORCE participating surgeons, with unique usernames and complex passwords, have access to the website. Surgeon-specific reports have a second level of encryption and require an additional password. No identifying patient or surgeon information is displayed on the website. Only site ID and surgeon ID are used to identify each site or surgeon. Surgeons can view only their own outcome reports. With approval by site surgeons, a site’s lead surgeon can access the reports of all surgeons from that site. Hospital administration and clinic managers can use the site lead’s login to access the website and get the site report when they are allowed to by the site’s lead surgeon. No patient identifiers are included in the reports.
Web Report Examples
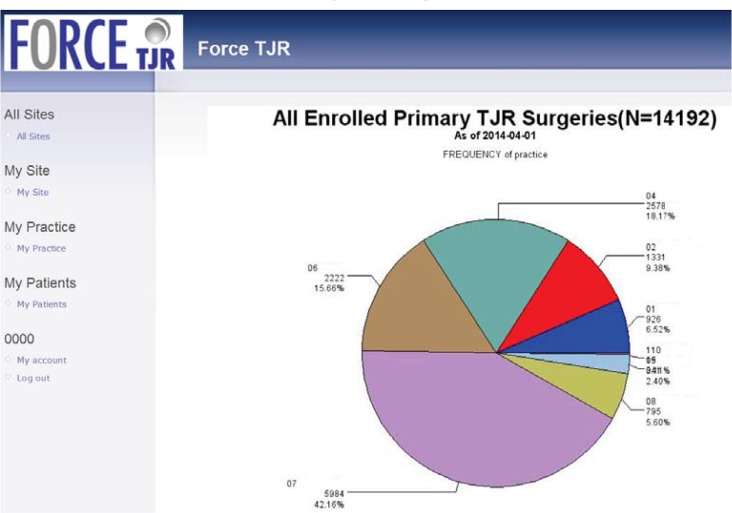
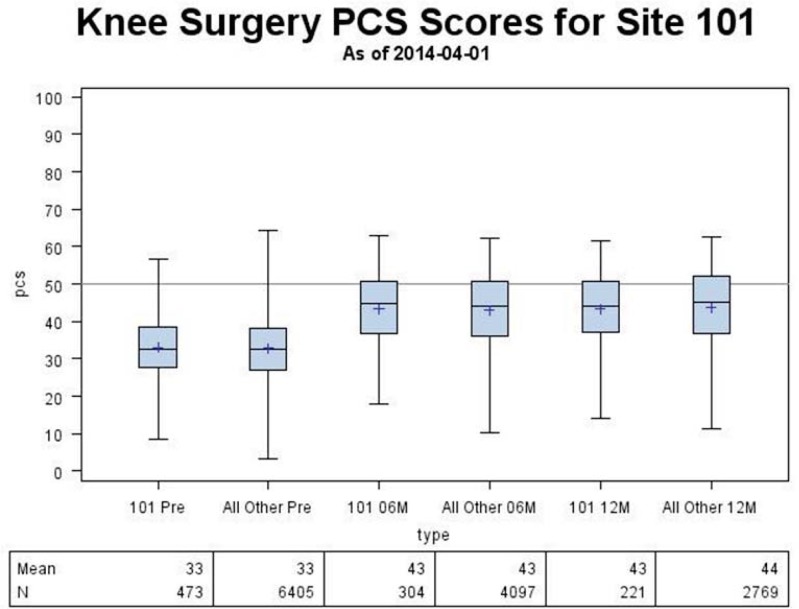
The reporting website was designed in 2011 and launched in September 2012. Since that time, it has been updated quarterly for all surgeons to review their site- and individual-specific outcomes data. Figures 4–8 show examples of web-report screens for a sample surgeon from a demonstration site. In Figure 4, the national cohort summary reports that 14,192 primary total joint replacement (TJR) surgeries were reported in March 2014 and were used to calculate the national norms. For example, Site 101, one of the core sites, has enrolled 926 primary TJR surgeries, and the site’s pre- and postoperative physical function scores for primary knee replacement surgery are consistent with national norms (Figure 5). Because the website reports PROs as the data are available, not all patients with preoperative data will have reached the 6- and 12-month time points. Thus, the number of postoperative PROs does not equal the preoperative number. By design, the FORCE-TJR cohort included six core sites plus a distributed network of dozens of community orthopedic practices across the country (represented in purple in Figure 4). While the red, blue, and brown core sites (30 percent total) are from academic practices, the remaining 70 percent of patients are recruited from community-based core and network sites that represent nonacademic, nonspecialty practices. This distribution parallels national practice sites.
Figure 4.
Illustration of FORCE-TJR National Summary Web Page
Figure 8.
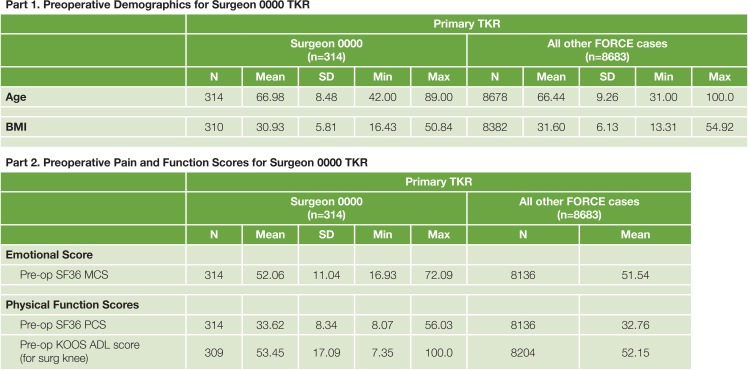
Sample Tables of Individual Surgeon Comparative Summary with Demographic, Medical, Musculoskeletal Risk Factors, and PRO Measures before TJR
Figure 5.
Sample Pre- and Postoperative Physical Function Score Comparison to the National Cohort and to the Normed Score (50)
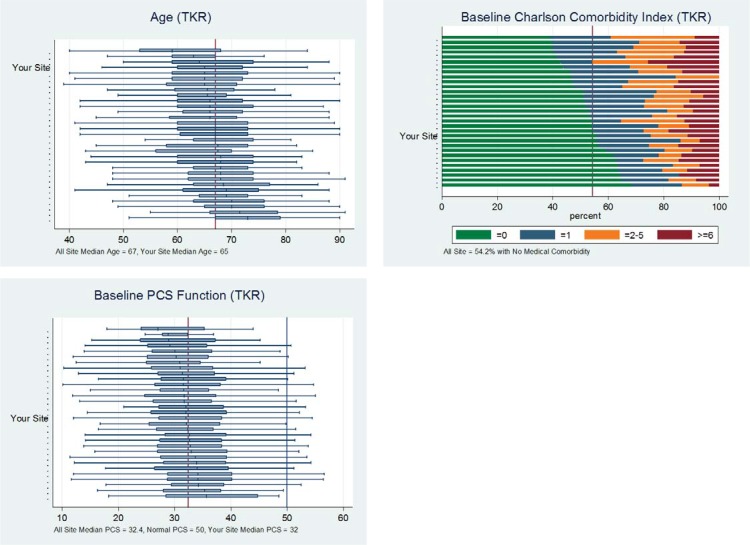
Figure 6 shows sample pages from the executive summary. The graphs include the box plots of risk factors—such as age, comorbidity, and baseline pain and function scores—and the comparison across all sites. The metrics from the demonstration site are consistent with national norms.
Figure 6.
Sample Pages from FORCE-TJR Executive Summary for Participating Sites
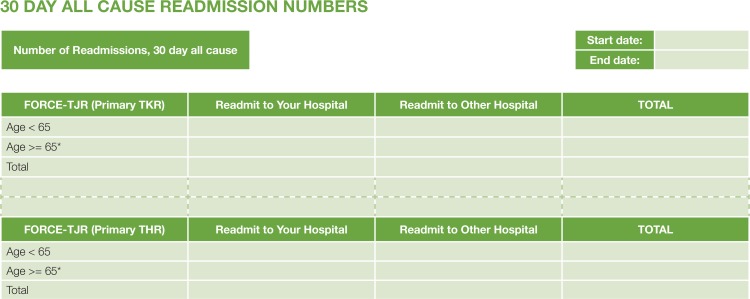
Figure 7 is a sample readmission table for a single site. Total read-missions after surgery are reported by Medicare versus non-Medicare status and by hospital. Patient details are provided at the request of the surgeon.
Figure 7.
Sample FORCE-TJR Postoperative Event Summary
Figure 8 shows the individual outcome report for a single surgeon. Descriptive analysis of demographic attributes and clinical outcomes of the patients from this surgeon as well as the comparison with all other cases are included in this report.
Discussion
The purpose of this web reporting system is to provide surgeons and practice leaders with reliable outcome summaries and national benchmarks to guide continual improvement of TJR processes and quality of care. FORCE-TJR surgeons have learned to use the feedback website, and they receive paper copies of the Executive Summaries, as requested. Ongoing improvements in the surgeon reports will address suggestions and future needs.
Strengths of this Web Report
Few orthopedic research programs and registries collect standardized PRO information. By design, FORCE-TJR consistently gathers validated PROs from patients pre- and post-surgery. FORCE-TJR continues to enroll patients in the cohort, making the FORCE-TJR database the largest and only TJR national sample of patient-reported pain, function, joint mobility, and other global health measures.6 The site- and surgeon-specific web reports display patient risk factors and comparative PRO and quality measures to guide hospital and surgeon outcome monitoring.
The PROs include both global health status measures and knee and hip-specific pain and function measures for surgeons to assess patient outcomes. While over 90 percent of TJR patients report significant pain relief by six months, a minority report sustained pain. Atypical patient-reported pain can be the first sign of implant failure. Such systematic patient-reported data brings attention to these patients earlier as an efficient monitoring process. In addition to traditional TJR surgical and implant details allowing estimates of implant failure or revision, patient metrics can provide key information to monitor changes in symptom severity over time, support shared clinical care decisions, and assess treatment effectiveness for quality initiatives and value-based reimbursement. Our experience in this national FORCE-TJR surgeon network shows that integrating PROs in an orthopedic clinic requires minor modifications of patient flow, and that the PRO process works seamlessly for routine patient visits.5 For the first time, surgeons receive contemporary national norms for each of the PRO measures, against which they can compare individual practice metrics. These national benchmarks will be useful when private or public insurers initiate PRO measurement.
Patient-reported adverse event data are useful to hospitals, as they are often unaware of the patient’s total utilization of health care resources after the initial, brief TJR hospitalization. In late 2013, CMS publicly reported 30-day post-TJR readmission rates by hospital for the first time. However, the CMS list includes only Medicare beneficiaries, and more than 40 percent of all TJR patients today are under the age of 65 years and generally not Medicare eligible. Because FORCE-TJR collects readmission data on all patients, surgeons and hospitals will get a more complete profile. In addition, hospitals are unaware of readmissions to hospitals other than themselves, and therefore have an incomplete picture of 30-day hospital utilization. Our research documented that about 25 percent of patients who are readmitted within 30 days after TJR are readmitted to a regional hospital that is not their surgical hospital.8 These readmission data are reported by patients and validated through hospital records. Thus, we capture more complete adverse events based on the patient-driven model.
Limitations of this Web Report
Small or low-volume sites have delayed the start of comparative reports. A total knee replacement (TKR) or total hip replacement (THR) executive summary will not be generated for any sites with less than 20 TKR or THR patients. The small sample size has the potential to cause biases in statistical results. Thus, we include an explanation in the report, for example, “You do not yet have enough 6-month postoperative data available for this report. Additional patient data are needed before drawing any conclusions.”
Lessons Learned
Through the development and implementation of this comparative web reporting, we also gained important experience and learned many generalizable lessons. Managing an ambitious quarterly reporting schedule was one of the challenges that should be considered for similar efforts. Prior to the end of the quarterly report window, weekly Quality Control (QC) reports need to be monitored closely to make sure all required data from different resources are captured and ready for the integration to the main database. The month after the end of report quarter is used for data cleaning and possible catch-up, specifically for paper survey data received. The following two weeks is for report generation, and another two weeks is for report QC. The third month is focused on website update, report upload, and final QC. The timeline was modified based on each team’s work progress and cooperation between teams. This final timeframe greatly supports the quarterly reporting schedule.
In addition, we learned that surgeons preferred graphical presentation of data plus a brief written interpretation. Surgeons find the visual display plus a brief interpretation helpful to guide correct understanding and use of the data provided and for applying the information to their clinical practices. Initial reports included mean and SD, for sites and national norms. We evolved to present data through site-level graphs displaying 25th, 50th (median), and 75th percentiles and national norms. Quartiles allow sites to understand their relative performance compared to peers. In the future, we may consider presenting more refined rankings with deciles.
Future Plans
FORCE-TJR will introduce a number of new metrics during 2014. First, risk-adjusted outcomes will be added to the reports. In collaboration with the American Association of Hip and Knee Surgeons, FORCE-TJR analysts have replicated the CMS risk-adjustment model for readmissions, and have enhanced the model with clinical measures not included in administrative data. These models are now being validated and will be introduced into the reports. In addition, FORCE-TJR developed risk-adjustment models for PROs; again, these are being validated and will be included. Second, early implant revisions will be included as the number of events increases. Finally, as the number of individual adverse events grows, prevalence rates will be determined to provide updated national estimates.
For sustainability of this study, we launched our new FORCE-TJR QI network in August 2014 (http://www.force-tjr.org/FORCE-website-linkclinicians.html). The entire FORCE-TJR infrastructure (surveys, comparative reports, protocols) is available to growing numbers of surgeon offices and hospitals to measure pre- and post-TJR patient outcomes and adverse events. These data will serve both the quality and reporting needs of surgeons for the CMS Physician Quality Reporting System (PQRS) and accountable care, as well as expanding FORCE membership. Surgeons and hospitals pay an annual fee to support data submission, scanning, and reporting. Ancillary research grants and contracts for secondary analyses will support the data coordinating center.
Conclusion
A secure reporting website was established to disseminate surgeon-specific PRO- and clinical-outcome reports for a national patient-centered outcomes research (PCOR) registry for comparative effectiveness in TJR. We anticipate that these comparative TJR outcome data will guide future improvements in clinical best practices, health care policy, and the overall health and quality of life for patients with advanced joint disease who undergo surgical treatment.
Acknowledgments
This work was supported by Agency for Healthcare Research and Quality (AHRQ) Grant Number 1 P50HS018910-04.
The authors thank the study team: Jeroan Allison MD MS, Bruce Barton PhD, Norm Weissman PhD, Courtland Lewis MD, Philip Noble PhD, Regis O’Keefe MD PhD, Vincent Pellegrini MD, and the data analytic team: Celeste Lemay, Wenyun Yang, Michael Kenny, Betsy Costello, Dane Netherton, and Peter Lazar, for their contributions to this work.
This submission is based on work presented at the 2014 EDM Forum Symposium.
Footnotes
Disciplines
Databases and Information Systems | Health Information Technology | Health Services Research | Musculoskeletal Diseases | Orthopedics
References
- 1.Agency for Healthcare Research and Quality HCUPnet Available from: http://hcupnet.ahrq.gov. [DOI] [PubMed]
- 2.Marjoua Y, Butler CA, Bozic KJ. Public reporting of cost and quality information in orthopaedics. Clin Orthop Relat Res. 2012 Apr;470(4):1017–26. doi: 10.1007/s11999-011-2077-6. [DOI] [PMC free article] [PubMed] [Google Scholar]
- 3.ASR hip replacement recall media guide. DePuy Orthopaedics. Available from: http://www.depuy.com/usmedia. Accessed September 4, 2012.
- 4.Asadi-Lari M, Tamburini M, Gray D. Patients’ needs, satisfaction, and health related quality of life: towards a comprehensive model. Health Qual Life Outcomes. 2004 Jun 29;2:32. doi: 10.1186/1477-7525-2-32. [DOI] [PMC free article] [PubMed] [Google Scholar]
- 5.Ayers DC, Zheng H, Franklin PD. Integrating patient-reported outcomes into orthopaedic clinical practice: proof of concept from FORCE-TJR. Clin Orthop Relat Res. 2013 Nov;471(11):3419–25. doi: 10.1007/s11999-013-3143-z. [DOI] [PMC free article] [PubMed] [Google Scholar]
- 6.Franklin PD, Harrold L, Ayers DC. Incorporating patient-reported outcomes in total joint arthroplasty registries: challenges and opportunities. Clin Orthop Relat Res. 2013 Nov;471(11):3482–8. doi: 10.1007/s11999-013-3193-2. [DOI] [PMC free article] [PubMed] [Google Scholar]
- 7.Franklin PD, Allison JJ, Ayers DC. Beyond joint implant registries: a patient-centered research consortium for comparative effectiveness in total joint replacement. JAMA. 2012 Sep 26;308(12):1217–8. doi: 10.1001/jama.2012.12568. [DOI] [PMC free article] [PubMed] [Google Scholar]
- 8.Harrold L, Pascal S, Lewis C, O’Keefe R, Pellegrini V, Allison J, et al. Patient report improves posthospital discharge event capture in total joint replacement: a novel approach to capturing all posthospital event data. eGEMs. 2014 Oct;2(1) doi: 10.13063/2327-9214.1107. [DOI] [PMC free article] [PubMed] [Google Scholar]


