

Abstract
Objective
The relationship between body mass index (BMI) and stroke incidence and mortality remains controversial, particularly in Asian populations.
Methods
We conducted a prospective cohort study in a nationally representative sample of 169,871 Chinese men and women age 40 years or older. Data on body weight was obtained at baseline examination in 1991 using a standard protocol. Follow-up evaluation was conducted in 1999 to 2000, with a response rate of 93.4%.
Results
After excluding those participants with missing body weight or height values, 154,736 adults were included in the analysis. During a mean follow-up of 8.3 years, 7,489 strokes occurred (3,924 fatal). After adjustment for age, gender, physical inactivity, urbanization, geographic variation, cigarette smoking, diabetes, and education, compared with participants of normal weight (BMI 18.5–24.9), relative hazard (95% confidence interval) of incident stroke was 0.86 (0.80–0.93) for participants who were underweight (BMI < 18.5), 1.43 (1.36–1.52) for those who were overweight (BMI 25–29.9), and 1.72 (1.55–1.91) for those who were obese (BMI ≥ 30). The corresponding relative hazards were 0.76 (0.66–0.86), 1.60 (1.48–1.72), and 1.89 (1.66–2.16) for ischemic stroke and 1.00 (0.89–1.13), 1.18 (1.06–1.31), and 1.54 (1.27–1.87) for hemorrhagic stroke. For stroke mortality, the corresponding relative hazards were 0.94 (0.86–1.03), 1.15 (1.05–1.25), and 1.47 (1.26–1.72). Linear trends were significant for all outcomes (p < 0.0001).
Interpretation
These results suggest that elevated BMI increases the risk of both ischemic and hemorrhagic stroke incidence, and stroke mortality in Chinese adults.
Stroke is the third leading cause of death and the leading cause of long-term disability worldwide.1 The burden of stroke is growing in economically developing nations such as China, where stroke is the leading cause of death.2 However, a number of important questions remain unanswered, including the relationship between body mass index (BMI) and stroke incidence and stroke mortality.
Some studies have reported a significant relationship between stroke incidence and BMI,3–11 whereas others have reported no relationship12–15 or an inverse relationship,16,17 sometimes even within the same cohort.11,12 When examined by subtype, ischemic stroke is more consistently associated with BMI than hemorrhagic stroke7–10; however, few early studies examined subtype of stroke.3,4,6,13
Recent studies have examined the association in Asian populations, where BMI tends to be lower and stroke incidence higher, as compared to Western populations.18–22 Among these studies there are also conflicting results. A study of 104,928 Japanese identified an inverse association between BMI and mortality from stroke and intraparenchymal hemorrhage.20 In contrast, in a large cohort of Korean men, a J-shaped association was observed for BMI and hemorrhagic stroke, and a linear association between BMI and ischemic stroke.21 One of the few studies examining a Chinese population focused solely on men and examined only deaths from stroke.22 In this study, we examined the relationship between BMI and stroke incidence, overall and by subtype, and stroke mortality in a nationally representative population of Chinese men and women.
Subjects and Methods
Study Population
In the 1991 China National Hypertension Survey, a multistage random cluster sampling design was used to select a representative sample of the general Chinese population aged 15 years or older from all 30 provinces in mainland China.23 In 1999, investigators from each province were invited to participate in the China National Hypertension Survey Epidemiology Follow-up Study. Of the 30 provinces, 13 were not included in the follow-up because study participants’ contact information was not available. However, the sampling process was conducted independently within each province in the 1991 China National Hypertension survey, and the 17 provinces included in the follow-up study were evenly distributed in different geographic regions representing various economic developing statuses in China (Fig 1). In total, 83,533 men and 86,338 women who were aged 40 years or older at their baseline examination were eligible to participate in the follow-up study. From this population, a total of 158,666 study participants (93.4%) were identified and interviewed as part of the follow-up study. After excluding participants who were missing body weight or height values, data from 154,736 study participants were used in our analysis.
FIGURE 1.
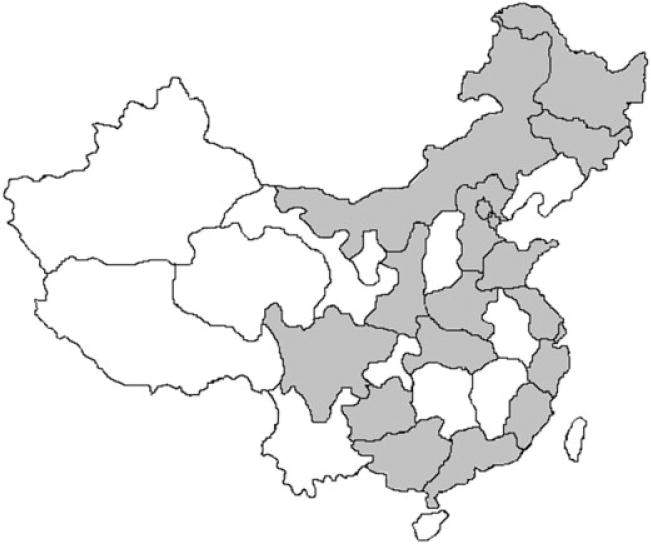
Map of China with participating provinces highlighted.
Baseline Examination
Baseline data were collected at a single clinic visit by specially trained physicians and nurses using standardized methods with stringent levels of quality control.23 Data on demographic characteristics, medical history, and lifestyle risk factors were obtained using a standard questionnaire administered by trained staff. Work-related physical activity was assessed because leisure-time physical activity was uncommon at that time. Work-related physical activity was classified based on occupation and classified into 3 levels: low (primarily desk work, retired, or disabled), medium (service sector, students), and high (farm labor, fishing, herding). Education was dichotomized as less than or at least high school graduate. Alcohol consumption was defined as drinking alcohol at least 12 times during the last year. The amount and type of alcohol consumed during the past year was collected. Cigarette smokers were defined as having smoked at least 1 cigarette per day for 1 or more years during their lifetime. Current cigarette smoking was defined as answering “Yes” to the question, “Do you smoke now?” Three blood pressure readings were obtained after the study participant had been seated quietly for 5 minutes. Hypertension was defined as a mean systolic blood pressure of at least 140mmHg and/or a diastolic blood pressure of at least 90mmHg and/or use of antihypertensive medication. Body weight and height were measured in light indoor clothing without shoes, using a standard protocol. Height was measured with the participant standing on a firm, level surface at a right angle to the vertical board of the height measurement device. A height board mounted at a 90°angle to a calibrated vertical height bar was used. Body mass index was then calculated as weight in kilograms divided by height in square meters.
Follow-up Data Collection
The follow-up examination, which was conducted between 1999 and 2000, included tracking study participants or their proxies to a current address, performing in-depth interviews to ascertain disease status and vital information, and obtaining hospital records and death certificates. All stroke events and death reported during the in-person interview were verified by obtaining medical records or death certificates from the local hospital, public health department, or police department. If hospitalization due to stroke occurred, the participant’s hospital records, including medical history, physical examination findings, laboratory test results, computed tomography (CT) scan, magnetic resonance imaging (MRI), discharge diagnosis, and/or autopsy reports, were abstracted by trained staff using a standard form. In addition, photocopies of selected sections of the participant’s inpatient record, discharge summary, and pathology reports were obtained.
End-Point Assessment and Classification
A study-wide end-point assessment committee at the Chinese Academy of Medical Sciences in Beijing, China, which included a neurologist, reviewed all medical and death records and determined the final diagnosis or underlying cause of death. Two committee members independently verified the diagnosis or cause of death from clinical symptoms and medical records. There was 87.7% ascertainment of medical records for persons reporting a stroke diagnosis. Discrepancies were adjudicated by discussion involving additional committee members. All members of the committee were blinded to the participant’s baseline risk factor information.
Incident stroke was defined as evidence of sudden or rapid onset of neurological symptoms lasting for >24 hours or leading to death in the absence of evidence for a nonstroke cause using criteria adapted from the Atherosclerosis Risk in Communities study.24 Exclusions included major brain trauma, neoplasm, coma attributable to metabolic disorders of fluid and electrolyte imbalance, vasculitis involving the brain, peripheral neuropathy, hematological abnormalities, and central nervous system infections. Transient ischemic attacks and silent brain infarctions (cases without clinical symptoms and signs) were not included. Incident strokes were further classified into ischemic (including thrombotic brain infarct, cardioembolic stroke, and lacunar infarct) or hemorrhagic (including intracerebral hemorrhage and subarachnoid hemorrhage) categories. Strokes that were classified as both ischemic and hemorrhagic were excluded from stroke subtype analysis. Imaging consisting of a CT or MRI scan was available for 62.4% of all stroke events. Fatal stroke was defined as a stroke event that led to death within 30 days of stroke diagnosis.
This study was approved by the Tulane University Health Sciences Center Institutional Review Board and the Cardiovascular Institute and Fu Wai Hospital Ethics Committee. Written informed consent was obtained from all study participants at their follow-up visit.
Statistical Analysis
Study participants were grouped into 4 categories of BMI. These categories were underweight (BMI < 18.5), normal weight (BMI 18.5–24.9), overweight (BMI 25.0–29.9), and obese (BMI ≥ 30.0).25 We also examined BMI by quintiles among men and women. Person-years of follow-up were calculated from the date of baseline examination until the date of incident or fatal stroke, death from other causes, or follow-up interview, whichever came first, for each study participant and grouped according to age in 5-year categories. Age-standardized stroke incidence and mortality were calculated using the age distribution of the Chinese population from year 2000 census data. Cox proportional hazards regression models were stratified by province to account for the multistage sampling design, and adjusted for baseline age, cigarette smoking, work-related physical activity (low, moderate, high), education (less than high school or high school graduate), geographic region (north vs south), and urbanization (urban vs rural). Because BMI may affect stroke risk through blood pressure and development of diabetes, we did not adjust for blood pressure and development of diabetes in the multivariate-adjusted models. Rather, we created a mediator model that included all of the variables in the multivariate-adjusted models with the addition of systolic blood pressure and development of diabetes, which may be involved in the causal pathway between BMI and risk of stroke. Adjusted relative risks were calculated using study participants who were normal weight as the reference group. The presence of a linear trend was tested using the medians of BMI for each group treated as a continuous variable. The presence of a J-shaped association was tested using quadratic terms. Subgroup analyses by age group, gender, cigarette smoking, hypertension, diabetes, education level, regular alcohol consumption, and physical inactivity were conducted. All statistical analyses were performed using SAS statistical software version 9.1 (SAS Institute, Cary, NC).
Results
Baseline characteristics of the study participants are presented according to BMI category in Table 1. On average, participants with elevated BMI were less often smokers, less often men, and more often classified as physically inactive. They also had diagnoses of hypertension and diabetes more often than participants with a BMI in the normal or underweight range. In general, participants with an elevated BMI were more likely to live in Northern China, in an urban residence, and/or to have graduated high school than participants with a BMI in the normal or underweight ranges.
TABLE 1.
Baseline Characteristics according to Body Mass Index among 154,736 Chinese Men and Womena
| Characteristics | Body Mass Index | |||
|---|---|---|---|---|
| < 18.5, n = 17,998 | 18.5–24.9, n = 99,935 | 25.0–29.9, n = 31,693 | ≥ 30.0, n = 5,110 | |
| Age, yr | 60.5 ± 11.6 | 55.2 ± 10.6 | 55.4 ± 9.8 | 57.5 ± 9.6 |
| Men, % | 45.2 | 51.4 | 46.0 | 30.8 |
| Current cigarette smoker, % | 43.8 | 39.6 | 31.3 | 24.8 |
| Regular alcohol consumption, % | 17.2 | 21.3 | 18.1 | 11.3 |
| Physical inactivity, %b | 33.2 | 34.6 | 44.9 | 46.8 |
| High-school graduate, % | 11.7 | 23.2 | 33.5 | 26.8 |
| Systolic blood pressure, mmHg | 122.4 ± 23.3 | 124.8 ± 21.7 | 133.6 ± 22.5 | 141.4 ± 24.1 |
| Diastolic blood pressure, mmHg | 72.7 ±11.9 | 76.6 ±11.6 | 82.5 ± 12.0 | 85.9 ± 12.3 |
| Hypertension, %c | 21.3 | 24.0 | 41.5 | 55.8 |
| Diabetes, %d | 0.5 | 1.4 | 4.5 | 7.0 |
| Living in Northern China, % | 42.2 | 63.3 | 80.7 | 88.0 |
| Urban residence, % | 37.6 | 56.5 | 83.3 | 86.5 |
| Weight, kg | 42.8 ± 5.9 | 55.9 ± 8.0 | 69.7 ± 8.2 | 80.3 ± 10.1 |
| Body mass index, kg/m2 | 17.2 ± 1.1 | 21.7 ± 1.8 | 26.9 ± 1.3 | 32.3 ± 2.6 |
Plus–minus values are means ± standard deviation.
Physical activity was assessed by categorizing the physical labor involved in a participant’s work at the time of the study.
Hypertension was defined as mean systolic blood pressure ≥140mmHg and/or diastolic blood pressure ≥90mmHg, and/or the use of antihypertensive medications.
Diabetes was assessed at follow-up.
During an average follow-up of 8.3 years, there were a total of 7,489 strokes and 3,924 deaths from stroke. Strokes that were classified as both hemorrhagic and ischemic subtypes (n = 257) were not included in the stroke subtype analysis. Age-standardized rates per 100,000 person-years for stroke incidence and mortality are presented by sex and quintile of BMI in Figures 2 and 3. Significant, linear trends were present for total stroke incidence, ischemic stroke incidence, and hemorrhagic stroke incidence for both men and women.
FIGURE 2.

Stroke incidence by subtype and quintile of body mass index per 100,000 person-years standardized by age and to the Chinese population using year 2000 census data.
FIGURE 3.

Stroke incidence and mortality by quintile of body mass index per 100,000 person-years standardized by age and to the Chinese population using year 2000 census data.
Age and multivariate-adjusted hazard ratios (HRs) with 95% confidence intervals (CIs) for stroke incidence and mortality in relation to BMI category are presented in Table 2. After stratification by province and adjustment for age, sex, cigarette smoking, alcohol consumption, physical inactivity, educational level, residence in Northern China, and residence in an urban area, there was a statistically significant linear relationship between BMI category and stroke incidence in age-adjusted and multivariate-adjusted Cox proportional hazards models (p < 0.0001). Similarly, for ischemic and hemorrhagic stroke incidence, significant linear trends were present in age-adjusted and multivariate-adjusted linear models (p < 0.0001 for multivariate-adjusted models). Stroke mortality was also significantly, linearly related to BMI category in age-adjusted (p = 0.02), and multivariate-adjusted models (p < 0.0001).
TABLE 2.
Hazard Ratios and 95% Confidence Intervals for Stroke Incidence and Mortality according to Body Mass Index among 154,736 Chinese Men and Women
| Stroke Incidence/Mortality | Body Mass Index | p Value for Linear Trend | |||
|---|---|---|---|---|---|
| <18.5 | 18.5–24.9 | 25.0–29.9 | ≥30.0 | ||
| Stroke incidence | |||||
| No. of cases | 797 | 4,271 | 2,000 | 421 | |
| Person-years of follow-up | 122,143 | 724,615 | 229,039 | 35,953 | |
| Age-standardized rate/100,000 person-yearsa | 369.8 | 497.0 | 722.2 | 852.0 | |
| Age adjusted | 0.86 (0.80–0.93) | 1.00 | 1.37 (1.30–1.45) | 1.56 (1.41–1.73) | <0.0001 |
| Multivariate Model 1b | 0.88 (0.82–0.95) | 1.00 | 1.41 (1.33–1.49) | 1.71 (1.54–1.89) | <0.0001 |
| Multivariate Model 2c | 0.86 (0.80–0.93) | 1.00 | 1.43 (1.36–1.52) | 1.72 (1.55– 1.91) | <0.0001 |
| Ischemic stroke incidence | |||||
| No. of cases | 263 | 1,961 | 1,225 | 266 | |
| Person-years of follow-up | 121,648 | 719,871 | 225,751 | 35,178 | |
| Age-standardized rate/100,000 person-yearsa | 136.4 | 229.7 | 441 | 597.3 | |
| Age adjusted | 0.72 (0.64–0.83) | 1.00 | 1.60 (1.49–1.72) | 1.79 (1.58–2.04) | <0.0001 |
| Multivariate Model 1b | 0.75 (0.65–0.85) | 1.00 | 1.64 (1.52–1.76) | 1.97 (1.73–2.25) | <0.0001 |
| Multivariate Model 2c | 0.76 (0.66–0.86) | 1.00 | 1.60 (1.48–1.72) | 1.89 (1.66–2.16) | <0.0001 |
| Hemorrhagic stroke incidence | |||||
| No. of cases | 346 | 1,499 | 521 | 116 | |
| Person-years of follow-up | 122,006 | 723,353 | 228,536 | 35,833 | |
| Age-standardized rate/100,000 person-yearsa | 168.5 | 176.5 | 194.5 | 236.3 | |
| Age adjusted | 1.00 (0.89–1.13) | 1.00 | 1.12 (1.01–1.24) | 1.39 (1.14–1.68) | 0.0016 |
| Multivariate Model 1b | 1.02 (0.91–1.15) | 1.00 | 1.15 (1.04–1.28) | 1.52 (1.25–1.84) | 0.0002 |
| Multivariate Model 2c | 1.00 (0.89–1.13) | 1.00 | 1.18 (1.06–1.31) | 1.54 (1.27–1.87) | <0.0001 |
| Stroke mortality | |||||
| No. of cases | 595 | 2,380 | 773 | 176 | |
| Person-years of follow-up | 122,262 | 725,291 | 229,510 | 36,099 | |
| Age-standardized rate/100,000 person-yearsa | 268.4 | 283.1 | 292.5 | 364.4 | |
| Age adjusted | 0.98 (0.89–1.08) | 1.00 | 1.03 (0.95–1.12) | 1.26 (1.07–1.47) | 0.0225 |
| Multivariate Model 1b | 1.00 (0.91–1.10) | 1.00 | 1.06 (0.97–1.15) | 1.38 (1.18–1.61) | 0.0028 |
| Multivariate Model 2c | 0.94 (0.86–1.03) | 1.00 | 1.15 (1.05–1.25) | 1.47 (1.26–1.72) | <0.0001 |
Standardized to the year 2000 Chinese census population.
Stratified by province and adjusted for age and sex.
Stratified by province and adjusted for age, sex, cigarette smoking, alcohol consumption, physical inactivity, education, residence in Northern China, and residence in urban area.
In mediator models, the addition of diabetes and systolic blood pressure did not decrease the significance of the linear relationships between BMI category and stroke incidence or ischemic stroke incidence (p < 0.0001); however, point estimates of the HRs were attenuated. For example, for participants with BMI < 18.5, HR (95% CI) for overall stroke incidence was 1.01 (0.94–1.10); for participants in the overweight range, it was 1.16 (1.10–1.23), and for participants in the obese range, it was 1.19 (1.07–1.32). Corresponding values for ischemic stroke were 0.89 (0.78–1.02), 1.31 (1.21–1.41), and 1.31 (1.14–1.49). In mediator models, linear trends for hemorrhagic stroke incidence and stroke mortality were marginally significant (p = 0.085 for hemorrhagic stroke incidence and p = 0.059 for stroke mortality). Corresponding HR (95% CI) values were 1.18 (1.04–1.33), 0.95 (0.85–1.05), and 1.06 (0.87–1.29) for hemorrhagic stroke incidence and 1.10 (1.00–1.21), 0.93 (0.86–1.02), and 1.02 (0.87–1.20) for stroke mortality. Tests for quadratic trend were nonsignificant in all models.
We conducted subgroup analyses to further examine the relationship between BMI and stroke incidence and mortality (Table 3). Relationships were generally consistent in direction, although not in magnitude, for BMI and risk of stroke across categories except for stroke mortality in underweight participants ≤60 years old. The results of additional subgroup analyses are presented in the online Supplemental Table.
TABLE 3.
Multivariate-Adjusted Hazard Ratio and 95% Confidence Interval for Stroke Incidence and Mortality by Specific Characteristicsa
| Stroke Incidence/Mortality | Body Mass Index | p Value for Interaction | |||
|---|---|---|---|---|---|
| <18.5 | 18.5–24.9 | 25.0–29.9 | ≥30.0 | ||
| Stroke incidence | |||||
| Gender | |||||
| Male | 0.90 (0.81–0.99) | 1.00 | 1.49 (1.39–1.61) | 1.68 (1.43–1.97) | 0.0008 |
| Female | 0.82 (0.73–0.92) | 1.00 | 1.35 (1.24–1.47) | 1.73 (1.51–1.98) | |
| Age, yr | |||||
| >60 | 0.85 (0.77–0.94) | 1.00 | 1.15 (1.05–1.26) | 1.37 (1.16–1.61) | <0.0001 |
| ≤60 | 1.09 (0.97–1.23) | 1.00 | 1.60 (1.49–1.72) | 1.99 (1.74–2.27) | |
| Current smoker | |||||
| Yes | 0.87 (0.77–0.97) | 1.00 | 1.47 (1.35–1.61) | 1.83 (1.53–2.19) | 0.0001 |
| No | 0.87 (0.78–0.97) | 1.00 | 1.41 (1.31–1.52) | 1.69 (1.49–1.91) | |
| Ischemic stroke incidence | |||||
| Gender | |||||
| Male | 0.75 (0.83–0.90) | 1.00 | 1.66 (1.51–1.84) | 1.71 (1.38–2.11) | 0.005 |
| Female | 0.76 (0.63–0.93) | 1.00 | 1.50 (1.34–1.69) | 2.01 (1.69–2.38) | |
| Age, yr | |||||
| >60 | 0.70 (0.58–0.84) | 1.00 | 1.31 (1.16–1.48) | 1.55 (1.26–1.92) | 0.004 |
| ≤60 | 1.00 (0.82–1.21) | 1.00 | 1.76 (1.60–1.93) | 2.14 (1.81–2.53) | |
| Current smoker | |||||
| Yes | 0.75 (0.62–0.90) | 1.00 | 1.63 (1.45–1.82) | 2.06 (1.65–2.57) | 0.005 |
| No | 0.77 (0.64–0.93) | 1.00 | 1.58 (1.43–1.74) | 1.82 (1.55–2.15) | |
| Hemorrhagic stroke incidence | |||||
| Gender | |||||
| Male | 1.08 (0.92–1.26) | 1.00 | 1.24 (1.08–1.43) | 1.64 (1.21–2.21) | 0.8 |
| Female | 0.91 (0.75–1.10) | 1.00 | 1.10 (0.94–1.29 | 1.43 (1.11–1.85) | |
| Age, yr | |||||
| >60 | 1.07 (0.92–1.25) | 1.00 | 0.92 (0.77–1.08) | 1.17 (0.86–1.59) | 0.0002 |
| ≤60 | 1.14 (0.94–1.39) | 1.00 | 1.35 (1.18–1.54) | 1.87 (1.45–2.40) | |
| Current smoker | |||||
| Yes | 1.06 (0.89–1.25) | 1.00 | 1.25 (1.06–1.48) | 1.60 (1.12–2.29) | 0.7 |
| No | 0.95 (0.80–1.13) | 1.00 | 1.13 (0.99–1.29) | 1.50 (1.19–1.89) | |
| Stroke mortality | |||||
| Gender | |||||
| Male | 0.99 (0.87–1.12) | 1.00 | 1.20 (1.07–1.35) | 1.61 (1.28–2.04) | 0.08 |
| Female | 0.89 (0.77–1.02) | 1.00 | 1.08 (0.95–1.23) | 1.38 (1.11–1.70) | |
| Age, yr | |||||
| >60 | 0.96 (0.86–1.08) | 1.00 | 0.91 (0.80–1.02) | 1.14 (0.92–1.42) | 0.004 |
| ≤60 | 1.29 (1.09–1.52) | 1.00 | 1.40 (1.24–1.59) | 1.86 (1.47–2.34) | |
| Current smoker | |||||
| Yes | 0.92 (0.80–1.50) | 1.00 | 1.17 (1.02–1.35) | 1.74 (1.33–2.29) | 0.09 |
| No | 0.96 (0.84–1.09) | 1.00 | 1.13 (1.01–1.26) | 1.36 (1.12–1.65) | |
Where appropriate, adjusted for age, sex, cigarette smoking, alcohol consumption, physical inactivity, education, residence in Northern China, and residence in an urban area.
Discussion
In this prospective cohort study of 154,736 Chinese men and women, BMI was linearly related to increased stroke incidence and mortality. This statistically significant linear relationship remained present after adjustment for age, sex, cigarette smoking, physical inactivity, education, regular alcohol consumption, urbanization (urban vs rural), and geographic variation (north vs south). In fully adjusted models, hazard of stroke incidence was 72% higher among participants with a BMI of ≥30 than for participants who had a BMI in the normal range (18.5–24.9). The corresponding hazards for other outcomes we examined were 89% higher for ischemic stroke incidence, 54% higher for hemorrhagic stroke incidence, and 47% higher for stroke mortality.
Our study examined both incidence and mortality from stroke among Chinese men and women, and examined incidence of stroke by subtype. These results greatly expand on the results of Zhou and colleagues, whose study did not examine stroke incidence in relationship to BMI and also did not include women.22 In the latter study, BMI was related to stroke mortality nonlinearly and only in the overweight or obese ranges (BMI >25kg/m2). In contrast, our study found a significant linear trend in stroke incidence and mortality across all BMI categories. Some of this difference in results may have been due to the smaller number of events and lack of imaging results available in the cohort studied by Zhou and colleagues.22 Our study results are most consistent with those of the Asia-Pacific Cohort Studies Collaboration, which identified a linear relationship between BMI and both ischemic and hemorrhagic stroke incidence.18 Similarly, linear relationships were present between BMI and total and ischemic stroke incidence among Korean men and women, but not for hemorrhagic stroke incidence.19,21
Unique strengths of this study include its large sample size, the high follow-up rate, the nationally representative nature of the sample, and the stringent quality control procedures that were conducted throughout. We achieved 87.7% ascertainment of medical records for persons reporting a stroke diagnosis, and imaging was available for >60% of stroke events that occurred in the population. Body weight and height were measured in our study according to a standard protocol rather than self-reported, as has been the case in other studies.20 The major limitation of our study was that body weight changes over time were not measured. Therefore, we were not able to evaluate the association between weight change and incidence of or mortality from stroke. We were not able to collect data on serum lipid levels or lipid-lowering medication use; however, the use of lipid-lowering agents was relatively rare in China during the decade of the 1990s.26 We also did not collect dietary data in the current study. However, we adjusted for urbanization (urban vs rural) and geographic region (north vs south), the 2 most important factors affecting dietary habits in China.
Other considerations include the potential effect of censoring due to coronary heart disease and choice of adiposity measures. Given the differences in the magnitude between deaths due to coronary heart disease in Western countries as compared with China, one would expect that censoring due to diseases of the heart would have a lesser effect on the results presented here than on studies conducted in the United States or European locations. Measures of body composition and distribution of fatty tissues may play a role in the association between adiposity and stroke incidence and prevalence. In this study, we chose to focus on BMI as the primary measure of adiposity, because international health recommendations principally use this measure.25
Hemorrhagic stroke is more common in Asian populations than in Western populations, accounting for up to 50% of all strokes in China but <20% of strokes in most Western countries.27 In our sample, of all confirmed strokes with CT or MRI imaging, 31% were identified as possible or confirmed hemorrhagic subtype. This likely represents an underestimate of this subtype due to a high case–fatality rate during the acute phase of stroke. Among underweight participants, risk for ischemic stroke was lower than that for normal weight participants, whereas for hemorrhagic stroke, risk was no different from that for normal weight participants. It is possible that this finding may reflect the role of serum lipid levels, which have different associations with stroke subtypes.28–30 Because this population is leaner than those in most Western countries, and relatively more participants are underweight, the relationship between being underweight and stroke can be estimated with greater precision.
In subgroup analyses, stroke mortality and hazard of either hemorrhagic or ischemic stroke incidence was more strongly related to BMI among participants who were younger (≤60 years). This finding is consistent with those of other studies examining this issue.18,19 It has been suggested that the modification of this relationship by age is multifaceted and potentially related to the biological processes of aging, detection and diagnosis, comorbidities, competing risks, and a variety of other factors. Additional subgroup analyses showed no evidence of interaction for factors such as alcohol consumption, physical inactivity, and hypertension status (see online Supplemental Table). For factors such as educational level, trends were consistent in direction but not always in magnitude.
On average, men and women in China are leaner and tend to have lower serum cholesterol levels than in most Western countries; however, the prevalence of hypertension is high, and awareness and control of hypertension remain lower.31 Obesity often results in higher blood pressures, diabetes, and high cholesterol levels, and these characteristics may be links on a causal pathway from obesity to increased stroke risk. Controlling for these variables in examinations of the effect of BMI on cardiovascular disease outcomes has been a source of debate.32 We chose to distinguish between multivariate-adjusted models and mediator models in this analysis. The addition of blood pressure to our models led to the attenuation of the association between BMI and stroke outcomes, although the linear associations remained statistically significant for overall stroke incidence and ischemic stroke incidence. This is consistent with the results of other studies examining the relationship between BMI and stroke,18,20–22 and may reflect the contribution of a variety of different factors related to obesity. Rather than lessening the importance of BMI as a predictor of stroke risk, the uniformity of this result across studies robustly supports the value of maintaining a BMI within the normal range as an essential tool in strategies for the prevention of stroke.
These results have important clinical and public health implications. In China, stroke is the leading cause of death and accounted for 1,652,885 deaths in 2002.1 Moreover, stroke was the third most common cause of death in the world. In this study we found that BMI was significantly, linearly related to increased stroke incidence, overall and by subtype, and to mortality from stroke. Maintaining a BMI in the normal range, preventing excess weight gain, and encouraging weight loss among those who are overweight or obese should be a public health priority in Asian countries, where the burden of stroke is high, and brisk economic development has brought about significant and rapid changes in lifestyle.
Supplementary Material
Acknowledgments
This study was supported by the American Heart Association, Dallas, TX (national grant-in-aid 9750612N to J.H.); the National Heart, Lung, and Blood Institute of the NIH, Bethesda, MD (grant V01 HL072507 to J.H.); the Chinese Ministry of Health, Beijing, China (grant 1999-272 to D.G.); the Chinese Academy of Medical Sciences, Beijing, China; and the National Center for Research Resources of the NIH, Bethesda, MD via the Tulane Hypertension and Renal Center of Excellence (grant P20-RR017659, L.A.B.).
Footnotes
Dr Bazzano had full access to all of the data in the study and takes responsibility for the integrity of the data and the accuracy of the data analysis.
Additional Supporting Information may be found in the online version of this article.
References
- 1.World Health Organization. Global burden of disease 2002: deaths by age, sex and cause for the year 2002. Geneva, Switzerland: WHO; 2003. [Google Scholar]
- 2.He J, Gu D, Wu X, et al. Major causes of death among men and women in China. N Engl J Med. 2005;353:1124–1134. doi: 10.1056/NEJMsa050467. [DOI] [PubMed] [Google Scholar]
- 3.Hubert HB, Feinleib M, McNamara PM, Castelli WP. Obesity as an independent risk factor for cardiovascular disease: a 26-year follow-up of participants in the Framingham Heart Study. Circulation. 1983;67:968–977. doi: 10.1161/01.cir.67.5.968. [DOI] [PubMed] [Google Scholar]
- 4.Shinton R, Shipley M, Rose G. Overweight and stroke in the Whitehall study. J Epidemiol Community Health. 1991;45:138–142. doi: 10.1136/jech.45.2.138. [DOI] [PMC free article] [PubMed] [Google Scholar]
- 5.Abbott RD, Behrens GR, Sharp DS, et al. Body mass index and thromboembolic stroke in nonsmoking men in older middle age. The Honolulu Heart Program. Stroke. 1994;25:2370–2376. doi: 10.1161/01.str.25.12.2370. [DOI] [PubMed] [Google Scholar]
- 6.Selmer R, Tverdal A. Body mass index and cardiovascular mortality at different levels of blood pressure: a prospective study of Norwegian men and women. J Epidemiol Community Health. 1995;49:265–270. doi: 10.1136/jech.49.3.265. [DOI] [PMC free article] [PubMed] [Google Scholar]
- 7.Rexrode KM, Hennekens CH, Willett WC, et al. A prospective study of body mass index, weight change, and risk of stroke in women. JAMA. 1997;277:1539–1545. doi: 10.1001/jama.1997.03540430051032. [DOI] [PubMed] [Google Scholar]
- 8.Kurth T, Gaziano JM, Berger K, et al. Body mass index and the risk of stroke in men. Arch Intern Med. 2002;162:2557–2562. doi: 10.1001/archinte.162.22.2557. [DOI] [PubMed] [Google Scholar]
- 9.Jood K, Jern C, Wilhelmsen L, Rosengren A. Body mass index in mid-life is associated with a first stroke in men: a prospective population study over 28 years. Stroke. 2004;35:2764–2769. doi: 10.1161/01.STR.0000147715.58886.ad. [DOI] [PubMed] [Google Scholar]
- 10.Kurth T, Gaziano JM, Rexrode KM, et al. Prospective study of body mass index and risk of stroke in apparently healthy women. Circulation. 2005;111:1992–1998. doi: 10.1161/01.CIR.0000161822.83163.B6. [DOI] [PubMed] [Google Scholar]
- 11.Harmsen P, Lappas G, Rosengren A, Wilhelmsen L. Long-term risk factors for stroke: twenty-eight years of follow-up of 7457 middle-aged men in Goteborg, Sweden. Stroke. 2006;37:1663–1667. doi: 10.1161/01.STR.0000226604.10877.fc. [DOI] [PubMed] [Google Scholar]
- 12.Harmsen P, Rosengren A, Tsipogianni A, Wilhelmsen L. Risk factors for stroke in middle-aged men in Goteborg, Sweden. Stroke. 1990;21:223–229. doi: 10.1161/01.str.21.2.223. [DOI] [PubMed] [Google Scholar]
- 13.Haheim LL, Holme I, Hjermann I, Leren P. Risk factors of stroke incidence and mortality. A 12-year follow-up of the Oslo Study. Stroke. 1993;24:1484–1489. doi: 10.1161/01.str.24.10.1484. [DOI] [PubMed] [Google Scholar]
- 14.Shaper AG, Wannamethee SG, Walker M. Body weight: implications for the prevention of coronary heart disease, stroke, and diabetes mellitus in a cohort study of middle aged men. BMJ. 1997;314:1311–1317. doi: 10.1136/bmj.314.7090.1311. [DOI] [PMC free article] [PubMed] [Google Scholar]
- 15.Hart CL, Hole DJ, Smith GD. Risk factors and 20-year stroke mortality in men and women in the Renfrew/Paisley study in Scotland. Stroke. 1999;30:1999–2007. doi: 10.1161/01.str.30.10.1999. [DOI] [PubMed] [Google Scholar]
- 16.Singh PN, Lindsted KD, Fraser GE. Body weight and mortality among adults who never smoked. Am J Epidemiol. 1999;150:1152–1164. doi: 10.1093/oxfordjournals.aje.a009942. [DOI] [PubMed] [Google Scholar]
- 17.Singh PN, Lindsted KD. Body mass and 26-year risk of mortality from specific diseases among women who never smoked. Epidemiology. 1998;9:246–254. [PubMed] [Google Scholar]
- 18.Ni Mhurchu C, Rodgers A, Pan WH, Gu DF, Woodward M. Body mass index and cardiovascular disease in the Asia-Pacific region: an overview of 33 cohorts involving 310 000 participants. Int J Epidemiol. 2004;33:751–758. doi: 10.1093/ije/dyh163. [DOI] [PubMed] [Google Scholar]
- 19.Park JW, Lee SY, Kim SY, Choe H, Jee SH. BMI and stroke risk in Korean women. Obesity (Silver Spring) 2008;16:396–401. doi: 10.1038/oby.2007.67. [DOI] [PubMed] [Google Scholar]
- 20.Cui R, Iso H, Toyoshima H, et al. Body mass index and mortality from cardiovascular disease among Japanese men and women: the JACC study. Stroke. 2005;36:1377–1382. doi: 10.1161/01.STR.0000169925.57251.4e. [DOI] [PubMed] [Google Scholar]
- 21.Song YM, Sung J, Davey Smith G, Ebrahim S. Body mass index and ischemic and hemorrhagic stroke: a prospective study in Korean men. Stroke. 2004;35:831–836. doi: 10.1161/01.STR.0000119386.22691.1C. [DOI] [PubMed] [Google Scholar]
- 22.Zhou M, Offer A, Yang G, et al. Body mass index, blood pressure, and mortality from stroke: a nationally representative prospective study of 212,000 Chinese men. Stroke. 2008;39:753–759. doi: 10.1161/STROKEAHA.107.495374. [DOI] [PubMed] [Google Scholar]
- 23.Wu X, Duan X, Gu D, Hao J, Tao S, Fan D. Prevalence of hypertension and its trends in Chinese populations. Int J Cardiol. 1995;52:39–44. doi: 10.1016/0167-5273(95)02443-z. [DOI] [PubMed] [Google Scholar]
- 24.Rosamond WD, Folsom AR, Chambless LE, et al. Stroke incidence and survival among middle-aged adults: 9-year follow-up of the Atherosclerosis Risk in Communities (ARIC) cohort. Stroke. 1999;30:736–743. doi: 10.1161/01.str.30.4.736. [DOI] [PubMed] [Google Scholar]
- 25.World Health Organization. Obesity: preventing and managing the global epidemic Report of a WHO Consultation. Geneva, Switzerland: WHO; 2000. (WHO Technical Report Series 894). [PubMed] [Google Scholar]
- 26.Muntner P, Gu D, Reynolds RF, et al. Therapeutic lifestyle changes and drug treatment for high blood cholesterol in China and application of the Adult Treatment Panel III guidelines. Am J Cardiol. 2005;96:1260–1265. doi: 10.1016/j.amjcard.2005.06.068. [DOI] [PubMed] [Google Scholar]
- 27.Feigin VL, Lawes CM, Bennett DA, Anderson CS. Stroke epidemiology: a review of population-based studies of incidence, prevalence, and case-fatality in the late 20th century. Lancet Neurol. 2003;2:43–53. doi: 10.1016/s1474-4422(03)00266-7. [DOI] [PubMed] [Google Scholar]
- 28.Iso H, Jacobs DR, Jr, Wentworth D, Neaton JD, Cohen JD. Serum cholesterol levels and six-year mortality from stroke in 350,977 men screened for the multiple risk factor intervention trial. N Engl J Med. 1989;320:904–910. doi: 10.1056/NEJM198904063201405. [DOI] [PubMed] [Google Scholar]
- 29.Puddey IB. Low serum cholesterol and the risk of cerebral haemorrhage. Atherosclerosis. 1996;119:1–6. doi: 10.1016/0021-9150(95)05634-3. [DOI] [PubMed] [Google Scholar]
- 30.Yano K, Reed DM, MacLean CJ. Serum cholesterol and hemorrhagic stroke in the Honolulu Heart Program. Stroke. 1989;20:1460–1465. doi: 10.1161/01.str.20.11.1460. [DOI] [PubMed] [Google Scholar]
- 31.Gu D, Reynolds K, Wu X, et al. Prevalence, awareness, treatment, and control of hypertension in china. Hypertension. 2002;40:920–927. doi: 10.1161/01.hyp.0000040263.94619.d5. [DOI] [PubMed] [Google Scholar]
- 32.Jousilahti P, Tuomilehto J, Vartiainen E, Pekkanen J, Puska P. Body weight, cardiovascular risk factors, and coronary mortality. 15-year follow-up of middle-aged men and women in eastern Finland. Circulation. 1996;93:1372–1379. doi: 10.1161/01.cir.93.7.1372. [DOI] [PubMed] [Google Scholar]
Associated Data
This section collects any data citations, data availability statements, or supplementary materials included in this article.