Abstract
Recent sequencing studies have extensively explored the somatic alterations present in the nuclear genomes of cancers. Although mitochondria control energy metabolism and apoptosis, the origins and impact of cancer-associated mutations in mtDNA are unclear. In this study, we analyzed somatic alterations in mtDNA from 1675 tumors. We identified 1907 somatic substitutions, which exhibited dramatic replicative strand bias, predominantly C > T and A > G on the mitochondrial heavy strand. This strand-asymmetric signature differs from those found in nuclear cancer genomes but matches the inferred germline process shaping primate mtDNA sequence content. A number of mtDNA mutations showed considerable heterogeneity across tumor types. Missense mutations were selectively neutral and often gradually drifted towards homoplasmy over time. In contrast, mutations resulting in protein truncation undergo negative selection and were almost exclusively heteroplasmic. Our findings indicate that the endogenous mutational mechanism has far greater impact than any other external mutagens in mitochondria and is fundamentally linked to mtDNA replication.
DOI: http://dx.doi.org/10.7554/eLife.02935.001
Research organism: human
eLife digest
The DNA in a cell's nucleus must be copied faithfully, and divided equally, when a cell divides to produce two new cells. Mistakes—or mutations—are sometimes made during the copying process, and mutations can also be introduced by exposing DNA to damaging agents known as mutagens, such as UV light or cigarette smoke. These mutations are then maintained in all of the descendants of the cell. Most of these mutations have no impact on the cell's characteristics (‘passenger mutations’). However, ‘driver mutations’ that allow cells to divide uncontrollably and spread to other body sites can lead to cancer.
Mitochondria are cellular compartments that are responsible for generating the energy a cell needs to survive and are also responsible for initiating programmed cell death. Mitochondria contain their own DNA—entirely separate from that in the nucleus of the cell—that encodes the proteins most essential for energy production. Mitochondrial DNA molecules are frequently exposed to damaging molecules called reactive oxygen species that are produced by the mitochondria. Therefore, these reactive oxygen species have been thought to be one of the most important causes of mitochondrial DNA mutations. In addition, because cancer cells produce energy differently to normal cells, mutations in the mitochondrial DNA that change the ability of the mitochondria to produce energy have been conventionally thought to help normal cells to become cancerous. However, conclusive evidence for a link between cancer and mitochondrial DNA mutations is lacking.
Ju et al. examined the mitochondrial DNA sequences taken from 1675 cancer biopsies from over thirty different types of cancer and compared these to normal tissue from the same patients. This revealed 1907 mutations in the mitochondrial DNA taken from the cancer cells. The pattern of the mutations suggests that the majority of the mutations are not introduced from reactive oxygen species, but from the errors the mitochondria themselves make in the process of duplicating their DNA when a cell divides. Unexpectedly, known mutagens, such as cigarette smoke or UV light, had a negligible effect on mitochondrial DNA mutations.
Contrary to conventional wisdom, Ju et al. found no evidence that the mitochondrial DNA mutations help cancer to develop or spread. Instead, like passenger mutations found in the DNA in the cell nucleus, most mitochondrial genome mutations have no discernible effect. However, Ju et al. revealed that DNA mutations that damage normal mitochondrial activity are less likely to be maintained in cancer cells. Presumably, mitochondria containing these proteins produce less energy, and so a cell containing too many of these mutations will find it harder to survive. This shows that having enough correctly functioning mitochondria is essential for even cancer cells to thrive.
Introduction
All cancers result from somatic mutations in their genomes. Beyond the ∼3200 Mb of nuclear genomic DNA, human cells have hundreds to thousands of mitochondria present in every cell, each carrying one or a few copies of the 16,569 bp circular mitochondrial genomes (Smeitink et al., 2001; Legros et al., 2004; Koppenol et al., 2011). In addition to their role in cellular energy balance through oxidative phosphorylation, mitochondria are involved in many essential cellular functions including modulation of oxidation–reduction status, contribution to cytosolic biosynthetic precursors, and initiation of apoptosis. Mitochondria in eukaryotic cells evolved by endosymbiosis from a free-living α-proteobacterium (Gray et al., 1999). Over 2 billion years of co-evolution, many ancestral mitochondrial genes have transferred to the nucleus (Falkenberg et al., 2007; Calvo and Mootha, 2010; Wallace, 2012). What remains in the mitochondrial genome is distinctive for the striking asymmetry between the two complementary mtDNA strands in terms of nucleotide content and gene distribution (Andrews et al., 1999). The heavy (H) strand is guanine-rich (C/G = 0.4) and is the template from which most mitochondrial proteins (12 out of 13) are transcribed, whereas only one protein-coding gene, MT-ND6, is transcribed from the correspondingly cytosine-rich light (L) strand.
Mutations in the mitochondrial genome cause inherited disease (Chinnery, 1993), with a maternal inheritance pattern because only eggs contribute mitochondria to the zygote. The penetrance of inherited mitochondrial disease is determined stochastically by both the random assortment of mutated vs wild-type mitochondrial genomes during meiosis and random drift during the early cell divisions after fertilization. In cancer, the role of somatically acquired mtDNA mutations is controversial. Although cancer-specific mutations have been previously reported (Polyak et al., 1998; Brandon et al., 2006; Chatterjee et al., 2006; He et al., 2010; Larman et al., 2012), the limited sample size or poor sensitivity of capillary sequencing for heteroplasmic mutations has not allowed a comprehensive analysis of the mutational signatures of mitochondrial mutations nor their likely functional significance. It has long been proposed that mitochondria might contribute to cancer development given their fundamental importance to cellular biology (Wallace, 2012). Previous reports suggested that mitochondrial somatic mutations might be under positive selection and thus contribute to cancer development, but the small number of reported mutations renders this conclusion uncertain (Brandon et al., 2006; Chatterjee et al., 2006; Larman et al., 2012; Schon et al., 2012). Nonetheless, the hypothesis of functionally relevant mitochondrial mutations is an appealing one because cancer cells have greatly increased energy demands over normal cells and demonstrate a switch from aerobic glycolysis in mitochondria to lactic acid fermentation in the cytosol (the Warburg effect) (Hanahan and Weinberg, 2011; Koppenol et al., 2011).
In each cell cycle, the replicating genome is at risk of de novo mutations, which can promote the development of cancer. These mutations may be generated by intrinsic cellular errors during DNA replication or repair or through exposure to mutagens, such as reactive oxygen species, tobacco smoke, and ultraviolet light (Pleasance et al., 2010a, 2010b). Recently, >20 mutational signatures operative in cancers have been identified in the nuclear genome (Alexandrov et al., 2013). Whether any of these mutational processes also affect the mitochondrial genome has not been studied. Furthermore, whether there are mtDNA-specific mutational processes in somatic cells remain unclear, although the many unique features of mtDNA replication and repair, coupled with the high concentration of reactive oxygen species generated by the electron transport chain, could be associated with distinctive mutation signatures.
In this study, we compare 1675 cancer and paired normal mtDNA sequences across 31 tumor types using massively parallel DNA sequencing technologies to obtain a systematic and unbiased catalog of somatic mitochondrial mutations. We find that mtDNA mutations are almost exclusively the product of a mutational process that is specific to mitochondria and probably linked to the unique mechanism of genome replication these organelles employ. We find no evidence for positive selection of mitochondrial mutations during oncogenesis, suggesting that they confer no clonal advantage on the nascent cancer cells.
Results
mtDNA sequencing and Mutation Calling
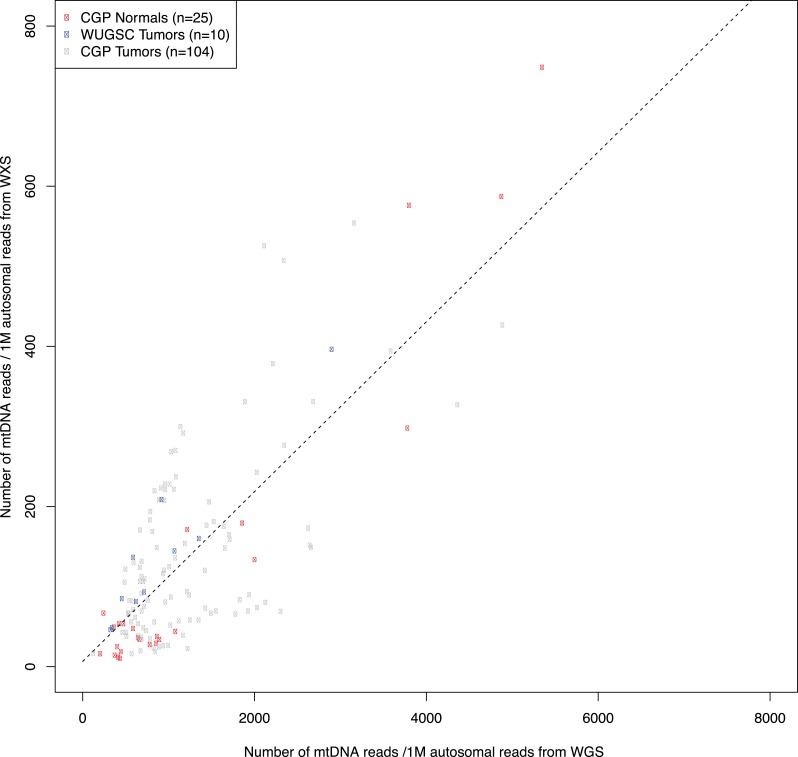
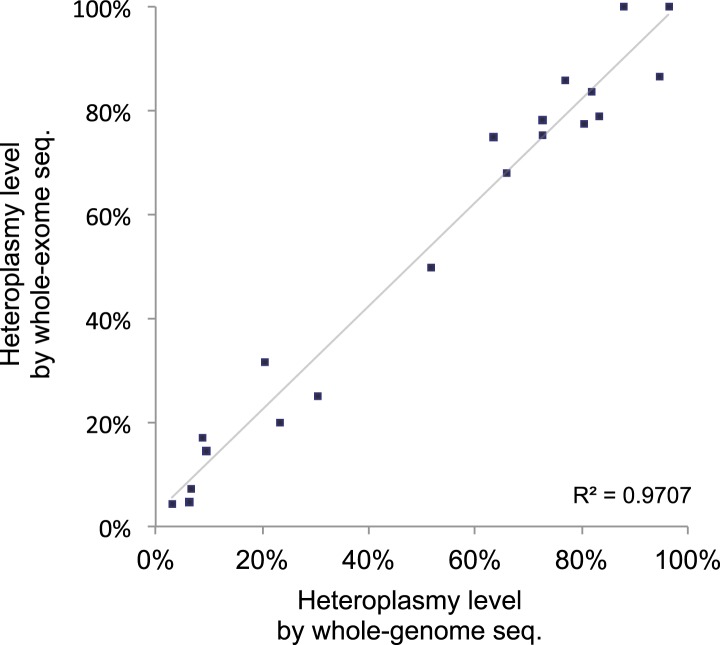
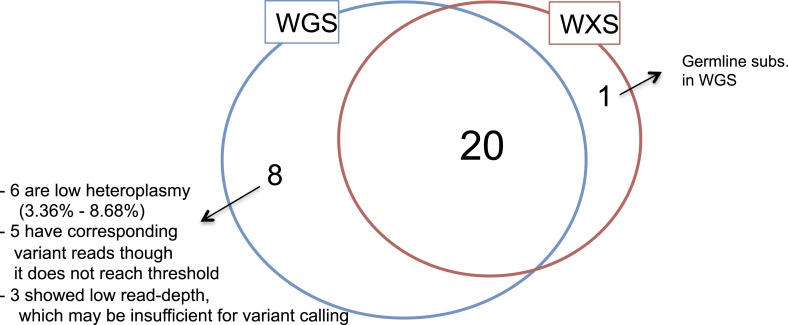
We extracted the mtDNA sequences from 704 whole-genome and 971 whole-exome sequencing data generated on primary cancers and compared them with mtDNA sequences from their matched normal samples. Given the abundance of mtDNA per cancer cell, a standard coverage of 30–40× in the nuclear genome provides significantly greater coverage of the mitochondrial genome (average read depth = 7901.0×), enabling accurate identification of somatic mutations including rare heteroplasmic variants. We also assessed whether whole-exome sequencing could be used to identify mtDNA mutations from off-target reads derived from the mitochondrial genome. We found an average read depth of 92.1× across the mitochondrial genome in exome studies. From 139 samples in which we had both exome and whole-genome sequencing data, the overall read depths correlated strongly (R2 = 0.59, Figure 1—figure supplement 1) as did variant allele fractions for mtDNA somatic mutations (R2 = 0.97, Figure 1—figure supplement 2). Validation experiments suggested the sensitivity of whole-exome sequencing for detection of mtDNA somatic mutations to be 71.4% compared to whole-genome sequencing (Figure 1—figure supplement 3 and ‘Materials and Methods’, ‘Off-target mtDNA reads in whole-exome sequencing’ and ‘DNA cross-contamination’).
To reduce potential false-positive calls of mtDNA somatic mutations, we only report variants called with an allele fraction of >3%. This eliminates the risk of miscalls due to mtDNA-derived pseudogenes in the nucleus (NuMTs) because mtDNA copy numbers are 100–1000 times higher than nuclear genomes in human somatic cells, and the sequence homology between mtDNA and NuMTs presented in the human reference genome is generally <95% (in 96 out of 101 NuMTs with length greater than 300 bp). Furthermore, pairwise comparison between cancer and matched normal mtDNAs from the same individual further minimizes the contamination of NuMTs in the mutation calling.
The catalog of mtDNA somatic mutations
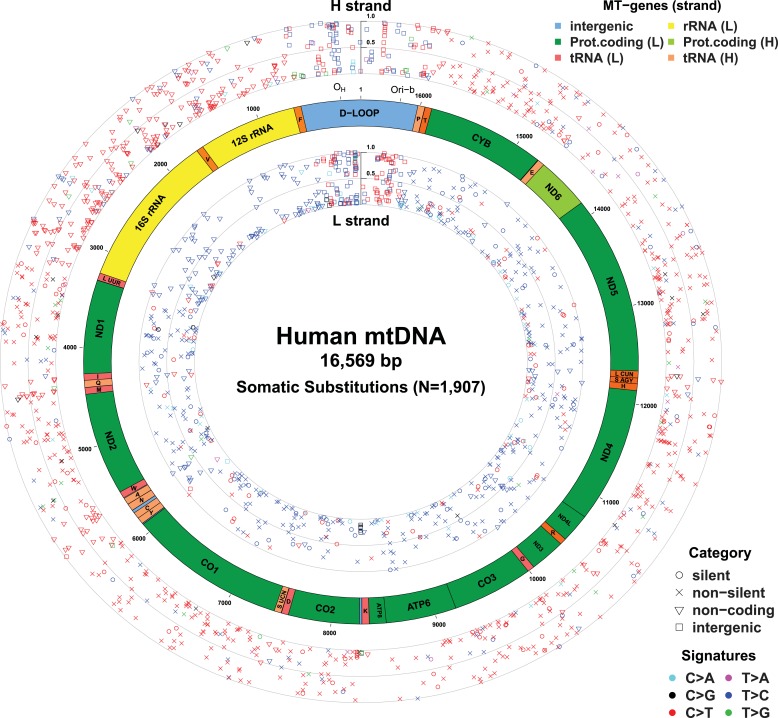
In total, 1675 tumor–normal pairs across 31 tumor types were analyzed (Table 1 and Supplementary file 1). For 61 of these patients, we had sequencing data available from multiple sites of the primary cancer, several time points or matched primary cancers, and metastases (a total of 73 such cancer samples), allowing us to study the timing of mtDNA mutations in cancer evolution (Supplementary file 1). We identified 1907 somatic mtDNA substitutions (Figure 1 and Supplementary file 2). In contrast to inherited polymorphisms (n = 38,706, available at Supplementary file 2), which were almost always homoplasmic in both the cancer and counterpart normal, the variant allele fractions (VAFs) of these somatic substitutions were highly variable in the cancer, ranging from our detection threshold (3%) to homoplasmy (100%). Of these 1907 somatic substitutions, 1209 (63.4%) were not registered in the databases of mtDNA common polymorphism (Ingman and Gyllensten, 2006; Levin et al., 2013). In comparison, when we examined substitutions found in both the tumor and the normal samples from a patient, only 21 (0.05%) were not registered in the polymorphism databases, a significantly different fraction from the tumor-only variants (p < 10−10; Chi-squared test). We found 595 (31.2%) recurrent mutations that can be collapsed onto 246 mtDNA positions, which is a 6.9-fold higher level of recurrence than expected by chance (p < 10−10). This suggests that the generation or fixation of mtDNA mutations is not random, but influenced by factors such as the underlying mutational process or positive selection.
Table 1.
Summary statistics of mtDNA sequence data
| WGS | WXS | Average mt RD (WGS) | Average mt RD (WXS) | Total | WGS | WXS | Average mt RD (WGS) | Average mt RD (WXS) | Total | ||
|---|---|---|---|---|---|---|---|---|---|---|---|
| Breast | 284 | 98 | 11594.3 | 52.7 | 382 | Meningioma | 0 | 12 | - | 42.5 | 12 |
| Colorectal | 1 | 75 | 34916.9 | 276.6 | 76 | Ependymoma | 1 | 9 | 10323.7 | 52.7 | 10 |
| Lung | 60 | 0 | 2798.1 | - | 60 | ||||||
| Prostate | 80 | 0 | 17810.6 | - | 80 | MPD | 12 | 138 | 1517.0 | 10.9 | 150 |
| Hepatocellular | 0 | 47 | - | 205.8 | 47 | MDS | 3 | 75 | 5648.7 | 44.5 | 78 |
| Melanoma | 13 | 13 | 513.9 | 353.5 | 26 | ALL | 64 | 6 | 886.6 | 35.9 | 70 |
| Gastric | 0 | 13 | - | 184.1 | 13 | CLL | 6 | 0 | 5002.2 | - | 6 |
| Cholangiocarcinoma | 0 | 8 | - | 143.9 | 8 | AML | 1 | 6 | 6783.6 | 27.4 | 7 |
| Mesothelioma | 0 | 6 | - | 106.3 | 6 | Multiple myeloma | 0 | 69 | - | 43.2 | 69 |
| Bladder | 54 | 0 | 646.2 | - | 54 | AMKL | 0 | 9 | - | 24.2 | 9 |
| Renal | 0 | 23 | - | 35.4 | 23 | Lymphoma | 0 | 4 | - | 99.5 | 4 |
| Ovarian | 0 | 38 | - | 58.9 | 38 | ||||||
| Uterine | 27 | 23 | 736.0 | 149.5 | 50 | Osteosarcoma | 38 | 90 | 9525.5 | 119.2 | 128 |
| Cervical | 0 | 52 | - | 85.2 | 52 | Chondrosarcoma | 0 | 47 | - | 99.1 | 47 |
| Adenoid cystic ca. | 1 | 60 | 714.7 | 75.6 | 61 | Ewing sarcoma | 0 | 27 | - | 69.5 | 27 |
| Head & Neck | 43 | 3 | 1369.1 | 18.8 | 46 | Kaposi sarcoma | 0 | 9 | - | 181.0 | 9 |
| Chordoma | 16 | 11 | 1240.0 | 82.1 | 27 | ||||||
| Total; 31 cancer types | 704 | 971 | 1675 | ||||||||
WGS, whole-genome sequencing; WXS, whole-exome sequencing; mt RD, mitochondrial read depth; MPD, myeloproliferative disease; MDS, myelodysplastic syndrome; ALL, acute lymphoblastic leukemia; CLL, chronic lymphoblastic leukemia; AML, acute myeloid leukemia; AMKL, acute megakaryoblastic leukemia.
Figure 1. Mitochondrial somatic substitutions identified from 1675 Tumor–Normal pairs.
mtDNA genes and intergenic regions are shown. The strand of genes is shown based on mtDNA strand containing equivalent sequences of transcribed RNA. Substitution categories (silent, non-silent (missense and nonsense), non-coding (tRNA and rRNA), and intergenic) are shown by the shapes of each substitution. Six classes of substitutions are presented color-coded. The substitutions on the H, and L strand (when six substitutional classes were considered) are shown outside and inside of mtDNA genes, respectively. Vertical axes for H and L strand substitutions represent the VAF of each variant.
Figure 1—figure supplement 1. Correlation in amount of mtDNA reads between whole-genome and whole-exome sequencing.
Figure 1—figure supplement 2. Correlation of heteroplasmy levels between whole-genome and whole-exome sequencing.
Figure 1—figure supplement 3. Validation of mtDNA somatic substitutions.
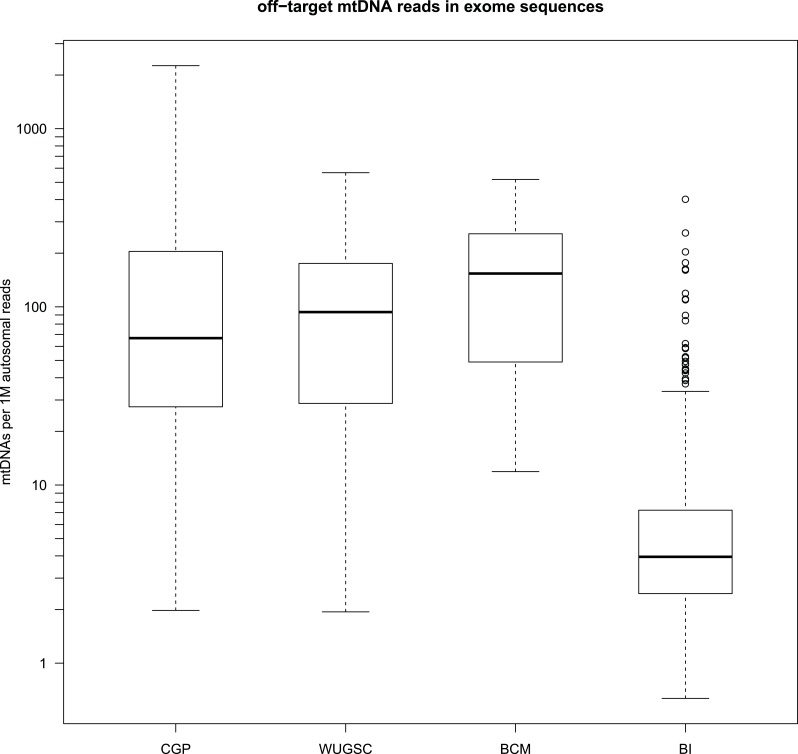
Figure 1—figure supplement 4. Amount of off-target mtDNA reads across four sequencing centers.
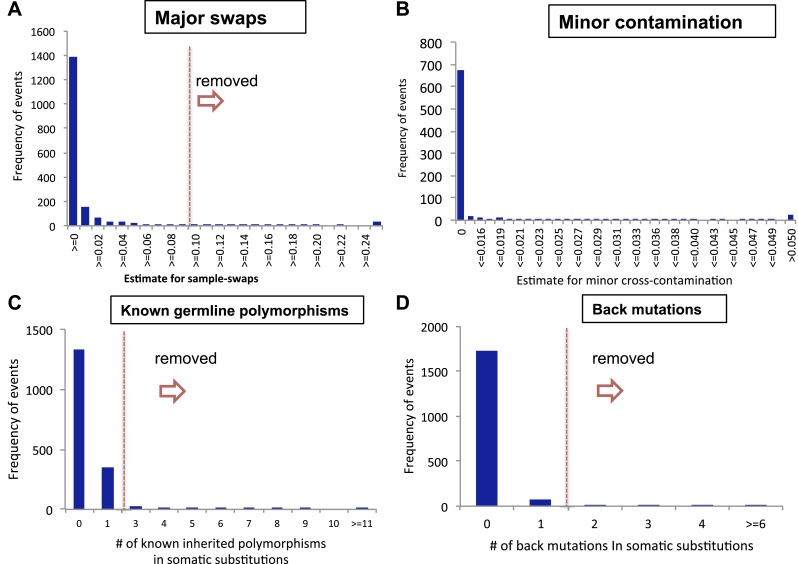
Figure 1—figure supplement 5. Filtering samples of potential DNA contaminations.
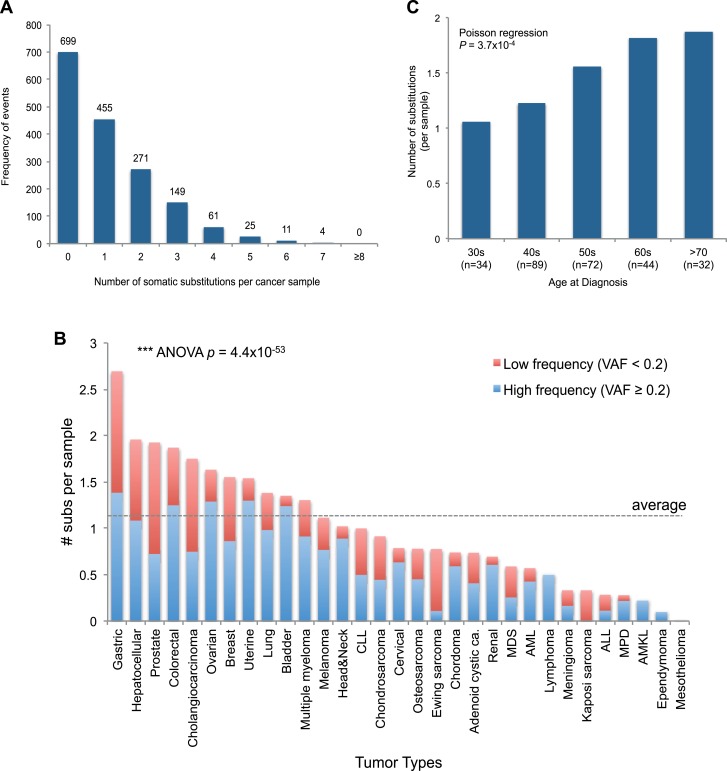
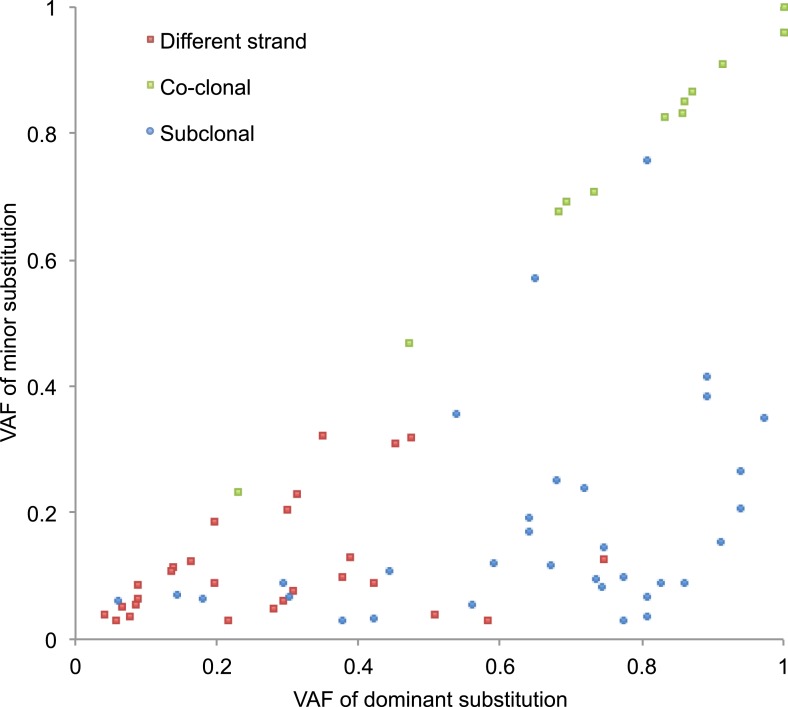
Of the 1675 cancer samples, 976 (58.3%) harbored at least one somatic substitution and 521 (31.1%) had multiple substitutions, ranging from 2 to 7 (Figure 2A). In those with multiple substitutions, 72 pairs of mutations were sufficiently close to phase (Nik-Zainal et al., 2012b) such that we could determine whether they were linked on the same mtDNA genome or were on different copies. We found that 45 (62.5%) pairs of mutations were linked on the same mtDNA genome (Supplementary file 3 and Figure 2—figure supplement 1). Furthermore, of these linked mutations, 33 showed a clear temporal order: that is, one mutation was demonstrably sub-clonal to the other. This is rather unexpected, since each somatic cell has 100–1000 copies of the mitochondrial genome, and we might anticipate that random mutations would, on average, affect different copies. That many pairs of mutations are phased on the same mtDNA genome and yet show a clear sub-clonal relationship suggests that they occur sufficiently separated in time to allow the mitochondrial genome carrying the earlier mutation to drift towards a substantial fraction of all genomes in that cell before the second mutation occurs, consistent with a previous report (De Alwis et al., 2009).
Figure 2. mtDNA somatic substitutions of human cancer.
(A) Number of somatic substitutions in a tumor sample. (B) Average number of somatic substitutions per sample across 31 tumor types. (C) Age of diagnosis and number of mtDNA somatic substitutions in breast cancers.
Figure 2—figure supplement 1. VAFs of phased somatic mtDNA substitutions.
The number of somatic mtDNA substitutions varied significantly according to tumor type (p = 4.4 × 10−52) after correcting for confounding variables such as sequencing coverage: gastric, hepatocellular, prostate, and colorectal cancers had the highest number of mtDNA substitutions (Figure 2B). In contrast, hematologic cancers (acute lymphoblastic leukemia, myeloproliferative disease, and myelodysplastic syndrome) had fewer mutations. Several possible explanations could underpin these differences across tumor types. It could be that the mutation rates differ across cell lineages; it could be that selection pressures shape the number of mutations; or the number of mtDNA genome generations could differ across cell lineages. Of these explanations, we believe that the second is unlikely because, as we shall see, positive selection is not a major component of mitochondrial mutations. Interestingly, we find a positive correlation between the number of mtDNA somatic mutations and age at diagnosis in breast cancers (p = 0.0004; Figure 2C), in keeping with the idea that the number of mitochondrial generations is linked to mutation burden. The mutational burden of an established cancer represents the accumulated variation acquired in the lineage of cell divisions from fertilized egg to transformed cell and will include events acquired in normal development and homeostasis as well as those acquired during tumorigenesis (Stratton et al., 2009). Interestingly, mtDNA mutations have been found at high rates in normal colonic crypt cells (Taylor et al., 2003; Ericson et al., 2012). Given that we find high burdens of mutations in colonic tumors as well, the differences we see across tumor types may arise from pre- or post-transformation differences in mtDNA burden across tissues.
Extracting mtDNA mutational signatures
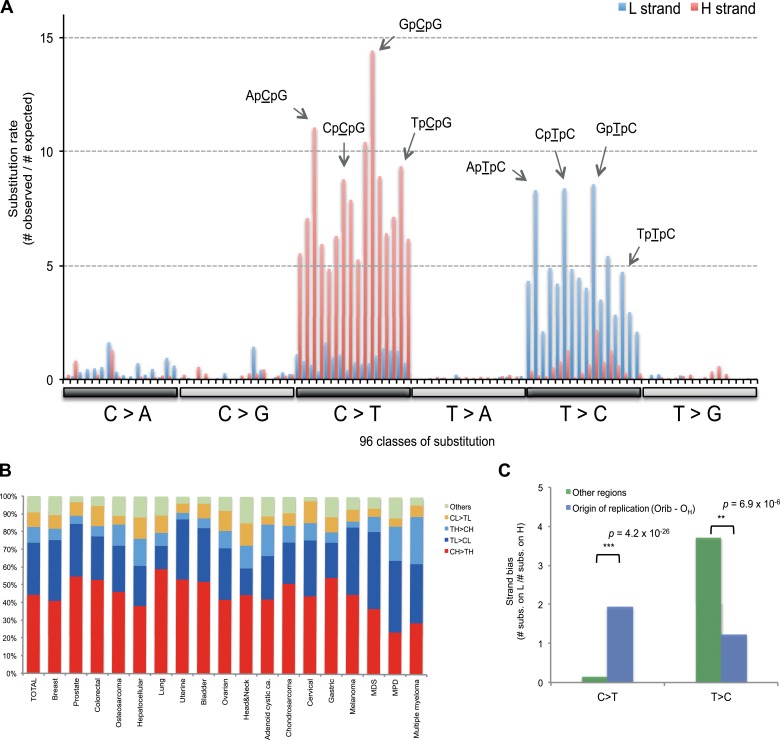
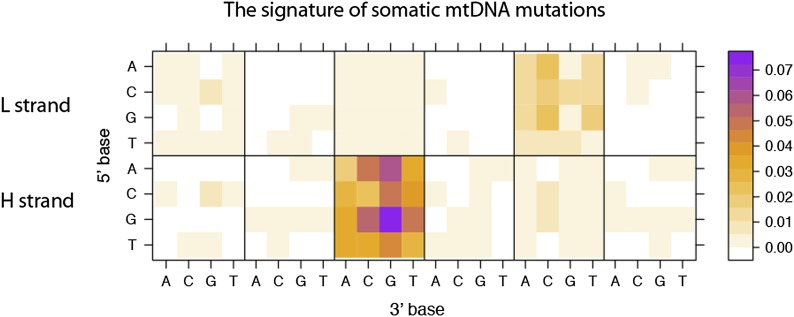
With respect to signatures of somatic substitutions, C > T and T > C transitions constituted 90.9% of all the 1907 substitutions (Figure 1) among the six classes of possible base substitutions. To characterize this aggregated signature of mtDNA cancer specific mutations in more detail, we looked for the presence of mtDNA strand bias between the complementary H and L strands of mtDNA. The two main substitution classes showed an extreme level of mtDNA strand bias. 84.1% of the C > T transitions were on the H strand. This level of strand bias occurred despite the fact that cytosine is 2.4-fold less common on the H than the L strand, so the C > T substitution rate is 12.6-fold higher on the H strand. By contrast, 76.8% of the T > C transitions were on the L strand despite its lower thymine content (1.3-fold less than the H strand). This implies that the T > C mutation rate on the L strand is 4.2-fold higher than on the H strand.
We then examined the sequence context in which these mutations occurred by examining the bases immediately 5′ and 3′ to the mutated bases. This generates 96 possible mutation classes (the 6 substitution classes multiplied by the 16 combinations of immediate 5′ and 3′ nucleotides). Both C > T and T > C mutations showed highly distinctive sequence contexts. CH > TH substitutions (i.e. C > T mutations on the H strand) were enriched for the NpCpG trinucleotide context (8- to 15-fold more frequent than expected by chance; Figure 3A). By contrast, TL > CL substitutions (i.e. T > C mutations on the L strand) showed 5- to 8-fold enrichment in NpTpC. This strand-asymmetric mutational signature is not similar to any of the 21 cancer-associated mutational signatures recently identified from the nuclear DNA of 30 different cancer types (Alexandrov et al., 2013).
Figure 3. Replicative strand bias for mtDNA somatic substitutions.
(A) Replicative strand-specific substitution rate (# of observed/# of expected) by 96 trinucleotide context. Substitutions in a specific mtDNA segment (from Ori-b to OH) are not included, because they present a different substitutional signature. (B) Mutational signature across tumor types. Eighteen tumor types, which include at least 25 mtDNA mutations, were shown. (C) Inverted substitution signature in the Ori-b–OH.
Figure 3—figure supplement 1. Replicative strand bias observed in mtDNA substitutions.
Of the 18 tumor types that presented at least 25 mtDNA somatic substitutions in this study, the mutational signatures were broadly consistent across tumor types (Figure 3B), with the exception that multiple myeloma had a somewhat higher rate of TH > CH changes than other histologies (p = 8.1 × 10⁻⁶). Thus, in contrast to the mutational signatures found in nuclear genomes, where there is striking heterogeneity both across tumor types and across individuals within a tumor type (Alexandrov et al., 2013), the mutational profile in the mitochondrial genome of somatic cells is remarkably homogeneous.
Replication-coupled mutational process in mitochondria
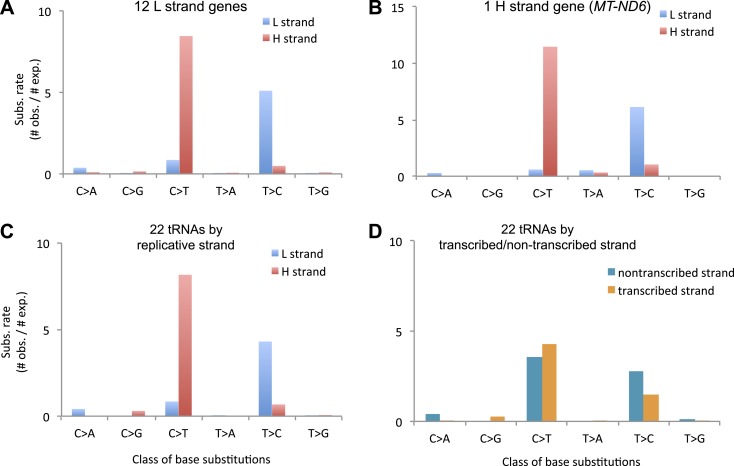
The major known cause of mutational strand bias in nuclear DNA is transcription-coupled nucleotide excision repair, where DNA lesions on the transcribed (non-coding) strand are more frequently repaired (Alexandrov et al., 2013). However, we find that the strand bias always favors CH > TH and TL > CL whether the gene is transcribed from the H strand or from the L strand (Figure 3—figure supplement 1). This is not compatible with transcription-coupled repair, for which the direction of strand bias is fundamentally dictated by which strand is transcribed.
Instead, the mtDNA mutational strand bias reported here appears to be driven by differences in replication between the two strands. mtDNA replication harbors substantial strand asymmetry between the H and L strands: mtDNA replication initiates from an origin of replication (OH) in the D-loop, with the nascent H and the L strand replicating as leading and lagging strand, respectively (Clayton, 1982; Falkenberg et al., 2007; Holt and Reyes, 2012). We observed that C > T substitutions were prevalent in the leading (heavy) strand, whereas T > C substitutions were found in the lagging (light) strand (Figure 1). Remarkably, this strand bias was reversed in the D-loop itself (Figures 1 and 3C), further suggesting that the mtDNA somatic mutations are replication-coupled: according to a recently proposed bidirectional model of mtDNA replication (Yasukawa et al., 2005, 2006; Holt and Reyes, 2012), mtDNA replication is also able to initiate from the so-called Ori-b site, typically located around genomic position 16,197 and proceeds on both strands away from the origin (Figure 1). Replication of the nascent H strand continues unimpeded like the traditional model, but the nascent L strand terminates at the so-called OH site, typically around mtDNA position 191 bp. Under this model, then, the leading and lagging strand are reversed in the few hundred base-pairs of the D-loop, which is consistent with the reversed mutational signature in this region (Figures 1 and 3C).
Equivalent mutational signature during human mtDNA Evolution
It is not entirely straightforward to infer the mutational signatures operating on the mitochondrial genome in the germline. De novo mutations are generally rare and often discovered because they cause disease; distinguishing the ancestral base and the derived base is challenging for single nucleotide polymorphisms; and comparative mtDNA genomics across species extends over considerable evolutionary time. In contrast, because ancestral and derived states are defined for tumor–normal pairs, a much clearer picture emerges of the somatic mtDNA mutation signature. We therefore assessed whether the signature that emerges for somatic mitochondrial mutations could extend to explain sequence composition of the human mtDNA genome.
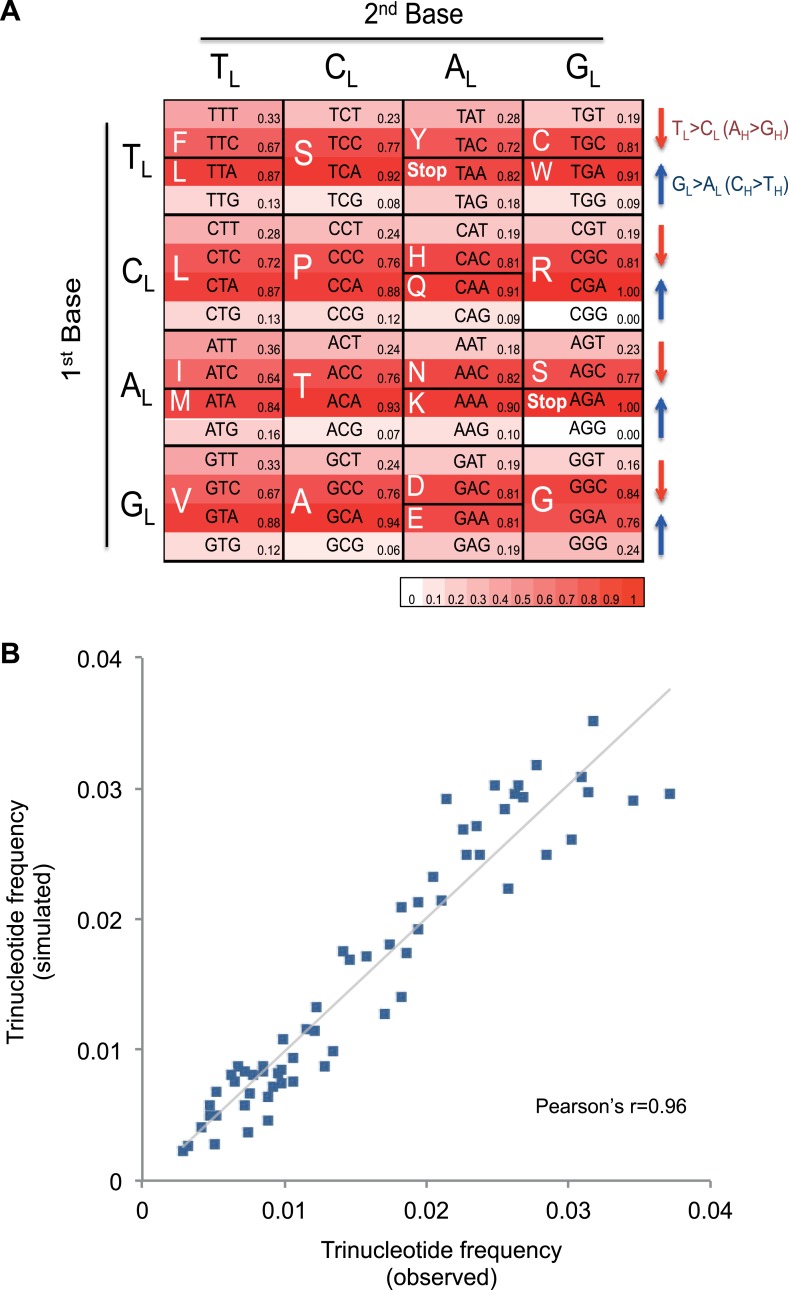
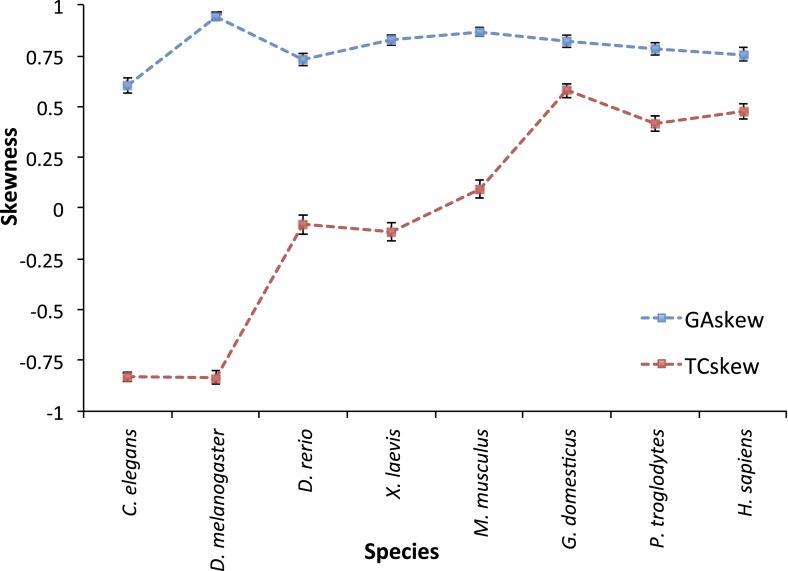
It appears that the mutational mechanism which has generated the CH > TH and TL > CL signature in cancer mtDNA is equivalent to the one that has been operating during evolution of human germline mtDNA (Nikolaou and Almirantis, 2006). This manifests as the depletion of certain codons in the reference human mtDNA sequence through the action of the CH > TH and TL > CL mutational process over time (Figure 4A). For example, the GCG triplet codon (Alanine) appears to have been replaced by its synonymous GCA codon (due to CH > TH (GL > AL)), with the former being 15.8-fold less frequently observed in the 12 mtDNA protein-coding genes that are transcribed from the H strand (and encoded on the L strand). All 32 synonymous codon pairs present the same tendency. Consistent with this interpretation, the gene transcribed from the L strand (MT-ND6) demonstrates the opposite direction of skew. Further analyses of mtDNA codon usage from seven animal species suggest that the CH > TH and TL > CL mutational pressure may be characteristic of vertebrates, and primates in particular (Figure 4—figure supplement 1).
Figure 4. Mutational signature similar to processes shaping human mtDNA sequence over evolutionary time.
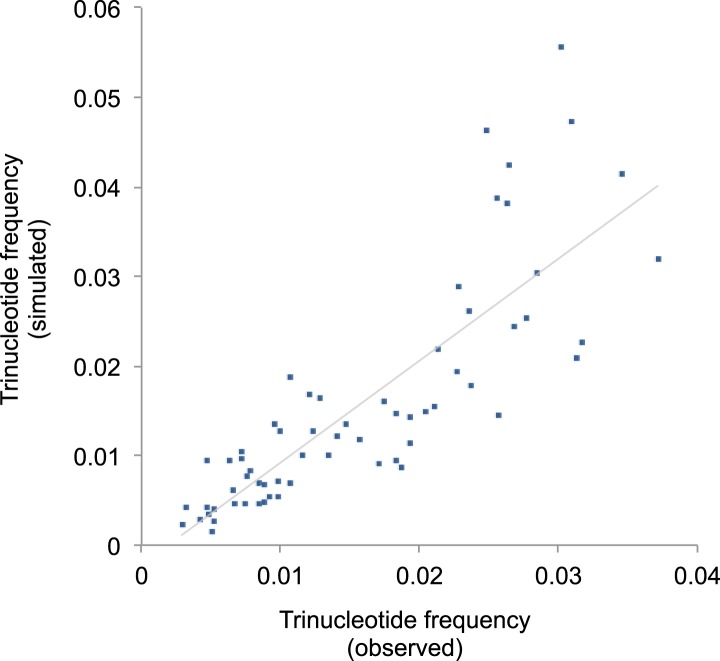
(A) Triplet codon depletion in human mtDNA by equivalent (CH > TH and TL > CL) mutational pressure. Relative frequency of each triplet codon within synonymous pairs (NNT–NNC or NNA–NNG) is shown by color. The arrows beside the box highlight the T > C (red) and G > A (blue) substitutional pressures on the L strand in germline mtDNA. (B) Correlation of triplet codon frequencies between from observed and from simulated evolutions of a random sequence mtDNA by the mtDNA somatic mutational signature with constraining mitochondrial protein sequences.
Figure 4—figure supplement 1. TC and GA skew for L strand mtDNA genes across 8 animal species.
Figure 4—figure supplement 2. Correlation of triplet codon frequencies between from observed and from simulated evolutions under the mtDNA somatic mutational signature.
To quantify whether the somatic mutational signature we have defined can fully explain the trinucleotide frequency of human mtDNA, we performed evolutionary simulations. First, we simulated the evolution of a random DNA sequence under the mutational signature described here. By mutational pressure alone, the random sequence starts losing certain hypermutable trinucleotides until eventually reaching a stationary sequence composition. The actual sequence composition of the human mitochondrial genome strongly resembles this stationary distribution (Pearson's r = 0.83; p < 0.0001; Figure 4—figure supplement 2). In a second simulation, a random sequence encoding the exact amino acid sequence of the reference mitochondrial genome was evolved by synonymous mutations under the observed mtDNA signature until reaching a stationary sequence composition (mutation–selection equilibrium). These simulations also eventually approximate the observed human mitochondrial genome (Pearson's r = 0.96, p < 0.0001; Figure 4B). These analyses strongly suggest that the mitochondrial mutation signature observed in cancer cells closely reflects the mutation signature active in the germline, which has continuously shaped the mitochondrial genome during human evolution.
Negative selection on truncating mtDNA mutations and tRNA anticodons
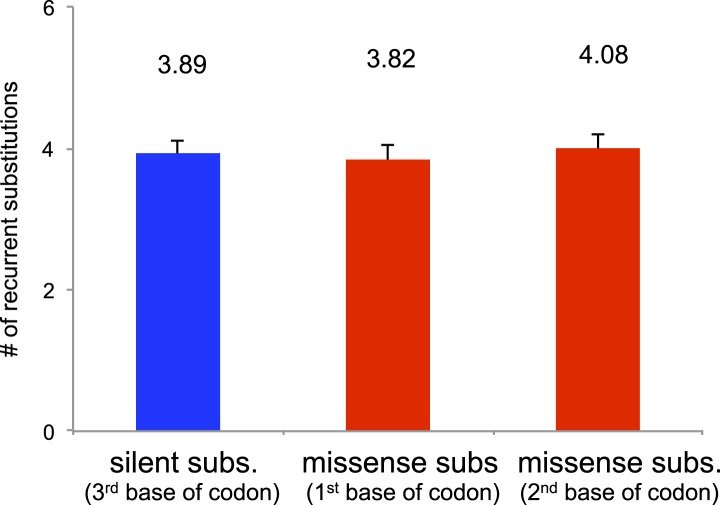
Next, we assessed the functional impact of somatic mtDNA mutations. Of the 1907 substitutions, 1153 (60.5%) were in the 13 protein-coding genes. These include 63 nonsense, 4 stop-lost, 878 missense, and 208 silent substitutions (Supplementary file 2). In addition, out of 251 indels we observed, 110 occurred within protein-coding genes (Supplementary file 2). Of the missense substitutions, 245 (27.9%) were recurrent, affecting 107 distinct mtDNA sites. Although this very high level of mutation clustering could, at first sight, be interpreted as evidence for positive selection, we found that silent substitutions were also frequently recurrent (28 recurrent variants in 13 mtDNA sites), with no substantial difference in recurrence rates between silent and missense mutations (p = 0.19; Figure 5—figure supplement 1). We believe this recurrence to be the consequence of a high mtDNA mutation rate with restricted mutational signature (CH > TH and TL > CL). Independently recurring mutations in human germline mtDNA are well described across human evolution (Levin et al., 2013).
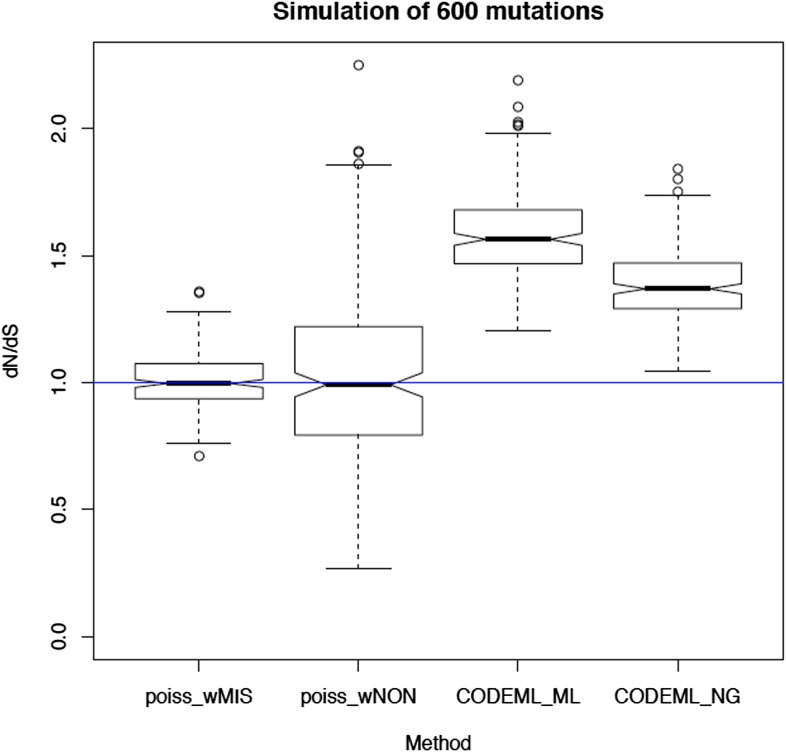
The ratio of somatic missense to silent substitutions (Rms:s) is apparently higher (4.2, 878/208) than that observed for cancer-associated somatic mutations in nuclear DNA (generally around 2:1 to 3:1 across tumor types) (Greenman et al., 2007; Nik-Zainal et al., 2012a). At face value, this again could be interpreted as evidence for positive selection. However, as described above, the somatic mtDNA mutational signature shows extreme strand asymmetry and the same mutational signature has been operative in the germline over evolutionary time. Thus, the dominant mutational signature has already acted on potentially synonymous sites in the mitochondrial genome (Figure 4A), meaning that any new somatic changes are much less likely to be silent. In keeping with this, a dN/dS ratio (See ‘Materials and Methods’) calculated taking into account both the mutational signature and the mtDNA codon usage revealed that missense mutations accumulate at a frequency very close to that expected under neutrality (dN/dS = 1.21; 95% confidence interval, 1.015–1.434; p = 0.031). This indicates that despite the apparent high ratio of missense to silent mutations, the vast majority of mtDNA mutations are passengers with no convincing evidence suggesting the existence of driver mitochondrial DNA mutations. Additional gene-by-gene analysis further revealed that no single gene had a higher than expected rate of missense or nonsense mutations (Supplementary file 4).
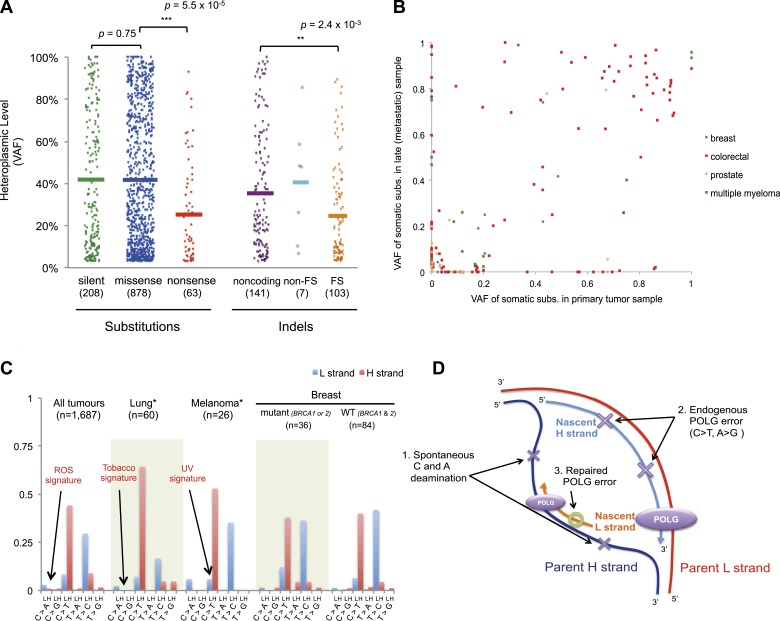
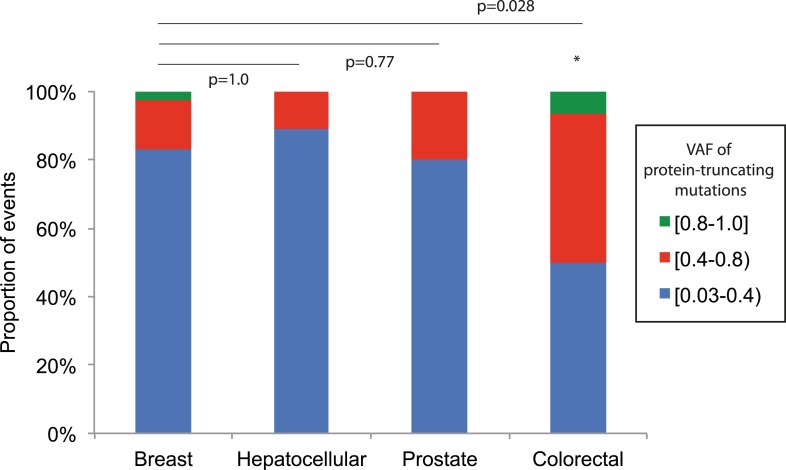
For nonsense substitutions and frameshift indels, we observe a somewhat different picture. Taking into account the mutation signature and amino acid composition of the mitochondrial genome, the overall ratio of nonsense mutations to silent mutations is exactly that expected by chance (dNonsense/dS = 1.004; 95% confidence interval, 0.699–1.443; p = 0.98). However, while missense and silent substitutions exhibited equivalent variant allele fractions (average VAFs; 40.1% and 40.9%, respectively; p = 0.8), nonsense substitutions presented significantly lower VAFs (average 26.4%; p = 6x10⁻⁵), as did frameshift indels (average 25.0%; p = 2 × 10⁻³; Figure 5A). Taken together, these data suggest that nonsense mutations occur at the expected rate given the underlying mutational process. However, while silent and missense substitutions frequently achieve high allele fractions in tumor cells due to the effects of random drift, there are significantly greater constraints on mitochondrial genomes carrying protein-inactivating mutations. The inference here is that cancer cells carrying such deleterious mutations at or near homoplasmy are at a selective disadvantage and hence do not contribute to clonal expansions, underlining the importance of functional mitochondria to cancer cells. The extent of such disadvantage may vary according to tumor type: for example colorectal cancers show less negative selection compared to breast cancers (p = 0.028; Figure 5—figure supplement 2).
Figure 5. Selection and mutational process for mtDNA somatic substitutions.
(A) Truncating mutations (nonsense substitutions and frame-shifting (FS) coding indels) present significantly lower VAF. (B) Change of VAF of mtDNA somatic mutation between primary and metastatic (or late) cancer tissues. (C) Mutational signature for mtDNA across various tumor types. None of the three highlighted mechanisms or nuclear DNA double-strand breaks repair mechanism (BRCA) match with the mtDNA mutational signature. * Only substitutions in protein-coding genes considered. (D) A proposed model of mtDNA mutational process.
Figure 5—figure supplement 1. Number of recurrent substitutions between silent and missense substitutions.
Figure 5—figure supplement 2. Comparison of VAF of protein-truncating mutations (nonsense substitution and indels) across tumor types.
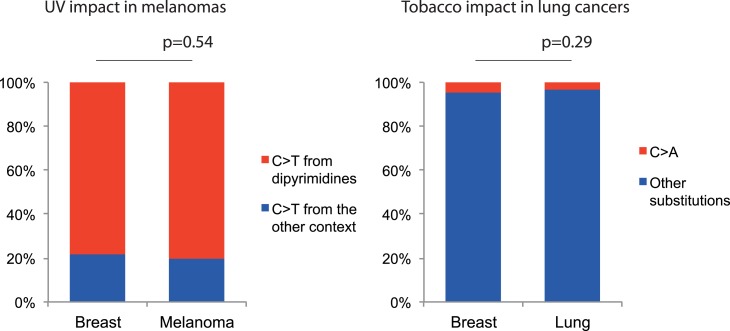
Figure 5—figure supplement 3. Negligible impacts of external mutagens (UV and tobacco smoking) to the somatic mtDNA mutations.
We found 171 mtDNA substitutions in mitochondrial tRNA sequences, which are very similar to the expected number (168.2, p = 0.82) from the mutational signature. Interestingly, none of the substitutions was located in the trinucleotide anticodon site of the tRNA (expected number = 7.6, p = 0.006). This suggests that mutations in tRNA anticodons confer a similar selective disadvantage as protein-truncating mutations, presumably because such mutations would lead to systematic erroneous aminoacylation of nascent proteins during translation of the relevant codon.
Next, we assessed whether any specific somatic mutations showed evidence of positive selection. Out of the 1907 somatic substitutions, 16 (0.8%) overlapped with known disease-associated mtDNA mutations, such as mutations frequently detected in MELAS (Mitochondrial Encephalomyopathy, lactic acidosis, and stroke-like episodes) and LHON (Leber hereditary optic neuropathy) (Supplementary file 2). In addition, ten mutations within mitochondrial protein-coding, tRNA and rRNA genes showed significantly higher recurrent rate than expected from background mutational signature (Supplementary file 5). However, it remains unclear whether this high recurrence reflects positive selection, because any factors not included in our background model of the mutational process, such as local mutation hotspots, could also explain a mild excess of mutations at a given nucleotide.
mtDNA mutations across tumor Evolution
We investigated whether somatic mtDNA mutations are more likely to become homoplasmic later in tumor evolution by assessing paired cancer samples, either primary and metastasis (breast, colorectal, and prostate) or primary and relapse (myeloma) (Figure 5B and Supplementary file 1). As mentioned earlier, 73 late (metastasis or relapse) cancer samples were sequenced in addition to the primary tissues. Among the mtDNA mutations identified in either of the paired cancer samples, a number of different patterns were observed. There were mutations at high VAF in the primary not found in the metastasis (n = 49); mutations in the metastasis not found in the primary (n = 49); and shared mutations (n = 71) at high or low VAF, sometimes with evidence for drift (VAF difference >0.2) between the two samples (n = 25). These data, particularly the mutations found in the metastasis only, suggest that mitochondrial mutations can occur throughout the time course of tumor evolution, and still drift to homoplasmy with appreciable frequency, as suggested previously (Coller et al., 2001). To assess the plausibility of this conclusion, we modeled the dynamics of mtDNA mutations based on a few simplifying assumptions (See ‘Materials and Methods’, Evolutionary dynamics of neutral mitochondrial mutations). We find that the expected number of neutral mitochondrial mutations drifting to homoplasmy increases linearly with mutation rate and number of cell divisions. Based on a mutation rate of 10−7/base-pair/generation (Coller et al., 2001; Hudson and Chinnery, 2006), this leads to an average ∼1 homoplasmic mutation for every 1000 cell generations.
Origins of mtDNA somatic mutations
We also explored whether the mutational forces that are so critical to shaping the nuclear genome during tumor evolution could affect the mitochondrial genome. In cancers associated with exogenous mutagens, such as tobacco-associated lung cancer and ultraviolet light-associated melanomas, we found no evidence of the mutational signatures characteristic of these carcinogens among the mtDNA mutations (Figure 5C, Figure 5—figure supplement 3). Moreover, BRCA1 and BRCA2 mutations showed no evident influence on mitochondrial genomes in breast cancer (Figure 5C), in contrast to their effects on nuclear genomes exhibiting an even distribution of mutations across all trinucleotide contexts (Nik-Zainal et al., 2012a; Alexandrov et al., 2013). Taken together, it appears that the primary mtDNA mutational process is endogenous to mitochondria and is very different to those operating in nuclear DNA. It is surprising that the endogenous mutational process has far greater impact than any external forces, as the physicochemical interactions of ultraviolet light or the chemicals in cigarette smoke with DNA should be similar in both genomes. The simulations described above suggest the major explanation to be that the endogenous mutation rate is several orders of magnitude greater than that expected for exogenous carcinogens, thus swamping any signal.
Discussion
In theory, there are two potential sources of the mtDNA variants we observed in cancer tissues: (1) somatically acquired, or de novo, mutations accumulated during the cancer clone's lineage of cell divisions from the fertilized egg or (2) low-level heteroplasmic mtDNA present in the oocyte (therefore maternally inherited) amplified in cancer but lost from normal tissue by random drift (He et al., 2010; Freyer et al., 2012; Payne et al., 2013). We believe the majority of the variants we find are genuinely acquired somatically. First, of the 45 pairs of somatic mutations phased together on the same copy of the mtDNA genome, at least 33 (73.3%) showed a clear sub-clonal relationship and therefore their occurrence is separated in time, or apparently somatic. Secondly, 63.4% of our substitutions were not previously reported as germline polymorphisms. This is a much higher rate than reported for equivalent analyses on heteroplasmic variants in non-cancer samples (8/37; 21.6%) (Li et al., 2010), although methodological differences may somewhat contribute to this apparent difference (Goto et al., 2011; Avital et al., 2012). Thirdly, if the variants were due to inherited low-level heteroplasmy, we would not expect to see such variation across tissue types, since all tissue types derive from the fertilized egg. It is difficult to distinguish whether the variants we observe occur before or after the initiating driver mutations that herald tumorigenesis, but our analysis of paired samples does suggest that they can occur both early and late. Given the homogeneity of the mutational signature across tumor types and its inferred resemblance to the germline mtDNA mutational process, we would hypothesize that new mutations occur at a fairly constant and high rate per mitochondrial genome replication throughout all cell divisions.
On the basis of the mutational signature observed here, somatic substitutions are unlikely to be attributable to reactive oxygen species (ROS), as previous reports have suggested (Polyak et al., 1998; Larman et al., 2012). Guanine oxidation by ROS predominantly causes G:C > T:A transversion (Thilly, 2003; Delaney et al., 2012), which constitute only 4.0% of the mutations in our data (Figure 5C). Instead, we propose three replication-coupled mechanisms that can explain the strand asymmetric CH > TH and TL > CL mutational signature and define a model of the mtDNA mutational process (Figure 5D). First, the parent H strand, displaced and single-stranded during mtDNA replication (Holt and Reyes, 2012), could be more prone to cytosine deamination (generating CH > TH) and/or adenine deamination (Lindahl, 1993; Saccone et al., 1999; Faith and Pollock, 2003) (generating TL > CL). Secondly, endogenous mtDNA polymerase (POLG) replication errors (Zheng et al., 2006) (which show the pattern of C > T and A > G substitutions) could be preferentially generated on the leading strand (Pavlov et al., 2002). Thirdly, there may be differences between the efficiency of repair between the leading and lagging strand (Pavlov et al., 2003). Further, the mutation pattern reported here is consistent with the hypothesized bidirectional initiation of mtDNA genome replication (Yasukawa et al., 2005, 2006; Holt and Reyes, 2012).
It appears that most of the mtDNA missense mutations we observe become fixed in tumor progenitor cells without distinct physiological advantage. All the statistical testing performed in this study—variant allele fraction comparison across different categories of somatic mutations, number of recurrent mutations, and dN/dS ratio—suggest that mtDNA somatic substitutions accumulate largely neutrally. This is not different from previous observations in nuclear genomes: of the thousands of somatic mutations found in a cancer genome, many fewer than a hundred are believed to confer a selective advantage to the cancer cell (Stratton et al., 2009). In contrast, protein-truncating mutations showed evidence of negative selection, at the level of constraints on the allele fraction achieved. The implication of this is that the inactivating mutations occur at an appreciable rate, but the fraction of mitochondrial genomes per cell carrying these variants cannot increase beyond a certain limit without impairing the selective fitness of that cell. Having a sizable number of mitochondria with fully intact proteome remains critical to the fitness of a cancer cell.
Materials and methods
Sequencing data
All the sequences were generated by Illumina platforms (either Genome Analyzer or HiSeq 2000). With respect to TCGA data, we downloaded aligned bam files through UCSC CGHub (http://cghub.ucsc.edu). Sequencing reads were aligned on the human reference genome build 37 (GRCh37) and human reference mtDNA sequence (revised Cambridge reference sequence, rCRS [Andrews et al., 1999]), mainly by BWA alignment tool. Samtools (Li and Durbin, 2009) and Varscan2 (Koboldt et al., 2012) were used for manipulating sequence reads and for calling somatic mutations, respectively. Sequence data have been deposited in the European Genome-phenome Archive (EGA; https://www.ebi.ac.uk/ega/home ; study accession # EGAS00001000968; dataset accession numbers EGAD00001001014 for primary samples and EGAD00001001015 for metastatic samples). Sample accession numbers are available in the Supplementary file 6.
Off-target mtDNA reads in whole-exome sequencing
Most of the currently available whole-exome capture kits, including Agilent Technologies SureSelect Human All Exon 50 Mb (Agilent Technologies Inc., Santa Clara, CA) used mostly in this study, do not target mtDNA genes (Falk et al., 2012). However, because of the abundance of mtDNA in human cells (100–100,000 copies per cell), it is expected that a number of mtDNA fragments could be off-target captured. We checked whether the amount of off-target mtDNA reads was sufficient for mtDNA variant detection. Whole-exome sequencing (normal samples) generated by CGP (n = 855), WUGSC (Washington University Genome Sequencing Center; n = 140), and BCM (Baylor College of Medicine; n = 85) contained ∼100 off-target mtDNA reads per 1M autosomal reads (Figure 1—figure supplement 4). We concluded that these could be sufficient for the downstream analyses, because ordinary 10 Gb whole-exome data would provide ∼60× read depth for mtDNA here. However, whole-exome data sequenced by BI (Broad Institute; n = 436) included far less, ∼3 off-target mtDNA per 1 M autosomal reads, which would show ∼2× mtDNA read depth per 10 Gb exome sequencing (Figure 1—figure supplement 4). It may be due to ‘improved’ exome-capture protocols by BI to increase the DNA-capture efficiency and on-target rate (Fisher et al., 2011). Therefore, we did not include whole-exome data sequenced from BI for further analysis.
139 samples were sequenced by both whole-genome and whole-exome sequencing. From these, we compared the amount of off-target mtDNA reads from whole-exome sequencing with that of whole-genome sequencing. It showed clear positive linear correlation (Figure 1—figure supplement 1).
DNA cross-contamination
Given the abundance of mtDNA in the cancer cells, 1–214× coverage cancer whole nuclear genome sequencing provides extensive coverage of mtDNA (average read depth = 7901.0×; Supplementary file 2) enabling accurate identification of somatic mutations, even if heteroplasmic. Whole-exome sequencing data were also included because off-target reads provided sufficient coverage (average read depth = 92.1×) to analyze mtDNA mutations.
This high coverage of mtDNA, especially from whole-genome sequencing, permitted us to identify heteroplasmic variants (our detection threshold was 3%; see ‘Variant calling’ for more details). However, because sample swaps and/or DNA cross-contaminations would definitely generate false-positive somatic variants, we filtered out suspicious DNA samples as described below.
-
1. Major sample swaps
A subset of tumor and normal sequencing pairs, of which the nuclear genotypes were not matching with each other, were removed from further analyses. We randomly selected 320 common single-nucleotide polymorphism sites on the 22 human autosomes, of which the minor allele frequency is ∼50% (45–55%) according to The 1000 Genomes Project (1000 Genomes Project Consortium et al., 2010). Of the 320 sites, homozygous positions in normal tissues (which showed >90% variant allele fraction (VAF) with bases Q score >20) were compared with the corresponding genotypes in the counterpart cancer. Sample pairs were removed if the genotype mismatch rate was greater than 0.1 (; Nhet, number of heterozygote positions; Nhom, number of homozygote positions; Nwt, number of wild-type positions) (Figure 1—figure supplement 5A). We note 0 is expected for the rate when genotyping is perfect and sample pairs are from the same individual. By contrast, 0.5 is expected when samples were from different individuals.
-
2. Minor cross-contamination
We estimated DNA cross-contamination levels with the VAF of autosomal homozygous SNPs genotyped from the common (population minor allele frequency ∼50%) SNP sites. Theoretically, if there is no sequencing (and mapping) error, all the homozygote SNP sites in pure samples should present 100% VAFs. However, when samples are contaminated, corresponding VAFs are reduced because the contaminant has only an ∼25% of chance of having homozygote SNPs on the same site. Therefore, minor contamination levels (C) of each cancer sequencing data were estimated as below:
where RDhom is sequencing read depth, RCwt is read-count of wild-type alleles, and Ne is number of sequencing errors on each autosomal homozygote SNP site. For high accuracy, we only counted base with sufficient quality score (Q > 20). In order to estimate Ne, we assumed a conservative rate (sequencing error rate = 0.001). We considered sites covered by at least 10 reads and 90% VAF (Figure 1—figure supplement 5B). 95% confidence intervals of cross-contamination levels were calculated using binomial distribution.In order to clear somatic variants, here we made the very conservative assumption that somatic variants present in excess of 5-times of the 95% upper limit of C levels were true somatic rather than false-positives by low-level of cross-contamination.
-
3. Germline polymorphisms and back mutations
We further checked samples for contamination using known mtDNA polymorphisms. Because human mtDNA is small (16,569 bp) and extensively explored previously, most of germline mtDNA polymorphisms are already known. For example, 97.7% of the 39,036 inherited substitutions were known polymorphisms in the mtDB database (Ingman and Gyllensten, 2006). Therefore, when a tumor sample is contaminated by other samples, many somatic-like mtDNA substitutions by contaminants are likely to be overlapped with known mtDNA polymorphisms.
At the same time, low-level contamination would generate excessive back mutations, which appeared to reverse germline common polymorphisms into wild-type alleles. Taken together, both the number of somatic substitutions known in mtDB and number of back mutations can be good indicators for mtDNA cross-contamination. Therefore, we filtered out tumor tissues with ≥3 known potentially somatic mutations or with ≥2 back mutations from the further analyses (Figure 1—figure supplement 5A and B).
Variant calling
We extracted mtDNA reads using Samtools (Li and Durbin, 2009). We used VarScan2 (Koboldt et al., 2012) for initial variant calling with a few options (--strand-filter 1 (mismatches should be reported by both forward and reverse reads), --min-var-freq 0.03 (minimum VAF 3%), --min-avg-qual 20 (minimum base quality 20), --min-coverage 3 and --min-reads2 2). With respect to the --strand-filter, it generally removes variant when >90% of mismatches are reported from either of the H or the L mtDNA strand. However, where only reads with a specific orientation are could be aligned dominantly (i.e. in both extreme region of mitochondrial reference genome; only L strand reads could be aligned on the 5′ extreme of mtDNA), we compared strand bias between ‘perfect matches’ (# perfect matches from L strand reads / total # perfect matches) and mismatches (# mismatches from L strand reads / total # mismatches). If the difference between those two bias <0.1, the mutations were rescued. Of the 1907 mutations, 54 (2.8%) were rescued accordingly.
Putative somatic variants called by VarScan2 were further filtered using criteria shown below.
-
At least 4 unique reads supporting variants and all variant reads at least 20 phred scale sequencing quality score (Q 20 = 1% sequencing error rate) and at least 3% variant allele fractions (VAFs).
A. Regardless of in WGS and in WES, the ≥4 mismatches and the ≥3% VAF criteria must be satisfied simultaneously.
B. However, in WGS, the minimum number of reads (n = 4) criterion is not essential, because the ≥3% VAF criterion is much more stringent (3% VAF request at least 240 mismatches (>>4) given mtDNA coverage is ∼8000 for WGS).
C. In WES, the ≥3% VAF criterion is relatively less important than in WGS, because the ≥4 mismatches criterion is more stringent. For example, 4 mismatches in 90x (WXS average) coverage region (VAF = 4.4%) automatically fulfill the ≥3% VAF criterion. For less covered regions (i.e. <40x coverage; n = 285 out of total 1907 substitutions), the VAF criterion becomes less important, because 4 mismatches would generate ≥10% VAF, much higher than the minimum threshold (i.e. 3%). As results, we are missing lower heteroplasmic variants (i.e. variants with 3–10% heteroplasmic levels) from low coverage samples (mostly by WXS). The lower sensitivity of WXS is also confirmed in our validation study (see “Validation of somatic variants” below).
There is no minimum threshold for total coverage (# perfect matches + # mismatches).
To increase sensitivity for detecting mutations, we rescued mutations with 3 unique variant reads (with at least 20 phred scale sequencing quality score) when VAFs is ≥ 20%. Of 1907 somatic substitutions, 32 (1.7%) were rescued accordingly.
All somatic variants presenting with VAFs lower than our very conservative threshold for minor cross-contamination (5-times 95% upper limit of contamination levels for each tumor sample, see above “Minor cross-contamination of DNA samples”) were removed. When we could not estimate cross-contamination levels because of low sequencing depth of coverage (for nuclear genome), a conservative criterion (10% contamination level threshold) was explicitly used.
-
Substitutions were further visually inspected using IGV (Thorvaldsdottir et al., 2013). Thirteen frequent false-positive variants (shown below) by misalignment due to extensive level of homopolymers in rCRS and due to sequencing error in the reference mtDNA genome (3107N, see Mitomap (http://www.mitomap.org/bin/view.pl/MITOMAP/CambridgeReanalysis) for more information) were explicitly removed:
1. Misalignment due to ACCCCCCCTCCCCC (rCRS 302-315)
A302C, C309T, C311T, C312T, C313T, G316C
2. Misalignment due to GCACACACACACC (rCRS 513-525)
C514A, A515G, A523C, C524G
3. Misalignment due to 3107N in rCRS (ACNTT, rCRS 3105-3109)
C3106A, T3109C, C3110A
We compared our variant calls with common inherited mtDNA polymorphisms deposited in the mtDB database as of 24th July 2013 (Ingman and Gyllensten, 2006). Gene annotation of somatic variants was done using custom script based on human mtDNA gene information (Ruiz-Pesini et al., 2007).
Validation of somatic variants
To validate the sensitivity and specificity of variant calling in this study, 19 tumor and normal pairs (which were originally whole-genome sequenced) were whole-exome sequenced and mtDNA variants were assessed independently. Among the 28 somatic substitutions originally detected from the 19 tumor–normal whole-genome sequencing pairs, 20 (71.4%) were called as somatic (Figure 1—figure supplement 3). In addition, 5 (17.9%) presented evidence of variant reads in the validation set, although it was filtered out because of its low read depth of coverage in exome sequencings (showed 2–5 variant reads). Moreover, because 3 remaining sites were not sufficiently covered in the validation set to call somatic variants, these could not be evidence of the inaccuracy of whole-genome sequencing data, therefore not considered in the accuracy validation. Taken together, all the 25 somatic substitutions by whole-genome sequencing were highly likely to be true positives, therefore we concluded it provided ∼100% accuracy in the mtDNA somatic substitution assessment. Actually, the high accuracy of whole-genome sequencing is very likely and what we expect, because it provides extensive coverage of mtDNA (average read depth >7,500×), ∼3% heteroplasmic variants would present >200 variant reads.
By contrast, the validation set (whole-exome sequencing) is called 21 somatic substitutions. Of these, 20 were common with whole-genome sequencing, and one was incorrectly called as somatic though it was actually germline substitutions in the whole-genome sequencing data. In addition, as mentioned above, the validation set missed 8 somatic substitutions called by whole-genome sequencing. Six out of eight undercalls (75%) were low heteroplasmic substitutions in whole-genome sequencing, ranging from 3.36% to 8.68%. Based on these data, we suggest 71.4% sensitivity (20/28) and 95.2% specificity (20/21) for exome-sequencing in detecting upto 3% heteroplasmic somatic mtDNA substitutions in cancer.
We further checked the correlation of heteroplasmy level between the 20 mtDNA somatic mutations called both whole-genome and whole-exome sequencing. It showed great linear relationship (R2 = 0.97, Figure 1—figure supplement 2), further suggesting whole-exome sequencing data are appropriate for accurate detection of mtDNA somatic mutations.
Substitution phasing
We phased 72 somatic substitution pairs, which arose in a single cancer sample and which located sufficiently close (from 10 bp to ∼500 bp), therefore both sites could be sequenced by same sequence fragments (Supplementary file 3 and Figure 2—figure supplement 1). We classified them as ‘different strand’, ‘co-clonal’, and ‘sub-clonal’ using criteria as follows:
Different strand: the two somatic substitutions are obligate on different strands. Reads that report wild-type1(wt)-substitution2(subs) and subs1-wt2, but subs1-subs2, are observed.
Co-clonal: reads reporting wt1-wt2 and subs1-subs2 are only observed.
Sub-clonal: One substitution is sub-clonal to the other, but the two are definitely phased. Reads subs1-subs2 and either subs1-wt2 or wt1-subs2 are observed.
Tumor type and mtDNA somatic substitutions
To understand the relationship between tumor types and number of mtDNA mutations, Poisson regression and ANOVA were applied to our dataset using R software (http://www.r-project.org).
where Nsub is number of mtDNA substitutions of each sample, CovT and CovN are coverage of tumor and normal mtDNA, respectively, (if Cov is >200, we replaced it by 200), t is tumor types.
Age and mtDNA somatic substitutions
Poisson regression was applied to our breast cancer dataset.
where Nsub is number of mtDNA substitutions of each sample, CovT and CovN are coverage of tumor and normal mtDNA, respectively, (if Cov is >200, we replaced it by 200), a is age at diagnosis. p-value in estimation of a was shown in the manuscript.
Mutational signature and strand bias
Different mutational processes generate different combinations of mutation types, termed ‘signatures’ (Nik-Zainal et al., 2012a). For example, ultraviolet (UV) light and tobacco smoking (polycyclic aromatic hydrocarbons) frequently generate C > T transitions and G > T transversions on non-transcribed (coding) strands in melanoma and lung cancers, respectively (Pleasance et al., 2010a, 2010b). To understand the mutational processes influencing cancer mtDNA, we correlated the 1907 mtDNA substitutions with 21 cancer specific mutational signatures in the nuclear DNA recently identified (Alexandrov et al., 2013). However, none of the signature could explain the highly unique mtDNA substitutions.
Mutational signature and strand bias were assessed as described in our previous reports (Alexandrov et al., 2013). Briefly, the immediate 5′ and 3′ sequence context was extracted from rCRS. Substitution rate for each trinucleotide context was calculated with the number of substitution normalized by the frequency of the trinucleotide context observed in the rCRS, in the L and H strand, respectively. For analyses of substitutions falling in the mtDNA genes (13 protein-coding and 22 tRNA genes), transcribed/non-transcribed strand was also considered for comparison.
In order to prove the strand bias is not transcription but replication-coupled, we checked strand biases of polymorphisms in the 12 L strand protein-coding genes, 1 H strand protein-coding gene (MT-ND6), and/or 22 tRNAs (Figure 3—figure supplement 1). For this specific purpose, we did not consider the sequence context (immediate 5′ and 3′ bases) because it over-classifies mutations (i.e. the number of mutation classes (n = 96) is larger than that of mutations). In other words, 12 classes of substitutions (six classes of possible base substitutions (C > A, C > G, C > T, T > A, T > C, T > G) × two strands (L and H strands)) were considered. Substitution rates are ratio between observed and expected numbers (H0 = same mutation rate for all substitution classes) for each substitution class. In order to understand which model (replicative or transcriptional strand) is appropriate to explain the strand-bias, Chi-square tests were used between the number of observed mutations for each class and expected ones under the background signature.
mtDNA codon usage
We counted the codon frequencies in 13 mtDNA protein-coding genes. Because 12 L strand protein-coding genes and 1 H strand gene (MT-ND6) are under opposite mutational pressure (T > C and G > A for L strand genes; A > G and C > T for MT-ND6), we separated L and H strand genes for this analysis. T > C skew and G > A skew were calculated as shown below, to understand the TL > CL and CH > TH (equivalent to GL > AL) substitutions during the evolution of human mtDNA:
where NA, NC, NG, and NT are number of A, C, G, and T base in the 3rd position of triplet codons in mtDNA genes, respectively.
For the assessment of mtDNA codon usage of other animal species, we analyzed the mtDNA sequence of Caenorhabditis elegans (accession# NC_001328), Drosophila melanogaster (accession# NC_001709), D. rerio (accession# NC_002333), Xenopus laevis (accession# NC_001573), Mus musculus (accession# EU450583), Gallus domesticus (accession # NC_235570), and Pan troglodytes (NC_001643). We considered only L strand mtDNA genes in the cross-species analysis.
Recurrent substitutions
To compare the number of recurrent substitutions between silent and missense substitutions, we randomly selected 100 substitutions each from 198 silent substitutions in the third base of triplet codons, 440 missense substitutions in the first base of triplet codons, and 405 missense substitutions in the second base of triplet codons. We counted the number of recurrent substitutions in each group. This was iterated 300 times independently. ANOVA testing was applied to determine the difference between the three groups (Figure 5—figure supplement 1).
dN/dS ratio
To estimate dN/dS values for missense mutations (wmis), we used an adaptation of the method described previously (Greenman et al., 2006). Briefly, the rate of mutations is modeled as a Poisson process, with a rate given by a product of the mutation rate and the impact of selection. To obtain accurate estimates of dN/dS, we used two separate models, one using 12 single-nucleotide substitution rates and a more complex one accounting for any context dependence effect by 1-nucleotide upstream and downstream using 192 substitution rates. For example in the 12-rate model, the expected number of A > C mutations (λA>C) would be modeled as follows:
where Lsyn,A>C and Lmis,A>C are the number of sites that can suffer a synonymous and missense A > C mutation, respectively, which are calculated for any particular sequence. The likelihood of observing the number of missense A > C mutations (Nmis,A>C) given the expected λmis,A>C is then calculated as:
and the likelihood of the entire model is the product of all individual likelihoods. Wmis is fixed to be equal in all 12 (or 192) equations describing each substitution type, and a hill-climbing algorithm is used to find the maximum likelihood estimates for all rate and selection parameters. Likelihood Ratio Tests are then used to test deviations from neutrality (wmis = 1). The dN/dS ratio reported in the main text corresponds to the full context dependent model with 192 substitution rates. This method allows quantifying the strength of selection avoiding the confounding effect of gene length, sequence composition, different rates of each substitution type, and context-dependent mutagenesis.
Short indels
Along with the 1907 somatic mtDNA substitutions, we identified 109 and 142 somatic short insertions and deletions, respectively, from the 1675 cancer mtDNA sequences using Varscan2 (Supplementary file 2).
Evolutionary dynamics of neutral mitochondrial mutations
We model the evolutionary dynamics of mitochondrial mutations under random drift and derive a simple equation for the expected number of homoplasmic mutations. There exist multiple levels at which mitochondrial mutations evolve: within mitochondria, in the cytoplasm, and on the cellular level (Rand, 2011). In this study, we focus on the dynamics in a single cell, which represents the founder of the last clonal expansion in the tumor cell population. The cellular dynamics during a clonal expansion is difficult to describe analytically, but it is important to realize that mutations of a clonal expansion preserves the allele frequencies of neutral variants and that mutations that occur after the expansion are unlikely to contribute to measurable allele frequencies, as the population becomes large.
We model the evolutionary dynamics of mitochondrial mutations in the cytoplasm of a single cell by a Wright–Fisher process (Wright, 1931), in which the number of mitochondria in a subsequent generation is a binomial sample of the mitochondria in the previous generation. The number of mitochondria M is kept fixed. The marginal allele frequency X of a single site has two absorbing boundaries, X = 0 and X = M (homoplasmy), and the probability of fixation of an allele at frequency X by neutral drift is ρ = X/M (Wright, 1931). Note that this process leads, on the population level, to a dichotomization of heteroplasmic variants to either go extinct or become homoplasmic and fixate in a cell.
Mutations on any of L (= 16,569 nt) sites in the mitochondrial genome are assumed to occur at a uniform rate μ per nucleotide per cell division, which is of order 10−7, based on a human inter-generational comparison (Coller et al., 2001). Hence the rate of neutral evolution is simply μLM/M = μL (Kimura, 1984). Lastly, the expected time to fixation in the Wright–Fisher process is t = 2M. Putting these things together, the expected number of mutant alleles N in a cell initially without any mitochondrial mutations after T generation is
This equation predicts a linear accumulation of neutral mutations over time, with a delay imposed by number of mitochondrial copies. A similar behavior has been reported using numerical simulations (Coller et al., 2001). When also considering heteroplasmic mutations, the expected number of alterations may be slightly higher.
To check whether our model yields the correct behavior, we use the following numbers: the observed order of magnitude of mitochondrial mutations per patient was N = 1. The sequencing coverage on the mitochondrial genome indicates that there were of order M = 100 mitochondrial genome copies present per cancer cell. The expected number of mutations per cell division is μL = 1.6 × 10⁻³, it therefore requires around 1000 cell generations T to accumulate on average one homoplasmic mutation. This number of generations appears realistic for regenerating tissues. As expected, epithelial cancers had among the highest observed number of mitochondrial mutations, while hematopoietic cancers typically had lower numbers.
Statistical testing
Statistical testing was performed using R software. All p-values were calculated by two-tailed testing. Figures were generated using R and Microsoft Excel software.
Acknowledgements
Data used in this manuscript are described in the supplementary materials (Supplementary file 1). We thank Thomas Bleazard at Faculty of Medical and Human Sciences, University of Manchester for discussion and assistance with manuscript preparation. We would like to thank The Cancer Genome Atlas (TCGA) Project Team and their specimen donors for providing sequencing data. This work was supported by the Wellcome Trust, the British Lung Foundation, the Health Innovation Challenge Fund, the Kay Kendall Leukaemia Fund, the Chordoma Foundation, and the Adenoid Cystic Carcinoma Research Foundation. Y.S.J and I.M. are supported by EMBO long-term fellowship (ALTF 1203-2012 and ALTF 1287-2012, respectively). PJC. is a Wellcome Trust Senior Clinical Fellow. Support was provided to AMF by the National Institute for Health Research (NIHR) UCLH Biomedical Research Centre. ARG. receives support from Leukaemia Lymphoma Research, Cancer Research UK, and the Leukemia Lymphoma Society. Samples from Addenbrooke's Hospital were collected with support from the NIHR Cambridge Biomedical Resource Centre. The ICGC Breast Cancer Consortium was supported by a grant from the European Union (BASIS) and the Wellcome Trust. The ICGC Prostate Cancer Consortium was funded by Cancer Research UK. We would also like to acknowledge the support of the National Cancer Research Prostate Cancer: Mechanisms of Progression and Treatment (PROMPT) collaborative (grant code G0500966/75466) which has funded tissue and urine collections in Cambridge. This research was supported in part by the Intramural Research Program of the NIH, National Institute of Environmental Health Sciences (JAT.). We obtained informed consent and consent to publish from participants enrolled.
Funding Statement
The funders had no role in study design, data collection and interpretation, or the decision to submit the work for publication.
Contributor Information
Todd Golub, Broad Institute, United States.
ICGC Breast Cancer Group:
Elena Provenzano, Marc van de Vijver, Andrea L Richardson, Colin Purdie, Sarah Pinder, Gaetan MacGrogan, Anne Vincent-Salomon, Denis Larsimont, Dorthe Grabau, Torill Sauer, Øystein Garred, Anna Ehinger, Gert G Van den Eynden, C.H.M. van Deurzen, Roberto Salgado, Jane E Brock, Sunil R Lakhani, Dilip D Giri, Laurent Arnould, Jocelyne Jacquemier, Isabelle Treilleux, Carlos Caldas, Suet-Feung Chin, Aquila Fatima, Alastair M Thompson, Alasdair Stenhouse, John Foekens, John Martens, Anieta Sieuwerts, Arjen Brinkman, Henk Stunnenberg, Paul N. Span, Fred Sweep, Christine Desmedt, Christos Sotiriou, Gilles Thomas, Annegein Broeks, Anita Langerod, Samuel Aparicio, Peter Simpson, Laura van 't Veer, Jórunn Erla Eyfjörd, Holmfridur Hilmarsdottir, Jon G Jonasson, Anne-Lise Børresen-Dale, Ming Ta Michael Lee, Bernice Huimin Wong, Benita Kiat Tee Tan, and Gerrit K.J. Hooijer
ICGC Chronic Myeloid Disorders Group:
Luca Malcovati, Sudhir Tauro, Jacqueline Boultwood, Andrea Pellagatti, Michael Groves, Alex Sternberg, Carlo Gambacorti-Passerini, Paresh Vyas, Eva Hellstrom-Lindberg, David Bowen, Nicholas CP Cross, Anthony R Green, and Mario Cazzola
ICGC Prostate Cancer Group:
Colin Cooper, Rosalind Eeles, David Wedge, Peter Van Loo, Gunes Gundem, Ludmil Alexandrov, Barbara Kremeyer, Adam Butler, Andrew Lynch, Sandra Edwards, Niedzica Camacho, Charlie Massie, ZSofia Kote-Jarai, Nening Dennis, Sue Merson, Jorge Zamora, Jonathan Kay, Cathy Corbishley, Sarah Thomas, Serena Nik-Zainai, Sarah O'Meara, Lucy Matthews, Jeremy Clark, Rachel Hurst, Richard Mithen, Susanna Cooke, Keiran Raine, David Jones, Andrew Menzies, Lucy Stebbings, Jon Hinton, Jon Teague, Stuart McLaren, Laura Mudie, Claire Hardy, Elizabeth Anderson, Olivia Joseph, Victoria Goody, Ben Robinson, Mark Maddison, Stephen Gamble, Christopher Greenman, Dan Berney, Steven Hazell, Naomi Livni, Cyril Fisher, Christopher Ogden, Pardeep Kumar, Alan Thompson, Christopher Woodhouse, David Nicol, Erik Mayer, Tim Dudderidge, Nimish Shah, Vincent Gnanapragasam, Peter Campbell, Andrew Futreal, Douglas Easton, Anne Y Warren, Christopher Foster, Michael Stratton, Hayley Whitaker, Ultan McDermott, Daniel Brewer, and David Neal
Funding Information
This paper was supported by the following grants:
Wellcome Trust to Ultan McDermott, Michael R Stratton, Peter J Campbell.
Wellcome Trust Health Innovation Challenge Fund (HICF) to Peter J Campbell.
Kay Kendall Leukaemia Fund to Anthony R Green, Mel Greaves, Peter J Campbell.
Chordoma Foundation to P Andrew Futreal.
Adenoid Cystic Carcinoma Research Foundation to P Andrew Futreal.
European Molecular Biology Organization ALTF 1203_2012 to Young Seok Ju.
National Institute for Health Research Biomedical Research Center at University College London Hospitals to Adrienne M Flanagan.
Leukaemia and Lymphoma Research to Anthony R Green.
Cancer Research UK to Anthony R Green.
Leukemia and Lymphoma Society to Anthony R Green.
European Union Breast Cancer Somatic Genetics Study (BASIS) to Michael R Stratton.
National Cancer Research Institute PROMPT: G0500966/75466 to Rosalind Eeles, Colin Cooper, David Neal.
National Institute of Environmental Health Sciences Intramural Research Program of the NIH to Jack A Taylor.
National Institute for Health Research Cambridge Biomedical Research Center to Anthony R Green, David Neal.
European Molecular Biology Organization ALTF 1287-2012 to Inigo Martincorena.
Department of Health Health Innovation Challenge Fund (HICF) to Peter J Campbell.
Additional information
Competing interests
The authors declare that no competing interests exist.
Author contributions
YSJ, Conception and design, Acquisition of data, Analysis and interpretation of data, Drafting or revising the article.
LBA, Analyzed mutational signature.
MG, Analysis and interpretation of data, Drafting or revising the article.
IM, Analysis and interpretation of data, Drafting or revising the article.
SN-Z, Contributed samples and scientific advice.
MR, Contributed samples and scientific advice.
HRD, Contributed samples and scientific advice.
EP, Contributed samples and scientific advice.
GG, Contributed samples and scientific advice.
AS, Contributed samples and scientific advice.
NB, Contributed samples and scientific advice.
SB, Contributed samples and scientific advice.
PST, Contributed samples and scientific advice.
JN, Contributed samples and scientific advice.
CEM, Contributed samples and scientific advice.
GSV, Contributed samples and scientific advice.
ARG, Contributed samples and scientific advice.
M-QD, Contributed samples and scientific advice.
AU, Contributed samples and scientific advice.
JEP, Contributed samples and scientific advice.
BTT, Contributed samples and scientific advice.
NM, Contributed samples and scientific advice.
MG, Contributed samples and scientific advice.
PV, Contributed samples and scientific advice.
AKE-N, Contributed samples and scientific advice.
TS, Contributed samples and scientific advice.
VPC, Contributed samples and scientific advice.
RG, Contributed samples and scientific advice.
JAT, Contributed samples and scientific advice.
DNH, Contributed samples and scientific advice.
DM, Contributed samples and scientific advice.
CSF, Contributed samples and scientific advice.
AYW, Contributed samples and scientific advice.
HCW, Contributed samples and scientific advice.
DB, Contributed samples and scientific advice.
RE, Contributed samples and scientific advice.
CC, Contributed samples and scientific advice.
DN, Contributed samples and scientific advice.
TV, Contributed samples and scientific advice.
WBI, Contributed samples and scientific advice.
GSB, Contributed samples and scientific advice.
AMF, Contributed samples and scientific advice.
PAF, Contributed samples and scientific advice.
AGL, Contributed samples and scientific advice.
PFC, Contributed samples and scientific advice.
UMD, Contributed samples and scientific advice.
APB, Provided bioinformatics support for sequencing data acquisition.
JWT, Provided bioinformatics support for sequencing data acquisition.
MRS, Conception and design, Analysis and interpretation of data, Drafting or revising the article.
PJC, Conception and design, Analysis and interpretation of data, Drafting or revising the article.
Ethics
Human subjects: We obtained informed consent and consent to publish from participants enrolled in this study, Ethical approval references: Genome Analysis of myeloid and lymphoid malignancies (10/H0306/40), Genomic Analysis of Mesothelioma (11/EE/0444), Myeloid and lymphoid cancer genome analysis (07/S1402/90), The Treatment of Down Syndrome Children with Acute Myeloid Leukemia and Myelodysplastic Syndrome(AAML0431), CLL (chronic lymphocytic leukaemia) genome analysis (07/Q0104/3), CGP-Exome sequencing of Down syndrome associated acute myeloid leukemia samples (IRB 13-010133), Cancer Genome Project - Global approaches to characterizing the molecular basis of paediatric ependymoma (05/MRE04/70), PREDICT-Cohort (09/H0801/96), ICGC Prostate (Evaluation of biomarkers in urological diseases) (LREC 03/018), ICGC Prostate (779) (Prostate Complex CRUK Sample Cohort) (MREC/0¼/061), ICGC Prostate (Tissue collection at radical prostatectomy) (CRE-2011.373), Somatic molecular genetics of human cancers, melanoma and myeloma (Dana Farber Cancer Institute)(08/H0308/303), Breast Cancer Genome Analysis for the International Cancer Genome Consortium Working Group (09/H0306/36), Genome analysis of tumours of the bone (09/H0308/165).
Additional files
Sequencing information of 1675 tumor–normal pairs.
Catalogs of somatic mutations (substitutions and indels) and inherited polymorphisms identified in this study.
List of phased somatic substitutions.
dN/dS for 13 protein-coding genes in mitochondria.
List of somatic substitution with higher recurrent rate than expected.
Major datasets
The following dataset was generated:
Ju Young Seok, , 2014, Origins and functional consequences of somatic mitochondrial DNA mutations, EGAS00001000968; https://www.ebi.ac.uk/ega/studies/EGAS00001000968, European Genome-phenome Archive (https://www.ebi.ac.uk/ega/home).
The following previously published dataset was used:
The Cancer Genome AtlasTCGA DNA sequencing data, http://cghub.ucsc.edu, Cancer Genome Hub.
References
- Alexandrov LB, Nik-Zainal S, Wedge DC, Aparicio SA, Behjati S, Biankin AV, Bignell GR, Bolli N, Borg A, Borresen-Dale AL, Boyault S, Burkhardt B, Butler AP, Caldas C, Davies HR, Desmedt C, Eils R, Eyfjörd JE, Foekens JA, Greaves M, Hosoda F, Hutter B, Ilicic T, Imbeaud S, Imielinski M, Jäger N, Jones DT, Jones D, Knappskog S, Kool M, Lakhani SR, López-Otín C, Martin S, Munshi NC, Nakamura H, Northcott PA, Pajic M, Papaemmanuil E, Paradiso A, Pearson JV, Puente XS, Raine K, Ramakrishna M, Richardson AL, Richter J, Rosenstiel P, Schlesner M, Schumacher TN, Span PN, Teague JW, Totoki Y, Tutt AN, Valdés-Mas R, van Buuren MM, van 't Veer L, Vincent-Salomon A, Waddell N, Yates LR, Australian Pancreatic Cancer Genome Initiative , ICGC Breast Cancer Consortium , ICGC MMML-Seq Consortium , ICGC PedBrain. Zucman-Rossi J, Futreal PA, McDermott U, Lichter P, Meyerson M, Grimmond SM, Siebert R, Campo E, Shibata T, Pfister SM, Campbell PJ, Stratton MR. Signatures of mutational processes in human cancer. Nature. 2013;500:415–421. doi: 10.1038/nature12477. [DOI] [PMC free article] [PubMed] [Google Scholar]
- Andrews RM, Kubacka I, Chinnery PF, Lightowlers RN, Turnbull DM, Howell N. Reanalysis and revision of the Cambridge reference sequence for human mitochondrial DNA. Nature Genetics. 1999;23:147. doi: 10.1038/13779. [DOI] [PubMed] [Google Scholar]
- Avital G, Buchshtav M, Zhidkov I, Tuval Feder J, Dadon S, Rubin E, Glass D, Spector TD, Mishmar D. Mitochondrial DNA heteroplasmy in diabetes and normal adults: role of acquired and inherited mutational patterns in twins. Human Molecular Genetics. 2012;21:4214–4224. doi: 10.1093/hmg/dds245. [DOI] [PMC free article] [PubMed] [Google Scholar]
- Brandon M, Baldi P, Wallace DC. Mitochondrial mutations in cancer. Oncogene. 2006;25:4647–4662. doi: 10.1038/sj.onc.1209607. [DOI] [PubMed] [Google Scholar]
- Calvo SE, Mootha VK. The mitochondrial proteome and human disease. Annual Review of Genomics and Human Genetics. 2010;11:25–44. doi: 10.1146/annurev-genom-082509-141720. [DOI] [PMC free article] [PubMed] [Google Scholar]
- Chatterjee A, Mambo E, Sidransky D. Mitochondrial DNA mutations in human cancer. Oncogene. 2006;25:4663–4674. doi: 10.1038/sj.onc.1209604. [DOI] [PubMed] [Google Scholar]
- Chinnery PF. GeneReviews. Seattle, Washington: 1993. Mitochondrial Disorders Overview. [Google Scholar]
- Clayton DA. Replication of animal mitochondrial DNA. Cell. 1982;28:693–705. doi: 10.1016/0092-8674(82)90049-6. [DOI] [PubMed] [Google Scholar]
- Coller HA, Khrapko K, Bodyak ND, Nekhaeva E, Herrero-Jimenez P, Thilly WG. High frequency of homoplasmic mitochondrial DNA mutations in human tumors can be explained without selection. Nature Genetics. 2001;28:147–150. doi: 10.1038/88859. [DOI] [PubMed] [Google Scholar]
- De Alwis N, Hudson G, Burt AD, Day CP, Chinnery PF. Human liver stem cells originate from the canals of Hering. Hepatology. 2009;50:992–993. doi: 10.1002/hep.23160. [DOI] [PubMed] [Google Scholar]
- Delaney S, Jarem DA, Volle CB, Yennie CJ. Chemical and biological consequences of oxidatively damaged guanine in DNA. Free Radical Research. 2012;46:420–441. doi: 10.3109/10715762.2011.653968. [DOI] [PMC free article] [PubMed] [Google Scholar]
- Ericson NG, Kulawiec M, Vermulst M, Sheahan K, O'Sullivan J, Salk JJ, Bielas JH. Decreased mitochondrial DNA mutagenesis in human colorectal cancer. PLOS genetics. 2012;8:e1002689. doi: 10.1371/journal.pgen.1002689. [DOI] [PMC free article] [PubMed] [Google Scholar]
- Faith JJ, Pollock DD. Likelihood analysis of asymmetrical mutation bias gradients in vertebrate mitochondrial genomes. Genetics. 2003;165:735–745. doi: 10.1093/genetics/165.2.735. [DOI] [PMC free article] [PubMed] [Google Scholar]
- Falk MJ, Pierce EA, Consugar M, Xie MH, Guadalupe M, Hardy O, Rappaport EF, Wallace DC, LeProust E, Gai X. Mitochondrial disease genetic diagnostics: optimized whole-exome analysis for all MitoCarta nuclear genes and the mitochondrial genome. Discovery Medicine. 2012;14:389–399. [PMC free article] [PubMed] [Google Scholar]
- Falkenberg M, Larsson NG, Gustafsson CM. DNA replication and transcription in mammalian mitochondria. Annual Review of Biochemistry. 2007;76:679–699. doi: 10.1146/annurev.biochem.76.060305.152028. [DOI] [PubMed] [Google Scholar]
- Fisher S, Barry A, Abreu J, Minie B, Nolan J, Delorey TM, Young G, Fennell TJ, Allen A, Ambrogio L, Berlin AM, Blumenstiel B, Cibulskis K, Friedrich D, Johnson R, Juhn F, Reilly B, Shammas R, Stalker J, Sykes SM, Thompson J, Walsh J, Zimmer A, Zwirko Z, Gabriel S, Nicol R, Nusbaum C. A scalable, fully automated process for construction of sequence-ready human exome targeted capture libraries. Genome biology. 2011;12:R1. doi: 10.1186/gb-2011-12-1-r1. [DOI] [PMC free article] [PubMed] [Google Scholar]
- Freyer C, Cree LM, Mourier A, Stewart JB, Koolmeister C, Milenkovic D, Wai T, Floros VI, Hagstrom E, Chatzidaki EE, Wiesner RJ, Samuels DC, Larsson NG, Chinnery PF. Variation in germline mtDNA heteroplasmy is determined prenatally but modified during subsequent transmission. Nature Genetics. 2012;44:1282–1285. doi: 10.1038/ng.2427. [DOI] [PMC free article] [PubMed] [Google Scholar]
- 1000 Genomes Project Consortium. Abecasis GR, Altshuler D, Auton A, Brooks LD, Durbin RM, Gibbs RA, Hurles ME, McVean GA. A map of human genome variation from population-scale sequencing. Nature. 2010;467:1061–1073. doi: 10.1038/nature09534. [DOI] [PMC free article] [PubMed] [Google Scholar]
- Goto H, Dickins B, Afgan E, Paul IM, Taylor J, Makova KD, Nekrutenko A. Dynamics of mitochondrial heteroplasmy in three families investigated via a repeatable re-sequencing study. Genome Biology. 2011;12:R59. doi: 10.1186/gb-2011-12-6-r59. [DOI] [PMC free article] [PubMed] [Google Scholar]
- Gray MW, Burger G, Lang BF. Mitochondrial evolution. Science. 1999;283:1476–1481. doi: 10.1126/science.283.5407.1476. [DOI] [PubMed] [Google Scholar]
- Greenman C, Stephens P, Smith R, Dalgliesh GL, Hunter C, Bignell G, Davies H, Teague J, Butler A, Stevens C, Edkins S, O'Meara S, Vastrik I, Schmidt EE, Avis T, Barthorpe S, Bhamra G, Buck G, Choudhury B, Clements J, Cole J, Dicks E, Forbes S, Gray K, Halliday K, Harrison R, Hills K, Hinton J, Jenkinson A, Jones D, Menzies A, Mironenko T, Perry J, Raine K, Richardson D, Shepherd R, Small A, Tofts C, Varian J, Webb T, West S, Widaa S, Yates A, Cahill DP, Louis DN, Goldstraw P, Nicholson AG, Brasseur F, Looijenga L, Weber BL, Chiew YE, DeFazio A, Greaves MF, Green AR, Campbell P, Birney E, Easton DF, Chenevix-Trench G, Tan MH, Khoo SK, Teh BT, Yuen ST, Leung SY, Wooster R, Futreal PA, Stratton MR. Patterns of somatic mutation in human cancer genomes. Nature. 2007;446:153–158. doi: 10.1038/nature05610. [DOI] [PMC free article] [PubMed] [Google Scholar]
- Greenman C, Wooster R, Futreal PA, Stratton MR, Easton DF. Statistical analysis of pathogenicity of somatic mutations in cancer. Genetics. 2006;173:2187–2198. doi: 10.1534/genetics.105.044677. [DOI] [PMC free article] [PubMed] [Google Scholar]
- Hanahan D, Weinberg RA. Hallmarks of cancer: the next generation. Cell. 2011;144:646–674. doi: 10.1016/j.cell.2011.02.013. [DOI] [PubMed] [Google Scholar]
- He Y, Wu J, Dressman DC, Iacobuzio-Donahue C, Markowitz SD, Velculescu VE, Diaz LA, Jnr, Kinzler KW, Vogelstein B, Papadopoulos N. Heteroplasmic mitochondrial DNA mutations in normal and tumour cells. Nature. 2010;464:610–614. doi: 10.1038/nature08802. [DOI] [PMC free article] [PubMed] [Google Scholar]
- Holt IJ, Reyes A. Human mitochondrial DNA replication. Cold Spring Harbor perspectives in biology. 2012;4:a012971. doi: 10.1101/cshperspect.a012971. [DOI] [PMC free article] [PubMed] [Google Scholar]
- Hudson G, Chinnery PF. Mitochondrial DNA polymerase-gamma and human disease. Human molecular genetics. 2006;15:R244–R252. doi: 10.1093/hmg/ddl233. [DOI] [PubMed] [Google Scholar]
- Ingman M, Gyllensten U. mtDB: human Mitochondrial Genome Database, a resource for population genetics and medical sciences. Nucleic Acids Research. 2006;34:D749–D751. doi: 10.1093/nar/gkj010. [DOI] [PMC free article] [PubMed] [Google Scholar]
- Kimura M. The neutral theory of molecular evolution. Cambridge University Press; 1984. [Google Scholar]
- Koboldt DC, Zhang QY, Larson DE, Shen D, McLellan MD, Lin L, Miller CA, Mardis ER, Ding L, Wilson RK. VarScan 2: somatic mutation and copy number alteration discovery in cancer by exome sequencing. Genome Research. 2012;22:568–576. doi: 10.1101/gr.129684.111. [DOI] [PMC free article] [PubMed] [Google Scholar]
- Koppenol WH, Bounds PL, Dang CV. Otto Warburg's contributions to current concepts of cancer metabolism. Nature Reviews Cancer. 2011;11:325–337. doi: 10.1038/nrc3038. [DOI] [PubMed] [Google Scholar]
- Larman TC, DePalma SR, Hadjipanayis AG, Cancer Genome Atlas Research Network. Protopopov A, Zhang J, Gabriel SB, Chin L, Seidman CE, Kucherlapati R, Seidman JG. Spectrum of somatic mitochondrial mutations in five cancers. Proceedings of the National Academy of Sciences of USA. 2012;109:14087–14091. doi: 10.1073/pnas.1211502109. [DOI] [PMC free article] [PubMed] [Google Scholar]
- Legros F, Malka F, Frachon P, Lombes A, Rojo M. Organization and dynamics of human mitochondrial DNA. Journal of Cell Science. 2004;117:2653–2662. doi: 10.1242/jcs.01134. [DOI] [PubMed] [Google Scholar]
- Levin L, Zhidkov I, Gurman Y, Hawlena H, Mishmar D. Functional recurrent mutations in the human mitochondrial phylogeny: dual roles in evolution and disease. Genome Biology and Evolution. 2013;5:876–890. doi: 10.1093/gbe/evt058. [DOI] [PMC free article] [PubMed] [Google Scholar]
- Li H, Durbin R. Fast and accurate short read alignment with Burrows-Wheeler transform. Bioinformatics. 2009;25:1754–1760. doi: 10.1093/bioinformatics/btp324. [DOI] [PMC free article] [PubMed] [Google Scholar]
- Li M, Schonberg A, Schaefer M, Schroeder R, Nasidze I, Stoneking M. Detecting heteroplasmy from high-throughput sequencing of complete human mitochondrial DNA genomes. American Journal of Human Genetics. 2010;87:237–249. doi: 10.1016/j.ajhg.2010.07.014. [DOI] [PMC free article] [PubMed] [Google Scholar]
- Lindahl T. Instability and decay of the primary structure of DNA. Nature. 1993;362:709–715. doi: 10.1038/362709a0. [DOI] [PubMed] [Google Scholar]
- Nik-Zainal S, Alexandrov LB, Wedge DC, Van Loo P, Greenman CD, Raine K, Jones D, Hinton J, Marshall J, Stebbings LA, Menzies A, Martin S, Leung K, Chen L, Leroy C, Ramakrishna M, Rance R, Lau KW, Mudie LJ, Varela I, McBride DJ, Bignell GR, Cooke SL, Shlien A, Gamble J, Whitmore I, Maddison M, Tarpey PS, Davies HR, Papaemmanuil E, Stephens PJ, McLaren S, Butler AP, Teague JW, Jönsson G, Garber JE, Silver D, Miron P, Fatima A, Boyault S, Langerød A, Tutt A, Martens JW, Aparicio SA, Borg Å Salomon AV, Thomas G, Børresen-Dale AL, Richardson AL, Neuberger MS, Futreal PA, Campbell PJ, Stratton MR, Breast Cancer Working Group of the International Cancer Genome Consortium Mutational processes molding the genomes of 21 breast cancers. Cell. 2012a;149:979–993. doi: 10.1016/j.cell.2012.04.024. [DOI] [PMC free article] [PubMed] [Google Scholar]
- Nik-Zainal S, Van Loo P, Wedge DC, Alexandrov LB, Greenman CD, Lau KW, Raine K, Jones D, Marshall J, Ramakrishna M, Shlien A, Cooke SL, Hinton J, Menzies A, Stebbings LA, Leroy C, Jia M, Rance R, Mudie LJ, Gamble SJ, Stephens PJ, McLaren S, Tarpey PS, Papaemmanuil E, Davies HR, Varela I, McBride DJ, Bignell GR, Leung K, Butler AP, Teague JW, Martin S, Jönsson G, Mariani O, Boyault S, Miron P, Fatima A, Langerød A, Aparicio SA, Tutt A, Sieuwerts AM, Borg Å Thomas G, Salomon AV, Richardson AL, Børresen-Dale AL, Futreal PA, Stratton MR, Campbell PJ, Breast Cancer Working Group of the International Cancer Genome Consortium The life history of 21 breast cancers. Cell. 2012b;149:994–1007. doi: 10.1016/j.cell.2012.04.023. [DOI] [PMC free article] [PubMed] [Google Scholar]
- Nikolaou C, Almirantis Y. Deviations from Chargaff's second parity rule in organellar DNA Insights into the evolution of organellar genomes. Gene. 2006;381:34–41. doi: 10.1016/j.gene.2006.06.010. [DOI] [PubMed] [Google Scholar]
- Pavlov YI, Mian IM, Kunkel TA. Evidence for preferential mismatch repair of lagging strand DNA replication errors in yeast. Current Biology. 2003;13:744–748. doi: 10.1016/S0960-9822(03)00284-7. [DOI] [PubMed] [Google Scholar]
- Pavlov YI, Newlon CS, Kunkel TA. Yeast origins establish a strand bias for replicational mutagenesis. Molecular Cell. 2002;10:207–213. doi: 10.1016/S1097-2765(02)00567-1. [DOI] [PubMed] [Google Scholar]
- Payne BA, Wilson IJ, Yu-Wai-Man P, Coxhead J, Deehan D, Horvath R, Taylor RW, Samuels DC, Santibanez-Koref M, Chinnery PF. Universal heteroplasmy of human mitochondrial DNA. Human Molecular Genetics. 2013;22:384–390. doi: 10.1093/hmg/dds435. [DOI] [PMC free article] [PubMed] [Google Scholar]
- Pleasance ED, Cheetham RK, Stephens PJ, McBride DJ, Humphray SJ, Greenman CD, Varela I, Lin ML, Ordonez GR, Bignell GR, Ye K, Alipaz J, Bauer MJ, Beare D, Butler A, Carter RJ, Chen L, Cox AJ, Edkins S, Kokko-Gonzales PI, Gormley NA, Grocock RJ, Haudenschild CD, Hims MM, James T, Jia M, Kingsbury Z, Leroy C, Marshall J, Menzies A, Mudie LJ, Ning Z, Royce T, Schulz-Trieglaff OB, Spiridou A, Stebbings LA, Szajkowski L, Teague J, Williamson D, Chin L, Ross MT, Campbell PJ, Bentley DR, Futreal PA, Stratton MR. A comprehensive catalogue of somatic mutations from a human cancer genome. Nature. 2010a;463:191–196. doi: 10.1038/nature08658. [DOI] [PMC free article] [PubMed] [Google Scholar]
- Pleasance ED, Stephens PJ, O'Meara S, McBride DJ, Meynert A, Jones D, Lin ML, Beare D, Lau KW, Greenman C, Varela I, Nik-Zainal S, Davies HR, Ordoñez GR, Mudie LJ, Latimer C, Edkins S, Stebbings L, Chen L, Jia M, Leroy C, Marshall J, Menzies A, Butler A, Teague JW, Mangion J, Sun YA, McLaughlin SF, Peckham HE, Tsung EF, Costa GL, Lee CC, Minna JD, Gazdar A, Birney E, Rhodes MD, McKernan KJ, Stratton MR, Futreal PA, Campbell PJ. A small-cell lung cancer genome with complex signatures of tobacco exposure. Nature. 2010b;463:184–190. doi: 10.1038/nature08629. [DOI] [PMC free article] [PubMed] [Google Scholar]
- Polyak K, Li Y, Zhu H, Lengauer C, Willson JK, Markowitz SD, Trush MA, Kinzler KW, Vogelstein B. Somatic mutations of the mitochondrial genome in human colorectal tumours. Nature Genetics. 1998;20:291–293. doi: 10.1038/3108. [DOI] [PubMed] [Google Scholar]
- Rand DM. Population genetics of the cytoplasm and the units of selection on mitochondrial DNA in Drosophila melanogaster. Genetica. 2011;139:685–697. doi: 10.1007/s10709-011-9576-y. [DOI] [PMC free article] [PubMed] [Google Scholar]
- Ruiz-Pesini E, Lott MT, Procaccio V, Poole JC, Brandon MC, Mishmar D, Yi C, Kreuziger J, Baldi P, Wallace DC. An enhanced MITOMAP with a global mtDNA mutational phylogeny. Nucleic Acids Research. 2007;35:D823–D828. doi: 10.1093/nar/gkl927. [DOI] [PMC free article] [PubMed] [Google Scholar]
- Saccone C, De Giorgi C, Gissi C, Pesole G, Reyes A. Evolutionary genomics in Metazoa: the mitochondrial DNA as a model system. Gene. 1999;238:195–209. doi: 10.1016/S0378-1119(99)00270-X. [DOI] [PubMed] [Google Scholar]
- Schon EA, DiMauro S, Hirano M. Human mitochondrial DNA: roles of inherited and somatic mutations. Nature Reviews Genetics. 2012;13:878–890. doi: 10.1038/nrg3275. [DOI] [PMC free article] [PubMed] [Google Scholar]
- Smeitink J, van den Heuvel L, DiMauro S. The genetics and pathology of oxidative phosphorylation. Nature Reviews Genetics. 2001;2:342–352. doi: 10.1038/35072063. [DOI] [PubMed] [Google Scholar]
- Stratton MR, Campbell PJ, Futreal PA. The cancer genome. Nature. 2009;458:719–724. doi: 10.1038/nature07943. [DOI] [PMC free article] [PubMed] [Google Scholar]
- Taylor RW, Barron MJ, Borthwick GM, Gospel A, Chinnery PF, Samuels DC, Taylor GA, Plusa SM, Needham SJ, Greaves LC, Kirkwood TB, Turnbull DM. Mitochondrial DNA mutations in human colonic crypt stem cells. The Journal of Clinical Investigation. 2003;112:1351–1360. doi: 10.1172/JCI19435. [DOI] [PMC free article] [PubMed] [Google Scholar]
- Thilly WG. Have environmental mutagens caused oncomutations in people? Nature Genetics. 2003;34:255–259. doi: 10.1038/ng1205. [DOI] [PubMed] [Google Scholar]
- Thorvaldsdottir H, Robinson JT, Mesirov JP. Integrative Genomics Viewer (IGV): high-performance genomics data visualization and exploration. Brief Bioinform. 2013;14:178–192. doi: 10.1093/bib/bbs017. [DOI] [PMC free article] [PubMed] [Google Scholar]
- Wallace DC. Mitochondria and cancer. Nature Reviews Cancer. 2012;12:685–698. doi: 10.1038/nrc3365. [DOI] [PMC free article] [PubMed] [Google Scholar]
- Wright S. Evolution in Mendelian populations. Genetics. 1931;16:97–159. doi: 10.1093/genetics/16.2.97. [DOI] [PMC free article] [PubMed] [Google Scholar]
- Yasukawa T, Reyes A, Cluett TJ, Yang MY, Bowmaker M, Jacobs HT, Holt IJ. Replication of vertebrate mitochondrial DNA entails transient ribonucleotide incorporation throughout the lagging strand. The EMBO Journal. 2006;25:5358–5371. doi: 10.1038/sj.emboj.7601392. [DOI] [PMC free article] [PubMed] [Google Scholar]
- Yasukawa T, Yang MY, Jacobs HT, Holt IJ. A bidirectional origin of replication maps to the major noncoding region of human mitochondrial DNA. Molecular Cell. 2005;18:651–662. doi: 10.1016/j.molcel.2005.05.002. [DOI] [PubMed] [Google Scholar]
- Zheng W, Khrapko K, Coller HA, Thilly WG, Copeland WC. Origins of human mitochondrial point mutations as DNA polymerase gamma-mediated errors. Mutation Research. 2006;599:11–20. doi: 10.1016/j.mrfmmm.2005.12.012. [DOI] [PubMed] [Google Scholar]


