Significance
We used massively parallel sequencing to study the size profiles of plasma DNA samples at single-base resolution and in a genome-wide manner. We used chromosome arm-level z-score analysis (CAZA) to identify tumor-derived plasma DNA for studying their specific size profiles. We showed that populations of aberrantly short and long DNA molecules existed in the plasma of patients with hepatocellular carcinoma. The short ones preferentially carried the tumor-associated copy number aberrations. We further showed that there were elevated amounts of mitochondrial DNA in the plasma of hepatocellular carcinoma patients. Such molecules were much shorter than the nuclear DNA in plasma. These findings have shed light on fundamental biological characteristics of plasma DNA and related diagnostic applications for cancer.
Keywords: tumor markers, circulating tumor DNA, liquid biopsy, massively parallel sequencing, mitochondrial DNA
Abstract
The analysis of tumor-derived circulating cell-free DNA opens up new possibilities for performing liquid biopsies for the assessment of solid tumors. Although its clinical potential has been increasingly recognized, many aspects of the biological characteristics of tumor-derived cell-free DNA remain unclear. With respect to the size profile of such plasma DNA molecules, a number of studies reported the finding of increased integrity of tumor-derived plasma DNA, whereas others found evidence to suggest that plasma DNA molecules released by tumors might be shorter. Here, we performed a detailed analysis of the size profiles of plasma DNA in 90 patients with hepatocellular carcinoma, 67 with chronic hepatitis B, 36 with hepatitis B-associated cirrhosis, and 32 healthy controls. We used massively parallel sequencing to achieve plasma DNA size measurement at single-base resolution and in a genome-wide manner. Tumor-derived plasma DNA molecules were further identified with the use of chromosome arm-level z-score analysis (CAZA), which facilitated the studying of their specific size profiles. We showed that populations of aberrantly short and long DNA molecules existed in the plasma of patients with hepatocellular carcinoma. The short ones preferentially carried the tumor-associated copy number aberrations. We further showed that there were elevated amounts of plasma mitochondrial DNA in the plasma of hepatocellular carcinoma patients. Such molecules were much shorter than the nuclear DNA in plasma. These results have improved our understanding of the size profile of tumor-derived circulating cell-free DNA and might further enhance our ability to use plasma DNA as a molecular diagnostic tool.
Analysis of circulating cell-free DNA has been increasingly used for the detection and monitoring of cancers (1–5). Different cancer-associated molecular characteristics, including copy number aberrations (6–9), methylation changes (10–13), single-nucleotide mutations (6, 14–17), cancer-derived viral sequences (18, 19), and chromosomal rearrangements (20, 21), can be detected in the plasma of patients with various types of cancers. Despite the rapid expansion of clinical applications, many fundamental molecular characteristics of circulating DNA in cancer patients remain unclear. In particular, previous studies on the size of circulating DNA in cancer patients gave inconsistent results. Studies have demonstrated that the overall integrity of circulating DNA would increase in cancer patients compared with subjects without a malignant condition (22–25). Using PCR with different amplicon sizes, it was shown that the proportion of longer DNA would be higher in cancer patients. This aberration in DNA integrity was shown to be reversible after treatment, and the persistence of such changes was associated with poor prognosis (22, 26). On the other hand, there is also seemingly contradictory evidence that circulating DNA derived from tumor tissues might be shorter than those derived from nonmalignant cells. For example, it has been shown that the proportion of DNA molecules carrying cancer-associated mutations would be higher when those mutations were detected using PCR with shorter amplicons (14, 27).
In this study, we aimed to reconcile these apparent inconsistencies through the use of a study design that takes advantage of the following: (i) genome-wide high-resolution size profiling of plasma DNA enabled by massively parallel sequencing (28, 29); and (ii) an efficient approach to distinguish tumor-derived DNA from the nontumoral background DNA in the plasma of cancer patients. We believe that enhanced characterization of plasma DNA molecules in cancer patients would be useful for understanding the mechanisms involved in their generation and would offer useful insights for the development of diagnostic approaches.
It has become feasible to measure the lengths of every individual plasma DNA molecule in samples with the use of massively parallel sequencing (28, 29). Hence, plasma DNA sizes could be studied in a genome-wide manner and at single-base resolution. Using this approach, the size of circulating DNA has generally been shown to resemble the size of mononucleosomal DNA, suggesting that plasma DNA might be generated through apoptosis (28, 29). In pregnant women, plasma DNA derived from the fetus has been shown to be shorter than that of DNA derived from the mother (28). The size difference between circulating fetal and maternal DNA has provided a previously unidentified conceptual basis for quantifying fetal DNA in maternal plasma and detecting chromosomal aneuploidies through size analysis of plasma DNA (30). In addition, differences in the size distributions of circulating DNA derived from the transplanted organs and the patients’ own tissues have been observed for recipients of solid organ or bone marrow transplantation (29).
In this study, we used hepatocellular carcinoma (HCC) as a model to study the size distribution of plasma DNA in cancer patients. The size distributions of plasma DNA in HCC patients, patients with chronic hepatitis B virus (HBV) infection, patients with liver cirrhosis, and healthy subjects were also analyzed. Plasma of cancer patients contains a mixture of tumor-derived and non–tumor-derived DNA. We were particularly interested in studying the size profile of tumor-derived DNA in the plasma of the HCC patients. However, this is a challenging endeavor because tumor-derived plasma DNA could not be readily distinguished from the non–tumor-derived background DNA in plasma. The detection of cancer-specific mutations offers a genotypic means to distinguish the tumoral from the nontumoral plasma DNA. However, there are relatively few cancer-specific mutations across the genome (31–34) for the purpose of generating a broad, detailed, and yet cost-effective view of the size distribution of tumor-derived DNA.
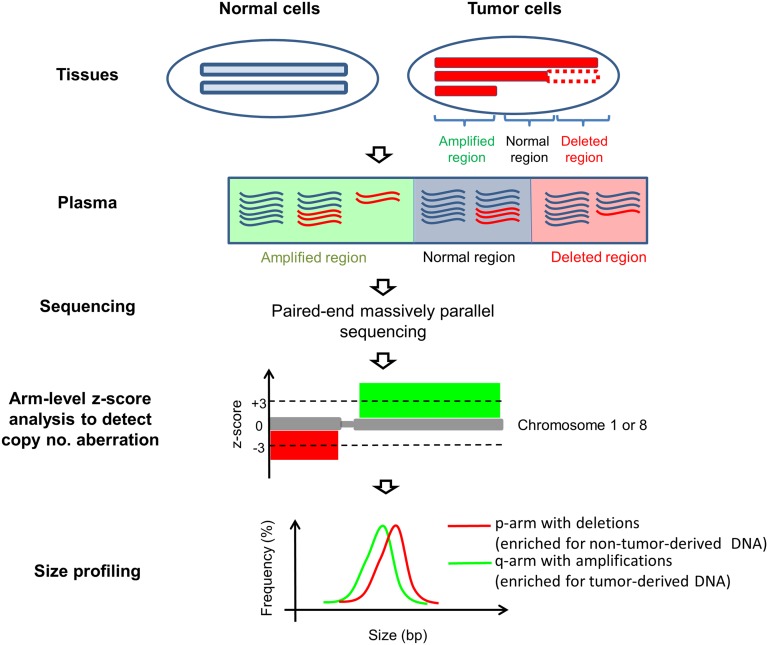
To circumvent this issue, we used chromosome arms that are affected by copy number aberrations (CNAs) to infer the difference in size distributions of tumor-derived and non–tumor-derived plasma DNA. The principle of this method is illustrated in Fig. 1. For chromosome arms that are amplified in the tumor tissues, the proportional contribution from tumor-derived DNA to plasma DNA would increase, whereas for chromosome arms that are deleted in the tumor, the contribution would decrease. Therefore, the comparison of size profiles of chromosome arms that are amplified and deleted would reflect the size difference between tumor-derived and non–tumor-derived DNA in plasma. CNA involving a whole chromosome arm or a large trunk of a chromosome arm is relatively common (35). Deletion of chromosomes 1p and 8p and amplification of chromosomes 1q and 8q are commonly observed in the HCC tissues (36–38). Thus, in this study, we focused on chromosomes 1 and 8 for the CNA and size-profiling analyses of plasma DNA. As the characteristic size profile of plasma nuclear DNA is likely to be related to histone packing, we hypothesized that the lack of histones packing for mitochondrial DNA might affect its abundance and size profile in plasma. Thus, we have also studied the size and fractional concentration of plasma mitochondrial DNA in the same cohort of subjects.
Fig. 1.
Schematic illustration of the principle of plasma DNA size analysis in cancer patients. In cancer patients, plasma DNA is derived from both tumor (red molecules) and nontumor cells (blue molecules). Genomic regions that are amplified in the tumor tissue would contribute more tumoral DNA to plasma. Genomic regions that are deleted in the tumor tissue would contribute less DNA to plasma. Chromosome arm-level z-score analysis (CAZA) was used to determine if a chromosome arm is overrepresented or underrepresented in plasma DNA, suggestive of the presence of amplification or deletion, respectively, of the chromosome arm in the tumor. The size profiles of plasma DNA molecules originating from chromosome arms that are underrepresented (enriched for nontumor DNA) and overrepresented (enriched for tumor-derived DNA) were compared.
Results
Chromosome Arm-Level z-Score Analysis on Plasma DNA for CNA Detection.
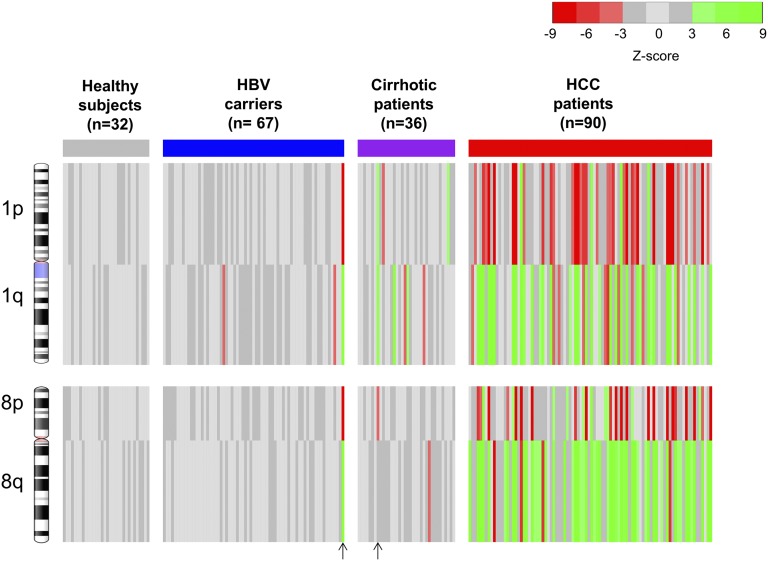
We analyzed a total of 225 plasma DNA samples from 90 HCC patients, 67 patients with chronic HBV infection, 36 patients with HBV-associated liver cirrhosis, and 32 healthy subjects. For the HCC patients, 85 (94.4%) had Barcelona Clinic Liver Cancer stage A disease and 5 (5.6%) had stage B disease. A median of 31 million reads (range: 17–79 million) was obtained from each plasma sample. Amounts of sequence reads originating from chromosome arms that were 3 SDs below (z scores less than −3) and 3 SDs above (z scores greater than 3) the mean of healthy controls were deemed to indicate significant underrepresentations and overrepresentations of the plasma DNA from those chromosome arms, respectively. These plasma DNA quantitative aberrations were generally reflective of the presence of copy number losses and copy number gains (CNAs) in the tumor (6) (Fig. S1). The plasma CNA results by chromosome arm-level z-score analysis (CAZA) of chromosomes 1 and 8 for all of the HCC patients and controls are shown in Fig. 2 and summarized in Table 1. Seventy-six (84.4%) of the 90 HCC patients had at least one chromosomal arm-level CNA on chromosomes 1 and 8 in plasma.
Fig. 2.
Plasma CNA results for all studied subjects by CAZA. The four chromosome arms (1p, 1q, 8p, and 8q) that are frequently affected by CNAs in HCC were analyzed. Red and green lines represent underrepresentation and overrepresentation, respectively, of the corresponding chromosome arms in plasma. Each vertical line represents the data for one case. The vertical arrows at the bottom of the figure indicate the two cases in which HCC was diagnosed 3–4 mo following blood sampling.
Table 1.
Detectability of CNAs in plasma of HCC patients, HBV carriers with and without cirrhosis, and healthy subjects
| No. of patients (%) with CNAs detected in plasma | |||||
| Subject category | Chr 1p | Chr 1q | Chr 8p | Chr 8q | Any of Chr 1p/1q/8p/8q |
| HCC patients (n = 90) | 39/90 (43.3) | 46/90 (51.1) | 33/90 (36.7) | 63/90 (70.0) | 76/90 (84.4) |
| HBV carriers with cirrhosis (n = 36) | 3/36 (8.3) | 5/36 (13.9) | 1/36 (2.8) | 1/36 (2.8) | 8/36 (22.2) |
| HBV carriers without cirrhosis (n = 67) | 1/67 (1.5) | 3/67 (4.48) | 1/67 (1.5) | 1/67 (1.5) | 3/67 (4.5) |
| Healthy subjects (n = 32) | 0/32 (0) | 0/32 (0) | 0/32 (0) | 0/32 (0) | 0/32 (0) |
Chr, chromosome.
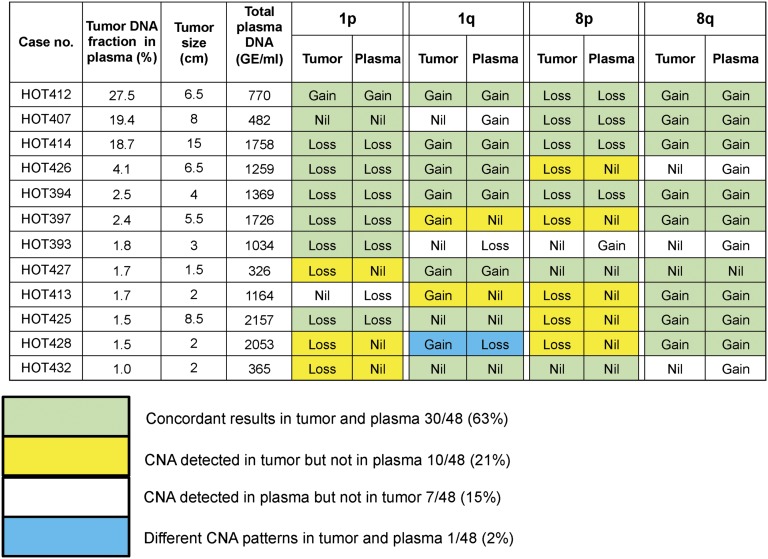
Tumor tissues of 12 HCC patients were available to corroborate the plasma DNA findings. The tissue samples were sequenced, and the CNA patterns are shown in Fig. 3. Of the 48 chromosome arms analyzed for the 12 patients, concordant changes in plasma and tumor tissues were observed for 30 (63%) arms. The total plasma DNA concentrations were measured using quantitative real-time PCR targeting the HBB (hemoglobin, beta) gene (39). CNAs were only observed in the tumors but not in the plasma for 10 (21%) arms. These cases tended to have lower tumor DNA fractions in the plasma. CNAs were observed in the plasma but not the tumors for 7 (15%) arms. In one case (HOT428), gain of 1q was observed in the tumor, but a loss was observed in the plasma. These data might reflect the presence of tumoral heterogeneity where there might be other foci or clones of cancer cells contributing plasma DNA. Among the HBV carriers with and without liver cirrhosis, the detection rates of these CNA were 22.2% and 4.5%, respectively. Interestingly, one HBV carrier with cirrhosis and another one without cirrhosis exhibited CNA in the plasma but, not known to have HCC at the time of blood collection, were diagnosed with HCC at 3 and 4 mo afterward, respectively. All of the HBV carriers and cirrhotic patients were followed up for at least 6 mo. For those control subjects without any CNA in plasma, none of them had developed HCC during the follow-up period. The clinical significance of having CNA in plasma for subjects without a current cancer would warrant further investigation with longer follow-up of these subjects. None of the 32 healthy subjects had detectable CNA on chromosome 1 or 8 in plasma by CAZA. In the HCC patients, the disproportionate increase or decrease in sequence reads in the plasma due to the presence of CNAs is reflective of the fractional concentrations of tumor DNA in the plasma samples. The median fractional concentration of tumor-derived DNA in the plasma of the HCC patients was 2.1% (range: 0–53.1%; interquartile range: 1.2–3.8%).
Fig. 3.
CNAs detected in the tumor and corresponding plasma of 12 HCC patients. The patients are arranged in descending order of tumor DNA fraction in plasma. A total of 48 chromosome arms were analyzed for the 12 patients. The numbers (and percentages) of chromosome arms with concordant and discordant results between tumor and plasma are shown.
Plasma DNA Size Distribution of HCC Patients.
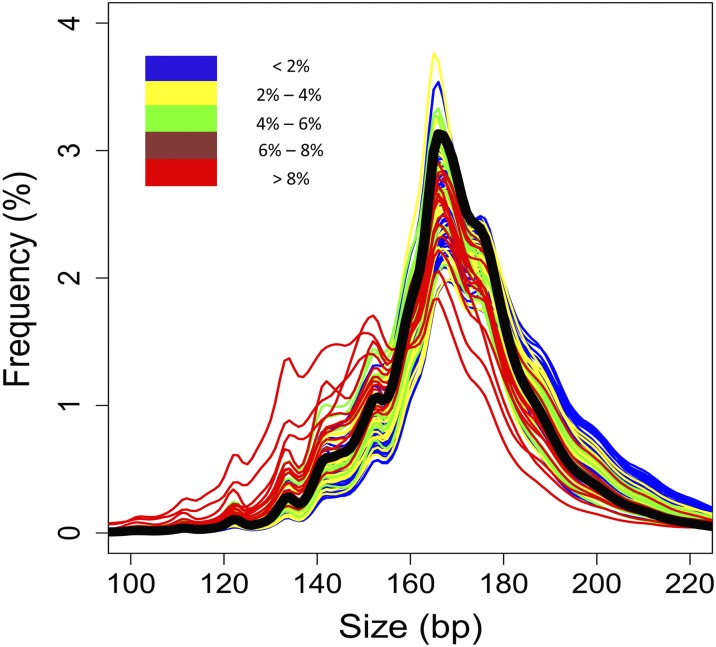
The size distributions of plasma DNA of the HCC patients, HBV carriers with and without cirrhosis, and healthy controls are shown in Fig. 4 and Fig. S2. In general, the most prominent peak was observed at 166 bp in the size distribution plot of each subject. This observation is consistent with previous reports on pregnant women and transplant recipients (28–30), suggesting that most of the circulating DNA molecules are derived from apoptosis. Interestingly, compared with healthy controls (black line in Fig. 4), the sizes of plasma DNA in HCC patients with low fractional tumor DNA concentrations were longer. However, with increasing fractional concentrations of tumor DNA in plasma, the size distribution of plasma DNA shifted progressively to the left (Fig. 4).
Fig. 4.
Size distributions of plasma DNA fragments in the HCC patients with different fractional concentrations of tumor-derived DNA in plasma. The median size distribution profile for the 32 healthy subjects is shown as a thick black line.
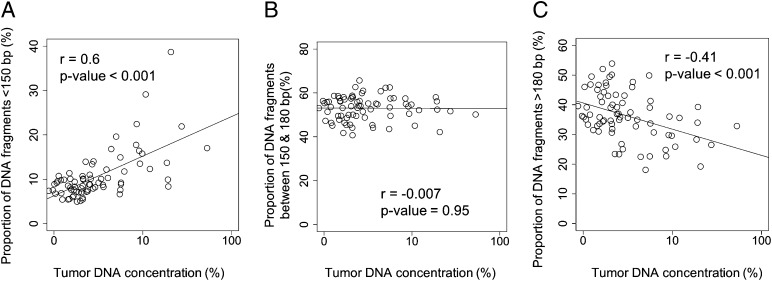
For further analyses, we separately explored plasma DNA molecules of three different size groups, namely, those less than 150 bp, those between 150 and 180 bp, and those above 180 bp. There is a positive correlation (Pearson’s r = 0.6; P value < 0.001) between the proportion of DNA fragments less than 150 bp and the tumor DNA fraction in plasma (Fig. 5A). No correlation (r = −0.07; P value = 0.95) was observed between the proportion of DNA fragments with sizes between 150 and 180 bp and tumor DNA fraction in plasma (Fig. 5B). A negative correlation (r = −0.41; P value less than −0.001) was observed between the proportion of DNA more than 180 bp and tumor DNA fraction in plasma (Fig. 5C).
Fig. 5.
Plots of the proportions of plasma DNA fragments of (A) shorter than 150 bp, (B) from 150 to 180 bp, and (C) longer than 180 bp against tumor DNA fraction in plasma. The tumor DNA fraction in plasma is shown in logarithmic scale.
Size Analysis of Tumor-Derived DNA Fragments in Plasma.
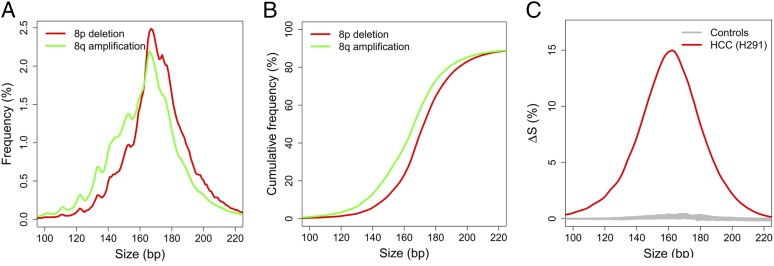
To compare the size profiles of plasma DNA originating from tumor and nontumor tissues, we analyzed the plasma DNA fragments from the chromosome arms with CNAs. Based on previous studies (36–38) as well as our findings in this study, typical CNAs associated with HCC include 1p and 8p deletions, and 1q and 8q amplifications. A HCC case (H291) with 53% tumor-derived DNA in plasma is used to illustrate the principle. This case showed 8p deletion and 8q amplification in plasma. Thus, the tumor would release more plasma DNA from the amplified region of 8q than the deleted region of 8p. As a result, 8q would be relatively enriched for tumor-derived DNA and 8p would be relatively depleted of tumor DNA (or, in other words, relatively enriched for nontumor DNA) compared with regions without CNA. The size profiles of plasma DNA for 8p and 8q are shown in Fig. 6A. The size profile for 8q was on the left side of that for 8p, indicating that the size distribution of plasma DNA for 8q was shorter than that for 8p. Because 8q is enriched with tumor DNA, the data suggest that DNA released by the tumor tends to be shorter than DNA not originating from the tumor.
Fig. 6.
Size distributions of plasma DNA originating from the amplified 8q and deleted 8p of an illustrative case (H291). (A) The size distributions of plasma DNA for 8p (red) and 8q (green). (B) Plot of cumulative frequencies for plasma DNA size for 8p (red) and 8q (green). (C) The difference in cumulative frequencies, denoted as ∆S, between 8q and 8p for the HCC case H291 (red line). Gray lines are the results for all healthy control subjects.
To quantify the degree of shortening, cumulative frequency plots (Fig. 6B) for the size profiles for 8p and 8q were constructed for each plasma sample. These plots show the progressive accumulation of DNA molecules, from short to long sizes, as a proportion of all of the plasma DNA molecules in the sample. The difference between the two curves ΔS (Fig. 6C) was then calculated as follows:
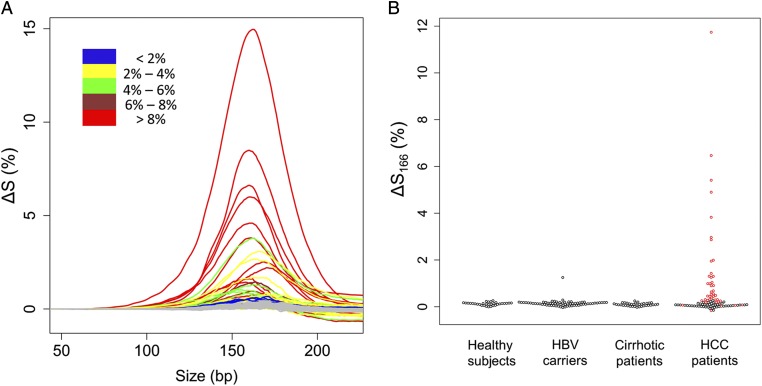
where ΔS represents the difference in the cumulative frequencies between 8p and 8q at a particular size, and S8p and S8q represent the proportions of plasma DNA fragments less than a particular size on 8p and 8q, respectively. A positive value of ΔS for a particular size indicates a higher abundance of DNA shorter than that particular size on 8q compared with 8p. Using this method, we scanned the ΔS values from 50 to 250 bp for all HCC cases that exhibited CNAs on 8p and 8q in plasma. Compared with the healthy controls (gray lines), all these HCC cases showed higher abundance of plasma DNA shorter than 200 bp originating from 8q (enriched for tumor DNA) than from 8p (enriched for nontumor DNA) (Fig. 7A). These data further support that tumor-derived DNA was shorter than that of non–tumor-derived DNA.
Fig. 7.
The difference in the cumulative frequencies for size between 8q and 8p (∆S). (A) Plot of ∆S against size for all of the HCC cases with different CNAs on 8p and 8q in plasma. Cases with different ranges of fractional tumor DNA concentrations in plasma are shown in different colors. (B) The values of ∆S166 among different groups. For the HCC group, patients with and without different CNAs on 8p and 8q as determined by plasma CAZA analysis are represented by red and black dots, respectively.
The value of ΔS attained a maximum at 166 bp, suggesting that the key difference between plasma DNA derived from tumor and nontumor tissues is the relative abundance of DNA <166 and ≥166 bp. We denote this value as ΔS166. The ΔS166 was plotted for all subjects of this study, including the HBV carriers without cirrhosis and those with liver cirrhosis (Fig. 7B). For almost all of the non-HCC subjects, the ΔS166 values were close to 0, indicating that the size distributions for DNA from 8p and 8q were similar. Size analysis based on the plasma DNA size profiles of 1p and 1q was also performed (Figs. S3 and S4) and showed the same trend.
Analysis of Mitochondrial DNA in Plasma.
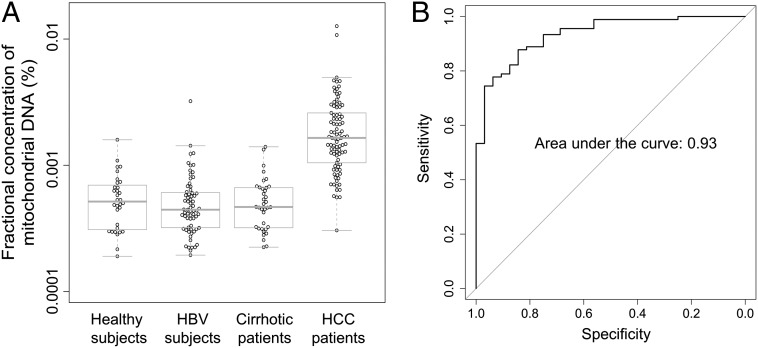
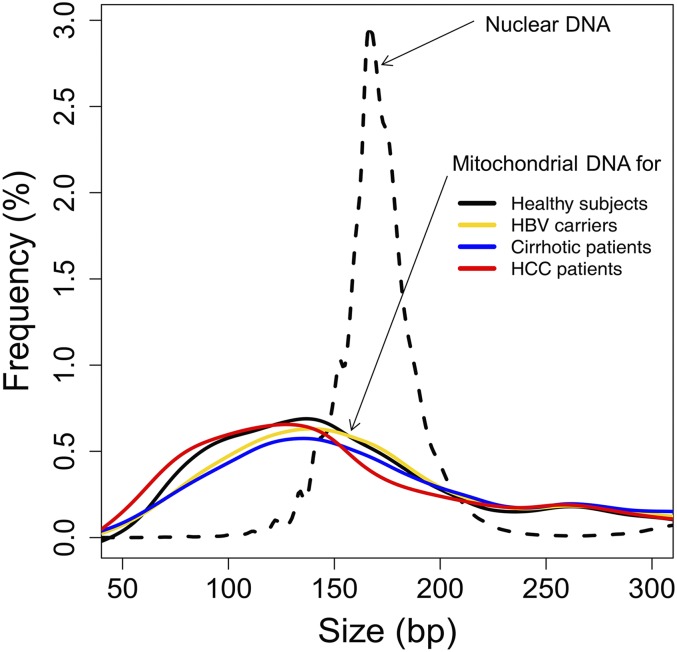
We compared the fractional concentrations of plasma mitochondrial DNA between HCC patients and the control subjects (Fig. 8A). The median fractional concentrations of mitochondrial DNA in plasma were 0.0014% and 0.00045% for the HCC patients and the healthy subjects, respectively (P value < 0.0001, Mann–Whitney test). Using receiver operating characteristic (ROC) curve analysis, the area under the curve was 0.93 (Fig. 8B). With a cutoff of 0.00084%, as determined by the top left-hand point of the ROC curve, a sensitivity of 80% and a specificity of 94% were achieved for discriminating HCC patients and healthy subjects. No significant difference in the fractional concentration of mitochondrial DNA was observed between the HBV carriers without cirrhosis (P value = 0.32, Mann–Whitney test) or those with cirrhosis (P value = 0.49, Mann–Whitney test) compared with the healthy subjects. As the number of sequenced mitochondrial DNA fragments was relatively small for any individual subject, we pooled the sequenced mitochondrial DNA fragments from all subjects in the same group to obtain a pooled size profile. We noted that the characteristic peak at 166 bp was not observed in plasma mitochondrial DNA and the overall size distribution of the mitochondrial DNA in plasma was shorter than that of nuclear DNA (Fig. 9).
Fig. 8.
(A) The fractional concentration of mitochondrial DNA in plasma. (B) ROC curve on the use of fractional concentration of mitochondrial DNA in plasma for discriminating the HCC patients from the healthy subjects.
Fig. 9.
The size profiles of circulating mitochondrial DNA in healthy subjects (black), HBV carriers (yellow), cirrhotic patients (blue), and HCC patients (red). The size profile of circulating nuclear DNA of one healthy control subject is shown for comparison (dotted line).
Discussion
The size of plasma DNA molecules is one of the fundamental parameters governing this important biomarker. Nonetheless, there are a number of inconsistencies in the literature in this area. Studies have reported the presence of longer DNA in the plasma of cancer patients (22–25), whereas others reported higher prevalence of cancer-associated DNA mutations among the shorter plasma DNA molecules (14, 27, 40).
This study was hence designed with an intent to explore the plasma DNA size profile of HCC patients in a high-resolution and comprehensive manner, which may shed light on the mechanisms related to the generation or release of plasma DNA by tumor tissues. Another goal of the study was to resolve some of the apparent inconsistencies that existed in the literature regarding cancer-associated plasma DNA size profiles. To achieve these study goals, a two-step approach was adopted. First, we measured the lengths of all DNA molecules in plasma samples of the recruited subjects with the use of paired-end massively parallel sequencing. This approach allows one to determine the lengths of individual plasma DNA molecules up to single-base resolution. Furthermore, plasma DNA molecules across the genome could be analyzed and the relative amounts between DNA of different sizes could be determined with high precision. Hence, a broad and deep survey of the plasma DNA size profile could be obtained. Second, we took advantage of the relative difference in tumoral DNA content in plasma DNA originating from genomic locations that were associated with amplifications or deletions, the CAZA approach, as a means to identify tumor-derived plasma DNA for detailed analysis.
This study provides a number of insights into the biological mechanisms that might be involved in the release of plasma DNA. Plasma DNA of all recruited subjects, including the HBV carriers, patients with liver cirrhosis or HCC, exhibited a prominent peak at 166 bp (Fig. 4 and Fig. S2). This pattern is analogous to observations in the plasma of pregnant women and organ transplant recipients (28, 29). The presence of the characteristic 166-bp peak in the plasma DNA size profile of all groups of patients studied suggests that most of the circulating DNA molecules in human plasma, including that of pregnant women, transplant recipients, patients with HCC, liver cirrhosis, or chronic HBV infection, resemble mononucleosomal units and are likely to originate from the process of apoptosis. Of note, the size range of plasma DNA deduced using a series of quantitative PCR assays with different amplicon sizes appeared to be shorter than our results determined using massively parallel sequencing (27, 40). Using quantitative PCR systems, the size of most plasma DNA molecules was deduced to be shorter than 150 bp (27, 40, 41). The reason of this discrepancy is unclear, and it would be interesting to perform direct comparison of the results of massively parallel sequencing and quantitative PCR on the same set of samples in future studies.
The study of the size profile of plasma DNA molecules bearing tumor-associated CNAs indicates that such molecules are shorter than those not carrying such signatures (Fig. 7). This is consistent with our observation that, with increasing fractional concentrations of tumor DNA in plasma, the size profile of plasma DNA would shift toward the left (Fig. 4). However, the fact that HCC patients with low fractional concentrations of tumor DNA in plasma had an apparently longer size distribution than healthy controls suggests that there was an additional component of plasma DNA that did not carry the tumor-associated genomic signatures. It is possible that this component would be derived from the nonneoplastic liver tissues surrounding the tumor. These long DNA molecules could be derived from necrosis instead of apoptosis. It has been reported that cell death associated with tissue necrosis may generate longer DNA fragments in addition to the typical oligonucleosomal DNA fragments (42, 43). For future studies, it would be interesting to study the DNA methylation profile of these longer DNA molecules to see if they bear resemblances to that expected for the liver.
An early study using massively parallel sequencing in the plasma of prostate cancer patients and controls did not find any difference in size profile (44). However, this study pooled the cancer patients’ samples and the control samples into two groups and only analyzed ∼1,800 sequences per group. There are two possible reasons why they did not detect the shortening of tumor-derived DNA in the cancer patients: (i) the number of sequences analyzed in their study was much lower than in our current study (∼1,800 sequences for each of the two pooled groups versus a median of 31 million per plasma sample in our study); and (ii) they did not distinguish DNA fragments derived from tumor and nontumor tissues. Thus, it is not possible to compare the size profiles of DNA derived from tumor and nontumor tissues.
Apart from the intrinsic biological interest, plasma DNA size profiling may also be useful for the development of diagnostic approaches for detecting cancer-associated changes in plasma. For example, enrichment of tumoral DNA from plasma may be achieved by focusing on the analysis of short DNA fragments. In addition, we observed that the proportion of short DNA molecules bore a positive relationship with the fractional concentration of tumor-derived DNA in plasma. The changes in size profiles can be used for the monitoring of patients during the course of treatment. Furthermore, the presence of the population of long DNA molecules in the plasma of the patients with and without HCC warrants further investigation. When the tissue source or pathological process that governs the release of these DNA molecules are better understood, measuring the proportion of long DNA in plasma might be useful for the assessment of such diseases.
In this study, we used the CAZA approach to identify chromosomal arms that showed plasma DNA quantitative aberrations suggestive of the presence of tumor-associated CNA. After identifying the chromosome arms with amplifications or deletions, we focused on these regions as a strategy to compare tumor-derived (enriched in the amplified regions) and non–tumor-derived plasma DNA (enriched in the deleted regions). We believe that this approach may potentially provide a more robust means to identify tumoral DNA for size-profiling analysis than based on the detection of cancer-associated mutations. For the latter, on average, it has been reported that there are of the order of thousands of point mutations in cancer genomes (31–34, 45) and only plasma DNA molecules carrying the mutational sites would be informative. For CAZA, on the other hand, any of the myriad of plasma DNA molecules derived from the genomic regions exhibiting CNAs, totaling in terms of tens of megabases, would be useful.
Besides its value in studying the size profile of plasma DNA derived from tumor cells, CAZA also provides a way to detect tumor-associated CNAs noninvasively. In HCC, chromosomes 1 and 8 are commonly affected by CNAs (36–38). Indeed, our data showed that 76 (84.4%) of the 90 HCC patients had at least one CNA involving either arms on chromosomes 1 and 8 in plasma, whereas none of the 32 healthy subjects exhibited any CNA for these two chromosomes in plasma. Plasma CNAs involving chromosomes 1 and 8 were also detected in 22.2% and 4.5% of HBV carriers with and without cirrhosis, respectively. In one HBV carrier without cirrhosis and another one with cirrhosis, HCC was diagnosed several months after the blood collection. It is likely that the cancer would have been present at the time of blood collection and was associated with the CNAs in plasma. The clinical significance of plasma CNA in those subjects without a cancer would warrant further investigation. It is possible that they could have preclinical HCC or even other cancers. Longer term follow-up might help to address this issue. The relatively high detection rate of plasma CNAs in the HCC patients suggests that this approach might have future value in the screening of HBV carriers. Moreover, CNAs are present in almost all types of cancer (35). Therefore, this approach has the potential of being applied as a generic tumor marker with adaptation to the specific CNA patterns of the cancer of interest.
Circulating nuclear DNA showed a characteristic size pattern with a prominent peak at 166 bp. This pattern is likely to be the result of protection from enzymatic degradation due to histone binding to nuclear DNA. This pattern was not observed in the size distribution of circulating mitochondrial DNA. We observed that the size distribution of mitochondrial DNA was shorter than that of nuclear DNA in plasma. The median fractional concentration of plasma mitochondrial DNA was only 0.00045% in healthy subjects. This fractional concentration is relatively low, considering that the size of mitochondrial genome is 0.00053% of the size of the nuclear genome and there are 50–4,000 mitochondria per cell (46, 47). The smaller size distribution and relatively low abundance of circulating mitochondrial DNA is likely to be due to the higher susceptibility of mitochondrial DNA to degradation due to the absence of histone protection. Interestingly, the concentration of mitochondrial DNA in plasma was higher in the HCC patients compared with the healthy subjects. This may be due to the higher number of mitochondria in HCC cells or liver cells in general compared with hematopoietic cells, which are the major source of circulating DNA in healthy subjects (46–48). Quantitative analysis for plasma mitochondrial DNA might be useful for the detection of HCC. Using ROC analysis, a sensitivity of 80% and a specificity of 94% were achieved.
In summary, we profiled the size distribution of plasma DNA in patients with HCC at single-nucleotide resolution. We have demonstrated a difference in the size of plasma DNA derived from tumor and nontumor tissues. We showed that there were additional populations of shorter and longer DNA molecules in plasma of HCC patients. These data have resolved a number of important apparent inconsistencies that existed in the literature concerning the size profiles of plasma DNA in cancer patients. The characterization of the size of circulating cell-free DNA has improved our understanding of the biology underlying the generation of these different DNA species in plasma and may lead to the development of new diagnostic approaches. Based on the size difference between fetal and maternal DNA in the plasma of pregnant women, it has recently been shown that plasma DNA size analysis can be used synergistically with counting approach to improve the accuracy of prenatal testing of fetal chromosomal aneuploidies (30). A similar approach could potentially be adopted for the detection and monitoring of cancers. Finally, we have also shown that the quantitative analysis of plasma mitochondrial DNA by massively parallel sequencing might serve as a marker for HCC.
Materials and Methods
Subjects.
Ninety patients with HCC admitted to the Department of Surgery of the Prince of Wales Hospital, Hong Kong, for tumor resection were recruited. All blood samples were collected before operation. Sixty-seven HBV carriers without cirrhosis and 36 patients with HBV-related cirrhosis were recruited from the Department of Medicine and Therapeutics of the Prince of Wales Hospital, Hong Kong. Thirty-two healthy subjects were also recruited. All recruited subjects gave written informed consent. The study was approved by the Joint Chinese University of Hong Kong and New Territories East Cluster Clinical Research Ethics Committee.
DNA Extraction and Preparation of Sequencing Libraries.
Peripheral blood samples were collected into EDTA-containing tubes. Peripheral blood samples were centrifuged at 1,600 × g for 10 min at 4 °C. The plasma portion was recentrifuged at 16,000 × g for 10 min at 4 °C to obtain cell-free plasma. The plasma samples were stored at −80 °C until further analysis. DNA was extracted from 3 to 4.8 mL of plasma using the QIAamp DSP DNA Blood Mini Kit (Qiagen). The plasma DNA was concentrated with a SpeedVac Concentrator (Savant DNA120; Thermo Scientific) into a 75-μL final volume per sample. Indexed DNA libraries were prepared by using the Kapa Library Preparation Kit (Kapa Biosystems) following the manufacturer’s instructions. The adaptor-ligated DNA was enriched by a 14-cycle PCR using the KAPA HiFi HotStart ReadyMix PCR Kit (Kapa Biosystems). The libraries were then analyzed by a 2100 Bioanalyzer (Agilent) and quantified by the Kapa Library Quantification Kit (Kapa Biosystems) before sequencing.
Measurement of Total Plasma DNA Concentration.
Total plasma DNA concentration was measured for each of the 12 HCC patients whose tumor tissues were also sequenced. The total plasma DNA was measured by real-time PCR targeting the HBB gene. The primers and probes were as previously described (39). The real-time PCRs were performed using the TaqMan Universal Mastermix (Life Technologies). Five microliters of plasma DNA was used for each PCR and the final volume of each reaction was 50 μL. Each sample was analyzed in duplicate and the mean was recorded.
DNA Sequencing and Alignment.
Each DNA library was diluted and hybridized to a paired-end sequencing flow cell (Illumina). DNA clusters were generated on a cBot cluster generation system (Illumina) with the TruSeq PE Cluster Generation Kit, version 3 (Illumina), followed by 76 × 2 cycles of sequencing on a HiSeq 2000 system (Illumina) with the TruSeq SBS Kit, version 3 (Illumina). Sequencing was performed using a four-plex protocol. We performed an additional seven cycles of sequencing to decode the index sequence on each sequenced DNA molecule. Real-time image analysis and base calling were performed using the HiSeq Control Software (HCS), version 1.4, and Real Time Analysis (RTA) Software, version 1.13 (Illumina), by which the automated matrix and phasing calculations were based on the spiked-in PhiX control, version 3, sequenced with the libraries. After base calling, adapter sequences and low-quality bases (i.e., quality score, <5) were removed.
For sequencing data analysis, sequences from each lane were assigned to the corresponding samples based on the six-base index sequences. The sequenced reads were then aligned to the non–repeat-masked human reference genome (National Center for Biotechnology Information build 37/hg19) using the Short Oligonucleotide Alignment Program 2 (SOAP2) (49). Up to two nucleotide mismatches were allowed for each member of the paired-end reads, but insertions or deletions were not allowed. Reads mapped to a unique genomic location were used for downstream analyses. Paired-end reads aligned to the same chromosome with a correct orientation and spanning an insert size of ≤600 bp were retained for downstream size analyses. After alignment to the reference human genome, the size of each plasma DNA fragment could be deduced from the coordinates of the nucleotides at the outermost ends of each pair of sequence reads. The first single-end reads were used for CNA analysis. As there is considerable homology between the mitochondrial genome and the nuclear genome, all sequenced reads that were initially mapped to the mitochondrial genome were further realigned to a combined nuclear and mitochondrial genome using a more stringent requirement of mapping accuracy. Reads with mapping quality of greater than 30 (i.e., 1 erroneous alignment per 1,000 alignments) using the Bowtie 2 software (50) were accepted.
CAZA for CNA.
The entire human genome was divided into 100-kb bins. The GC-corrected read count was determined for each 100-kb bin as reported previously (51). The number of GC-corrected read counts for each chromosome arm of interest was determined by summing all values of each 100-kb bin on the chromosome arm. A z-score statistic was used to determine if the plasma DNA representation in a chromosome arm would be significantly increased or decreased compared with the reference group. The percentage of sequencing reads mapped to each chromosome arm was calculated and compared with the mean value of the 32 healthy control subjects for the respective chromosome arm. An arm-level z score was calculated as follows:
where Ptest represents the proportion of fragments mapped to the chromosome arm of interest for the test case; Pnormal and SDnormal represent the mean and SD of the proportion of fragments mapped to the chromosome arm for the healthy controls, respectively. Chromosome arms with z scores of less than −3 and greater than 3 were regarded as having CNAs in plasma corresponding to deletions and amplifications, respectively.
The fractional concentration of tumor-derived DNA in the plasma (F) can be calculated as follows:
where Ptest represents the proportion of fragments mapped to the chromosome arm of interest for the test case, Pnormal represents the mean proportion of fragments mapped to the chromosome arm for the healthy controls, and ΔN represents the copy number change. For cases showing a deletion in at least one chromosome arm, we calculate F based on the deleted chromosome arm(s). As most chromosome arm deletions involve only one of the two homologous chromosomes (35), we assumed a single-copy loss for our analysis. For the 24 cases with only chromosome arm amplification but no deletion, F was calculated based on the amplified arm with the assumption of single-copy gain. The lower limit of measurement for fractional tumor DNA concentration was 0.87%.
Statistical Analysis.
Sequencing data analysis was performed by using bioinformatics programs written in Perl and R languages. A P value of <0.05 was considered as statistically significant, and all probabilities were two-tailed.
Supplementary Material
Acknowledgments
We thank Lisa Chan, Yoyo Jin, Coral Lee, S. W. Yeung, and Xiaoxi Su for technical assistance. This work is supported by the Hong Kong Research Grants Council Theme-Based Research Scheme (T12-404/11), the S. K. Yee Foundation, and the Innovation and Technology Fund under the State Key Laboratory Programme. Y.M.D.L. is supported by an endowed chair from the Li Ka Shing Foundation.
Footnotes
Conflict of interest statement: R.W.K.C. and Y.M.D.L. received research support from Sequenom, Inc. R.W.K.C. and Y.M.D.L. are consultants to Sequenom, Inc. R.W.K.C., K.C.A.C., and Y.M.D.L. hold equities in Sequenom, Inc. R.W.K.C., K.C.A.C., and Y.M.D.L. are founders of Xcelom. P.J., R.W.K.C., K.C.A.C., and Y.M.D.L. have filed patents/patent applications based on the data generated from this work.
Data deposition: The sequence data for the subjects studied in this work who consented to data archiving have been deposited in the European Genome–Phenome Archive (EGA), www.ebi.ac.uk/ega, hosted by the European Bioinformatics Institute (EBI), www.ebi.ac.uk (accession no. EGAS00001001024).
See Commentary on page 3178.
This article contains supporting information online at www.pnas.org/lookup/suppl/doi:10.1073/pnas.1500076112/-/DCSupplemental.
References
- 1.Jung K, Fleischhacker M, Rabien A. Cell-free DNA in the blood as a solid tumor biomarker—a critical appraisal of the literature. Clin Chim Acta. 2010;411(21-22):1611–1624. doi: 10.1016/j.cca.2010.07.032. [DOI] [PubMed] [Google Scholar]
- 2.Chan KCA. Scanning for cancer genomic changes in plasma: Toward an era of personalized blood-based tumor markers. Clin Chem. 2013;59(11):1553–1555. doi: 10.1373/clinchem.2013.207381. [DOI] [PubMed] [Google Scholar]
- 3.Bidard FC, Weigelt B, Reis-Filho JS. Going with the flow: From circulating tumor cells to DNA. Sci Transl Med. 2013;5(207):07ps14. doi: 10.1126/scitranslmed.3006305. [DOI] [PubMed] [Google Scholar]
- 4.Beck J, Urnovitz HB, Mitchell WM, Schütz E. Next generation sequencing of serum circulating nucleic acids from patients with invasive ductal breast cancer reveals differences to healthy and nonmalignant controls. Mol Cancer Res. 2010;8(3):335–342. doi: 10.1158/1541-7786.MCR-09-0314. [DOI] [PubMed] [Google Scholar]
- 5.Dawson SJ, et al. Analysis of circulating tumor DNA to monitor metastatic breast cancer. N Engl J Med. 2013;368(13):1199–1209. doi: 10.1056/NEJMoa1213261. [DOI] [PubMed] [Google Scholar]
- 6.Chan KCA, et al. Cancer genome scanning in plasma: Detection of tumor-associated copy number aberrations, single-nucleotide variants, and tumoral heterogeneity by massively parallel sequencing. Clin Chem. 2013;59(1):211–224. doi: 10.1373/clinchem.2012.196014. [DOI] [PubMed] [Google Scholar]
- 7.Heitzer E, et al. Establishment of tumor-specific copy number alterations from plasma DNA of patients with cancer. Int J Cancer. 2013;133(2):346–356. doi: 10.1002/ijc.28030. [DOI] [PMC free article] [PubMed] [Google Scholar]
- 8.Heitzer E, et al. Tumor-associated copy number changes in the circulation of patients with prostate cancer identified through whole-genome sequencing. Genome Med. 2013;5(4):30. doi: 10.1186/gm434. [DOI] [PMC free article] [PubMed] [Google Scholar]
- 9.Leary RJ, et al. Detection of chromosomal alterations in the circulation of cancer patients with whole-genome sequencing. Sci Transl Med. 2012;4(162):ra154. doi: 10.1126/scitranslmed.3004742. [DOI] [PMC free article] [PubMed] [Google Scholar]
- 10.Chan KCA, et al. Noninvasive detection of cancer-associated genome-wide hypomethylation and copy number aberrations by plasma DNA bisulfite sequencing. Proc Natl Acad Sci USA. 2013;110(47):18761–18768. doi: 10.1073/pnas.1313995110. [DOI] [PMC free article] [PubMed] [Google Scholar]
- 11.Chan KCA, et al. Quantitative analysis of circulating methylated DNA as a biomarker for hepatocellular carcinoma. Clin Chem. 2008;54(9):1528–1536. doi: 10.1373/clinchem.2008.104653. [DOI] [PubMed] [Google Scholar]
- 12.Wong IH, et al. Detection of aberrant p16 methylation in the plasma and serum of liver cancer patients. Cancer Res. 1999;59(1):71–73. [PubMed] [Google Scholar]
- 13.Balgkouranidou I, et al. Breast cancer metastasis suppressor-1 promoter methylation in cell-free DNA provides prognostic information in non-small cell lung cancer. Br J Cancer. 2014;110(8):2054–2062. doi: 10.1038/bjc.2014.104. [DOI] [PMC free article] [PubMed] [Google Scholar]
- 14.Diehl F, et al. Detection and quantification of mutations in the plasma of patients with colorectal tumors. Proc Natl Acad Sci USA. 2005;102(45):16368–16373. doi: 10.1073/pnas.0507904102. [DOI] [PMC free article] [PubMed] [Google Scholar]
- 15.Yung TKF, et al. Single-molecule detection of epidermal growth factor receptor mutations in plasma by microfluidics digital PCR in non-small cell lung cancer patients. Clin Cancer Res. 2009;15(6):2076–2084. doi: 10.1158/1078-0432.CCR-08-2622. [DOI] [PubMed] [Google Scholar]
- 16.Murtaza M, et al. Non-invasive analysis of acquired resistance to cancer therapy by sequencing of plasma DNA. Nature. 2013;497(7447):108–112. doi: 10.1038/nature12065. [DOI] [PubMed] [Google Scholar]
- 17.Forshew T, et al. Noninvasive identification and monitoring of cancer mutations by targeted deep sequencing of plasma DNA. Sci Transl Med. 2012;4(136):36ra68. doi: 10.1126/scitranslmed.3003726. [DOI] [PubMed] [Google Scholar]
- 18.Lo YMD, et al. Quantitative analysis of cell-free Epstein-Barr virus DNA in plasma of patients with nasopharyngeal carcinoma. Cancer Res. 1999;59(6):1188–1191. [PubMed] [Google Scholar]
- 19.Chan KCA, et al. Early detection of nasopharyngeal carcinoma by plasma Epstein-Barr virus DNA analysis in a surveillance program. Cancer. 2013;119(10):1838–1844. doi: 10.1002/cncr.28001. [DOI] [PubMed] [Google Scholar]
- 20.McBride DJ, et al. Use of cancer-specific genomic rearrangements to quantify disease burden in plasma from patients with solid tumors. Genes Chromosomes Cancer. 2010;49(11):1062–1069. doi: 10.1002/gcc.20815. [DOI] [PMC free article] [PubMed] [Google Scholar]
- 21.Leary RJ, et al. Development of personalized tumor biomarkers using massively parallel sequencing. Sci Transl Med. 2010;2(20):20ra14. doi: 10.1126/scitranslmed.3000702. [DOI] [PMC free article] [PubMed] [Google Scholar]
- 22.Chan KCA, Leung SF, Yeung SW, Chan ATC, Lo YMD. Persistent aberrations in circulating DNA integrity after radiotherapy are associated with poor prognosis in nasopharyngeal carcinoma patients. Clin Cancer Res. 2008;14(13):4141–4145. doi: 10.1158/1078-0432.CCR-08-0182. [DOI] [PubMed] [Google Scholar]
- 23.Gao YJ, et al. Increased integrity of circulating cell-free DNA in plasma of patients with acute leukemia. Clin Chem Lab Med. 2010;48(11):1651–1656. doi: 10.1515/CCLM.2010.311. [DOI] [PubMed] [Google Scholar]
- 24.Umetani N, et al. Increased integrity of free circulating DNA in sera of patients with colorectal or periampullary cancer: Direct quantitative PCR for ALU repeats. Clin Chem. 2006;52(6):1062–1069. doi: 10.1373/clinchem.2006.068577. [DOI] [PubMed] [Google Scholar]
- 25.Wang BG, et al. Increased plasma DNA integrity in cancer patients. Cancer Res. 2003;63(14):3966–3968. [PubMed] [Google Scholar]
- 26.Umetani N, et al. Prediction of breast tumor progression by integrity of free circulating DNA in serum. J Clin Oncol. 2006;24(26):4270–4276. doi: 10.1200/JCO.2006.05.9493. [DOI] [PubMed] [Google Scholar]
- 27.Mouliere F, et al. High fragmentation characterizes tumour-derived circulating DNA. PLoS One. 2011;6(9):e23418. doi: 10.1371/journal.pone.0023418. [DOI] [PMC free article] [PubMed] [Google Scholar]
- 28.Lo YMD, et al. Maternal plasma DNA sequencing reveals the genome-wide genetic and mutational profile of the fetus. Sci Transl Med. 2010;2(61):61ra91. doi: 10.1126/scitranslmed.3001720. [DOI] [PubMed] [Google Scholar]
- 29.Zheng YWL, et al. Nonhematopoietically derived DNA is shorter than hematopoietically derived DNA in plasma: A transplantation model. Clin Chem. 2012;58(3):549–558. doi: 10.1373/clinchem.2011.169318. [DOI] [PubMed] [Google Scholar]
- 30.Yu SCY, et al. Size-based molecular diagnostics using plasma DNA for noninvasive prenatal testing. Proc Natl Acad Sci USA. 2014;111(23):8583–8588. doi: 10.1073/pnas.1406103111. [DOI] [PMC free article] [PubMed] [Google Scholar]
- 31.Pleasance ED, et al. A comprehensive catalogue of somatic mutations from a human cancer genome. Nature. 2010;463(7278):191–196. doi: 10.1038/nature08658. [DOI] [PMC free article] [PubMed] [Google Scholar]
- 32.Fujimoto A, et al. Whole-genome sequencing of liver cancers identifies etiological influences on mutation patterns and recurrent mutations in chromatin regulators. Nat Genet. 2012;44(7):760–764. doi: 10.1038/ng.2291. [DOI] [PubMed] [Google Scholar]
- 33.Tao Y, et al. Rapid growth of a hepatocellular carcinoma and the driving mutations revealed by cell-population genetic analysis of whole-genome data. Proc Natl Acad Sci USA. 2011;108(29):12042–12047. doi: 10.1073/pnas.1108715108. [DOI] [PMC free article] [PubMed] [Google Scholar]
- 34.Totoki Y, et al. High-resolution characterization of a hepatocellular carcinoma genome. Nat Genet. 2011;43(5):464–469. doi: 10.1038/ng.804. [DOI] [PubMed] [Google Scholar]
- 35.Beroukhim R, et al. The landscape of somatic copy-number alteration across human cancers. Nature. 2010;463(7283):899–905. doi: 10.1038/nature08822. [DOI] [PMC free article] [PubMed] [Google Scholar]
- 36.Chiang DY, et al. Focal gains of VEGFA and molecular classification of hepatocellular carcinoma. Cancer Res. 2008;68(16):6779–6788. doi: 10.1158/0008-5472.CAN-08-0742. [DOI] [PMC free article] [PubMed] [Google Scholar]
- 37.Kan Z, et al. Whole-genome sequencing identifies recurrent mutations in hepatocellular carcinoma. Genome Res. 2013;23(9):1422–1433. doi: 10.1101/gr.154492.113. [DOI] [PMC free article] [PubMed] [Google Scholar]
- 38.Kim TM, et al. Clinical implication of recurrent copy number alterations in hepatocellular carcinoma and putative oncogenes in recurrent gains on 1q. Int J Cancer. 2008;123(12):2808–2815. doi: 10.1002/ijc.23901. [DOI] [PMC free article] [PubMed] [Google Scholar]
- 39.Lo YMD, et al. Quantitative analysis of fetal DNA in maternal plasma and serum: Implications for noninvasive prenatal diagnosis. Am J Hum Genet. 1998;62(4):768–775. doi: 10.1086/301800. [DOI] [PMC free article] [PubMed] [Google Scholar]
- 40.Mouliere F, et al. Circulating cell-free DNA from colorectal cancer patients may reveal high KRAS or BRAF mutation load. Transl Oncol. 2013;6(3):319–328. doi: 10.1593/tlo.12445. [DOI] [PMC free article] [PubMed] [Google Scholar]
- 41.Chan KCA, et al. Molecular characterization of circulating EBV DNA in the plasma of nasopharyngeal carcinoma and lymphoma patients. Cancer Res. 2003;63(9):2028–2032. [PubMed] [Google Scholar]
- 42.Nakano H, Shinohara K. X-ray-induced cell death: Apoptosis and necrosis. Radiat Res. 1994;140(1):1–9. [PubMed] [Google Scholar]
- 43.Walker NI, Harmon BV, Gobé GC, Kerr JF. Patterns of cell death. Methods Achiev Exp Pathol. 1988;13:18–54. [PubMed] [Google Scholar]
- 44.van der Vaart M, Semenov DV, Kuligina EV, Richter VA, Pretorius PJ. Characterisation of circulating DNA by parallel tagged sequencing on the 454 platform. Clin Chim Acta. 2009;409(1-2):21–27. doi: 10.1016/j.cca.2009.08.011. [DOI] [PubMed] [Google Scholar]
- 45.Alexandrov LB, et al. Australian Pancreatic Cancer Genome Initiative; ICGC Breast Cancer Consortium; ICGC MMML-Seq Consortium; ICGC PedBrain Signatures of mutational processes in human cancer. Nature. 2013;500(7463):415–421. doi: 10.1038/nature12477. [DOI] [PMC free article] [PubMed] [Google Scholar]
- 46.Kelly RD, Mahmud A, McKenzie M, Trounce IA, St John JC. Mitochondrial DNA copy number is regulated in a tissue specific manner by DNA methylation of the nuclear-encoded DNA polymerase gamma A. Nucleic Acids Res. 2012;40(20):10124–10138. doi: 10.1093/nar/gks770. [DOI] [PMC free article] [PubMed] [Google Scholar]
- 47.Mengel-From J, et al. Mitochondrial DNA copy number in peripheral blood cells declines with age and is associated with general health among elderly. Hum Genet. 2014;133(9):1149–1159. doi: 10.1007/s00439-014-1458-9. [DOI] [PMC free article] [PubMed] [Google Scholar]
- 48.Lui YYN, et al. Predominant hematopoietic origin of cell-free DNA in plasma and serum after sex-mismatched bone marrow transplantation. Clin Chem. 2002;48(3):421–427. [PubMed] [Google Scholar]
- 49.Li R, et al. SOAP2: An improved ultrafast tool for short read alignment. Bioinformatics. 2009;25(15):1966–1967. doi: 10.1093/bioinformatics/btp336. [DOI] [PubMed] [Google Scholar]
- 50.Langmead B, Salzberg SL. Fast gapped-read alignment with Bowtie 2. Nat Methods. 2012;9(4):357–359. doi: 10.1038/nmeth.1923. [DOI] [PMC free article] [PubMed] [Google Scholar]
- 51.Chen EZ, et al. Noninvasive prenatal diagnosis of fetal trisomy 18 and trisomy 13 by maternal plasma DNA sequencing. PLoS One. 2011;6(7):e21791. doi: 10.1371/journal.pone.0021791. [DOI] [PMC free article] [PubMed] [Google Scholar]
Associated Data
This section collects any data citations, data availability statements, or supplementary materials included in this article.


