Abstract
The reaction center (RC) complex of the green sulfur bacterium Chlorobaculum tepidum is composed of the Fenna–Matthews–Olson antenna protein (FMO) and the reaction center core (RCC) complex. The RCC complex has four subunits: PscA, PscB, PscC, and PscD. We studied the FMO/RCC complex by chemically cross-linking the purified sample followed by biochemical and spectroscopic analysis. Blue-native gels showed that there were two types of FMO/RCC complexes, which are consistent with complexes with one copy of FMO per RCC and two copies of FMO per RCC. Sodium dodecyl sulfate–polyacrylamide gel electrophoresis analysis of the samples after cross-linking showed that all five subunits of the RC can be linked by three different cross-linkers: bissulfosuccinimidyl suberate, disuccinimidyl suberate, and 3,3-dithiobis-sulfosuccinimidyl propionate. The interaction sites of the cross-linked complex were also studied using liquid chromatography coupled to tandem mass spectrometry. The results indicated that FMO, PscB, PscD, and part of PscA are exposed on the cytoplasmic side of the membrane. PscD helps stabilize FMO to the reaction center and may facilitate transfer of the electron from the RC to ferredoxin. The soluble domain of the heme-containing cytochrome subunit PscC and part of the core subunit PscA are located on the periplasmic side of the membrane. There is a close relationship between the periplasmic portions of PscA and PscC, which is needed for the efficient transfer of the electron between PscC and P840.
The photosynthetic apparatus of the anoxygenic photosynthetic green sulfur bacterium Chlorobaculum (C.) tepidum consists of the reaction center core (RCC) complex, the Fenna–Matthews–Olson antenna protein (FMO) and chlorosome antenna complexes, and the menaquinol/cytochrome c oxidoreductase (cytochrome bc complex).1 The light energy collected by the chlorosome is transferred to the RCC complex through the chlorosome baseplate and FMO.1 The chlorosomes dominate the absorption spectrum of intact cells in the region of 720–750 nm. The FMO trimer contains 24 molecules of bacteriochlorophyll a (BChl a) with Qy absorption bands in the region of 790–830 nm.2−4 The RCC complex, which is embedded in the cytoplasmic membrane, contains 16 molecules of BChl a, 4 molecules of chlorophyll a (Chl a), and 2 carotenoids.1,5,6 The RCC complex in C. tepidum is an FeS-type (type I) reaction center, generally similar to the RCC complex of photosystem I (PSI) in oxygenic photosynthetic organisms. Unlike the heterodimeric PsaA/PsaB core of PSI, the RCC in C. tepidum exhibits a homodimeric core structure formed by two 82 kDa PscA proteins. The other three gene products in the RCC are the 24 kDa PscB Fe–S protein, a 23 kDa cytochrome c551 (PscC) protein, and a 17 kDa PscD protein.5 The PscA protein carries the primary donor P840 (a special pair of BChl a molecules), the primary electron acceptor A0 (Chl a 670), a possible secondary electron acceptor A1 (menaquinone), and Fe–S center X (FX).1,5,7,8 The PscB protein binds two 4Fe–4S centers called FA and FB as the terminal electron acceptors. The PscC protein, which mediates the transfer of an electron from the menaquinol/cytochrome c oxidoreductase to P840, has three membrane-spanning regions at the N-terminal end and a soluble domain that binds a single heme group at the C-terminal end on the periplasmic side of the membrane.9 The PscD subunit of RCC shows some similarities in the amino acid sequences with PsaD in PS I of plants and cyanobacteria.10 PscD is loosely bound to the RCC and is not essential for photosynthetic growth.10 In addition, the lack of the PscD subunit does not induce any serious defect in the kinetics of electron transfer reactions.10,11
Two biochemical preparations can be made of the C. tepidum reaction center consisting of FMO and RCC (FMO/RCC) or a minimal complex containing only PscA and PscC. These two preparations have been used extensively for spectroscopic and biochemical analysis, but relatively few successful structural studies have been reported.12−16 Both complexes have been studied by scanning transmission electron microscopy (STEM). STEM predicts one or two FMO copies per RCC for the FMO/RCC complex with a predicted mass of 454 kDa.15 In the STEM images containing a single FMO, there is an apparent place for a second FMO, suggesting that some FMO is lost during preparation or the possibility of two distinct populations of the FMO/RCC complex. A small knob protrudes from the RCC that is likely PscB and PscD. For PscA/PscC, STEM analysis suggests two copies of the PscA subunit and at least one copy of the PscC subunit with a mass of 248 kDa.16 High-resolution crystal structures are available for only FMO and the soluble heme-containing domain of PscC.9,17 The lack of an FMO/RCC complex crystal structure and the low-resolution nature of STEM leave significant gaps in our understanding of the subunit organization of the FMO/RCC complex.
Structural mass spectrometry provides useful tools for characterizing protein organization.18−20 Previously, our lab revealed the orientation of FMO between the baseplate and the RCC.21,22 We found that the side of FMO containing BChl a 3 contacts the cytoplasmic membrane using glycine ethyl ester (GEE) labeling.22 Additional cross-linking data using zero-length 1-ethyl-3-[3-(dimethylamino)propyl]carbodiimide (EDC) suggest that FMO directly interacts with the CsmA protein, which is located in the chlorosome baseplate.23 The combination of protein cross-linking and mass spectrometry in studies of native proteins and protein complexes has become a popular tool in structural mass spectrometry.24−28 The previous studies have demonstrated the application of protein cross-linking in studies of protein complexes in photosynthetic systems.29,30 In this paper, we purified the intact FMO/RCC complex, which is composed of FMO, PscA, PscB, PscC, and PscD subunits. The spatial interaction between FMO and the RCC was studied by chemically cross-linking the purified sample with three different cross-linkers: bissulfosuccinimidyl suberate (BS3), disuccinimidyl suberate (DSS), and 3,3-dithiobis-sulfosuccinimidyl propionate (DTSSP). The interaction sites of the cross-linked reaction center are revealed by liquid chromatography coupled to tandem mass spectrometry (LC–MS/MS). The results also indicated that FMO, PscB, PscD, and part of PscA are exposed on the cytoplasmic side of the membrane. The short distance between the soluble heme domain of PscC and PscA facilitates the transfer of an electron between PscC and P840.
Materials and Methods
Purification of the FMO/RCC Complex
Green sulfur bacterium C. tepidum strain TLS was grown anaerobically at 45 °C for 2 days. The cells were harvested by centrifugation at 8000g for 15 min. The FMO/RCC complex was purified by a method reported previously with minor modifications.31 The cells were resuspended in 20 mM Tris-HCl buffer (pH 8.0) and broken by being sonicated. The supernatant was collected after low-speed centrifugation and then ultracentrifuged at 150000g for 1 h to pellet the membranes. After being washed in 20 mM Tris-HCl buffer containing 150 mM NaCl and 1 mM EDTA, the pellet was resuspended in 20 mM Tris-HCl buffer to an OD810 of 6 cm–1; 10% DDM was added to the suspension to a final DDM concentration of 2%, and the mixture was left at 4 °C for 1.5 h. The solution was loaded onto step sucrose density gradients from 10 to 50% sucrose and ultracentrifuged at 160000g for 13 h. The dark green band from the sucrose gradient was then loaded onto a DEAE-cellulose column of with a bed volume of ∼50 mL, which was equilibrated with 20 mM Tris-HCl buffer (pH 8.0) and 0.05% DDM. The sample was eluted with a linear gradient from 0 to 1 M NaCl in the same buffer. Fractions containing both FMO and the RCC complex determined from the shoulder at 807 and 835 nm were collected and concentrated for future use.
Chemically Cross-Linked FMO/RCC Complex
The purified FMO/RCC complex as described above was washed with 20 mM phosphate buffer and cross-linked by BS3 (11.4 Å), DSS (11.4 Å), and DTSSP (12.0 Å). The mixture was incubated for 30 min at room temperature and then loaded onto the desalting column (Zeba Spin Desalting Columns, 7K molecular weight cutoff, Thermo Fisher Scientific Inc.). For BS3 and DSS, both isotopic [1:1 mixture of deuterated (d12) and nondeuterated (d0), Creative Molecules Inc.] and nonisotopic linkers are used. Sodium dodecyl sulfate–polyacrylamide gel electrophoresis (SDS–PAGE) and Blue-native gel electrophoresis were performed as described previously.32,33
LC–MS/MS and Data Analysis
The stained bands of the SDS–PAGE gel were excised and digested with trypsin. The samples were analyzed by LC–MS/MS using both a Waters Synapt G2 Q-IM-TOF instrument and a Thermo LTQ Orbitrap (Thermo Scientific, San Jose, CA) as described in the published protocol.34 The data from the Waters Synapt G2 Q-IM-TOF instrument were submitted to the ProteinLynx Global Server (version 2.5, Waters Inc., Milford, MA) to identify the peptide sequence. The data for cross-linked peptide identification obtained from a Thermo LTQ Orbitrap were analyzed with xQuest.34,35 The cross-linked peptides identified by xQuest were further manually validated.
Results and Discussion
Purification and Identification of the FMO/RCC Complex
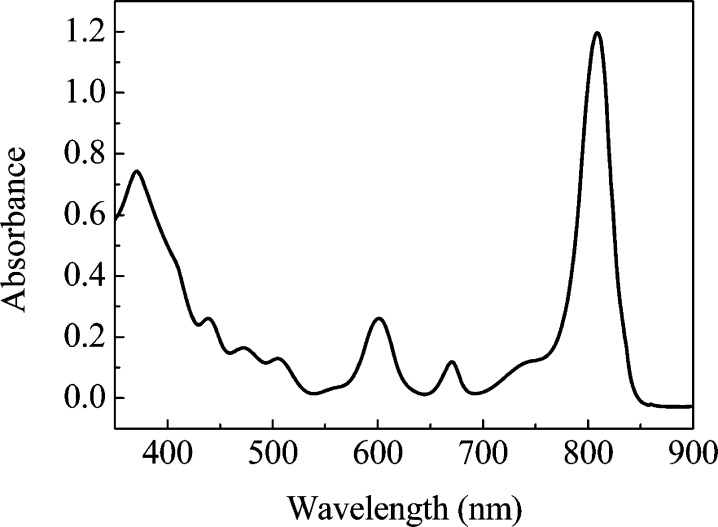
The purified FMO/RCC complex exhibits a BChl a absorption band at 809 nm with a slight shoulder at 835 nm, which is consistent with previous work, as shown in Figure 1.31 The Qx band of BChl a at 600 nm and the Qy band of Chl a at 670 nm are also observed.15
Figure 1.
Absorbance spectrum of the FMO/RCC complex.
Cross-Linking by BS3, DSS, and DTSSP
Five bands on the SDS–PAGE gel at 60, 40, 30, 19, and 16 kDa were identified as PscA, FMO, PscB, PscC, and PscD, respectively, by in-gel digestion and subsequent LC–MS/MS analysis. The purified FMO/RCC complex was cross-linked with different concentrations of BS3 as shown in Figure 2A. After being cross-linked by BS3, the complex could not be denatured by SDS buffer, which resulted in a bright band on top of the separating gel with a mass of >250 kDa. With lower concentrations of the cross-linker, some FMO/RCC complexes were not fully cross-linked, resulting in faint bands of the five subunits. The cross-linked complex was further evaluated by Blue-native gels. The faint band at 145 kDa could be assigned to some free FMO trimers in the sample. The higher-mass region showed two bands, 450 and 600 kDa. The mass difference is similar to that of an FMO trimer. The data suggest that there are two types of FMO/RCC complexes in the sample, which is consistent with the STEM data reported previously.15 The mass around 600 kDa can be explained by a complex with a 2(FMO)3(PscA)2(PscB)(PscC)2(PscD) composition with 48 molecules of BChl a in FMO, 16 molecules of BChl a, and 4 molecules of Chl a in RCC.1 The predicted mass is ∼560 kDa, which is close to the mass of 600 kDa as shown in Blue-native gels.
Figure 2.
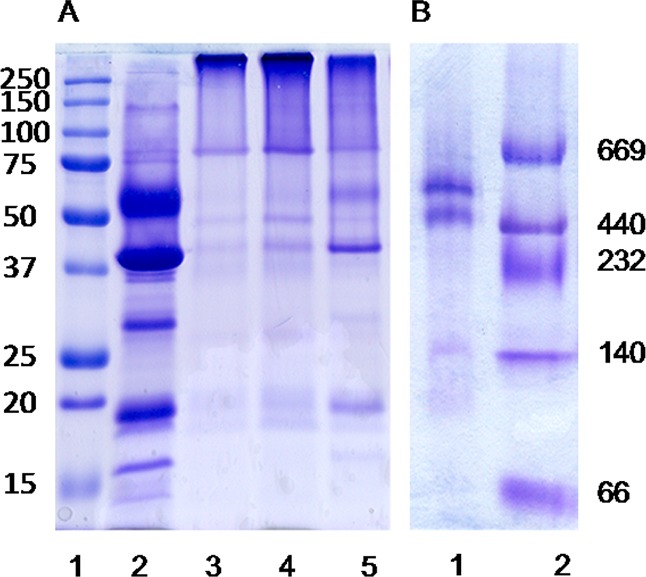
(A) SDS–PAGE of the FMO/RCC complex: markers (lane 1), non-cross-linked control sample (lane 2), and FMO/RCC complex cross-linked by different concentrations of BS3 at room temperature [lanes 3–5 (10, 5, and 0.5 mM, respectively)]. (B) Blue-native gel of the FMO/RCC complex cross-linked by 10 mM BS3 (lane 1) and markers (lane 2).
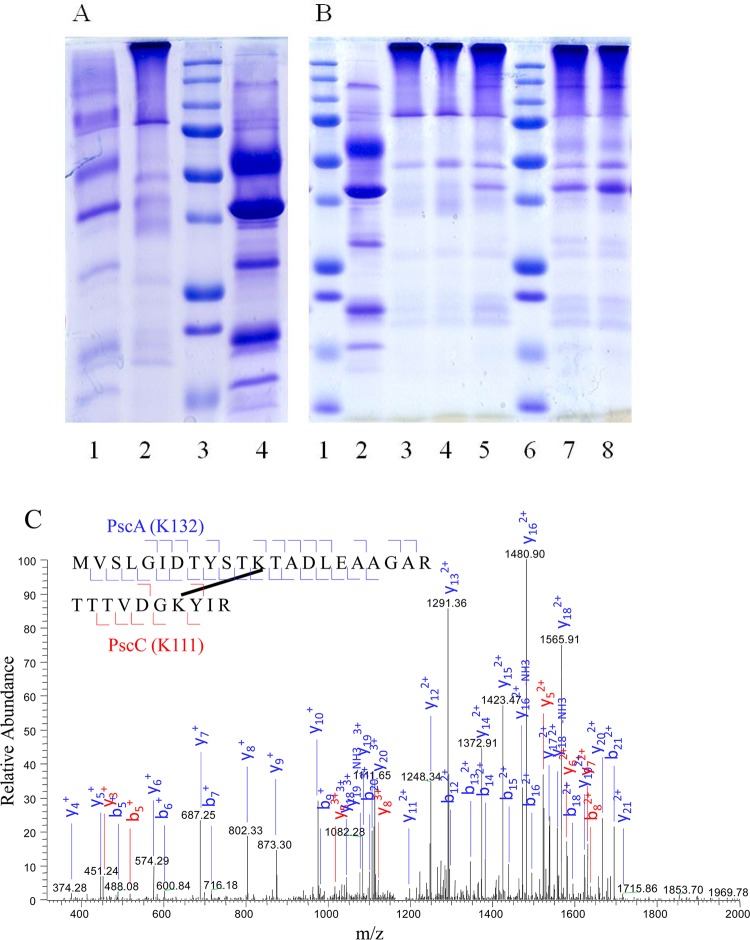
The purified complex was then cross-linked with three different cross-linkers, including DTSSP, DSS, and BS3. The disulfide (S–S) bonds in DTSSP can be broken by reducing agents such as β-mercaptoethanol. DSS is a hydrophobic cross-linker and BS3 hydrophilic, but they have the same linking length. Panels A and B of Figure 3 show the results of the cross-linking experiments. All three cross-linkers resulted in a bright band on the top of the separating gel, which was identified as the cross-linked FMO/RCC complex. In Figure 3B, very faint FMO bands are visible in lanes 7 and 8 for DSS-cross-linked samples that are absent in lanes 3 and 4 for BS3-cross-linked samples, indicating the hydrophilic cross-linker BS3 works slightly better for this experiment. Lane 5 indicates the FMO/RCC complex cross-linked with BS3 on ice, and a faint FMO band is observed like those with DSS. In Figure 3A, β-mercaptoethanol was added to DTSSP-cross-linked samples to break S–S bonds in DTSSP, giving a band pattern similar to that of the control sample. The presence of β-mercaptoethanol had no effect on BS3- and DSS-linked samples. The appearance of a bright band on top of the separating gel and the reversibility of DTSSP cross-linking (lane 1 in Figure 3A) clearly indicate that all five subunits of the FMO/RCC complex can be successfully cross-linked.
Figure 3.
Chemical cross-linking of the FMO/RCC complex by different cross-linkers (10 mM) and identification of subunit interactions by LC–MS/MS: (A) DTSSP-cross-linked sample treated with (lane 1) and without (lane 2) a reducing agent, markers (lane 3), and non-cross-linked control sample (lane 4). (B) BS3-cross-linked sample treated with (lane 3) and without (lane 4) a reducing agent and a sample cross-linked on ice and treated without a reducing agent (lane 5) and DSS-cross-linked sample treated with (lane 7) and without (lane 8) a reducing agent, markers (lanes 1 and 6), and non-cross-linked control sample (lane 2). (C) MS/MS spectrum of the interlinked peptide between PscA and PscC induced by BS3.
Structural Analysis by Chemical Cross-Linking and LC–MS/MS
The LC–MS/MS results were grouped into monolinked peptides, intralinked peptides, and interlinked peptides.27 The MS/MS spectrum in Figure 3C shows the interlink between PscA and PscC by BS3. As the cross-linker targets solvent accessible lysine side chains, all those linked peptides should be located on the solvent accessible surfaces. The number of monolinked peptides exceeds the number of intra- or interlinked peptides as monolinked peptides indicate the lysines available for cross-linking, but only a subset of the available lysines that are spatially close enough can form intra- or interlinks. As is shown in Figure S1 of the Supporting Information, the distance between intralinked lysines 93K and 247K is 18.8 Å in the crystal structure of the FMO trimer, and they may be even closer because 93K is located on the loop.
Figure 4A summarizes the interlinks between the subunits of the FMO/RCC complex. The interlinks were classified into two groups, confirmed and likely cross-links, on the basis of the quality of the MS/MS spectra, i.e., the identification of the peaks in the spectra and the sequence ion coverage of the peptide. For both of them, almost all the major peaks in the MS/MS spectra can be assigned. The cross-linked products with high-quality MS/MS spectra that meet several criteria, for instance, the sequence ions covering >70% of the sequence of the peptide, are classified as confirmed cross-links, and the confirmed cross-links were used as major constraints in establishing the structural model of the FMO/RCC complex. While cross-links with relatively lower-quality MS/MS spectra, like the ones that have sequence ions covering only ∼50% of the sequence of the peptide, are listed as likely cross-links to support our model. 79K of FMO in the middle of the FMO trimer is found to be linked with 107K of PscD and possibly 45K of PscA and 36K and 60K of PscB. Because FMO is cytoplasmic, PscB, PscD, and 45K of PscA should also be cytoplasmic. As reported previously, 93K and 215K are located on the upper exterior loops near the chlorosome.22 Our results show that 215K of FMO is linked to 46K of PscD and 93K of FMO is likely to be linked to 30K of PscD. Therefore, the C- and N-terminal lysines of PscD bind to both the top and middle side of the FMO trimer, which allows for the proper binding of FMO to the RCC complex. This is consistent with a previous report that in the PscD deletion strain, the BChl a/P840 ratio in the FMO/RCC complex is lower, suggesting that some of FMOs were partially detached from the RCC without PscD.10
Figure 4.
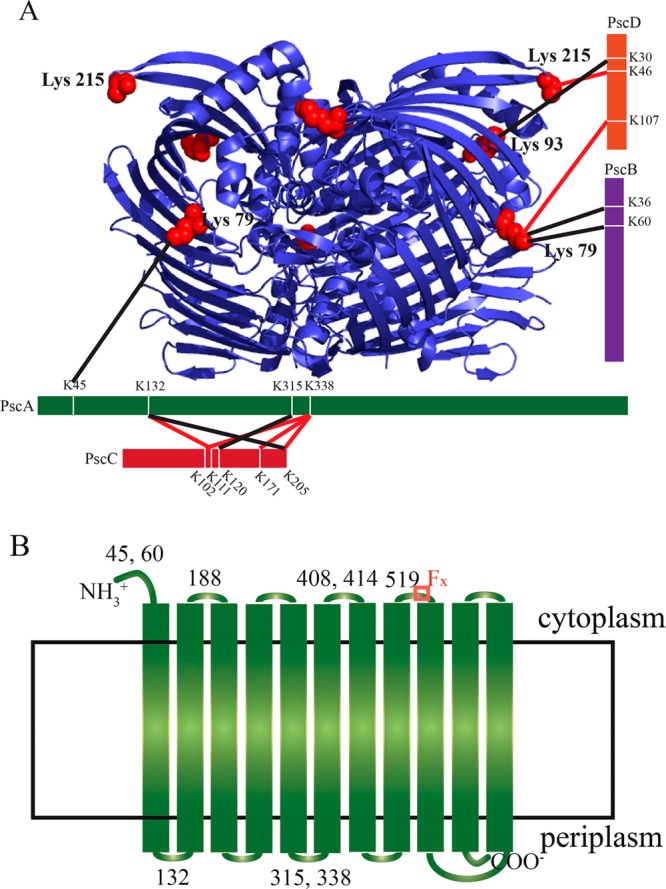
(A) Identification of the interlinks between the subunits of the FMO/RCC complex (red, confirmed; black, likely). The structure of the FMO complex is shown with the linkages to the other subunits indicated. (B) Membrane topological model of PscA with monolinked or cross-linked lysines indicated. The region of sequence that binds the FX iron–sulfur center is indicated with a red box.
Our results are also informative with respect to electron transfer within the FMO/RCC complex on both the donor and acceptor sides. 111K of PscD is a conserved lysine residue thought to be similar to lysine 106 in PsaD from PSI, which is involved in the direct interaction of Fd with the iron–sulfur protein PsaC.10 Our results indicate that 107K of PscD is linked to 79K of FMO while 36K and 60K of PscB are probably linked to the same lysine of FMO. At the same time, 107K of PscD is linked to the conserved lysine 111K of PscD (Figure S6 of the Supporting Information). Thus, those lysines should be fairly close, and it is very likely that the conserved lysine 111K of PscD is close to PscB to facilitate the transfer of an electron from RC to Fd as the role of PsaD in PSI.10
On the periplasmic side of the complex, we found several cross-links between PscA and PscC. The N-terminal domain of PscC contains three transmembrane helices, and the C-terminal, soluble heme domain is located on the periplasmic side of the membrane.9,36132K and 338K of PscA are linked to several lysines in the soluble domain of PscC. Therefore, 132K and 338K of PscA should also be located on the periplasmic side, and the soluble domain of PscC should be close to PscA. 315K of PscA is probably linked to PscC and thus is also likely to be on the periplasmic side of the membrane. The cross-link between PscA and the soluble heme binding domain of PscC is consistent with the efficient electron transfer from PscC to P840.9,36−38
A hydropathy plot prediction of possible transmembrane helices of PscA and PscC was constructed by ExPASy ProtScale (Figure S2 of the Supporting Information). Monolinks can provide further structural information based on the hydropathy plot. As shown in Table 1, nine monolinks were found from the top to bottom sides of FMO because it is a water-soluble protein. Six monolinks from the soluble domain of PscC were found, and four of them are shown in the crystal structure. Figure 4B shows the membrane topological model of PscA. As mentioned above, 45K of PscA was likely cross-linked to FMO. Monolinked 60K of PscA was found, and there should not be any transmembrane helix between the two lysines based on the hydropathy plot; thus, residues 45–60 of PscA should all be located on the cytoplasmic side of the membrane. In addition, 132K of PscA was found to be cross-linked with the soluble domain of PscC on the periplasmic side. At the same time, 188K of the PscA monolink was observed, and there should be one transmembrane helix between the two lysines based on the hydropathy plot; thus, 188K of PscA should be located on the cytoplasmic domain. Residues 315–338 of PscA should be located on the periplasmic domain as they were both linked to the soluble domain of PscC. Monolinks of 408K and 414K indicate that residues 408–414 should all be located on the same side of the membrane. Meanwhile, residues 315–338 are in the periplasmic domain, and there is one transmembrane helix between those two domains based on the hydropathy plot. Thus, residues 408–414 should be on the cytoplasmic domain. As there are two transmembrane helices between 408K and the monolinked 519K of PscA, the latter lysine should also be on the cytoplasmic domain. Furthermore, on the basis of the hydropathy plot, the region containing residues 525–536, which represents the FX binding motif FPCxGPxxGGTC, should also be on the cytoplasmic side of the membrane.39 In analogy with Photosystem I, it is anticipated that FX, FA, and FB are all on the cytoplamic side to facilitate electron transfer. Several monolinks were found on the PscD protein, such as 40K, 46K, 107K, and 111K, some of which were linked to FMO as mentioned above. It is not surprising to see that 160K of PscB was monolinked and is thus water accessible as it is close to the iron–sulfur cluster binding peptide with the CxxCxxCxxxCP motif (residues 140–151).
Table 1. Summary of the Monolinked Lysines.
| subunit | monolinked lysine residue numbersa |
|---|---|
| FMO | 56, 62, 81, 93, 151, 215, 247, 268, 319 |
| PscA | 60, 132 (P), 188, 315 (P), 338 (P), 408, 414, 519 |
| PscB | 160 |
| PscC | 102 (P), 120 (P), 146 (P), 171 (P), 180 (P), 205 (P) |
| PscD | 40, 46, 107, 111 |
P indicates the periplasmic side of the membrane.
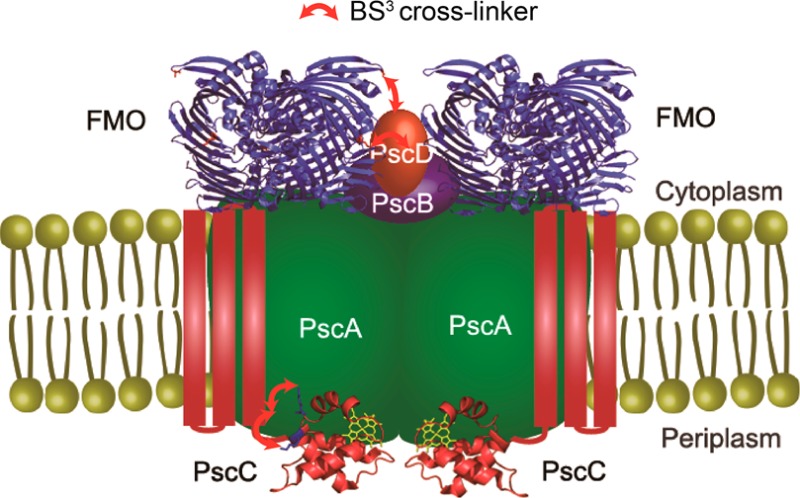
We propose a structural model of the FMO/RCC complex as shown in Figure 5. The crystal structure of FMO from Protein Data Bank entry 3ENI and the PscC soluble domain from Protein Data Bank entry 3A9F were used. The interlinks between the FMO trimer and the PscD protein indicate that both are located on the cytoplasmic domain. Monolinks of PscA and the interlinks between PscA and the soluble domain of PscC showed that PscA is a membrane protein composed of transmembrane helices (probably 11) and the periplasmic domain is very close to the soluble domain of PscC. The likely cross-linking between PscA and FMO indicated that FMO is close to the cytoplasmic domain of the PscA. The likely cross-linkings of PscB and FMO mean that PscB is spatially close to the FMO trimer, and thus FMO, PscB, and PscD should all sit on PscA. The STEM dark field images reported previously showed a knob protruding from the RCC.15 Our results suggest that PscB and PscD should be the knob sitting on PscA. In addition, the iron–sulfur cluster binding domain of PscB should be water accessible, and PscD should be close to the chlorosomal side of the FMO trimer.
Figure 5.
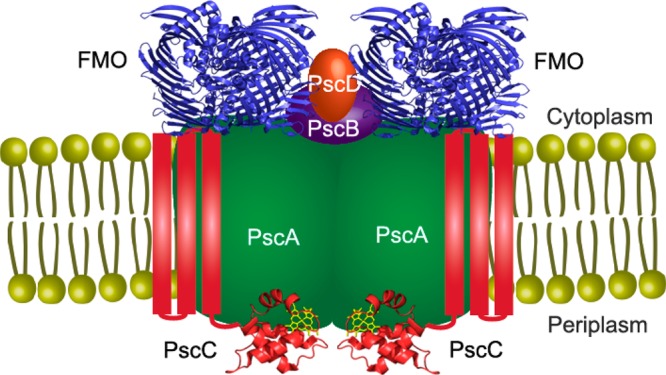
Proposed structural model of the FMO/RCC complex.
Conclusions
The spatial interaction between FMO and RCC was studied by chemically cross-linking the purified FMO/RCC sample. All the subunits of RC can be linked together by BS3, DSS, and DTSSP. The interaction sites of the cross-linked complex were studied using LC–MS/MS. The results showed a short spatial distance between FMO and the RCC. The PscD subunit is thought to stabilize FMO to the RCC complex and facilitate the transfer of an electron from the RCC to Fd. The short distance of the soluble domain of PscC and PscA explains the efficient electron transfer between PscC and P840. A structural model of the FMO/RCC complex consistent with these results is proposed.
Acknowledgments
We thank Dr. Haijun Liu for discussion.
Supporting Information Available
Hydropathy plots and the crystal structures with labeled monolinked lysines, as well as the LC–MS/MS spectra. This material is available free of charge via the Internet at http://pubs.acs.org.
The research was supported by the Photosynthetic Antenna Research Center (PARC), an Energy Frontier Research Center funded by the U.S. Department of Energy (DOE), Office of Basic Energy Science (Grant DE-SC 0001035 to R.E.B.), and the National Institute of General Medical Sciences of the National Institutes of Health (NIH) (Grant 8 P41 GM103422-35 to M. L. Gross). G.H. was funded by the DOE grant. H.Z. was funded equally by the DOE and NIH grants. J.D.K. was supported by a Monsanto Graduate Fellowship. Instrumentation was made available from both the DOE and NIH grants.
The authors declare no competing financial interest.
Funding Statement
National Institutes of Health, United States
Supplementary Material
References
- Hauska G.; Schoedl T.; Remigy H.; Tsiotis G. (2001) The reaction center of green sulfur bacteria. Biochim. Biophys. Acta 1507, 260–277. [DOI] [PubMed] [Google Scholar]
- Busch M. S. A.; Mueh F.; Madjet M. E.-A.; Renger T. (2011) The Eighth Bacteriochlorophyll Completes the Excitation Energy Funnel in the FMO Protein. J. Phys. Chem. Lett. 2, 93–98. [DOI] [PubMed] [Google Scholar]
- Wen J.; Zhang H.; Gross M. L.; Blankenship R. E. (2011) Native Electrospray Mass Spectrometry Reveals the Nature and Stoichiometry of Pigments in the FMO Photosynthetic Antenna Protein. Biochemistry 50, 3502–3511. [DOI] [PMC free article] [PubMed] [Google Scholar]
- Tronrud D. E.; Wen J.; Gay L.; Blankenship R. E. (2009) The structural basis for the difference in absorbance spectra for the FMO antenna protein from various green sulfur bacteria. Photosynth. Res. 100, 79–87. [DOI] [PubMed] [Google Scholar]
- Permentier H. P.; Schmidt K. A.; Kobayashi M.; Akiyama M.; Hager-Braun C.; Neerken S.; Miller M.; Amesz J. (2000) Composition and optical properties of reaction centre core complexes from the green sulfur bacteria Prosthecochloris aestuarii and Chlorobium tepidum. Photosynth. Res. 64, 27–39. [DOI] [PubMed] [Google Scholar]
- Griesbeck C.; Hager-Braun C.; Rogl H.; Hauska G. (1998) Quantitation of P840 reaction center preparations from Chlorobium tepidum: Chlorophylls and FMO-protein. Biochim. Biophys. Acta 1365, 285–293. [Google Scholar]
- Kjaer B.; Frigaard N. U.; Yang F.; Zybailov B.; Miller M.; Golbeck J. H.; Scheller H. V. (1998) Menaquinone-7 in the reaction center complex of the green sulfur bacterium Chlorobium vibrioforme functions as the electron acceptor A1. Biochemistry 37, 3237–3242. [DOI] [PubMed] [Google Scholar]
- Kobayashi M.; Oh-oka H.; Akutsu S.; Akiyama M.; Tominaga K.; Kise H.; Nishida F.; Watanabe T.; Amesz J.; Koizumi M.; Ishida N.; Kano H. (2000) The primary electron acceptor of green sulfur bacteria, bacteriochlorophyll 663, is chlorophyll a esterified with Delta 2,6-phytadienol. Photosynth. Res. 63, 269–280. [DOI] [PubMed] [Google Scholar]
- Hirano Y.; Higuchi M.; Azai C.; Oh-oka H.; Miki K.; Wang Z.-Y. (2010) Crystal Structure of the Electron Carrier Domain of the Reaction Center Cytochrome c(z) Subunit from Green Photosynthetic Bacterium Chlorobium tepidum. J. Mol. Biol. 397, 1175–1187. [DOI] [PubMed] [Google Scholar]
- Tsukatani Y.; Miyamoto R.; Itoh S.; Oh-oka H. (2004) Function of a PscD subunit in a homodimeric reaction center complex of the photosynthetic green sulfur bacterium Chlorobium tepidum studied by insertional gene inactivation: Regulation of energy transfer and ferredoxin-mediated NADP+ reduction on the cytoplasmic side. J. Biol. Chem. 279, 51122–51130. [DOI] [PubMed] [Google Scholar]
- Azai C.; Kim K.; Kondo T.; Harada J.; Itoh S.; Oh-oka H. (2011) A heterogeneous tag-attachment to the homodimeric type 1 photosynthetic reaction center core protein in the green sulfur bacterium Chlorobaculum tepidum. Biochim. Biophys. Acta 1807, 803–812. [DOI] [PubMed] [Google Scholar]
- Oh-oka H.; Kakutani S.; Kamei S.; Matsubara H.; Iwaki M.; Itoh S. (1995) Highly purified photosynthetic reaction-center (Psca/Cytochrome c551)2 complex of the green sulfur bacterium Chlorobium limicola. Biochemistry 34, 13091–13097. [DOI] [PubMed] [Google Scholar]
- Neerken S.; Permentier H. P.; Francke C.; Aartsma T. J.; Amesz J. (1998) Excited states and trapping in reaction center complexes of the green sulfur bacterium Prosthecochloris aestuarii. Biochemistry 37, 10792–10797. [DOI] [PubMed] [Google Scholar]
- Oh-oka H.; Kamei S.; Matsubara H.; Lin S.; van Noort P. I.; Blankenship R. E. (1998) Transient absorption spectroscopy of energy-transfer and trapping processes in the reaction center complex of Chlorobium tepidum. J. Phys. Chem. B 102, 8190–8195. [Google Scholar]
- Remigy H. W.; Stahlberg H.; Fotiadis D.; Muller S. A.; Wolpensinger B.; Engel A.; Hauska G.; Tsiotis G. (1999) The reaction center complex from the green sulfur bacterium Chlorobium tepidum: A structural analysis by scanning transmission electron microscopy. J. Mol. Biol. 290, 851–858. [DOI] [PubMed] [Google Scholar]
- Tsiotis G.; Hager-Braun C.; Wolpensinger B.; Engel A.; Hauska G. (1997) Structural analysis of the photosynthetic reaction center from the green sulfur bacterium Chlorobium tepidum. Biochim. Biophys. Acta 1322, 163–172. [Google Scholar]
- Camara-Artigas A.; Blankenship R. E.; Allen J. P. (2003) The structure of the FMO protein from Chlorobium tepidum at 2.2 Å resolution. Photosynth. Res. 75, 49–55. [DOI] [PubMed] [Google Scholar]
- Benesch J. L. P.; Ruotolo B. T. (2011) Mass spectrometry: An approach come-of-age for structural and dynamical biology. Curr. Opin. Struct. Biol. 21, 641–649. [DOI] [PMC free article] [PubMed] [Google Scholar]
- Walzthoeni T.; Leitner A.; Stengel F.; Aebersold R. (2013) Mass spectrometry supported determination of protein complex structure. Curr. Opin. Struct. Biol. 23, 252–260. [DOI] [PubMed] [Google Scholar]
- Politis A.; Stengel F.; Hall Z.; Hernandez H.; Leitner A.; Walzthoeni T.; Robinson C. V.; Aebersold R. (2014) A mass spectrometry-based hybrid method for structural modeling of protein complexes. Nat. Methods 11, 403–406. [DOI] [PMC free article] [PubMed] [Google Scholar]
- Huang R. Y. C.; Wen J.; Blankenship R. E.; Gross M. L. (2012) Hydrogen-deuterium exchange mass spectrometry reveals the interaction of Fenna-Matthews-Olson protein and chlorosome CsmA protein. Biochemistry 51, 187–193. [DOI] [PMC free article] [PubMed] [Google Scholar]
- Wen J.; Zhang H.; Gross M. L.; Blankenship R. E. (2009) Membrane orientation of the FMO antenna protein from Chlorobaculum tepidum as determined by mass spectrometry-based footprinting. Proc. Natl. Acad. Sci. U.S.A. 106, 6134–6139. [DOI] [PMC free article] [PubMed] [Google Scholar]
- Li H.; Frigaard N. U.; Bryant D. A. (2006) Molecular contacts for chlorosome envelope proteins revealed by cross-linking studies with chlorosomes from Chlorobium tepidum. Biochemistry 45, 9095–9103. [DOI] [PubMed] [Google Scholar]
- Sinz A. (2006) Chemical cross-linking and mass spectrometry to map three-dimensional protein structures and protein-protein interactions. Mass Spectrom. Rev. 25, 663–682. [DOI] [PubMed] [Google Scholar]
- Lee Y. J. (2008) Mass spectrometric analysis of cross-linking sites for the structure of proteins and protein complexes. Mol. BioSyst. 4, 816–823. [DOI] [PubMed] [Google Scholar]
- Tang X.; Bruce J. E. (2009) Chemical cross-linking for protein-protein interaction studies. Methods Mol. Biol. 492, 283–293. [DOI] [PubMed] [Google Scholar]
- Leitner A.; Walzthoeni T.; Kahraman A.; Herzog F.; Rinner O.; Beck M.; Aebersold R. (2010) Probing native protein structures by chemical cross-linking, mass spectrometry, and bioinformatics. Mol. Cell. Proteomics 9, 1634–1649. [DOI] [PMC free article] [PubMed] [Google Scholar]
- Petrotchenko E. V.; Borchers C. H. (2010) Crosslinking combined with mass spectrometry for structural proteomics. Mass Spectrom. Rev. 29, 862–876. [DOI] [PubMed] [Google Scholar]
- Liu H.; Huang R. Y. C.; Chen J.; Gross M. L.; Pakrasi H. B. (2011) Psb27, a transiently associated protein, binds to the chlorophyll binding protein CP43 in photosystem II assembly intermediates. Proc. Natl. Acad. Sci. U.S.A. 108, 18536–18541. [DOI] [PMC free article] [PubMed] [Google Scholar]
- Liu H.; Zhang H.; Weisz D. A.; Vidavsky I.; Gross M. L.; Pakrasi H. B. (2014) MS-based cross-linking analysis reveals the location of the PsbQ protein in cyanobacterial photosystem II. Proc. Natl. Acad. Sci. U.S.A. 111, 4638–4643. [DOI] [PMC free article] [PubMed] [Google Scholar]
- Hagerbraun C.; Xie D. L.; Jarosch U.; Herold E.; Buttner M.; Zimmermann R.; Deutzmann R.; Hauska G.; Nelson N. (1995) Stable photobleaching of P840 in Chlorobium reaction-center preparations: Presence of the 42-kDa bacteriochlorophyll a-protein and a 17-kDa polypeptide. Biochemistry 34, 9617–9624. [DOI] [PubMed] [Google Scholar]
- Schagger H.; Vonjagow G. (1991) Blue native electrophoresis for isolation of membrane-protein complexes in enzymatically active form. Anal. Biochem. 199, 223–231. [DOI] [PubMed] [Google Scholar]
- Schaegger H. (2006) Tricine-SDS-PAGE. Nat. Protoc. 1, 16–22. [DOI] [PubMed] [Google Scholar]
- Liu H.; Zhang H.; Niedzwiedzki D. M.; Prado M.; He G.; Gross M. L.; Blankenship R. E. (2013) Phycobilisomes Supply Excitations to Both Photosystems in a Megacomplex in Cyanobacteria. Science 342, 1104–1107. [DOI] [PMC free article] [PubMed] [Google Scholar]
- Walzthoeni T.; Claassen M.; Leitner A.; Herzog F.; Bohn S.; Forster F.; Beck M.; Aebersold R. (2012) False discovery rate estimation for cross-linked peptides identified by mass spectrometry. Nat. Methods 9, 901–903. [DOI] [PubMed] [Google Scholar]
- Oh-oka H.; Iwaki M.; Itoh S. (1997) Viscosity dependence of the electron transfer rate from bound cytochrome c to P840 in the photosynthetic reaction center of the green sulfur bacterium Chlorobium tepidum. Biochemistry 36, 9267–9272. [DOI] [PubMed] [Google Scholar]
- Oh-oka H.; Kamei S.; Matsubara H.; Iwaki M.; Itoh S. (1995) Two molecules of cytochrome c function as the electron-donors to p840 in the reaction-center complex isolated from a green sulfur bacterium, Chlorobium tepidum. FEBS Lett. 365, 30–34. [DOI] [PubMed] [Google Scholar]
- Tsukatani Y.; Azai C.; Kondo T.; Itoh S.; Oh-oka H. (2008) Parallel electron donation pathways to cytochrome c(z) in the type I homodimeric photosynthetic reaction center complex of Chlorobium tepidum. Biochim. Biophys. Acta 1777, 1211–1217. [DOI] [PubMed] [Google Scholar]
- Romberger S. P.; Golbeck J. H. (2010) The bound iron-sulfur clusters of type-I homodimeric reaction centers. Photosynth. Res. 104, 333–346. [DOI] [PubMed] [Google Scholar]
Associated Data
This section collects any data citations, data availability statements, or supplementary materials included in this article.


